

R3N 1
635 ໂພສ

R3N 1
ລາຍງານ
ບລັອກຜູ້ໃຊ້
Web3 & crypto Analyst || Breaking down market moves || token updates daily ➪NFA!!!
0 ກໍາລັງຕິດຕາມ
3 ຜູ້ຕິດຕາມ
4 Liked
ໂພສ
·
--
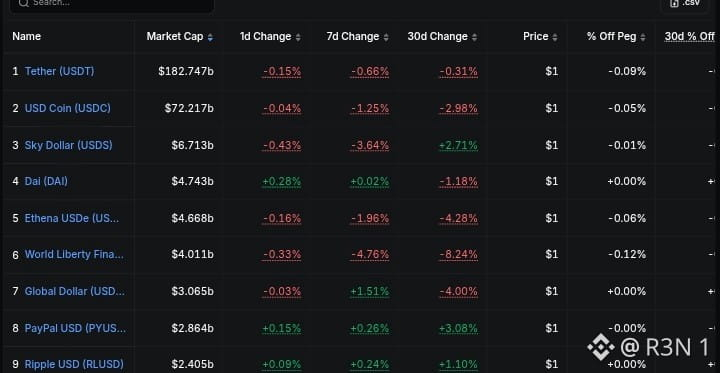
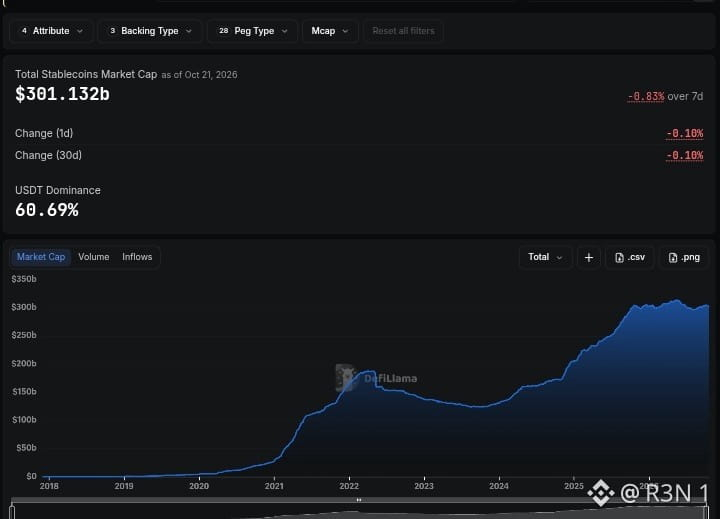
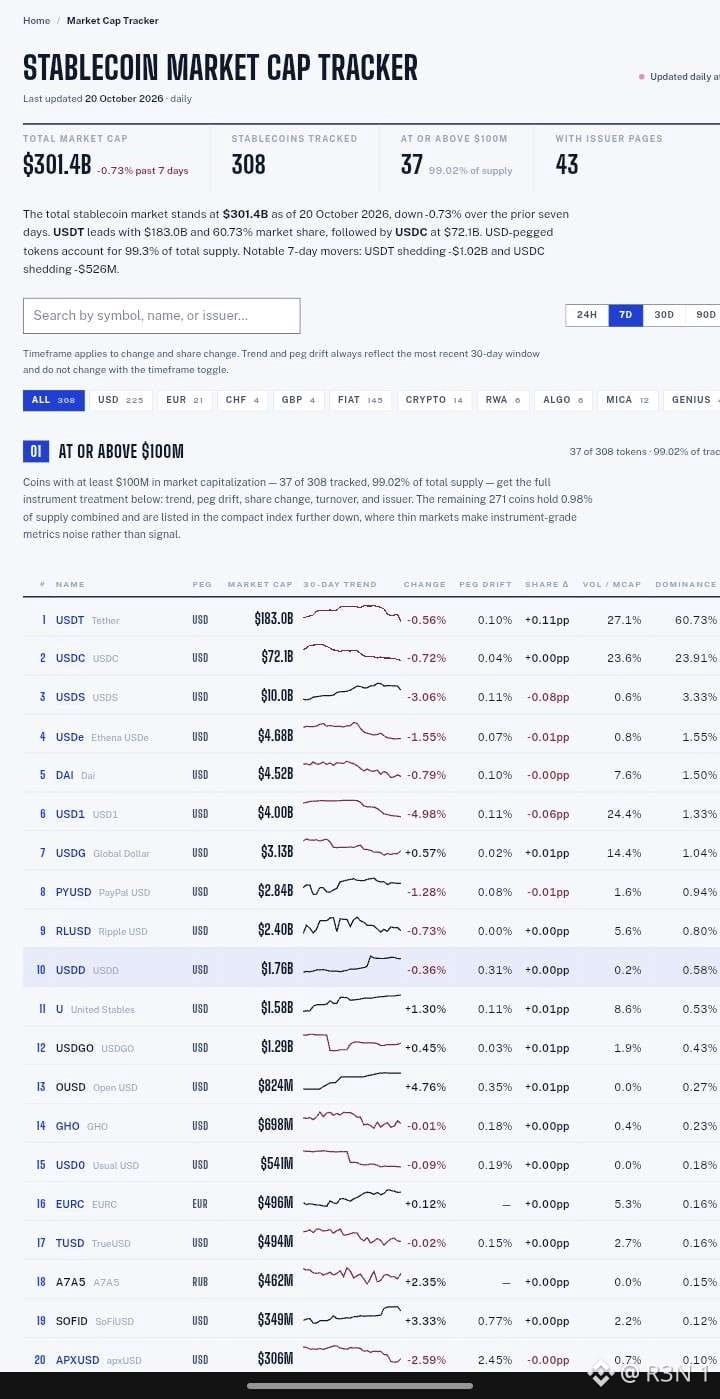
$301 billion. Two names. 84.7% of the entire stablecoin market.
That's where we are in October 2026 — and the numbers this week are telling a story most people are sleeping on.
Tether's USDT shed nearly $1 billion in five days this week. Exchange balances across 19 major platforms fell $4.6 billion between July and October 1. The capital didn't leave crypto. It rotated — specifically away from Tether and into USDC and RLUSD. That distinction matters more than most people realize.
USDT still leads at $183B and 60.71% dominance.
That position isn't collapsing. But for the first time since the FTX crisis in 2022 USDT posted back to back monthly supply declines while USDC grew 72% year over year. Market cap measures stored money. Transaction volume measures moving money. USDC out-transacted USDT $2.55 trillion to $1.49 trillion year to date — meaning the smaller stablecoin is moving faster and being used more actively for payments and settlements.
Then came September 30. Visa, Mastercard, Stripe, Coinbase, BlackRock and over 140 companies launched OUSD — Open USD — with $1 billion in committed liquidity and a profit sharing model that gives every partner a financial incentive to route volume through it instead of USDC. Three weeks in and OUSD already shows 4.5% supply growth and 10.73% seven day growth according to DefiLlama data as of October 15.
The stablecoin market has never looked more lopsided — and never been more contested at the same time.
USDT owns the stored money race. USDC is winning the moving money race. OUSD just entered with the most powerful corporate backing in payment history. And no other stablecoin has broken the $5 billion mark — the cliff after the top two is that steep.
This is Part 1 of the Stablecoin Wars series. Part 2 covers which stablecoin survives a regulatory crackdown — and the answer might surprise you.
— R3N | @R3N_Research
$BTC #USDC #BTC Price Analysis# $ETH
$301 billion. Two names. 84.7% of the entire stablecoin market.
That's where we are in October 2026 — and the numbers this week are telling a story most people are sleeping on.
Tether's USDT shed nearly $1 billion in five days this week. Exchange balances across 19 major platforms fell $4.6 billion between July and October 1. The capital didn't leave crypto. It rotated — specifically away from Tether and into USDC and RLUSD. That distinction matters more than most people realize.
USDT still leads at $183B and 60.71% dominance.
That position isn't collapsing. But for the first time since the FTX crisis in 2022 USDT posted back to back monthly supply declines while USDC grew 72% year over year. Market cap measures stored money. Transaction volume measures moving money. USDC out-transacted USDT $2.55 trillion to $1.49 trillion year to date — meaning the smaller stablecoin is moving faster and being used more actively for payments and settlements.
Then came September 30. Visa, Mastercard, Stripe, Coinbase, BlackRock and over 140 companies launched OUSD — Open USD — with $1 billion in committed liquidity and a profit sharing model that gives every partner a financial incentive to route volume through it instead of USDC. Three weeks in and OUSD already shows 4.5% supply growth and 10.73% seven day growth according to DefiLlama data as of October 15.
The stablecoin market has never looked more lopsided — and never been more contested at the same time.
USDT owns the stored money race. USDC is winning the moving money race. OUSD just entered with the most powerful corporate backing in payment history. And no other stablecoin has broken the $5 billion mark — the cliff after the top two is that steep.
This is Part 1 of the Stablecoin Wars series. Part 2 covers which stablecoin survives a regulatory crackdown — and the answer might surprise you.
— R3N | @R3N_Research
$BTC #USDC #BTC Price Analysis# $ETH
That's where we are in October 2026 — and the numbers this week are telling a story most people are sleeping on.
Tether's USDT shed nearly $1 billion in five days this week. Exchange balances across 19 major platforms fell $4.6 billion between July and October 1. The capital didn't leave crypto. It rotated — specifically away from Tether and into USDC and RLUSD. That distinction matters more than most people realize.
USDT still leads at $183B and 60.71% dominance.
That position isn't collapsing. But for the first time since the FTX crisis in 2022 USDT posted back to back monthly supply declines while USDC grew 72% year over year. Market cap measures stored money. Transaction volume measures moving money. USDC out-transacted USDT $2.55 trillion to $1.49 trillion year to date — meaning the smaller stablecoin is moving faster and being used more actively for payments and settlements.
Then came September 30. Visa, Mastercard, Stripe, Coinbase, BlackRock and over 140 companies launched OUSD — Open USD — with $1 billion in committed liquidity and a profit sharing model that gives every partner a financial incentive to route volume through it instead of USDC. Three weeks in and OUSD already shows 4.5% supply growth and 10.73% seven day growth according to DefiLlama data as of October 15.
The stablecoin market has never looked more lopsided — and never been more contested at the same time.
USDT owns the stored money race. USDC is winning the moving money race. OUSD just entered with the most powerful corporate backing in payment history. And no other stablecoin has broken the $5 billion mark — the cliff after the top two is that steep.
This is Part 1 of the Stablecoin Wars series. Part 2 covers which stablecoin survives a regulatory crackdown — and the answer might surprise you.
— R3N | @R3N_Research
$BTC #USDC #BTC Price Analysis# $ETH
53
·
--
Satsuma sold all 669 $BTC in late July and delisted, Bitdeer took its treasury to zero in February, and Genius Group liquidated while Vaultz dropped its treasury policy. Others sold in part, like MARA, which sold 15,133 BTC in March to buy back about $1B of convertible notes, and Empery, which sold almost half its coins. What stands out to me is the motive and the timing. The reasons cited are debt repayment, buybacks, operating cash and AI data center spending, not a view on bitcoin’s price. Most of the sales came between February and August, when BTC was far lower. Satsuma’s shares fell about 97% before holders voted to wind it up, so a company with debt due had little choice. Scale matters too. Public companies reportedly held about 1.16M BTC earlier this year, so Satsuma’s 669 BTC is roughly 0.06% of that. Strategy, the original model, still holds more than 840,000 BTC after selling a small fraction, and it bought another 250 BTC on October 12. The counter-argument is the one that matters. These buyers were a real source of demand in 2025, and if the marginal corporate buyer has gone, that bid doesn’t come back easily. Treasury holdings were worth over $100B in October, up from about $80B in September, which gives weaker firms room to sell into strength. A report this week flagged $82M of MARA deposits to exchanges. I’d watch who has convertible debt coming due, and whether treasury stocks still trade below the value of their bitcoin. #BTC Price Analysis# $BTC #Bitcoin Price Prediction: What is Bitcoins next move?#
Satsuma sold all 669 $BTC in late July and delisted, Bitdeer took its treasury to zero in February, and Genius Group liquidated while Vaultz dropped its treasury policy. Others sold in part, like MARA, which sold 15,133 BTC in March to buy back about $1B of convertible notes, and Empery, which sold almost half its coins. What stands out to me is the motive and the timing. The reasons cited are debt repayment, buybacks, operating cash and AI data center spending, not a view on bitcoin’s price. Most of the sales came between February and August, when BTC was far lower. Satsuma’s shares fell about 97% before holders voted to wind it up, so a company with debt due had little choice. Scale matters too. Public companies reportedly held about 1.16M BTC earlier this year, so Satsuma’s 669 BTC is roughly 0.06% of that. Strategy, the original model, still holds more than 840,000 BTC after selling a small fraction, and it bought another 250 BTC on October 12. The counter-argument is the one that matters. These buyers were a real source of demand in 2025, and if the marginal corporate buyer has gone, that bid doesn’t come back easily. Treasury holdings were worth over $100B in October, up from about $80B in September, which gives weaker firms room to sell into strength. A report this week flagged $82M of MARA deposits to exchanges. I’d watch who has convertible debt coming due, and whether treasury stocks still trade below the value of their bitcoin. #BTC Price Analysis# $BTC #Bitcoin Price Prediction: What is Bitcoins next move?#
77
·
--
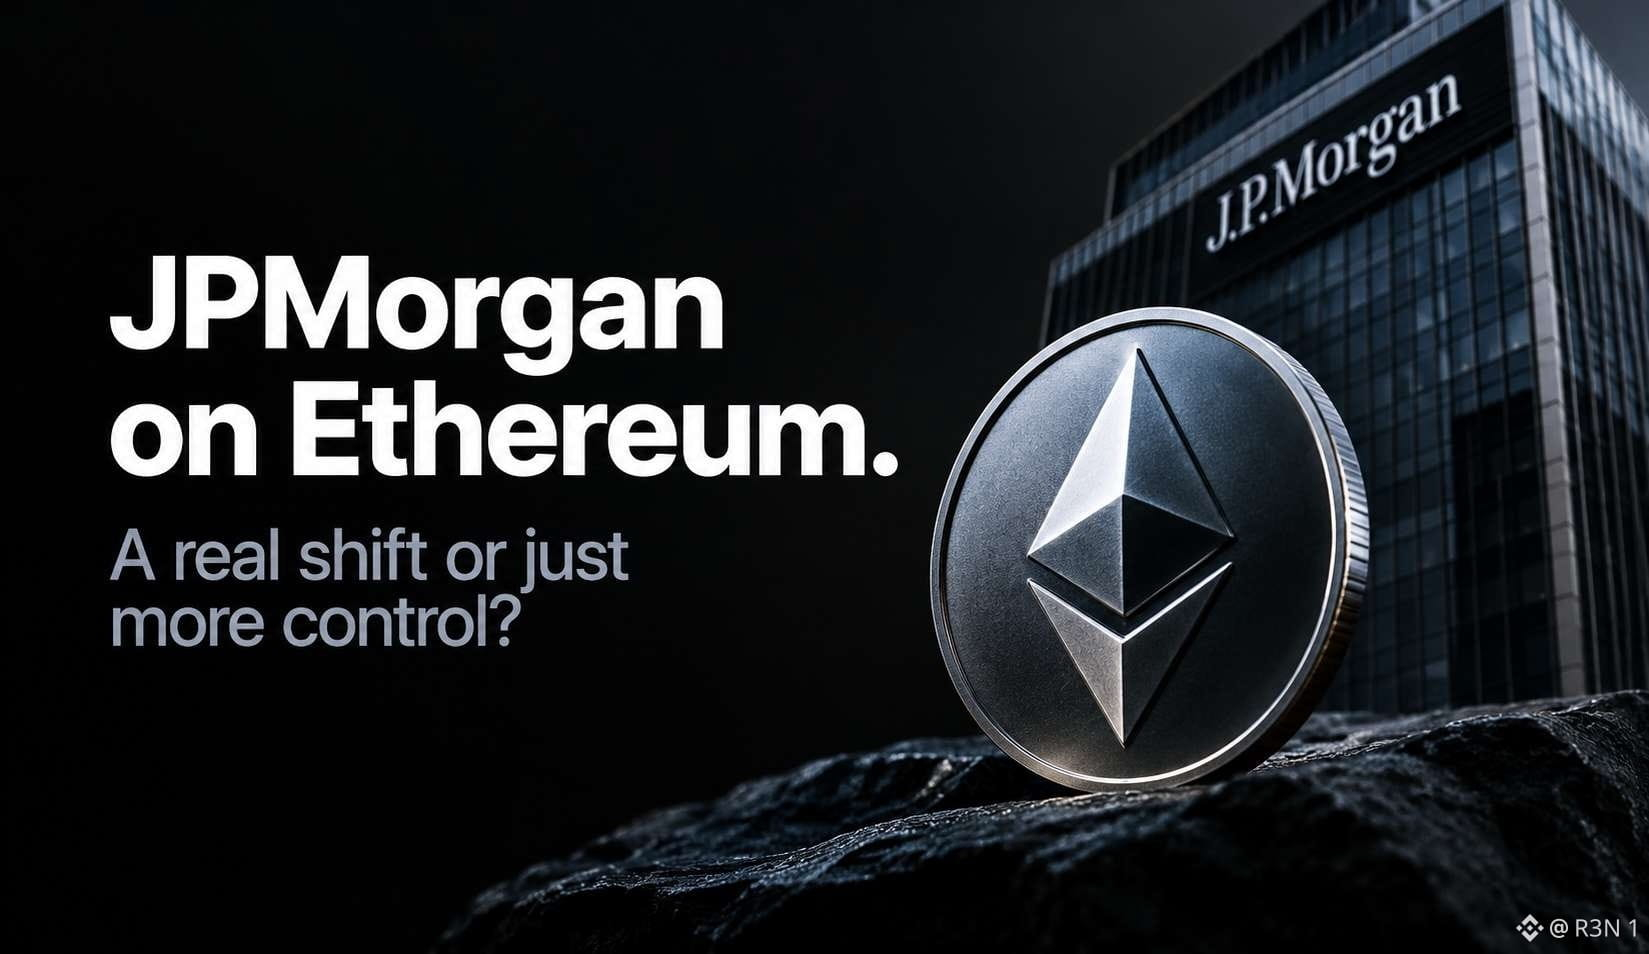
JPM Coin, ticker JPMD, is a tokenized dollar deposit at JPMorgan, live on Ethereum mainnet as of October 19, a year after its Base debut. It's issued only to approved institutional clients through Kinexys, the bank's blockchain unit, and isn't open to retail. It's a claim on a bank, not a permissionless stablecoin.
For the network, the signal is real. Kinexys justified the move with so the direct demand is small. Unless JPMD volume gets large, this is a narrative tailwind, not a fee story. ETH is up about 1% on the day, while ETH ETFs lost roughly $320M last week.
What stands out to me is how much is undisclosed. JPMorgan hasn't said how many clients will use mainnet, how much JPMD will be issued, or published a contract address. Kinexys says it has processed trillions of dollars, but that's the whole platform, not Ethereum mainnet.
The counter-argument is that JPMorgan isn't loyal to one chain. A Canton integration is still planned, and the bank frames this as interoperability. The beneficiary may be whichever network holds the assets clients want to settle against.
I'd watch for the first named clients, disclosed mainnet issuance, and whether Kinexys volume actually shifts on-chain.
$ETH #BTC Price Analysis# #Meme Alpha#
JPM Coin, ticker JPMD, is a tokenized dollar deposit at JPMorgan, live on Ethereum mainnet as of October 19, a year after its Base debut. It's issued only to approved institutional clients through Kinexys, the bank's blockchain unit, and isn't open to retail. It's a claim on a bank, not a permissionless stablecoin.
For the network, the signal is real. Kinexys justified the move with so the direct demand is small. Unless JPMD volume gets large, this is a narrative tailwind, not a fee story. ETH is up about 1% on the day, while ETH ETFs lost roughly $320M last week.
What stands out to me is how much is undisclosed. JPMorgan hasn't said how many clients will use mainnet, how much JPMD will be issued, or published a contract address. Kinexys says it has processed trillions of dollars, but that's the whole platform, not Ethereum mainnet.
The counter-argument is that JPMorgan isn't loyal to one chain. A Canton integration is still planned, and the bank frames this as interoperability. The beneficiary may be whichever network holds the assets clients want to settle against.
I'd watch for the first named clients, disclosed mainnet issuance, and whether Kinexys volume actually shifts on-chain.
$ETH #BTC Price Analysis# #Meme Alpha#
For the network, the signal is real. Kinexys justified the move with so the direct demand is small. Unless JPMD volume gets large, this is a narrative tailwind, not a fee story. ETH is up about 1% on the day, while ETH ETFs lost roughly $320M last week.
What stands out to me is how much is undisclosed. JPMorgan hasn't said how many clients will use mainnet, how much JPMD will be issued, or published a contract address. Kinexys says it has processed trillions of dollars, but that's the whole platform, not Ethereum mainnet.
The counter-argument is that JPMorgan isn't loyal to one chain. A Canton integration is still planned, and the bank frames this as interoperability. The beneficiary may be whichever network holds the assets clients want to settle against.
I'd watch for the first named clients, disclosed mainnet issuance, and whether Kinexys volume actually shifts on-chain.
$ETH #BTC Price Analysis# #Meme Alpha#
50
·
--
US spot ETFs lost about $229M in BTC, $320M in ETH, $25.5M in SOL and $1.8M in XRP for October 12 to 16. Bitcoin's total is shaped by one session. October 14, the day hot CPI printed, saw $261M leave, more than the whole week's net, after $176M of inflows the day before. IBIT made up about 72% of the week's BTC outflow.
Ethereum looks different. Its funds have logged one positive session since mid-September, this was the third losing week in a row, and 93% of the weekly outflow came from one fund, BlackRock's. October 16 was the 11th outflow day of the month for both ETH and SOL funds, versus the sixth for BTC.
What stands out to me is the scale. $229M is about 0.2% of the roughly $104B Bitcoin ETFs hold, so this is trimming, not an exit. It isn't a rotation either, since all four categories lost money.
My read is that macro explains Bitcoin, while ETH has its own problem. Hotter inflation and the October 28 Fed meeting weigh on everything, and BTC flows reacted on the CPI day. ETH has bled through quiet days too, which looks less like a headline reaction and more like allocators losing interest.
The counter-argument is that concentration cuts both ways. If one fund drives most of ETH's outflow, a single large allocator could explain it, and that could stop as quickly as it started.
I'd watch two things: whether Bitcoin flows turn positive after October 28, and whether ETH's outflow days keep stacking when there's no macro headline.
$BTC #BTC Price Analysis# #Meme Alpha# $ETH
US spot ETFs lost about $229M in BTC, $320M in ETH, $25.5M in SOL and $1.8M in XRP for October 12 to 16. Bitcoin's total is shaped by one session. October 14, the day hot CPI printed, saw $261M leave, more than the whole week's net, after $176M of inflows the day before. IBIT made up about 72% of the week's BTC outflow.
Ethereum looks different. Its funds have logged one positive session since mid-September, this was the third losing week in a row, and 93% of the weekly outflow came from one fund, BlackRock's. October 16 was the 11th outflow day of the month for both ETH and SOL funds, versus the sixth for BTC.
What stands out to me is the scale. $229M is about 0.2% of the roughly $104B Bitcoin ETFs hold, so this is trimming, not an exit. It isn't a rotation either, since all four categories lost money.
My read is that macro explains Bitcoin, while ETH has its own problem. Hotter inflation and the October 28 Fed meeting weigh on everything, and BTC flows reacted on the CPI day. ETH has bled through quiet days too, which looks less like a headline reaction and more like allocators losing interest.
The counter-argument is that concentration cuts both ways. If one fund drives most of ETH's outflow, a single large allocator could explain it, and that could stop as quickly as it started.
I'd watch two things: whether Bitcoin flows turn positive after October 28, and whether ETH's outflow days keep stacking when there's no macro headline.
$BTC #BTC Price Analysis# #Meme Alpha# $ETH
Ethereum looks different. Its funds have logged one positive session since mid-September, this was the third losing week in a row, and 93% of the weekly outflow came from one fund, BlackRock's. October 16 was the 11th outflow day of the month for both ETH and SOL funds, versus the sixth for BTC.
What stands out to me is the scale. $229M is about 0.2% of the roughly $104B Bitcoin ETFs hold, so this is trimming, not an exit. It isn't a rotation either, since all four categories lost money.
My read is that macro explains Bitcoin, while ETH has its own problem. Hotter inflation and the October 28 Fed meeting weigh on everything, and BTC flows reacted on the CPI day. ETH has bled through quiet days too, which looks less like a headline reaction and more like allocators losing interest.
The counter-argument is that concentration cuts both ways. If one fund drives most of ETH's outflow, a single large allocator could explain it, and that could stop as quickly as it started.
I'd watch two things: whether Bitcoin flows turn positive after October 28, and whether ETH's outflow days keep stacking when there's no macro headline.
$BTC #BTC Price Analysis# #Meme Alpha# $ETH


69
·
--
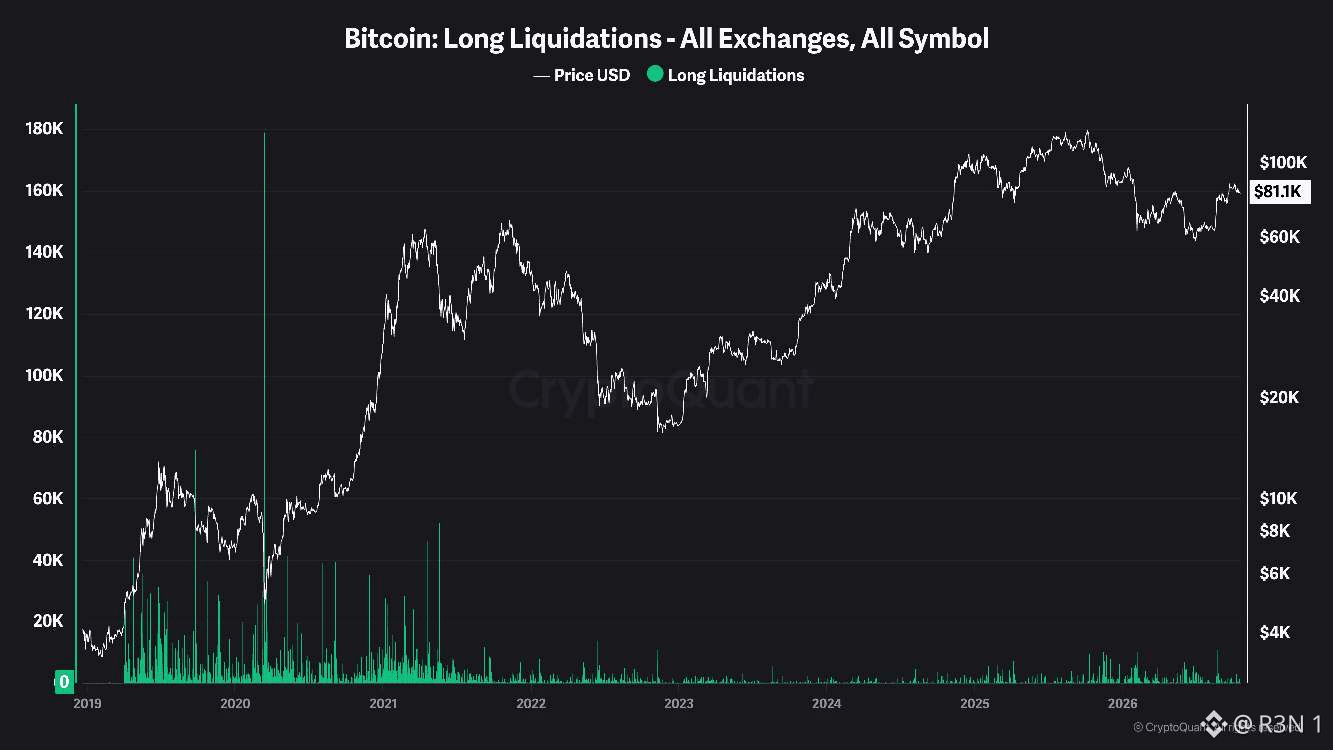
Bitcoin's long liquidations look small on CryptoQuant's chart, and the unit is hiding most of the story.
The chart tracks long liquidations in BTC. In March 2020 it hit about 180K BTC, and 2019 to 2021 regularly printed days of 40K to 75K. Today the biggest spikes of the past year sit near 10K to 11K BTC. That looks like a market that has calmed down. It isn't, because BTC is about sixteen times more expensive. By my math, 180K BTC at roughly $5K was about $0.9B, and 10K BTC at today's $81K is about $0.8B. Similar dollar size, far smaller bar.
What stands out to me is how October fits. Coinglass counted about $1.19B in total liquidations on October 8 and 9, with BTC longs near $273M, and about $820M more on October 12. Open interest sat near $52.7B after that flush. On this chart those events barely register, because a few thousand BTC isn't much against history.
The counter-argument is that smaller bars can mean the opposite of what they seem. Gradual deleveraging, with positions shaken out a few hundred million dollars at a time, is healthier than one huge cascade. And this metric counts forced selling, not how much leverage is actually sitting there.
I'd also be careful comparing eras. Exchange coverage has changed since 2019, so early and late bars aren't perfectly like for like.
The test is the high-water mark. A bar above 10K to 11K BTC would be the biggest flush of the past year, and with BTC near $81K and $80K as support, that's the scenario to watch if CPI-driven hike bets return.
#BTC Price Analysis# $BTC #Altcoin Season# #Macro Insights#
Bitcoin's long liquidations look small on CryptoQuant's chart, and the unit is hiding most of the story.
The chart tracks long liquidations in BTC. In March 2020 it hit about 180K BTC, and 2019 to 2021 regularly printed days of 40K to 75K. Today the biggest spikes of the past year sit near 10K to 11K BTC. That looks like a market that has calmed down. It isn't, because BTC is about sixteen times more expensive. By my math, 180K BTC at roughly $5K was about $0.9B, and 10K BTC at today's $81K is about $0.8B. Similar dollar size, far smaller bar.
What stands out to me is how October fits. Coinglass counted about $1.19B in total liquidations on October 8 and 9, with BTC longs near $273M, and about $820M more on October 12. Open interest sat near $52.7B after that flush. On this chart those events barely register, because a few thousand BTC isn't much against history.
The counter-argument is that smaller bars can mean the opposite of what they seem. Gradual deleveraging, with positions shaken out a few hundred million dollars at a time, is healthier than one huge cascade. And this metric counts forced selling, not how much leverage is actually sitting there.
I'd also be careful comparing eras. Exchange coverage has changed since 2019, so early and late bars aren't perfectly like for like.
The test is the high-water mark. A bar above 10K to 11K BTC would be the biggest flush of the past year, and with BTC near $81K and $80K as support, that's the scenario to watch if CPI-driven hike bets return.
#BTC Price Analysis# $BTC #Altcoin Season# #Macro Insights#
The chart tracks long liquidations in BTC. In March 2020 it hit about 180K BTC, and 2019 to 2021 regularly printed days of 40K to 75K. Today the biggest spikes of the past year sit near 10K to 11K BTC. That looks like a market that has calmed down. It isn't, because BTC is about sixteen times more expensive. By my math, 180K BTC at roughly $5K was about $0.9B, and 10K BTC at today's $81K is about $0.8B. Similar dollar size, far smaller bar.
What stands out to me is how October fits. Coinglass counted about $1.19B in total liquidations on October 8 and 9, with BTC longs near $273M, and about $820M more on October 12. Open interest sat near $52.7B after that flush. On this chart those events barely register, because a few thousand BTC isn't much against history.
The counter-argument is that smaller bars can mean the opposite of what they seem. Gradual deleveraging, with positions shaken out a few hundred million dollars at a time, is healthier than one huge cascade. And this metric counts forced selling, not how much leverage is actually sitting there.
I'd also be careful comparing eras. Exchange coverage has changed since 2019, so early and late bars aren't perfectly like for like.
The test is the high-water mark. A bar above 10K to 11K BTC would be the biggest flush of the past year, and with BTC near $81K and $80K as support, that's the scenario to watch if CPI-driven hike bets return.
#BTC Price Analysis# $BTC #Altcoin Season# #Macro Insights#
28
·
--
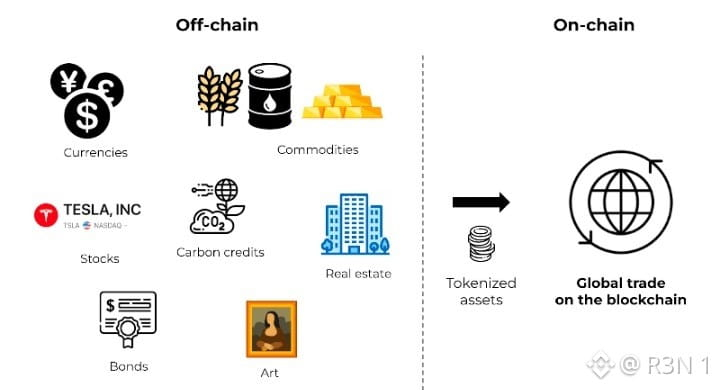
Injective's RWA perps went from $61M in May to more than $230M in the latest month, and that trend matters more than the $1.1B year-to-date headline.
The figures come from Injective's own October 18 post, so they're the network's number, not an independent audit. They hang together, though: CoinGecko had $845.9M year to date through August, with July at $186.5M and August at $209.7M, and the latest month adds to that. Across 135 active markets, equities are the engine. In the last 30-day breakdown I could find, they were $127.3M of $214.9M, with FX at $49M and commodities, pre-IPO and indices splitting the rest.
What stands out to me is how small this is next to the leader. In July, Hyperliquid's builder-deployed markets did about $114B by Artemis data, so Injective's whole year is roughly 1% of one Hyperliquid month, by my math. That doesn't make it unimportant. It makes Injective a niche venue in a category that's already enormous.
There's a second caveat in the data. CoinGecko put cumulative RWA perp volume at $5.3B since early 2025, which implies 2025 averaged more than $300M a month, by my math. So $230M a month is a recovery toward that pace, not a new peak.
The open question is who is trading it. Injective hasn't said how much is institutional flow versus leveraged retail, and its claim to lead on revenue relative to FDV only means something if the volume is durable.
I'd watch whether monthly volume holds above $200M for another quarter, and whether commodities and pre-IPO grow beyond a sliver of the mix.
$INJ #BTC Price Analysis# #Altcoin Season# #BNBChain#
Injective's RWA perps went from $61M in May to more than $230M in the latest month, and that trend matters more than the $1.1B year-to-date headline.
The figures come from Injective's own October 18 post, so they're the network's number, not an independent audit. They hang together, though: CoinGecko had $845.9M year to date through August, with July at $186.5M and August at $209.7M, and the latest month adds to that. Across 135 active markets, equities are the engine. In the last 30-day breakdown I could find, they were $127.3M of $214.9M, with FX at $49M and commodities, pre-IPO and indices splitting the rest.
What stands out to me is how small this is next to the leader. In July, Hyperliquid's builder-deployed markets did about $114B by Artemis data, so Injective's whole year is roughly 1% of one Hyperliquid month, by my math. That doesn't make it unimportant. It makes Injective a niche venue in a category that's already enormous.
There's a second caveat in the data. CoinGecko put cumulative RWA perp volume at $5.3B since early 2025, which implies 2025 averaged more than $300M a month, by my math. So $230M a month is a recovery toward that pace, not a new peak.
The open question is who is trading it. Injective hasn't said how much is institutional flow versus leveraged retail, and its claim to lead on revenue relative to FDV only means something if the volume is durable.
I'd watch whether monthly volume holds above $200M for another quarter, and whether commodities and pre-IPO grow beyond a sliver of the mix.
$INJ #BTC Price Analysis# #Altcoin Season# #BNBChain#
The figures come from Injective's own October 18 post, so they're the network's number, not an independent audit. They hang together, though: CoinGecko had $845.9M year to date through August, with July at $186.5M and August at $209.7M, and the latest month adds to that. Across 135 active markets, equities are the engine. In the last 30-day breakdown I could find, they were $127.3M of $214.9M, with FX at $49M and commodities, pre-IPO and indices splitting the rest.
What stands out to me is how small this is next to the leader. In July, Hyperliquid's builder-deployed markets did about $114B by Artemis data, so Injective's whole year is roughly 1% of one Hyperliquid month, by my math. That doesn't make it unimportant. It makes Injective a niche venue in a category that's already enormous.
There's a second caveat in the data. CoinGecko put cumulative RWA perp volume at $5.3B since early 2025, which implies 2025 averaged more than $300M a month, by my math. So $230M a month is a recovery toward that pace, not a new peak.
The open question is who is trading it. Injective hasn't said how much is institutional flow versus leveraged retail, and its claim to lead on revenue relative to FDV only means something if the volume is durable.
I'd watch whether monthly volume holds above $200M for another quarter, and whether commodities and pre-IPO grow beyond a sliver of the mix.
$INJ #BTC Price Analysis# #Altcoin Season# #BNBChain#

28
·
--
Out of every dollar USDC earns, 59 cents is gone before Circle keeps anything, and that's the number to read first.
Circle's October 16 breakdown of H1 2026 shows about $1.4B in revenue and reserve income. Roughly $819M, or 59%, went to distribution partners and transaction costs. Another $473M, 34%, went to infrastructure like licensing, compliance and product development. What's left is about $98M in net profit, roughly 7 cents per dollar. USDC also settled over $36T onchain in the half, about 77% of stablecoin transaction volume in June.
What stands out to me is how little of that $36T turns into revenue. By my math, $1.4B on $36T is under half a basis point. Revenue follows reserves, mostly interest on the assets backing USDC, not how often the coin moves. That's why distribution is the lever: partners that hold or promote USDC balances get paid on those balances. Binance's new five-year deal, with equity plus a monthly incentive fee tied to USDC held, is the same logic in a more aggressive form.
My read is that the breakdown is also a message. Circle published it alongside free, near real-time redemptions, which looks like a response to claims that issuers keep most of the yield. That's the company's own framing, not an audit, and "partners and transaction costs" are lumped together, so the partner share alone isn't visible.
The counter-argument is that thin margins are what growth costs. A 7% margin on a business with this reach isn't distress, and the September Fed hike came after this period, so reserve income may look better in H2. A rate-cutting cycle would push the other way.
I'd watch whether the 59% falls as USDC grows, or whether partners claim a bigger cut as their leverage rises.
$USDC #BTC Price Analysis# #Meme Alpha# $SUI
Out of every dollar USDC earns, 59 cents is gone before Circle keeps anything, and that's the number to read first.
Circle's October 16 breakdown of H1 2026 shows about $1.4B in revenue and reserve income. Roughly $819M, or 59%, went to distribution partners and transaction costs. Another $473M, 34%, went to infrastructure like licensing, compliance and product development. What's left is about $98M in net profit, roughly 7 cents per dollar. USDC also settled over $36T onchain in the half, about 77% of stablecoin transaction volume in June.
What stands out to me is how little of that $36T turns into revenue. By my math, $1.4B on $36T is under half a basis point. Revenue follows reserves, mostly interest on the assets backing USDC, not how often the coin moves. That's why distribution is the lever: partners that hold or promote USDC balances get paid on those balances. Binance's new five-year deal, with equity plus a monthly incentive fee tied to USDC held, is the same logic in a more aggressive form.
My read is that the breakdown is also a message. Circle published it alongside free, near real-time redemptions, which looks like a response to claims that issuers keep most of the yield. That's the company's own framing, not an audit, and "partners and transaction costs" are lumped together, so the partner share alone isn't visible.
The counter-argument is that thin margins are what growth costs. A 7% margin on a business with this reach isn't distress, and the September Fed hike came after this period, so reserve income may look better in H2. A rate-cutting cycle would push the other way.
I'd watch whether the 59% falls as USDC grows, or whether partners claim a bigger cut as their leverage rises.
$USDC #BTC Price Analysis# #Meme Alpha# $SUI
Circle's October 16 breakdown of H1 2026 shows about $1.4B in revenue and reserve income. Roughly $819M, or 59%, went to distribution partners and transaction costs. Another $473M, 34%, went to infrastructure like licensing, compliance and product development. What's left is about $98M in net profit, roughly 7 cents per dollar. USDC also settled over $36T onchain in the half, about 77% of stablecoin transaction volume in June.
What stands out to me is how little of that $36T turns into revenue. By my math, $1.4B on $36T is under half a basis point. Revenue follows reserves, mostly interest on the assets backing USDC, not how often the coin moves. That's why distribution is the lever: partners that hold or promote USDC balances get paid on those balances. Binance's new five-year deal, with equity plus a monthly incentive fee tied to USDC held, is the same logic in a more aggressive form.
My read is that the breakdown is also a message. Circle published it alongside free, near real-time redemptions, which looks like a response to claims that issuers keep most of the yield. That's the company's own framing, not an audit, and "partners and transaction costs" are lumped together, so the partner share alone isn't visible.
The counter-argument is that thin margins are what growth costs. A 7% margin on a business with this reach isn't distress, and the September Fed hike came after this period, so reserve income may look better in H2. A rate-cutting cycle would push the other way.
I'd watch whether the 59% falls as USDC grows, or whether partners claim a bigger cut as their leverage rises.
$USDC #BTC Price Analysis# #Meme Alpha# $SUI


45
·
--
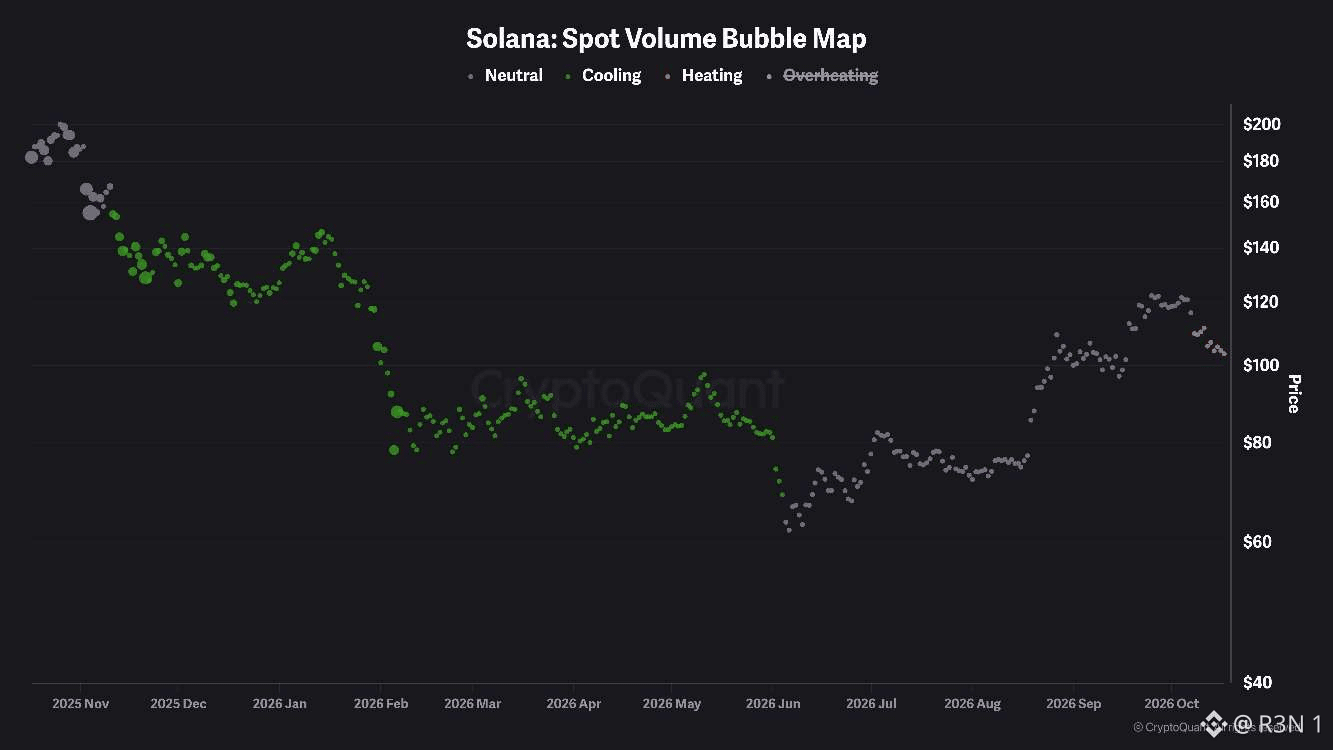
CryptoQuant's spot volume bubble map shows SOL's first "heating" readings of this window, about half a dozen bubbles as price slid from roughly $112 to $103. For most of the year the chart looked different. From December to early June nearly every bubble was green, meaning volume was cooling as price bled from about $150 to the low $80s. Participation faded quietly, and the June low near $62 didn't come with a volume spike either.
What stands out to me is the contrast. Cooling volume on a falling price is apathy. Heating volume on a falling price is people actively selling, and that's what this looks like. The color encodes volume, not direction, so I'm reading direction from the price axis.
Other reporting leans the same way, though I'd treat some of it with care. Solana spot ETFs have reportedly logged ten straight days of outflows, the chain's stablecoin supply is down roughly $1.5B since September 25, and futures open interest fell 4% on Saturday, the biggest drop among majors. SOL sits near $102 to $104.
The counter-argument is that this is still a pullback inside a recovery. SOL is about 65% above its June low by my math, and the heating run is short, so a few quiet sessions would erase it.
I'd watch two things. If bubbles go back to neutral while SOL holds the $100 area, the selling is fading. If heating persists as $100 breaks, volume is confirming the move, and the next question is whether it escalates further.
$SOL #Macro Insights# #BTC Price Analysis# $BTC
CryptoQuant's spot volume bubble map shows SOL's first "heating" readings of this window, about half a dozen bubbles as price slid from roughly $112 to $103. For most of the year the chart looked different. From December to early June nearly every bubble was green, meaning volume was cooling as price bled from about $150 to the low $80s. Participation faded quietly, and the June low near $62 didn't come with a volume spike either.
What stands out to me is the contrast. Cooling volume on a falling price is apathy. Heating volume on a falling price is people actively selling, and that's what this looks like. The color encodes volume, not direction, so I'm reading direction from the price axis.
Other reporting leans the same way, though I'd treat some of it with care. Solana spot ETFs have reportedly logged ten straight days of outflows, the chain's stablecoin supply is down roughly $1.5B since September 25, and futures open interest fell 4% on Saturday, the biggest drop among majors. SOL sits near $102 to $104.
The counter-argument is that this is still a pullback inside a recovery. SOL is about 65% above its June low by my math, and the heating run is short, so a few quiet sessions would erase it.
I'd watch two things. If bubbles go back to neutral while SOL holds the $100 area, the selling is fading. If heating persists as $100 breaks, volume is confirming the move, and the next question is whether it escalates further.
$SOL #Macro Insights# #BTC Price Analysis# $BTC
What stands out to me is the contrast. Cooling volume on a falling price is apathy. Heating volume on a falling price is people actively selling, and that's what this looks like. The color encodes volume, not direction, so I'm reading direction from the price axis.
Other reporting leans the same way, though I'd treat some of it with care. Solana spot ETFs have reportedly logged ten straight days of outflows, the chain's stablecoin supply is down roughly $1.5B since September 25, and futures open interest fell 4% on Saturday, the biggest drop among majors. SOL sits near $102 to $104.
The counter-argument is that this is still a pullback inside a recovery. SOL is about 65% above its June low by my math, and the heating run is short, so a few quiet sessions would erase it.
I'd watch two things. If bubbles go back to neutral while SOL holds the $100 area, the selling is fading. If heating persists as $100 breaks, volume is confirming the move, and the next question is whether it escalates further.
$SOL #Macro Insights# #BTC Price Analysis# $BTC
57
·
--
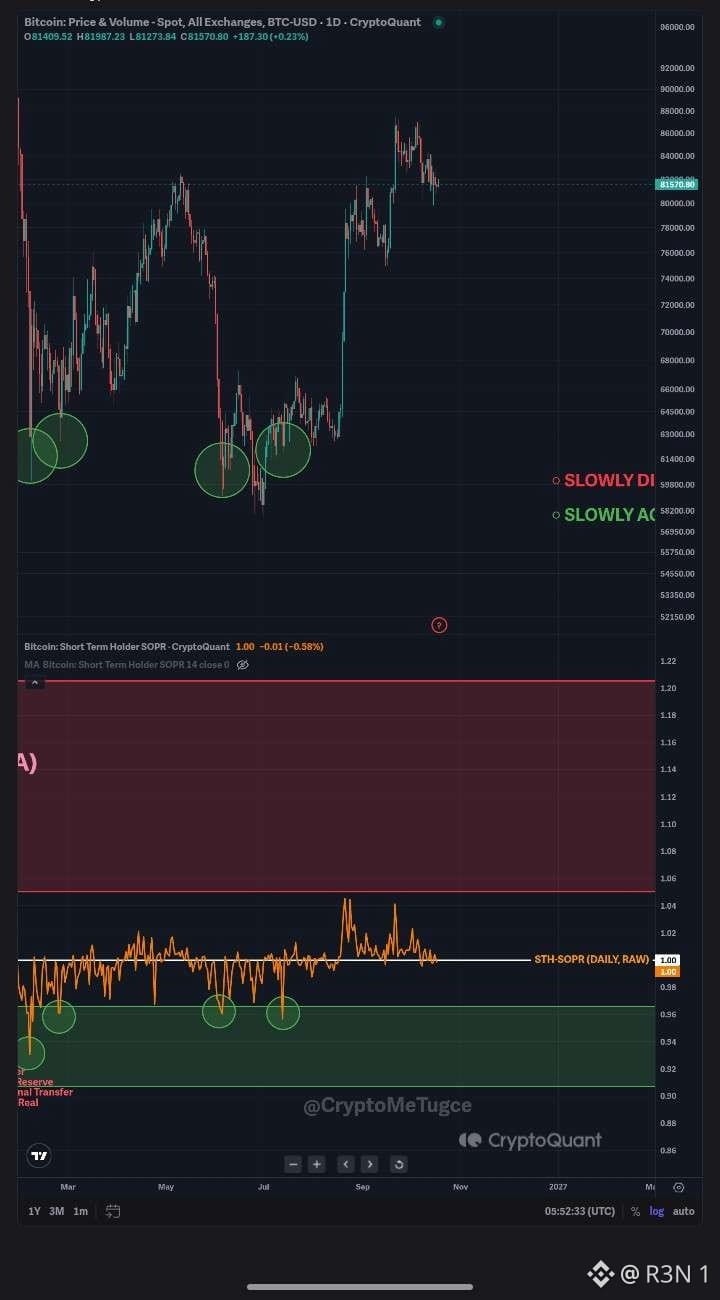
Short-term holders just went from selling at a profit to selling at breakeven, and that's quieter than it sounds.
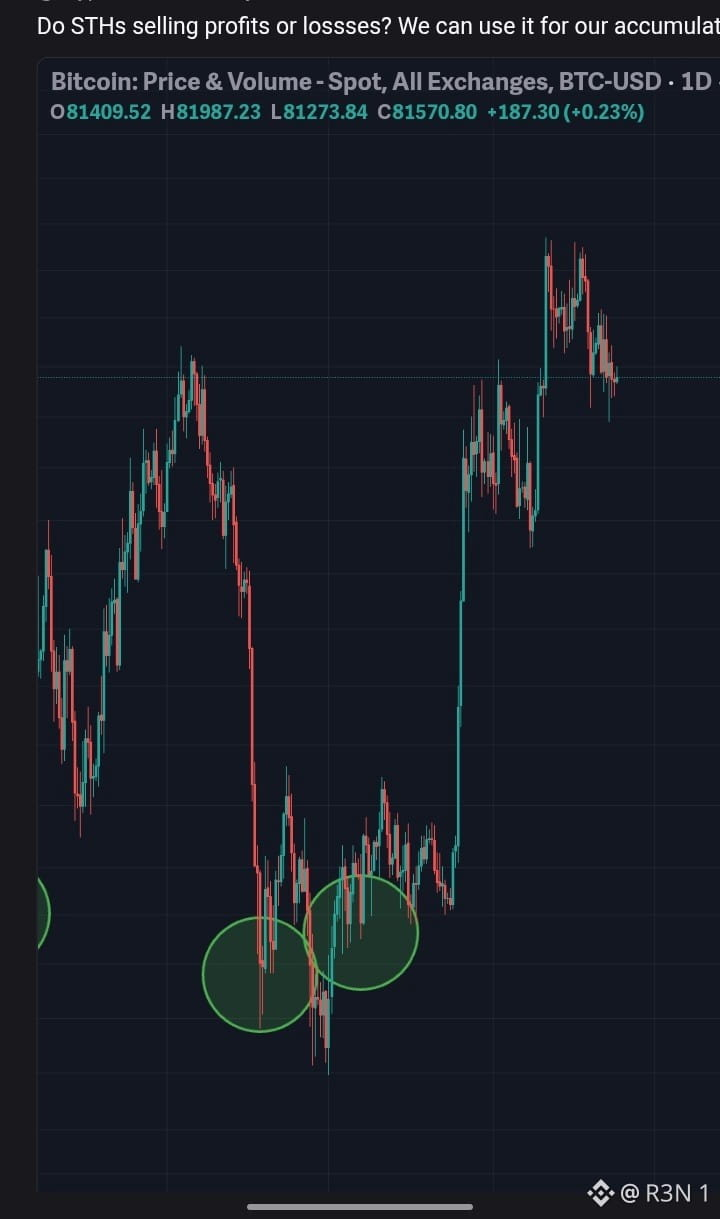
CryptoQuant's STH-SOPR sits at 1.00 with BTC near $81.6K, about 6% under its early-October high. The metric tracks whether recent buyers are spending coins above or below what they paid. During the September to October run it peaked near 1.04, which means profit-taking stayed modest. It never reached the 1.05 zone that tends to show up when the crowd gets greedy.
What stands out to me is the other side of the chart. Each major low this year, near $60K in February and March, then again in June and July, came with STH-SOPR dipping to roughly 0.93 to 0.96. Recent buyers capitulated, and price bottomed soon after. Four examples is a small sample, but the pattern is consistent.
The macro backdrop explains the slide back to 1.00. A hotter-than-expected CPI on October 14 raised hike odds ahead of the October 28 Fed meeting, and BTC dipped toward $80K before recovering. Short-term holders didn't capitulate on that dip, since STH-SOPR stayed out of the 0.93 to 0.96 range. That favors a resilient floor, though one dip isn't proof.
The counter-argument is that a reading of exactly 1.0 can also mark hesitation before a drop. If the Fed hikes and price breaks below the October low near $80K, short-term holders would be sitting underwater, and that's what pushed the ratio into the zone that marked prior lows.
I'd watch for either outcome on a sustained basis. A dip below 0.97 would be the capitulation that historically came near bottoms, while a hold above 1.0 through the Fed meeting would show buyers unwilling to sell at a loss.
$BTC #BTC Price Analysis# #Meme Alpha#
Short-term holders just went from selling at a profit to selling at breakeven, and that's quieter than it sounds.
CryptoQuant's STH-SOPR sits at 1.00 with BTC near $81.6K, about 6% under its early-October high. The metric tracks whether recent buyers are spending coins above or below what they paid. During the September to October run it peaked near 1.04, which means profit-taking stayed modest. It never reached the 1.05 zone that tends to show up when the crowd gets greedy.
What stands out to me is the other side of the chart. Each major low this year, near $60K in February and March, then again in June and July, came with STH-SOPR dipping to roughly 0.93 to 0.96. Recent buyers capitulated, and price bottomed soon after. Four examples is a small sample, but the pattern is consistent.
The macro backdrop explains the slide back to 1.00. A hotter-than-expected CPI on October 14 raised hike odds ahead of the October 28 Fed meeting, and BTC dipped toward $80K before recovering. Short-term holders didn't capitulate on that dip, since STH-SOPR stayed out of the 0.93 to 0.96 range. That favors a resilient floor, though one dip isn't proof.
The counter-argument is that a reading of exactly 1.0 can also mark hesitation before a drop. If the Fed hikes and price breaks below the October low near $80K, short-term holders would be sitting underwater, and that's what pushed the ratio into the zone that marked prior lows.
I'd watch for either outcome on a sustained basis. A dip below 0.97 would be the capitulation that historically came near bottoms, while a hold above 1.0 through the Fed meeting would show buyers unwilling to sell at a loss.
$BTC #BTC Price Analysis# #Meme Alpha#
CryptoQuant's STH-SOPR sits at 1.00 with BTC near $81.6K, about 6% under its early-October high. The metric tracks whether recent buyers are spending coins above or below what they paid. During the September to October run it peaked near 1.04, which means profit-taking stayed modest. It never reached the 1.05 zone that tends to show up when the crowd gets greedy.
What stands out to me is the other side of the chart. Each major low this year, near $60K in February and March, then again in June and July, came with STH-SOPR dipping to roughly 0.93 to 0.96. Recent buyers capitulated, and price bottomed soon after. Four examples is a small sample, but the pattern is consistent.
The macro backdrop explains the slide back to 1.00. A hotter-than-expected CPI on October 14 raised hike odds ahead of the October 28 Fed meeting, and BTC dipped toward $80K before recovering. Short-term holders didn't capitulate on that dip, since STH-SOPR stayed out of the 0.93 to 0.96 range. That favors a resilient floor, though one dip isn't proof.
The counter-argument is that a reading of exactly 1.0 can also mark hesitation before a drop. If the Fed hikes and price breaks below the October low near $80K, short-term holders would be sitting underwater, and that's what pushed the ratio into the zone that marked prior lows.
I'd watch for either outcome on a sustained basis. A dip below 0.97 would be the capitulation that historically came near bottoms, while a hold above 1.0 through the Fed meeting would show buyers unwilling to sell at a loss.
$BTC #BTC Price Analysis# #Meme Alpha#
68
·
--
Most token losses in DeFi are not from protocol failures. They are from interacting with tokens that were never worth interacting with. The information needed to identify most unsafe tokens is publicly available before any capital moves.
Here is the checklist I run before swapping any unfamiliar token.
First, verify the contract address from an official source. Not from a search result or a social media post. The official website, official Telegram, or official X account. Token names can be duplicated by anyone. Contract addresses cannot. Every fake token has a different address from the real one.
Second, check the token label in STONfi's interface. STONfi flags Fake, Honeypot, Taxable, Suspicious, and DMCA tokens. Fake and Honeypot tokens cannot be swapped at all. A token that only appears through manual contract address entry has been flagged for a reason.
Third, check holder distribution. A token where one wallet holds 50% or more of supply has concentrated risk that no APR compensates for.
Fourth, check liquidity depth relative to market cap. A token with $10M market cap and $50K in pool liquidity cannot be exited without catastrophic price impact.
Fifth, look for mint functions or ownership that can increase supply or pause transfers after launch.
Before putting real capital at risk test your crypto security knowledge at https://stonverse.com/cybersecgame/ it covers real attack vectors in an interactive format worth going through once before your first serious DeFi allocation.
Five checks. Five minutes. Most unsafe tokens fail at least one obviously.
$BTC #BTC Price Analysis# $SOL #Meme Alpha#
Most token losses in DeFi are not from protocol failures. They are from interacting with tokens that were never worth interacting with. The information needed to identify most unsafe tokens is publicly available before any capital moves.
Here is the checklist I run before swapping any unfamiliar token.
First, verify the contract address from an official source. Not from a search result or a social media post. The official website, official Telegram, or official X account. Token names can be duplicated by anyone. Contract addresses cannot. Every fake token has a different address from the real one.
Second, check the token label in STONfi's interface. STONfi flags Fake, Honeypot, Taxable, Suspicious, and DMCA tokens. Fake and Honeypot tokens cannot be swapped at all. A token that only appears through manual contract address entry has been flagged for a reason.
Third, check holder distribution. A token where one wallet holds 50% or more of supply has concentrated risk that no APR compensates for.
Fourth, check liquidity depth relative to market cap. A token with $10M market cap and $50K in pool liquidity cannot be exited without catastrophic price impact.
Fifth, look for mint functions or ownership that can increase supply or pause transfers after launch.
Before putting real capital at risk test your crypto security knowledge at https://stonverse.com/cybersecgame/ it covers real attack vectors in an interactive format worth going through once before your first serious DeFi allocation.
Five checks. Five minutes. Most unsafe tokens fail at least one obviously.
$BTC #BTC Price Analysis# $SOL #Meme Alpha#
Here is the checklist I run before swapping any unfamiliar token.
First, verify the contract address from an official source. Not from a search result or a social media post. The official website, official Telegram, or official X account. Token names can be duplicated by anyone. Contract addresses cannot. Every fake token has a different address from the real one.
Second, check the token label in STONfi's interface. STONfi flags Fake, Honeypot, Taxable, Suspicious, and DMCA tokens. Fake and Honeypot tokens cannot be swapped at all. A token that only appears through manual contract address entry has been flagged for a reason.
Third, check holder distribution. A token where one wallet holds 50% or more of supply has concentrated risk that no APR compensates for.
Fourth, check liquidity depth relative to market cap. A token with $10M market cap and $50K in pool liquidity cannot be exited without catastrophic price impact.
Fifth, look for mint functions or ownership that can increase supply or pause transfers after launch.
Before putting real capital at risk test your crypto security knowledge at https://stonverse.com/cybersecgame/ it covers real attack vectors in an interactive format worth going through once before your first serious DeFi allocation.
Five checks. Five minutes. Most unsafe tokens fail at least one obviously.
$BTC #BTC Price Analysis# $SOL #Meme Alpha#

76
·
--
Gold fell about 2%, silver 6%, bitcoin 2% to 3%, ether 6%. Four assets with four different stories, sold for one reason.
September CPI came in at 3.7%, and core rose 0.3% on the month, more than nearly all of Bloomberg's surveyed economists expected. The odds of an October Fed hike jumped from roughly 22% to between 45% and 55%, depending on the gauge. The 10-year yield hit about 5.3%, the highest since 2002, and the dollar rallied.
Gold pays nothing, so higher yields and a stronger dollar hit it directly. That's why a hot inflation print knocked it down: it has been trading as a rates asset, not an inflation hedge. Bitcoin sold through the same channel, with leverage on top. Roughly $1B in positions were liquidated in 24 hours.
What stands out to me is how both recovered on the same variable. Yields eased toward 5.1% and hike odds fell back near 30% after the New York Fed's John Williams said further hikes beyond this year look unnecessary. Gold bounced to about $4,158, and BTC went from a dip toward $80K back to around $82,300.
That makes the October 28 meeting the real event, not the CPI headline. The Fed also decides before seeing its preferred PCE gauge, which is due just after.
The counter-argument is that this was an energy shock. Gasoline rose 9.1% and drove more than half of the monthly increase, while core is 2.6% on the year. If the Fed looks through it, the selloff was an overreaction.
My read is that gold and BTC are trading one variable right now. Watch the 10-year yield. If it holds above 5%, expect both to stay under pressure, whatever the inflation label says.
$BTC #BTC Price Analysis# #Meme Alpha# $XAUt
Gold fell about 2%, silver 6%, bitcoin 2% to 3%, ether 6%. Four assets with four different stories, sold for one reason.
September CPI came in at 3.7%, and core rose 0.3% on the month, more than nearly all of Bloomberg's surveyed economists expected. The odds of an October Fed hike jumped from roughly 22% to between 45% and 55%, depending on the gauge. The 10-year yield hit about 5.3%, the highest since 2002, and the dollar rallied.
Gold pays nothing, so higher yields and a stronger dollar hit it directly. That's why a hot inflation print knocked it down: it has been trading as a rates asset, not an inflation hedge. Bitcoin sold through the same channel, with leverage on top. Roughly $1B in positions were liquidated in 24 hours.
What stands out to me is how both recovered on the same variable. Yields eased toward 5.1% and hike odds fell back near 30% after the New York Fed's John Williams said further hikes beyond this year look unnecessary. Gold bounced to about $4,158, and BTC went from a dip toward $80K back to around $82,300.
That makes the October 28 meeting the real event, not the CPI headline. The Fed also decides before seeing its preferred PCE gauge, which is due just after.
The counter-argument is that this was an energy shock. Gasoline rose 9.1% and drove more than half of the monthly increase, while core is 2.6% on the year. If the Fed looks through it, the selloff was an overreaction.
My read is that gold and BTC are trading one variable right now. Watch the 10-year yield. If it holds above 5%, expect both to stay under pressure, whatever the inflation label says.
$BTC #BTC Price Analysis# #Meme Alpha# $XAUt
September CPI came in at 3.7%, and core rose 0.3% on the month, more than nearly all of Bloomberg's surveyed economists expected. The odds of an October Fed hike jumped from roughly 22% to between 45% and 55%, depending on the gauge. The 10-year yield hit about 5.3%, the highest since 2002, and the dollar rallied.
Gold pays nothing, so higher yields and a stronger dollar hit it directly. That's why a hot inflation print knocked it down: it has been trading as a rates asset, not an inflation hedge. Bitcoin sold through the same channel, with leverage on top. Roughly $1B in positions were liquidated in 24 hours.
What stands out to me is how both recovered on the same variable. Yields eased toward 5.1% and hike odds fell back near 30% after the New York Fed's John Williams said further hikes beyond this year look unnecessary. Gold bounced to about $4,158, and BTC went from a dip toward $80K back to around $82,300.
That makes the October 28 meeting the real event, not the CPI headline. The Fed also decides before seeing its preferred PCE gauge, which is due just after.
The counter-argument is that this was an energy shock. Gasoline rose 9.1% and drove more than half of the monthly increase, while core is 2.6% on the year. If the Fed looks through it, the selloff was an overreaction.
My read is that gold and BTC are trading one variable right now. Watch the 10-year yield. If it holds above 5%, expect both to stay under pressure, whatever the inflation label says.
$BTC #BTC Price Analysis# #Meme Alpha# $XAUt


29
·
--
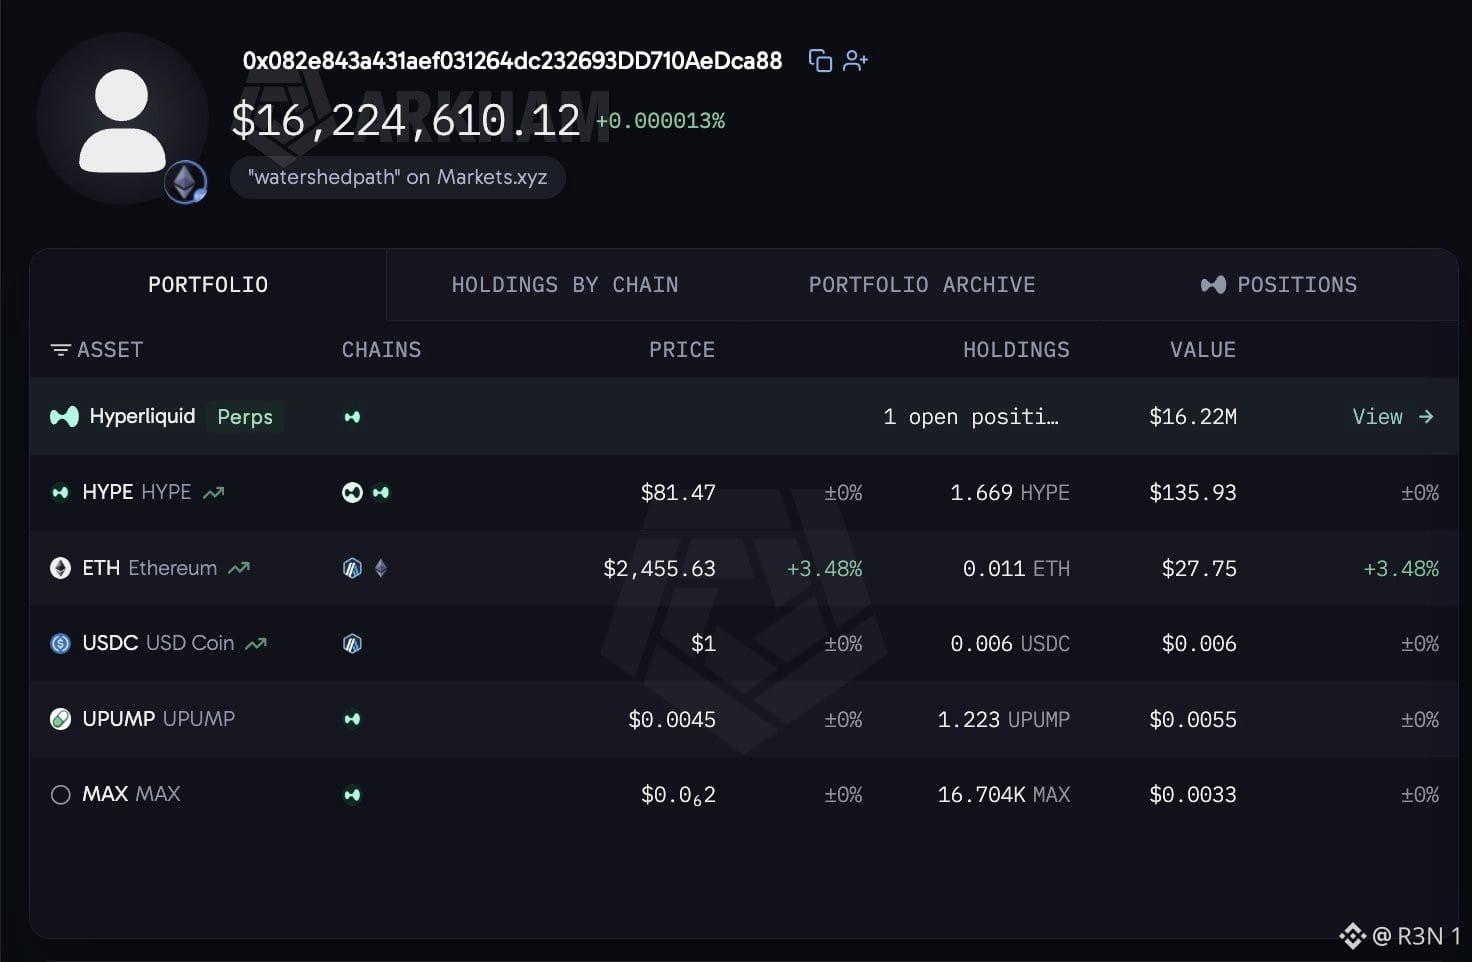
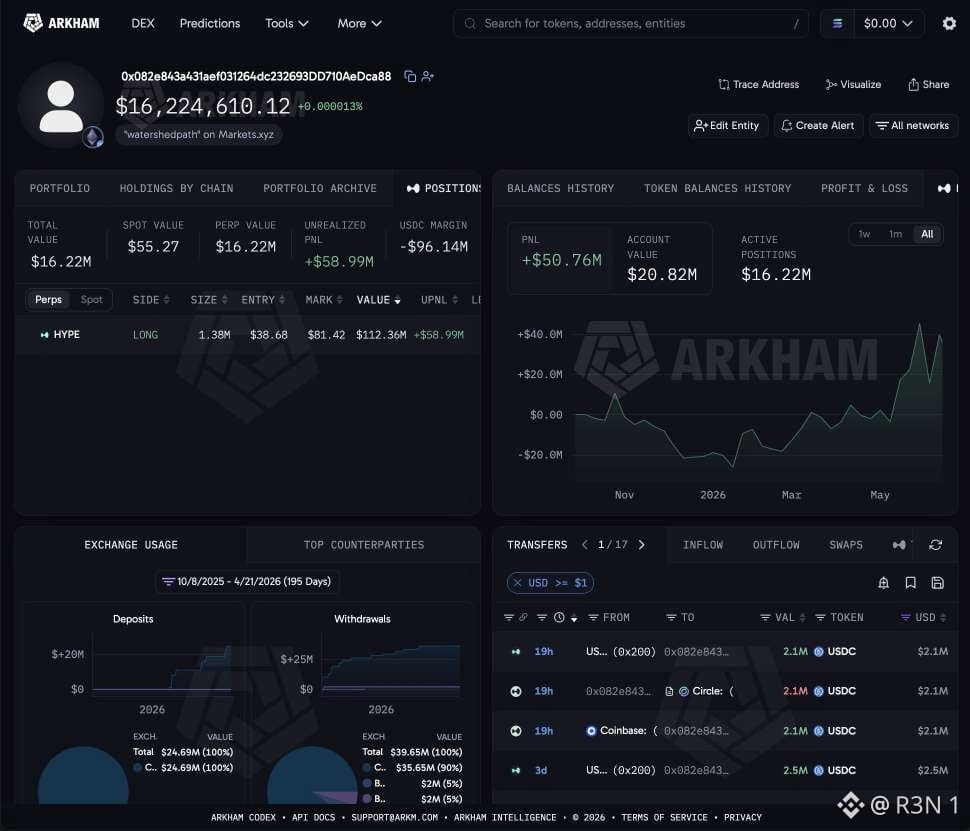
A $58M profit that hasn't been banked yet, on a position that's been visible to everyone for weeks.
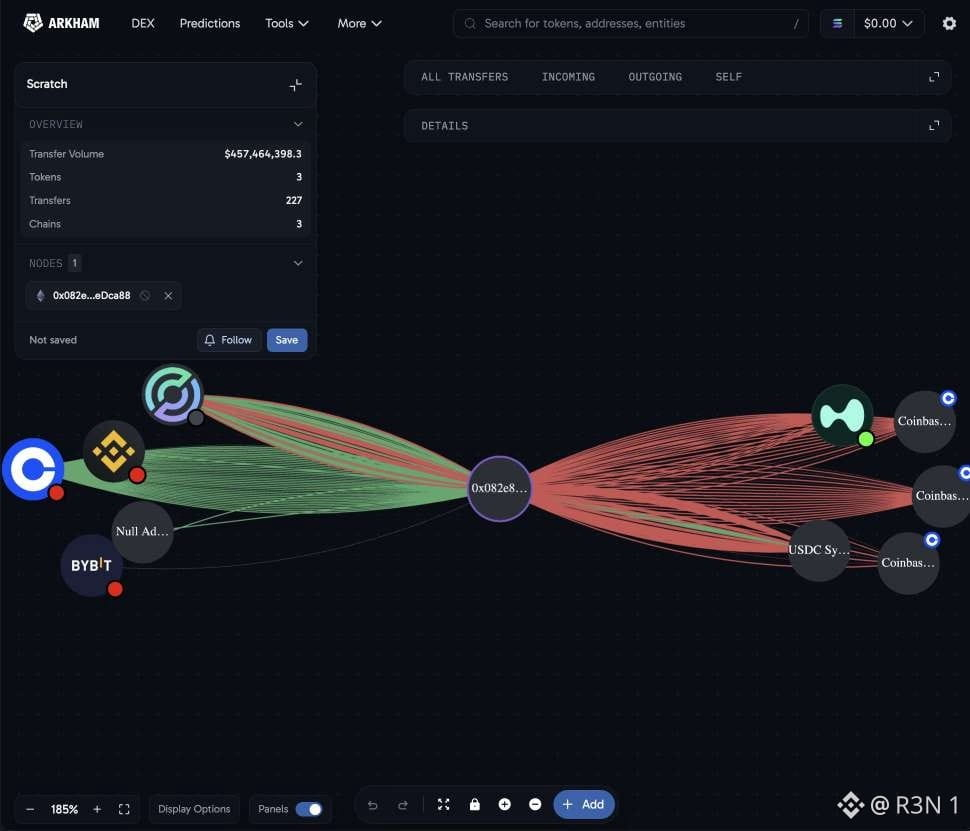
Trader "watershedpath" is long about $112M of HYPE on Hyperliquid at 5x, with an average entry of $38.68. HYPE is at $81.38, so the paper gain is about $58M, and reports put the account's lifetime profit above $50M. Two outlets printed the size as $11.2M, but the math only works at $112M: roughly 1.38M HYPE times a $42.70 gain.
What stands out to me is the holding behavior. A report four weeks ago showed the same entry and about $120M of exposure when HYPE was near $88. By my math that's roughly the same token count, so he held through a pullback that cost about $9M of paper profit and still hasn't taken any off.
The risk is in the arithmetic. Every 10% move in HYPE is worth about $11M on this position, and the whole gain only exists while price stays above $38.68. The reports don't say whether margin is cross or isolated, so the liquidation price can't be known from outside.
Worth a caution about copying a headline like this. We see one wallet, not the book behind it. A spot stack or an offsetting position elsewhere wouldn't show up here, and a public winner is a survivor, not a signal. In my read, visible size can also become a target when liquidity gets thin.
The open question is whether he's still adding or just holding. I'd watch for any change in size, because a trader this large trimming into strength would say more than the paper profit does.
Track the wallet: https://arkm.com/explorer/address/0x082e843a431aef031264dc232693DD710AeDca88
#BTC Price Analysis# $BTC #Meme Alpha# $HYPE
A $58M profit that hasn't been banked yet, on a position that's been visible to everyone for weeks.
Trader "watershedpath" is long about $112M of HYPE on Hyperliquid at 5x, with an average entry of $38.68. HYPE is at $81.38, so the paper gain is about $58M, and reports put the account's lifetime profit above $50M. Two outlets printed the size as $11.2M, but the math only works at $112M: roughly 1.38M HYPE times a $42.70 gain.
What stands out to me is the holding behavior. A report four weeks ago showed the same entry and about $120M of exposure when HYPE was near $88. By my math that's roughly the same token count, so he held through a pullback that cost about $9M of paper profit and still hasn't taken any off.
The risk is in the arithmetic. Every 10% move in HYPE is worth about $11M on this position, and the whole gain only exists while price stays above $38.68. The reports don't say whether margin is cross or isolated, so the liquidation price can't be known from outside.
Worth a caution about copying a headline like this. We see one wallet, not the book behind it. A spot stack or an offsetting position elsewhere wouldn't show up here, and a public winner is a survivor, not a signal. In my read, visible size can also become a target when liquidity gets thin.
The open question is whether he's still adding or just holding. I'd watch for any change in size, because a trader this large trimming into strength would say more than the paper profit does.
Track the wallet: https://arkm.com/explorer/address/0x082e843a431aef031264dc232693DD710AeDca88
#BTC Price Analysis# $BTC #Meme Alpha# $HYPE
Trader "watershedpath" is long about $112M of HYPE on Hyperliquid at 5x, with an average entry of $38.68. HYPE is at $81.38, so the paper gain is about $58M, and reports put the account's lifetime profit above $50M. Two outlets printed the size as $11.2M, but the math only works at $112M: roughly 1.38M HYPE times a $42.70 gain.
What stands out to me is the holding behavior. A report four weeks ago showed the same entry and about $120M of exposure when HYPE was near $88. By my math that's roughly the same token count, so he held through a pullback that cost about $9M of paper profit and still hasn't taken any off.
The risk is in the arithmetic. Every 10% move in HYPE is worth about $11M on this position, and the whole gain only exists while price stays above $38.68. The reports don't say whether margin is cross or isolated, so the liquidation price can't be known from outside.
Worth a caution about copying a headline like this. We see one wallet, not the book behind it. A spot stack or an offsetting position elsewhere wouldn't show up here, and a public winner is a survivor, not a signal. In my read, visible size can also become a target when liquidity gets thin.
The open question is whether he's still adding or just holding. I'd watch for any change in size, because a trader this large trimming into strength would say more than the paper profit does.
Track the wallet: https://arkm.com/explorer/address/0x082e843a431aef031264dc232693DD710AeDca88
#BTC Price Analysis# $BTC #Meme Alpha# $HYPE
45
·
--
Whales don't have inside information. What they have is a different time horizon, and the data says it's getting longer.
Santiment counted 20,338 wallets holding 10 to 10,000 BTC on October 15, an all-time high. The count has climbed since mid-July, and one report puts the cohort's net adds at about 113,950 BTC since July 15, roughly $9B by my math. The latest stretch added more than 85,000 coins in about three weeks while BTC slid from near $87K to $80K.
That's the interesting part: they bought the dip, not the breakout. Santiment reads growth in this cohort during choppy trading as deep-pocketed investors staying put.
Now the limits, because the headline overstates what a wallet count can say. It counts addresses, not people, and one holder can split coins across several. The 10 BTC floor is only about $800K, so this cohort is wide. A rising count can also reflect holders reorganizing, not new money.
The history cuts the other way too. Santiment says this pace has shown up only twice in the past year, and one report notes a similar pattern once preceded a 34% drop. I couldn't see the detail on that episode, so treat it as a warning, not a rule.
The tape isn't confirming yet. BTC is near $82K after dipping below $80K on Thursday, about 35% under last October's high. Binance funding has turned negative, and ETFs have logged October outflows.
So do whales know something you don't? Not about direction. They've shown conviction, which is different. I'd watch whether the count keeps climbing if BTC loses $80,400. Accumulation that survives a break of support is a stronger signal than accumulation into a dip.
$BTC #Bitcoin Price Prediction: What is Bitcoins next move?#
Whales don't have inside information. What they have is a different time horizon, and the data says it's getting longer.
Santiment counted 20,338 wallets holding 10 to 10,000 BTC on October 15, an all-time high. The count has climbed since mid-July, and one report puts the cohort's net adds at about 113,950 BTC since July 15, roughly $9B by my math. The latest stretch added more than 85,000 coins in about three weeks while BTC slid from near $87K to $80K.
That's the interesting part: they bought the dip, not the breakout. Santiment reads growth in this cohort during choppy trading as deep-pocketed investors staying put.
Now the limits, because the headline overstates what a wallet count can say. It counts addresses, not people, and one holder can split coins across several. The 10 BTC floor is only about $800K, so this cohort is wide. A rising count can also reflect holders reorganizing, not new money.
The history cuts the other way too. Santiment says this pace has shown up only twice in the past year, and one report notes a similar pattern once preceded a 34% drop. I couldn't see the detail on that episode, so treat it as a warning, not a rule.
The tape isn't confirming yet. BTC is near $82K after dipping below $80K on Thursday, about 35% under last October's high. Binance funding has turned negative, and ETFs have logged October outflows.
So do whales know something you don't? Not about direction. They've shown conviction, which is different. I'd watch whether the count keeps climbing if BTC loses $80,400. Accumulation that survives a break of support is a stronger signal than accumulation into a dip.
$BTC #Bitcoin Price Prediction: What is Bitcoins next move?#
Santiment counted 20,338 wallets holding 10 to 10,000 BTC on October 15, an all-time high. The count has climbed since mid-July, and one report puts the cohort's net adds at about 113,950 BTC since July 15, roughly $9B by my math. The latest stretch added more than 85,000 coins in about three weeks while BTC slid from near $87K to $80K.
That's the interesting part: they bought the dip, not the breakout. Santiment reads growth in this cohort during choppy trading as deep-pocketed investors staying put.
Now the limits, because the headline overstates what a wallet count can say. It counts addresses, not people, and one holder can split coins across several. The 10 BTC floor is only about $800K, so this cohort is wide. A rising count can also reflect holders reorganizing, not new money.
The history cuts the other way too. Santiment says this pace has shown up only twice in the past year, and one report notes a similar pattern once preceded a 34% drop. I couldn't see the detail on that episode, so treat it as a warning, not a rule.
The tape isn't confirming yet. BTC is near $82K after dipping below $80K on Thursday, about 35% under last October's high. Binance funding has turned negative, and ETFs have logged October outflows.
So do whales know something you don't? Not about direction. They've shown conviction, which is different. I'd watch whether the count keeps climbing if BTC loses $80,400. Accumulation that survives a break of support is a stronger signal than accumulation into a dip.
$BTC #Bitcoin Price Prediction: What is Bitcoins next move?#

58
·
--
RWA.xyz data showed Solana's entire tokenized asset market crossing $500 million in September 2025. Today Ondo alone has more than that on the chain.
Ondo's distributed asset value on Solana stands at $508.1 million across 454 assets as of October 15, up about 46% over 30 days. Across every network Ondo holds $3.96 billion, which grew just 9.7% in the same window. Solana is expanding nearly five times faster than the platform as a whole, its share is close to 13%, and it ranks third among Ondo's networks. Ethereum still holds the bulk, roughly half of Ondo's value when last tallied.
The mix matters. The Solana book blends tokenized stocks with Treasury style products like USDY, and Solana captured about 95% of on chain equity volume when rwa.xyz launched its stocks dashboard, so the chain's pull is trading activity as much as holdings. Ondo's platform wide monthly transfer volume sits near $2.5 billion, up about 48%, which suggests these tokens are moving, not just sitting after issuance.
Here's where I'd keep some caution: distributed value is tokens multiplied by price, so a rally in the underlying stocks lifts the figure without a single new buyer. A 46% month blends real inflows with market moves, and this data can't separate the two.
What stands out to me is the direction of travel. Ondo's liquidity is spreading beyond a single network, and Solana is capturing the largest share of that shift.
Next thing to track: whether Solana's slice of Ondo's total keeps climbing past 13%, and whether transfer volume holds up if equity prices cool.
$ONDO #BTC Price Analysis# #Altcoin Season# $SOL
RWA.xyz data showed Solana's entire tokenized asset market crossing $500 million in September 2025. Today Ondo alone has more than that on the chain.
Ondo's distributed asset value on Solana stands at $508.1 million across 454 assets as of October 15, up about 46% over 30 days. Across every network Ondo holds $3.96 billion, which grew just 9.7% in the same window. Solana is expanding nearly five times faster than the platform as a whole, its share is close to 13%, and it ranks third among Ondo's networks. Ethereum still holds the bulk, roughly half of Ondo's value when last tallied.
The mix matters. The Solana book blends tokenized stocks with Treasury style products like USDY, and Solana captured about 95% of on chain equity volume when rwa.xyz launched its stocks dashboard, so the chain's pull is trading activity as much as holdings. Ondo's platform wide monthly transfer volume sits near $2.5 billion, up about 48%, which suggests these tokens are moving, not just sitting after issuance.
Here's where I'd keep some caution: distributed value is tokens multiplied by price, so a rally in the underlying stocks lifts the figure without a single new buyer. A 46% month blends real inflows with market moves, and this data can't separate the two.
What stands out to me is the direction of travel. Ondo's liquidity is spreading beyond a single network, and Solana is capturing the largest share of that shift.
Next thing to track: whether Solana's slice of Ondo's total keeps climbing past 13%, and whether transfer volume holds up if equity prices cool.
$ONDO #BTC Price Analysis# #Altcoin Season# $SOL
Ondo's distributed asset value on Solana stands at $508.1 million across 454 assets as of October 15, up about 46% over 30 days. Across every network Ondo holds $3.96 billion, which grew just 9.7% in the same window. Solana is expanding nearly five times faster than the platform as a whole, its share is close to 13%, and it ranks third among Ondo's networks. Ethereum still holds the bulk, roughly half of Ondo's value when last tallied.
The mix matters. The Solana book blends tokenized stocks with Treasury style products like USDY, and Solana captured about 95% of on chain equity volume when rwa.xyz launched its stocks dashboard, so the chain's pull is trading activity as much as holdings. Ondo's platform wide monthly transfer volume sits near $2.5 billion, up about 48%, which suggests these tokens are moving, not just sitting after issuance.
Here's where I'd keep some caution: distributed value is tokens multiplied by price, so a rally in the underlying stocks lifts the figure without a single new buyer. A 46% month blends real inflows with market moves, and this data can't separate the two.
What stands out to me is the direction of travel. Ondo's liquidity is spreading beyond a single network, and Solana is capturing the largest share of that shift.
Next thing to track: whether Solana's slice of Ondo's total keeps climbing past 13%, and whether transfer volume holds up if equity prices cool.
$ONDO #BTC Price Analysis# #Altcoin Season# $SOL

65
·
--
USDT on TON and USDT on Base are the same stablecoin issued on two separate blockchains. A standard wallet transfer cannot move one to the other. You need a cross-chain swap.
Here is the complete process on STONfi
Step one. Open https://app.ston.fi and connect your TON wallet through TON Connect. You also need a MetaMask or compatible EVM wallet to receive USDT on Base. Base uses ETH as its gas token — have a small amount of ETH on Base ready before initiating if you plan to use the received USDT for any further activity.
Step two. Switch to cross-chain mode in the interface. Select TON as the source network and Base as the destination network.
Step three. Select USDT as the source asset on TON and USDT or USDC as the destination asset on Base. Enter your amount.
Step four. Review the quote carefully. Check the destination amount, the total fee, the network labels showing TON and Base on each side, and your destination wallet address. Base gas fees are low — this is one of the most economical EVM destinations for TON-originating stablecoin moves.
Step five. Confirm the transaction. Omniston coordinates the cross-chain execution. Your USDT either arrives on Base as quoted or your original TON USDT returns automatically through the timelock. Most swaps complete in 15 to 40 seconds.
For a full visual guide with screenshots of every step visit https://ston.fi/how-to-send-usdt-from-ton-to-base
Current transaction limit is $1,000 per swap.
#BTC Price Analysis# $BTC $ETH #Altcoin Season#
USDT on TON and USDT on Base are the same stablecoin issued on two separate blockchains. A standard wallet transfer cannot move one to the other. You need a cross-chain swap.
Here is the complete process on STONfi
Step one. Open https://app.ston.fi and connect your TON wallet through TON Connect. You also need a MetaMask or compatible EVM wallet to receive USDT on Base. Base uses ETH as its gas token — have a small amount of ETH on Base ready before initiating if you plan to use the received USDT for any further activity.
Step two. Switch to cross-chain mode in the interface. Select TON as the source network and Base as the destination network.
Step three. Select USDT as the source asset on TON and USDT or USDC as the destination asset on Base. Enter your amount.
Step four. Review the quote carefully. Check the destination amount, the total fee, the network labels showing TON and Base on each side, and your destination wallet address. Base gas fees are low — this is one of the most economical EVM destinations for TON-originating stablecoin moves.
Step five. Confirm the transaction. Omniston coordinates the cross-chain execution. Your USDT either arrives on Base as quoted or your original TON USDT returns automatically through the timelock. Most swaps complete in 15 to 40 seconds.
For a full visual guide with screenshots of every step visit https://ston.fi/how-to-send-usdt-from-ton-to-base
Current transaction limit is $1,000 per swap.
#BTC Price Analysis# $BTC $ETH #Altcoin Season#
Here is the complete process on STONfi
Step one. Open https://app.ston.fi and connect your TON wallet through TON Connect. You also need a MetaMask or compatible EVM wallet to receive USDT on Base. Base uses ETH as its gas token — have a small amount of ETH on Base ready before initiating if you plan to use the received USDT for any further activity.
Step two. Switch to cross-chain mode in the interface. Select TON as the source network and Base as the destination network.
Step three. Select USDT as the source asset on TON and USDT or USDC as the destination asset on Base. Enter your amount.
Step four. Review the quote carefully. Check the destination amount, the total fee, the network labels showing TON and Base on each side, and your destination wallet address. Base gas fees are low — this is one of the most economical EVM destinations for TON-originating stablecoin moves.
Step five. Confirm the transaction. Omniston coordinates the cross-chain execution. Your USDT either arrives on Base as quoted or your original TON USDT returns automatically through the timelock. Most swaps complete in 15 to 40 seconds.
For a full visual guide with screenshots of every step visit https://ston.fi/how-to-send-usdt-from-ton-to-base
Current transaction limit is $1,000 per swap.
#BTC Price Analysis# $BTC $ETH #Altcoin Season#

35
·
--
USDT on TON and USDT on Base are the same stablecoin issued on two separate blockchains. A standard wallet transfer cannot move one to the other. You need a cross-chain swap.
Here is the complete process on STONfi.
Step one. Open https://app.ston.fi and connect your TON wallet through TON Connect. You also need a MetaMask or compatible EVM wallet to receive USDT on Base. Base uses ETH as its gas token, have a small amount of ETH on Base ready before initiating if you plan to use the received USDT for any further activity.
Step two. Switch to cross-chain mode in the interface. Select TON as the source network and Base as the destination network.
STEP Three :Select USDT as the source asset on TON and USDT or USDC as the destination asset on Base. Enter your amount.
STEP four: Review the quote carefully. Check the destination amount, the total fee, the network labels showing TON and Base on each side, and your destination wallet address. Base gas fees are low, this is one of the most economical EVM destinations for TON-originating stablecoin moves.
Step five. Confirm the transaction. Omniston coordinates the cross-chain execution. Your USDT either arrives on Base as quoted or your original TON USDT returns automatically through the timelock. Most swaps complete in 15 to 40 seconds.
For a full visual guide with screenshots of every step visit https://ston.fi/how-to-send-usdt-from-ton-to-base and https://ston.fi/cross-chain-swap-from-ton-to-base.
Current transaction limit is $1,000 per swap.
Try the swap → https://app.ston.fi/swap?mode=cross-chain
#BTC Price Analysis# $BTC #Meme Alpha# $SOL
USDT on TON and USDT on Base are the same stablecoin issued on two separate blockchains. A standard wallet transfer cannot move one to the other. You need a cross-chain swap.
Here is the complete process on STONfi.
Step one. Open https://app.ston.fi and connect your TON wallet through TON Connect. You also need a MetaMask or compatible EVM wallet to receive USDT on Base. Base uses ETH as its gas token, have a small amount of ETH on Base ready before initiating if you plan to use the received USDT for any further activity.
Step two. Switch to cross-chain mode in the interface. Select TON as the source network and Base as the destination network.
STEP Three :Select USDT as the source asset on TON and USDT or USDC as the destination asset on Base. Enter your amount.
STEP four: Review the quote carefully. Check the destination amount, the total fee, the network labels showing TON and Base on each side, and your destination wallet address. Base gas fees are low, this is one of the most economical EVM destinations for TON-originating stablecoin moves.
Step five. Confirm the transaction. Omniston coordinates the cross-chain execution. Your USDT either arrives on Base as quoted or your original TON USDT returns automatically through the timelock. Most swaps complete in 15 to 40 seconds.
For a full visual guide with screenshots of every step visit https://ston.fi/how-to-send-usdt-from-ton-to-base and https://ston.fi/cross-chain-swap-from-ton-to-base.
Current transaction limit is $1,000 per swap.
Try the swap → https://app.ston.fi/swap?mode=cross-chain
#BTC Price Analysis# $BTC #Meme Alpha# $SOL
Here is the complete process on STONfi.
Step one. Open https://app.ston.fi and connect your TON wallet through TON Connect. You also need a MetaMask or compatible EVM wallet to receive USDT on Base. Base uses ETH as its gas token, have a small amount of ETH on Base ready before initiating if you plan to use the received USDT for any further activity.
Step two. Switch to cross-chain mode in the interface. Select TON as the source network and Base as the destination network.
STEP Three :Select USDT as the source asset on TON and USDT or USDC as the destination asset on Base. Enter your amount.
STEP four: Review the quote carefully. Check the destination amount, the total fee, the network labels showing TON and Base on each side, and your destination wallet address. Base gas fees are low, this is one of the most economical EVM destinations for TON-originating stablecoin moves.
Step five. Confirm the transaction. Omniston coordinates the cross-chain execution. Your USDT either arrives on Base as quoted or your original TON USDT returns automatically through the timelock. Most swaps complete in 15 to 40 seconds.
For a full visual guide with screenshots of every step visit https://ston.fi/how-to-send-usdt-from-ton-to-base and https://ston.fi/cross-chain-swap-from-ton-to-base.
Current transaction limit is $1,000 per swap.
Try the swap → https://app.ston.fi/swap?mode=cross-chain
#BTC Price Analysis# $BTC #Meme Alpha# $SOL

57
·
--
The pitch is AWS, not Goldman. Jeff Yan told Bloomberg's Odd Lots on October 15 that Hyperliquid wants to supply trading technology to financial institutions, not replace Wall Street firms.
The mechanism is a regulatory split. Yan argues compliance should fall on the firms that operate and control markets built on Hyperliquid, not on the blockchain itself, much like financial firms using internet infrastructure. In my read, that maps onto HIP-3 style builder-deployed markets, where the operator chooses the market design.
There's a live test case. Hyperliquid's perps stay closed to US users, but Kraken's parent Payward plans to offer US investors derivatives using Hyperliquid's technology through a regulated exchange. That's the model Yan is describing, with a licensed operator in front.
Worth saying plainly what this is: an advocacy position. Bloomberg noted the distinction would let Hyperliquid expand toward Wall Street without a traditional exchange's full compliance burden. US regulators are still working out how to bring offshore venues into the domestic framework, and none has endorsed this split.
What stands out to me is the token question. If institutions build on Hyperliquid, does the value accrue to HYPE or to the operators? August data showed HIP-3 deployers keeping half of fees on their markets, with one deployer driving nearly all of that volume. Infrastructure is a good business only if the toll stays with the infrastructure.
The AWS analogy has a limit too. In some jurisdictions, regulators already treat big cloud providers as critical third parties to finance, so "just infrastructure" may not mean "unregulated."
I'd watch whether Payward's product actually launches, and whether any regulator signals it accepts the operator-not-chain framing.
$XRP #BTC Price Analysis# #Altcoin Season# $HYPE
The pitch is AWS, not Goldman. Jeff Yan told Bloomberg's Odd Lots on October 15 that Hyperliquid wants to supply trading technology to financial institutions, not replace Wall Street firms.
The mechanism is a regulatory split. Yan argues compliance should fall on the firms that operate and control markets built on Hyperliquid, not on the blockchain itself, much like financial firms using internet infrastructure. In my read, that maps onto HIP-3 style builder-deployed markets, where the operator chooses the market design.
There's a live test case. Hyperliquid's perps stay closed to US users, but Kraken's parent Payward plans to offer US investors derivatives using Hyperliquid's technology through a regulated exchange. That's the model Yan is describing, with a licensed operator in front.
Worth saying plainly what this is: an advocacy position. Bloomberg noted the distinction would let Hyperliquid expand toward Wall Street without a traditional exchange's full compliance burden. US regulators are still working out how to bring offshore venues into the domestic framework, and none has endorsed this split.
What stands out to me is the token question. If institutions build on Hyperliquid, does the value accrue to HYPE or to the operators? August data showed HIP-3 deployers keeping half of fees on their markets, with one deployer driving nearly all of that volume. Infrastructure is a good business only if the toll stays with the infrastructure.
The AWS analogy has a limit too. In some jurisdictions, regulators already treat big cloud providers as critical third parties to finance, so "just infrastructure" may not mean "unregulated."
I'd watch whether Payward's product actually launches, and whether any regulator signals it accepts the operator-not-chain framing.
$XRP #BTC Price Analysis# #Altcoin Season# $HYPE
The mechanism is a regulatory split. Yan argues compliance should fall on the firms that operate and control markets built on Hyperliquid, not on the blockchain itself, much like financial firms using internet infrastructure. In my read, that maps onto HIP-3 style builder-deployed markets, where the operator chooses the market design.
There's a live test case. Hyperliquid's perps stay closed to US users, but Kraken's parent Payward plans to offer US investors derivatives using Hyperliquid's technology through a regulated exchange. That's the model Yan is describing, with a licensed operator in front.
Worth saying plainly what this is: an advocacy position. Bloomberg noted the distinction would let Hyperliquid expand toward Wall Street without a traditional exchange's full compliance burden. US regulators are still working out how to bring offshore venues into the domestic framework, and none has endorsed this split.
What stands out to me is the token question. If institutions build on Hyperliquid, does the value accrue to HYPE or to the operators? August data showed HIP-3 deployers keeping half of fees on their markets, with one deployer driving nearly all of that volume. Infrastructure is a good business only if the toll stays with the infrastructure.
The AWS analogy has a limit too. In some jurisdictions, regulators already treat big cloud providers as critical third parties to finance, so "just infrastructure" may not mean "unregulated."
I'd watch whether Payward's product actually launches, and whether any regulator signals it accepts the operator-not-chain framing.
$XRP #BTC Price Analysis# #Altcoin Season# $HYPE


76
·
--
Most people enter crypto through a centralized exchange. They create an account, complete identity verification, deposit funds, and trade through the platform's order book. The platform holds their assets. The platform can freeze their account or go insolvent while their funds are inside.
A decentralized exchange works differently at every level.
A DEX is a set of smart contracts running on a blockchain. No company operates it. No account to create. No identity verification required. No platform holding assets on your behalf. You connect a wallet you control, trade directly through the contracts, and your assets stay in your custody until the exact moment a swap executes.
The price discovery mechanism is also different. Centralized exchanges use order books, buyers and sellers posting bids and asks that match when prices agree. Most DEXes use automated market makers instead. Liquidity providers deposit asset pairs into pools. A formula determines the price for any trade based on the current ratio of assets in the pool. The pool is always available to trade regardless of whether another user wants the opposite side of your position.
On STONfi the AMM model runs alongside Omniston's intent-based routing which sources the best available price across multiple pools. The result is better execution without requiring users to manually compare pools.
Understanding the difference between custodial and non-custodial exchange is the foundation for everything else in DeFi. https://whatisdex.com/ covers the full DEX mechanics clearly for anyone building from first principles.
#BTC Price Analysis# $BTC #Altcoin Season# $ETH
Most people enter crypto through a centralized exchange. They create an account, complete identity verification, deposit funds, and trade through the platform's order book. The platform holds their assets. The platform can freeze their account or go insolvent while their funds are inside.
A decentralized exchange works differently at every level.
A DEX is a set of smart contracts running on a blockchain. No company operates it. No account to create. No identity verification required. No platform holding assets on your behalf. You connect a wallet you control, trade directly through the contracts, and your assets stay in your custody until the exact moment a swap executes.
The price discovery mechanism is also different. Centralized exchanges use order books, buyers and sellers posting bids and asks that match when prices agree. Most DEXes use automated market makers instead. Liquidity providers deposit asset pairs into pools. A formula determines the price for any trade based on the current ratio of assets in the pool. The pool is always available to trade regardless of whether another user wants the opposite side of your position.
On STONfi the AMM model runs alongside Omniston's intent-based routing which sources the best available price across multiple pools. The result is better execution without requiring users to manually compare pools.
Understanding the difference between custodial and non-custodial exchange is the foundation for everything else in DeFi. https://whatisdex.com/ covers the full DEX mechanics clearly for anyone building from first principles.
#BTC Price Analysis# $BTC #Altcoin Season# $ETH
A decentralized exchange works differently at every level.
A DEX is a set of smart contracts running on a blockchain. No company operates it. No account to create. No identity verification required. No platform holding assets on your behalf. You connect a wallet you control, trade directly through the contracts, and your assets stay in your custody until the exact moment a swap executes.
The price discovery mechanism is also different. Centralized exchanges use order books, buyers and sellers posting bids and asks that match when prices agree. Most DEXes use automated market makers instead. Liquidity providers deposit asset pairs into pools. A formula determines the price for any trade based on the current ratio of assets in the pool. The pool is always available to trade regardless of whether another user wants the opposite side of your position.
On STONfi the AMM model runs alongside Omniston's intent-based routing which sources the best available price across multiple pools. The result is better execution without requiring users to manually compare pools.
Understanding the difference between custodial and non-custodial exchange is the foundation for everything else in DeFi. https://whatisdex.com/ covers the full DEX mechanics clearly for anyone building from first principles.
#BTC Price Analysis# $BTC #Altcoin Season# $ETH

58
·
--
One whale just moved $34 million out of Bitcoin and $36 million into Ether, and the prices it traded at say more than the size does.
Per Lookonchain, the address sold 410.14 BTC on Hyperliquid for $34.16 million, roughly $83,300 a coin, then bought 14,341 ETH on decentralized exchanges for $36.14 million, about $2,520 each. That's a relative value trade at an ETH/BTC ratio near 0.0303, with about $2 million of extra capital added on the ETH side. Reports don't say whether the BTC leg was spot or perps, and nothing identifies the wallet.
Scale keeps it in perspective. $36 million is under 7% of the $542 million that left US spot ETH ETFs in the week ended October 9, and a rounding error against daily Bitcoin volume. What's unusual is the timing, a buyer stepping into ETH right after a week of heavy ETF redemptions.
Whales aren't aligned either. Coinglass data shows Hyperliquid whales net short overall, about 54% of an $8.8 billion book, and at last check one address sat roughly $24 million underwater on a 5x ETH short opened near $2,323. One wallet rotating in while another gets squeezed says ETH is contested, not that the market has picked a side.
What stands out to me is that this is a rotation, not an exit. The whale stayed in crypto and changed its ratio, which reads as a view on ETH outperforming rather than on BTC falling.
Here's where I'd push back on over reading it: one wallet, one trade, no stated intent. It could be a rebalance, a hedge leg, or a trader who reverses next week.
Next thing to track: whether the same address keeps rotating, and whether ETH/BTC holds above 0.030 after the buy.
$ETH #BTC Price Analysis# #Altcoin Season# $BTC
One whale just moved $34 million out of Bitcoin and $36 million into Ether, and the prices it traded at say more than the size does.
Per Lookonchain, the address sold 410.14 BTC on Hyperliquid for $34.16 million, roughly $83,300 a coin, then bought 14,341 ETH on decentralized exchanges for $36.14 million, about $2,520 each. That's a relative value trade at an ETH/BTC ratio near 0.0303, with about $2 million of extra capital added on the ETH side. Reports don't say whether the BTC leg was spot or perps, and nothing identifies the wallet.
Scale keeps it in perspective. $36 million is under 7% of the $542 million that left US spot ETH ETFs in the week ended October 9, and a rounding error against daily Bitcoin volume. What's unusual is the timing, a buyer stepping into ETH right after a week of heavy ETF redemptions.
Whales aren't aligned either. Coinglass data shows Hyperliquid whales net short overall, about 54% of an $8.8 billion book, and at last check one address sat roughly $24 million underwater on a 5x ETH short opened near $2,323. One wallet rotating in while another gets squeezed says ETH is contested, not that the market has picked a side.
What stands out to me is that this is a rotation, not an exit. The whale stayed in crypto and changed its ratio, which reads as a view on ETH outperforming rather than on BTC falling.
Here's where I'd push back on over reading it: one wallet, one trade, no stated intent. It could be a rebalance, a hedge leg, or a trader who reverses next week.
Next thing to track: whether the same address keeps rotating, and whether ETH/BTC holds above 0.030 after the buy.
$ETH #BTC Price Analysis# #Altcoin Season# $BTC
Per Lookonchain, the address sold 410.14 BTC on Hyperliquid for $34.16 million, roughly $83,300 a coin, then bought 14,341 ETH on decentralized exchanges for $36.14 million, about $2,520 each. That's a relative value trade at an ETH/BTC ratio near 0.0303, with about $2 million of extra capital added on the ETH side. Reports don't say whether the BTC leg was spot or perps, and nothing identifies the wallet.
Scale keeps it in perspective. $36 million is under 7% of the $542 million that left US spot ETH ETFs in the week ended October 9, and a rounding error against daily Bitcoin volume. What's unusual is the timing, a buyer stepping into ETH right after a week of heavy ETF redemptions.
Whales aren't aligned either. Coinglass data shows Hyperliquid whales net short overall, about 54% of an $8.8 billion book, and at last check one address sat roughly $24 million underwater on a 5x ETH short opened near $2,323. One wallet rotating in while another gets squeezed says ETH is contested, not that the market has picked a side.
What stands out to me is that this is a rotation, not an exit. The whale stayed in crypto and changed its ratio, which reads as a view on ETH outperforming rather than on BTC falling.
Here's where I'd push back on over reading it: one wallet, one trade, no stated intent. It could be a rebalance, a hedge leg, or a trader who reverses next week.
Next thing to track: whether the same address keeps rotating, and whether ETH/BTC holds above 0.030 after the buy.
$ETH #BTC Price Analysis# #Altcoin Season# $BTC
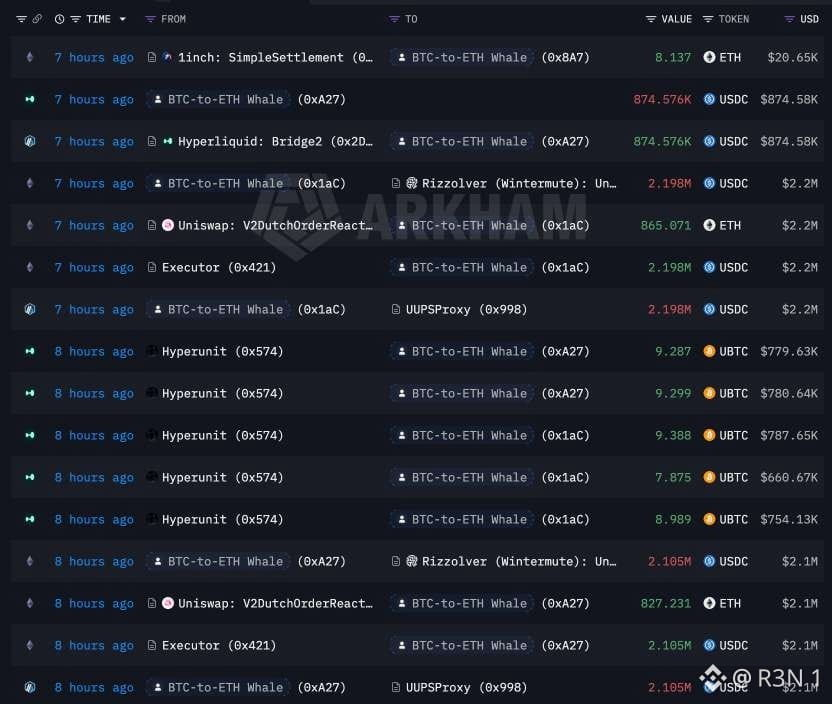
73
·
--
The "144M" figure also appears in Flare's July update, but as FXRP deployed in DeFi, so check which one yours refers to. I couldn't find the 14,085 holders number in any source, so I marked it as reported. Supply was also above 150M in April, which became the main angle of the post.
The trust model matters more than the milestone here.
Each FXRP is minted only after Flare's data layer verifies a matching XRP payment on the XRP Ledger, with the XRP held in a Core Vault under a Flare-governed multisig. One year in, Flare reports about 145M FXRP minted, with roughly 130M deployed across DeFi, about 89.5% of supply, and a reported 14,085 holders.
What stands out to me is the curve. The first 5M cap filled in four hours, supply passed 90M by January, and Flare said in April that more than 150M was circulating. At about 145M, supply sits below that April level. So this reads as a plateau after fast growth, not a fresh surge.
The use cases are real. FXRP now backs options and perps on Derive and RLUSD borrowing through Morpho vaults, and about 21M FXRP sits on other chains via LayerZero.
Scale needs saying plainly. By my math, 145M is roughly 0.2% of XRP's circulating supply. Flare also says about 85% of current minting capacity is used, so further growth depends on agents adding collateral.
The caveat is incentives. Supply was capped at launch while Flare rolled out rewards, and a high deployment rate can reflect yield farming as much as conviction, in my read. Wrapping XRP also swaps native custody for Flare's verification and vault design.
The open question is what happens as incentives taper. Does supply climb back past April's peak, or does FXRP settle as a niche corner of XRP?
$XRP #Macro Insights# #BTC Price Analysis# $BTC
The "144M" figure also appears in Flare's July update, but as FXRP deployed in DeFi, so check which one yours refers to. I couldn't find the 14,085 holders number in any source, so I marked it as reported. Supply was also above 150M in April, which became the main angle of the post.
The trust model matters more than the milestone here.
Each FXRP is minted only after Flare's data layer verifies a matching XRP payment on the XRP Ledger, with the XRP held in a Core Vault under a Flare-governed multisig. One year in, Flare reports about 145M FXRP minted, with roughly 130M deployed across DeFi, about 89.5% of supply, and a reported 14,085 holders.
What stands out to me is the curve. The first 5M cap filled in four hours, supply passed 90M by January, and Flare said in April that more than 150M was circulating. At about 145M, supply sits below that April level. So this reads as a plateau after fast growth, not a fresh surge.
The use cases are real. FXRP now backs options and perps on Derive and RLUSD borrowing through Morpho vaults, and about 21M FXRP sits on other chains via LayerZero.
Scale needs saying plainly. By my math, 145M is roughly 0.2% of XRP's circulating supply. Flare also says about 85% of current minting capacity is used, so further growth depends on agents adding collateral.
The caveat is incentives. Supply was capped at launch while Flare rolled out rewards, and a high deployment rate can reflect yield farming as much as conviction, in my read. Wrapping XRP also swaps native custody for Flare's verification and vault design.
The open question is what happens as incentives taper. Does supply climb back past April's peak, or does FXRP settle as a niche corner of XRP?
$XRP #Macro Insights# #BTC Price Analysis# $BTC
The trust model matters more than the milestone here.
Each FXRP is minted only after Flare's data layer verifies a matching XRP payment on the XRP Ledger, with the XRP held in a Core Vault under a Flare-governed multisig. One year in, Flare reports about 145M FXRP minted, with roughly 130M deployed across DeFi, about 89.5% of supply, and a reported 14,085 holders.
What stands out to me is the curve. The first 5M cap filled in four hours, supply passed 90M by January, and Flare said in April that more than 150M was circulating. At about 145M, supply sits below that April level. So this reads as a plateau after fast growth, not a fresh surge.
The use cases are real. FXRP now backs options and perps on Derive and RLUSD borrowing through Morpho vaults, and about 21M FXRP sits on other chains via LayerZero.
Scale needs saying plainly. By my math, 145M is roughly 0.2% of XRP's circulating supply. Flare also says about 85% of current minting capacity is used, so further growth depends on agents adding collateral.
The caveat is incentives. Supply was capped at launch while Flare rolled out rewards, and a high deployment rate can reflect yield farming as much as conviction, in my read. Wrapping XRP also swaps native custody for Flare's verification and vault design.
The open question is what happens as incentives taper. Does supply climb back past April's peak, or does FXRP settle as a niche corner of XRP?
$XRP #Macro Insights# #BTC Price Analysis# $BTC


2
ເຂົ້າສູ່ລະບົບເພື່ອສຳຫຼວດເນື້ອຫາເພີ່ມເຕີມ
ເຂົ້າຮ່ວມກຸ່ມຜູ້ໃຊ້ຄຣິບໂຕທົ່ວໂລກໃນ Binance Square.
⚡️ ໄດ້ຮັບຂໍ້ມູນຫຼ້າສຸດ ແລະ ທີ່ມີປະໂຫຍດກ່ຽວກັບຄຣິບໂຕ.
💬 ໄດ້ຮັບຄວາມໄວ້ວາງໃຈຈາກຕະຫຼາດແລກປ່ຽນຄຣິບໂຕທີ່ໃຫຍ່ທີ່ສຸດໃນໂລກ.
👍 ຄົ້ນຫາຂໍ້ມູນເຊີງເລິກທີ່ແທ້ຈາກນັກສ້າງທີ່ໄດ້ຮັບການຢືນຢັນ.
ອີເມວ / ເບີໂທລະສັບ
ຫົວຂໍ້ທີ່ກໍາລັງນິຍົມ
BinancePick
2.8M ຄັ້ງທີ່ເບິ່ງ
146,586 ກຳລັງສົນທະນາ
Join #EarningsSeason: Predict Earnings on Binance Pick, Share Your Take on Binance Square!
Binance Square Official
·403 ຖືກໃຈ
·340.4k ຄັ້ງທີ່ເບິ່ງ
EarningsSeason
5.1M ຄັ້ງທີ່ເບິ່ງ
25,050 ກຳລັງສົນທະນາ
AnthropicTTMRevenueGrewAbout1200%
178 ຄັ້ງທີ່ເບິ່ງ
40 ກຳລັງສົນທະນາ