

Ether Guru 1
146 ໂພສ

Ether Guru 1
ລາຍງານ
ບລັອກຜູ້ໃຊ້
Where experience meets discipline. Crypto isn’t luck — it’s mindset 💭
0 ກໍາລັງຕິດຕາມ
6 ຜູ້ຕິດຕາມ
26 Liked
ໂພສ
·
--
$BTC SHE EARNS $58,000. BUT WOULD QUITTING HER JOB ACTUALLY SAVE MONEY?
Her husband’s promotion changed the conversation at home.
He now earns around $186,000 annually, while she brings in $58,000. With a three-year-old daughter and daycare bills approaching $2,000 a month, he suggested she consider becoming a stay-at-home mom.
The idea sounds reasonable until you look beyond the monthly bills.
Daycare alone costs about $24,000 annually. Add commuting, work lunches, and other job expenses, and a meaningful portion of her paycheck may disappear before it reaches the family budget.
But there’s another side to this calculation.
If she leaves her job, the household loses more than a salary. It may also lose employer retirement contributions, opportunities for raises, and years of career growth.
And there’s a risk families sometimes underestimate: returning to work later might mean starting at a lower salary or spending months searching for the right position.
Meanwhile, relying on one income creates a different kind of financial exposure. If that paycheck disappears, the family has no second salary to fall back on.
Before deciding, they could calculate her actual take-home pay after work-related expenses, compare both household budgets, and explore flexible work or part-time childcare arrangements.
Because the question isn't simply whether daycare is expensive.
It's whether the family's long-term financial position would change after accounting for everything her job provides.
A paycheck has value beyond its monthly deposit.
$BTC SHE EARNS $58,000. BUT WOULD QUITTING HER JOB ACTUALLY SAVE MONEY?
Her husband’s promotion changed the conversation at home.
He now earns around $186,000 annually, while she brings in $58,000. With a three-year-old daughter and daycare bills approaching $2,000 a month, he suggested she consider becoming a stay-at-home mom.
The idea sounds reasonable until you look beyond the monthly bills.
Daycare alone costs about $24,000 annually. Add commuting, work lunches, and other job expenses, and a meaningful portion of her paycheck may disappear before it reaches the family budget.
But there’s another side to this calculation.
If she leaves her job, the household loses more than a salary. It may also lose employer retirement contributions, opportunities for raises, and years of career growth.
And there’s a risk families sometimes underestimate: returning to work later might mean starting at a lower salary or spending months searching for the right position.
Meanwhile, relying on one income creates a different kind of financial exposure. If that paycheck disappears, the family has no second salary to fall back on.
Before deciding, they could calculate her actual take-home pay after work-related expenses, compare both household budgets, and explore flexible work or part-time childcare arrangements.
Because the question isn't simply whether daycare is expensive.
It's whether the family's long-term financial position would change after accounting for everything her job provides.
A paycheck has value beyond its monthly deposit.
Her husband’s promotion changed the conversation at home.
He now earns around $186,000 annually, while she brings in $58,000. With a three-year-old daughter and daycare bills approaching $2,000 a month, he suggested she consider becoming a stay-at-home mom.
The idea sounds reasonable until you look beyond the monthly bills.
Daycare alone costs about $24,000 annually. Add commuting, work lunches, and other job expenses, and a meaningful portion of her paycheck may disappear before it reaches the family budget.
But there’s another side to this calculation.
If she leaves her job, the household loses more than a salary. It may also lose employer retirement contributions, opportunities for raises, and years of career growth.
And there’s a risk families sometimes underestimate: returning to work later might mean starting at a lower salary or spending months searching for the right position.
Meanwhile, relying on one income creates a different kind of financial exposure. If that paycheck disappears, the family has no second salary to fall back on.
Before deciding, they could calculate her actual take-home pay after work-related expenses, compare both household budgets, and explore flexible work or part-time childcare arrangements.
Because the question isn't simply whether daycare is expensive.
It's whether the family's long-term financial position would change after accounting for everything her job provides.
A paycheck has value beyond its monthly deposit.
54
·
--
$BTC 3 BITCOIN COULD COST HIM MORE THAN MONEY.
A friend already owns 3+ BTC bought below $30,000, roughly $2 million in income-producing real estate with equity, and more than $400,000 in cash.
Now his wife wants him to buy another 3 BTC before Bitcoin climbs back above $100,000.
But he has three teenagers approaching college age.
And that changes the calculation.
Buying 3 BTC at $85,000 each would require about $255,000 before fees.
From $400,000 in cash, that leaves just $145,000.
If tuition, property repairs, vacancies or another unexpected expense arrives, he may have to sell assets at an inconvenient time.
His real estate may be valuable, but equity isn't the same as cash. Accessing it can take time, cost money and depend on financing conditions.
And Bitcoin could rise above $100,000—or fall sharply before it gets there.
Nobody knows which happens first.
The decision isn't simply whether 3 more BTC would be a good investment.
It's whether the potential upside justifies reducing the family's readily available financial cushion while major education expenses are approaching.
He could estimate the next several years of college costs, property expenses and household spending first, then determine how much cash is genuinely available for investing.
An opportunity matters less if it weakens your financial flexibility.
$BTC 3 BITCOIN COULD COST HIM MORE THAN MONEY.
A friend already owns 3+ BTC bought below $30,000, roughly $2 million in income-producing real estate with equity, and more than $400,000 in cash.
Now his wife wants him to buy another 3 BTC before Bitcoin climbs back above $100,000.
But he has three teenagers approaching college age.
And that changes the calculation.
Buying 3 BTC at $85,000 each would require about $255,000 before fees.
From $400,000 in cash, that leaves just $145,000.
If tuition, property repairs, vacancies or another unexpected expense arrives, he may have to sell assets at an inconvenient time.
His real estate may be valuable, but equity isn't the same as cash. Accessing it can take time, cost money and depend on financing conditions.
And Bitcoin could rise above $100,000—or fall sharply before it gets there.
Nobody knows which happens first.
The decision isn't simply whether 3 more BTC would be a good investment.
It's whether the potential upside justifies reducing the family's readily available financial cushion while major education expenses are approaching.
He could estimate the next several years of college costs, property expenses and household spending first, then determine how much cash is genuinely available for investing.
An opportunity matters less if it weakens your financial flexibility.
A friend already owns 3+ BTC bought below $30,000, roughly $2 million in income-producing real estate with equity, and more than $400,000 in cash.
Now his wife wants him to buy another 3 BTC before Bitcoin climbs back above $100,000.
But he has three teenagers approaching college age.
And that changes the calculation.
Buying 3 BTC at $85,000 each would require about $255,000 before fees.
From $400,000 in cash, that leaves just $145,000.
If tuition, property repairs, vacancies or another unexpected expense arrives, he may have to sell assets at an inconvenient time.
His real estate may be valuable, but equity isn't the same as cash. Accessing it can take time, cost money and depend on financing conditions.
And Bitcoin could rise above $100,000—or fall sharply before it gets there.
Nobody knows which happens first.
The decision isn't simply whether 3 more BTC would be a good investment.
It's whether the potential upside justifies reducing the family's readily available financial cushion while major education expenses are approaching.
He could estimate the next several years of college costs, property expenses and household spending first, then determine how much cash is genuinely available for investing.
An opportunity matters less if it weakens your financial flexibility.
64
·
--
$BTC FOUR YEARS CAN CHANGE THE BITCOIN MATH FAST.
On September 27, 2022, Bitcoin was around $18,802.
Four years later, the reference price is about $84,625.
That works out to roughly a 46% annualized growth rate.
Now comes the interesting part.
If Bitcoin somehow repeated that exact 46% CAGR for another four years, the math would put BTC near $381,000 by September 2030.
Rounded up, that's the often-mentioned $385K scenario.
But there’s a huge difference between calculating a return and predicting one.
Bitcoin did not rise 46% every year.
Some periods were dramatically stronger, while others produced deep drawdowns.
So the $385K figure isn't a forecast.
It's simply what happens when you extend the previous four-year annualized growth rate forward for another four years.
That distinction matters whenever historical performance gets turned into future price targets.
Past compounding creates scenarios, not promises.
$BTC FOUR YEARS CAN CHANGE THE BITCOIN MATH FAST.
On September 27, 2022, Bitcoin was around $18,802.
Four years later, the reference price is about $84,625.
That works out to roughly a 46% annualized growth rate.
Now comes the interesting part.
If Bitcoin somehow repeated that exact 46% CAGR for another four years, the math would put BTC near $381,000 by September 2030.
Rounded up, that's the often-mentioned $385K scenario.
But there’s a huge difference between calculating a return and predicting one.
Bitcoin did not rise 46% every year.
Some periods were dramatically stronger, while others produced deep drawdowns.
So the $385K figure isn't a forecast.
It's simply what happens when you extend the previous four-year annualized growth rate forward for another four years.
That distinction matters whenever historical performance gets turned into future price targets.
Past compounding creates scenarios, not promises.
On September 27, 2022, Bitcoin was around $18,802.
Four years later, the reference price is about $84,625.
That works out to roughly a 46% annualized growth rate.
Now comes the interesting part.
If Bitcoin somehow repeated that exact 46% CAGR for another four years, the math would put BTC near $381,000 by September 2030.
Rounded up, that's the often-mentioned $385K scenario.
But there’s a huge difference between calculating a return and predicting one.
Bitcoin did not rise 46% every year.
Some periods were dramatically stronger, while others produced deep drawdowns.
So the $385K figure isn't a forecast.
It's simply what happens when you extend the previous four-year annualized growth rate forward for another four years.
That distinction matters whenever historical performance gets turned into future price targets.
Past compounding creates scenarios, not promises.
4
·
--
$BTC WHAT IF AMERICAN WEALTH WERE MEASURED IN BTC?
Using a fixed Bitcoin price can make the numbers look surprisingly simple.
But there’s an important catch:
A net-worth threshold measured in BTC changes every time Bitcoin’s dollar price changes.
If a household has $1 million in net worth, that represents about 11.8 BTC at an $85,000 Bitcoin price.
At $170,000, the same $1 million would equal only about 5.9 BTC.
The household didn't become poorer.
The BTC measurement changed.
That’s why converting U.S. wealth percentiles into Bitcoin is more of a thought experiment than a permanent definition of being rich.
It also shows something important about Bitcoin:
As the BTC price rises, the amount of Bitcoin needed to represent the same dollar wealth falls.
Bitcoin can change the measuring stick without changing wealth.
$BTC WHAT IF AMERICAN WEALTH WERE MEASURED IN BTC?
Using a fixed Bitcoin price can make the numbers look surprisingly simple.
But there’s an important catch:
A net-worth threshold measured in BTC changes every time Bitcoin’s dollar price changes.
If a household has $1 million in net worth, that represents about 11.8 BTC at an $85,000 Bitcoin price.
At $170,000, the same $1 million would equal only about 5.9 BTC.
The household didn't become poorer.
The BTC measurement changed.
That’s why converting U.S. wealth percentiles into Bitcoin is more of a thought experiment than a permanent definition of being rich.
It also shows something important about Bitcoin:
As the BTC price rises, the amount of Bitcoin needed to represent the same dollar wealth falls.
Bitcoin can change the measuring stick without changing wealth.
Using a fixed Bitcoin price can make the numbers look surprisingly simple.
But there’s an important catch:
A net-worth threshold measured in BTC changes every time Bitcoin’s dollar price changes.
If a household has $1 million in net worth, that represents about 11.8 BTC at an $85,000 Bitcoin price.
At $170,000, the same $1 million would equal only about 5.9 BTC.
The household didn't become poorer.
The BTC measurement changed.
That’s why converting U.S. wealth percentiles into Bitcoin is more of a thought experiment than a permanent definition of being rich.
It also shows something important about Bitcoin:
As the BTC price rises, the amount of Bitcoin needed to represent the same dollar wealth falls.
Bitcoin can change the measuring stick without changing wealth.

66
·
--
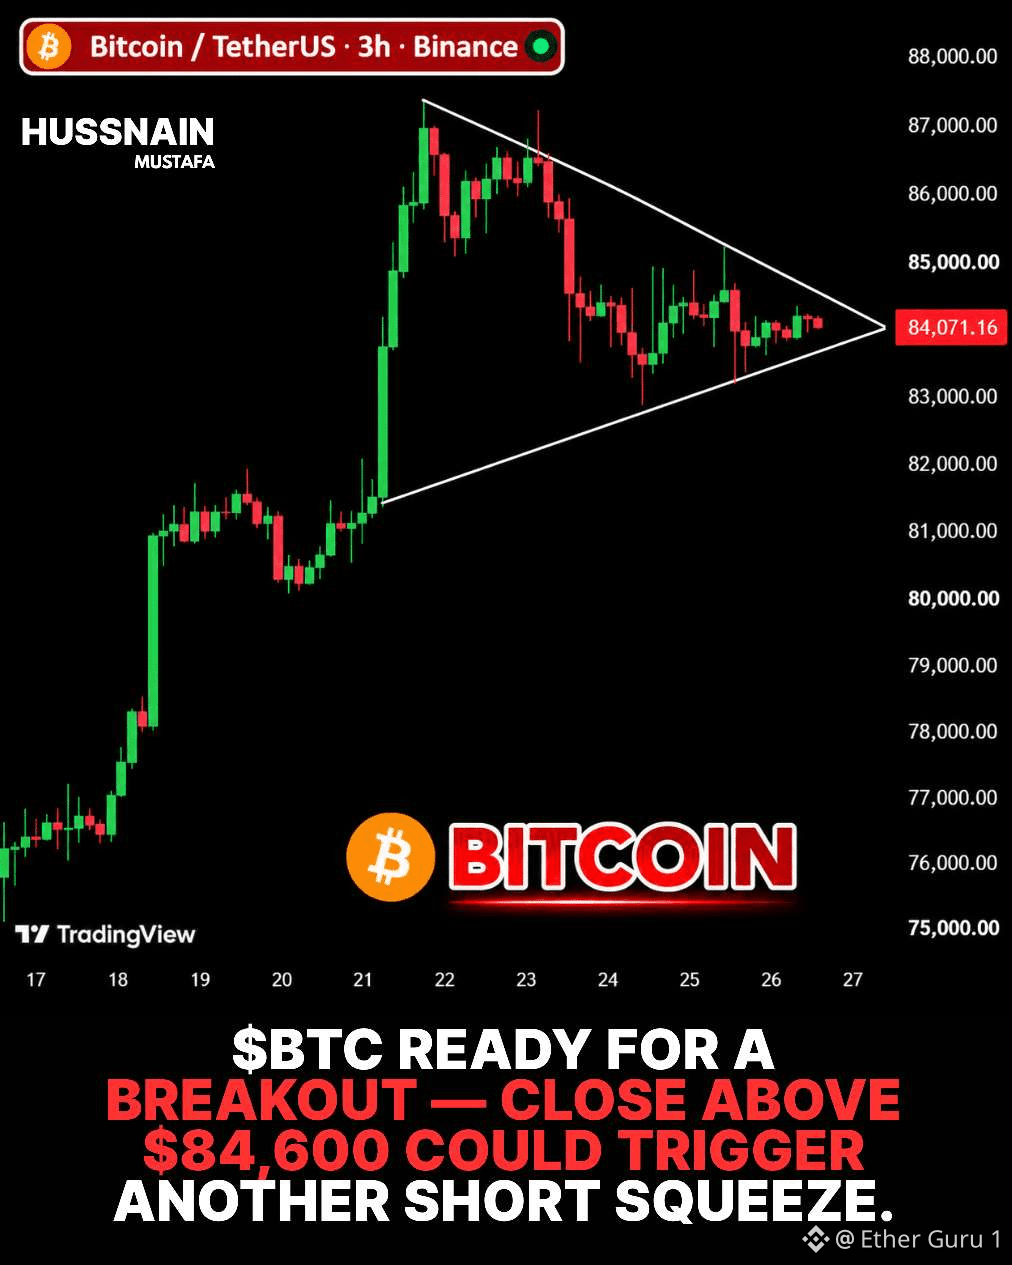
$BTC BITCOIN ALREADY BROKE THE LEVEL.
The more interesting question now is what happens after the squeeze.
BTC pushed through the $84,000 area and reached roughly $87,000 this week.
A major reason for the speed was forced short covering.
When heavily leveraged shorts get liquidated, exchanges close those positions by buying back BTC.
That buying can create a chain reaction:
Higher price.
More liquidations.
More forced buying.
But there’s a catch.
Liquidations are temporary fuel.
Once those positions are gone, the market needs actual buyers to keep the move going.
That makes the next few sessions more informative than the breakout headline itself.
A squeeze can start a move; demand must sustain it.
$BTC BITCOIN ALREADY BROKE THE LEVEL.
The more interesting question now is what happens after the squeeze.
BTC pushed through the $84,000 area and reached roughly $87,000 this week.
A major reason for the speed was forced short covering.
When heavily leveraged shorts get liquidated, exchanges close those positions by buying back BTC.
That buying can create a chain reaction:
Higher price.
More liquidations.
More forced buying.
But there’s a catch.
Liquidations are temporary fuel.
Once those positions are gone, the market needs actual buyers to keep the move going.
That makes the next few sessions more informative than the breakout headline itself.
A squeeze can start a move; demand must sustain it.
The more interesting question now is what happens after the squeeze.
BTC pushed through the $84,000 area and reached roughly $87,000 this week.
A major reason for the speed was forced short covering.
When heavily leveraged shorts get liquidated, exchanges close those positions by buying back BTC.
That buying can create a chain reaction:
Higher price.
More liquidations.
More forced buying.
But there’s a catch.
Liquidations are temporary fuel.
Once those positions are gone, the market needs actual buyers to keep the move going.
That makes the next few sessions more informative than the breakout headline itself.
A squeeze can start a move; demand must sustain it.
52
·
--
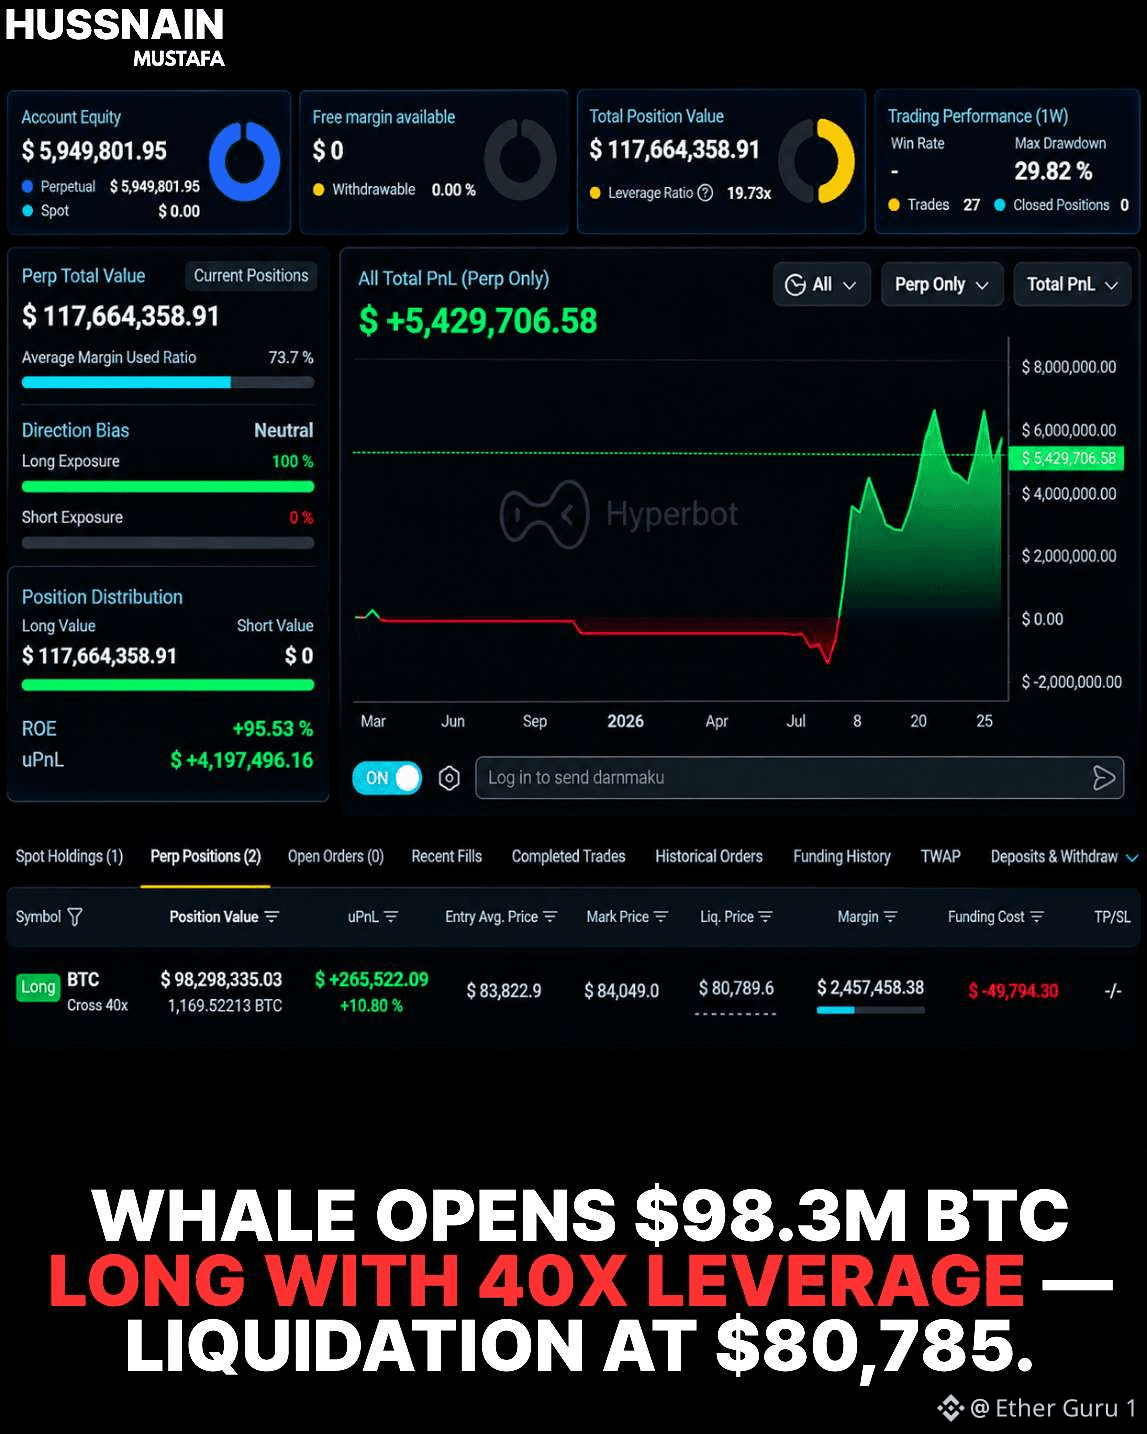
$BTC A WHALE JUST OPENED A $98.3M BITCOIN LONG
The position reportedly uses 40× leverage, with liquidation around $80,785.
At 40× leverage, roughly $2.46 million of margin controls a $98.3 million position.
That creates enormous exposure from relatively little posted capital.
The dangerous part is the distance to liquidation.
If BTC falls toward $80,785, the position can be forced to close, potentially locking in losses for the trader and adding selling pressure during a decline.
Leverage can make a position look huge without requiring equally large upfront capital.
Big positions can carry very small cushions.
$BTC A WHALE JUST OPENED A $98.3M BITCOIN LONG
The position reportedly uses 40× leverage, with liquidation around $80,785.
At 40× leverage, roughly $2.46 million of margin controls a $98.3 million position.
That creates enormous exposure from relatively little posted capital.
The dangerous part is the distance to liquidation.
If BTC falls toward $80,785, the position can be forced to close, potentially locking in losses for the trader and adding selling pressure during a decline.
Leverage can make a position look huge without requiring equally large upfront capital.
Big positions can carry very small cushions.
The position reportedly uses 40× leverage, with liquidation around $80,785.
At 40× leverage, roughly $2.46 million of margin controls a $98.3 million position.
That creates enormous exposure from relatively little posted capital.
The dangerous part is the distance to liquidation.
If BTC falls toward $80,785, the position can be forced to close, potentially locking in losses for the trader and adding selling pressure during a decline.
Leverage can make a position look huge without requiring equally large upfront capital.
Big positions can carry very small cushions.
66
·
--
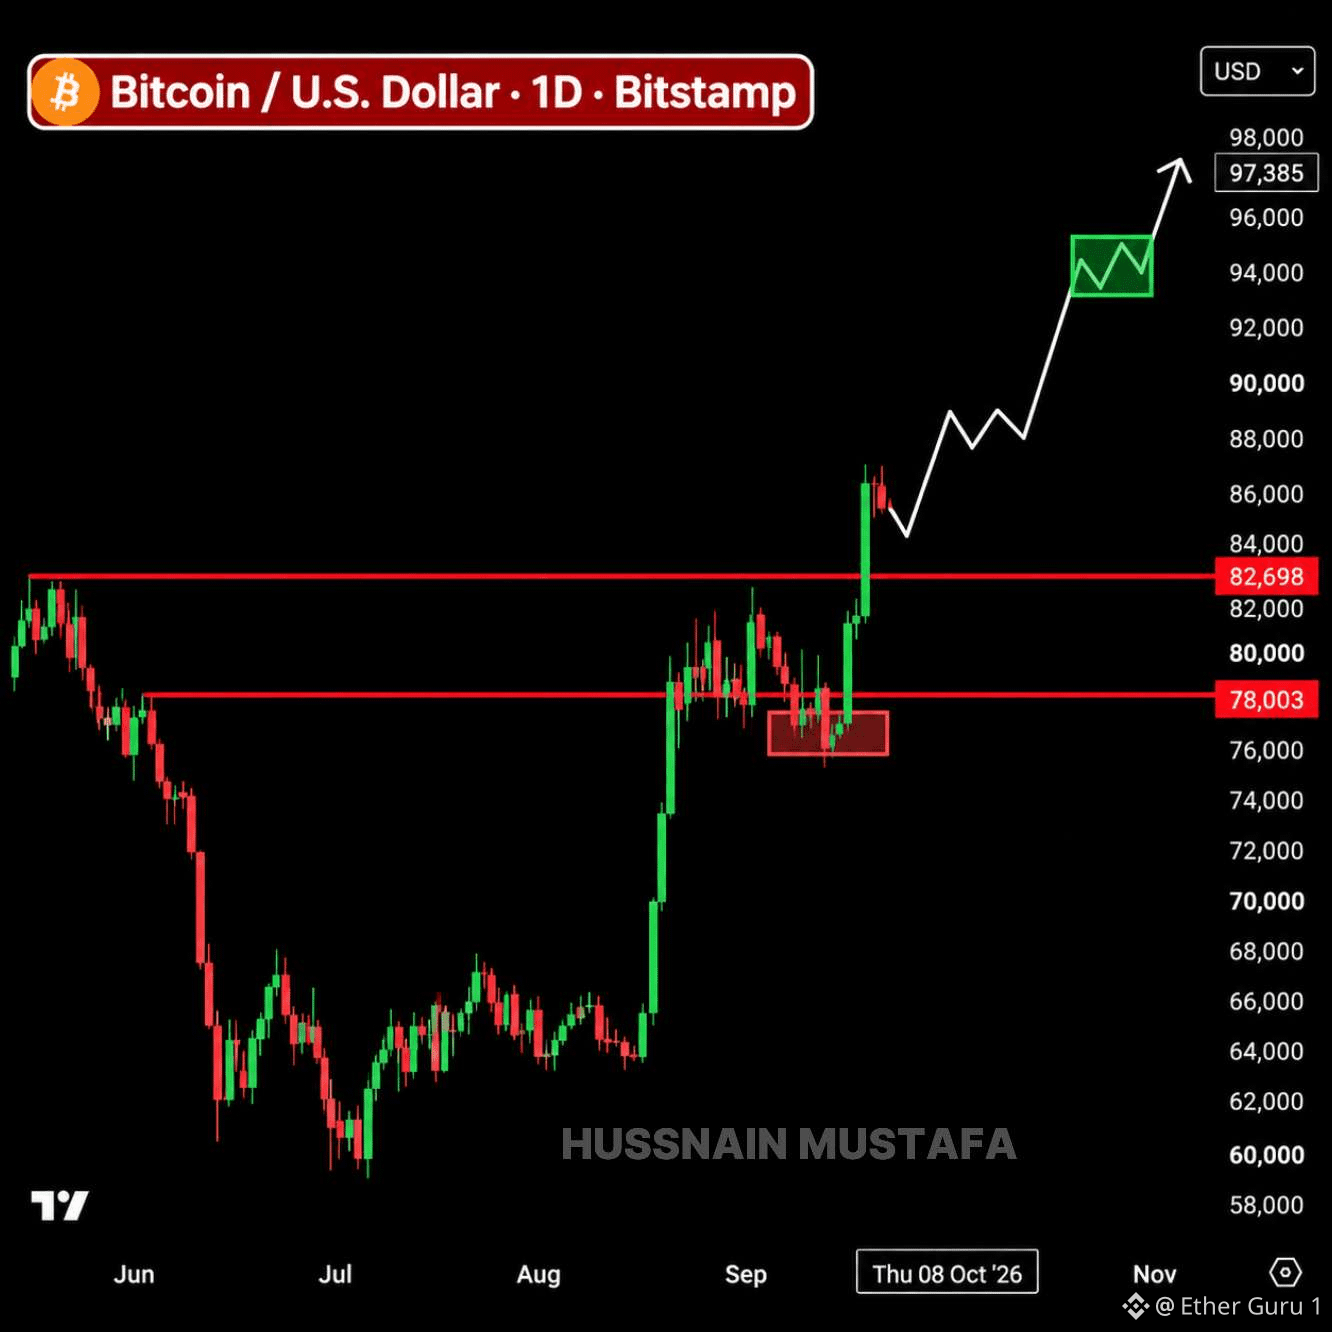
$BTC BITCOIN JUST TURNED TWO OLD RESISTANCE ZONES INTO SUPPORT.
$78K was reclaimed.
Then $82.7K gave way.
Now BTC is trading around $84K, with the market watching whether buyers can keep defending the levels that were previously holding price back.
That distinction matters.
A breakout is one thing.
Holding above it after the excitement fades is another.
If $82.7K continues acting as support, $90K becomes a much more obvious level for traders to watch.
But if that level is lost again, the whole setup starts looking different.
For now, the interesting part isn't the $90K number itself.
It's whether Bitcoin can keep building higher lows underneath it.
The next move depends on what holds.
$BTC BITCOIN JUST TURNED TWO OLD RESISTANCE ZONES INTO SUPPORT.
$78K was reclaimed.
Then $82.7K gave way.
Now BTC is trading around $84K, with the market watching whether buyers can keep defending the levels that were previously holding price back.
That distinction matters.
A breakout is one thing.
Holding above it after the excitement fades is another.
If $82.7K continues acting as support, $90K becomes a much more obvious level for traders to watch.
But if that level is lost again, the whole setup starts looking different.
For now, the interesting part isn't the $90K number itself.
It's whether Bitcoin can keep building higher lows underneath it.
The next move depends on what holds.
$78K was reclaimed.
Then $82.7K gave way.
Now BTC is trading around $84K, with the market watching whether buyers can keep defending the levels that were previously holding price back.
That distinction matters.
A breakout is one thing.
Holding above it after the excitement fades is another.
If $82.7K continues acting as support, $90K becomes a much more obvious level for traders to watch.
But if that level is lost again, the whole setup starts looking different.
For now, the interesting part isn't the $90K number itself.
It's whether Bitcoin can keep building higher lows underneath it.
The next move depends on what holds.
60
·
--
$BTC BITCOIN ETF BUYING JUST GOT SERIOUS AGAIN.
U.S. spot Bitcoin ETFs pulled in roughly $715 million on Tuesday.
That was the fourth straight positive session, bringing the four-day run to about $2.31 billion.
BlackRock's IBIT alone took in roughly $350 million.
Fidelity added another $257 million.
That's important because ETF flows represent actual demand for spot Bitcoin, not just people talking bullish on social media.
After weeks of choppy flows, billions returning in a few sessions is a noticeable change in the tape.
It doesn't guarantee the next move higher.
But if this demand keeps showing up while Bitcoin holds its recent gains, the market is getting a very different signal from the one we saw during the recent selling.
Capital is coming back into Bitcoin.
$BTC BITCOIN ETF BUYING JUST GOT SERIOUS AGAIN.
U.S. spot Bitcoin ETFs pulled in roughly $715 million on Tuesday.
That was the fourth straight positive session, bringing the four-day run to about $2.31 billion.
BlackRock's IBIT alone took in roughly $350 million.
Fidelity added another $257 million.
That's important because ETF flows represent actual demand for spot Bitcoin, not just people talking bullish on social media.
After weeks of choppy flows, billions returning in a few sessions is a noticeable change in the tape.
It doesn't guarantee the next move higher.
But if this demand keeps showing up while Bitcoin holds its recent gains, the market is getting a very different signal from the one we saw during the recent selling.
Capital is coming back into Bitcoin.
U.S. spot Bitcoin ETFs pulled in roughly $715 million on Tuesday.
That was the fourth straight positive session, bringing the four-day run to about $2.31 billion.
BlackRock's IBIT alone took in roughly $350 million.
Fidelity added another $257 million.
That's important because ETF flows represent actual demand for spot Bitcoin, not just people talking bullish on social media.
After weeks of choppy flows, billions returning in a few sessions is a noticeable change in the tape.
It doesn't guarantee the next move higher.
But if this demand keeps showing up while Bitcoin holds its recent gains, the market is getting a very different signal from the one we saw during the recent selling.
Capital is coming back into Bitcoin.

BTC+1,55%
IBITETF+0,90%
68
·
--
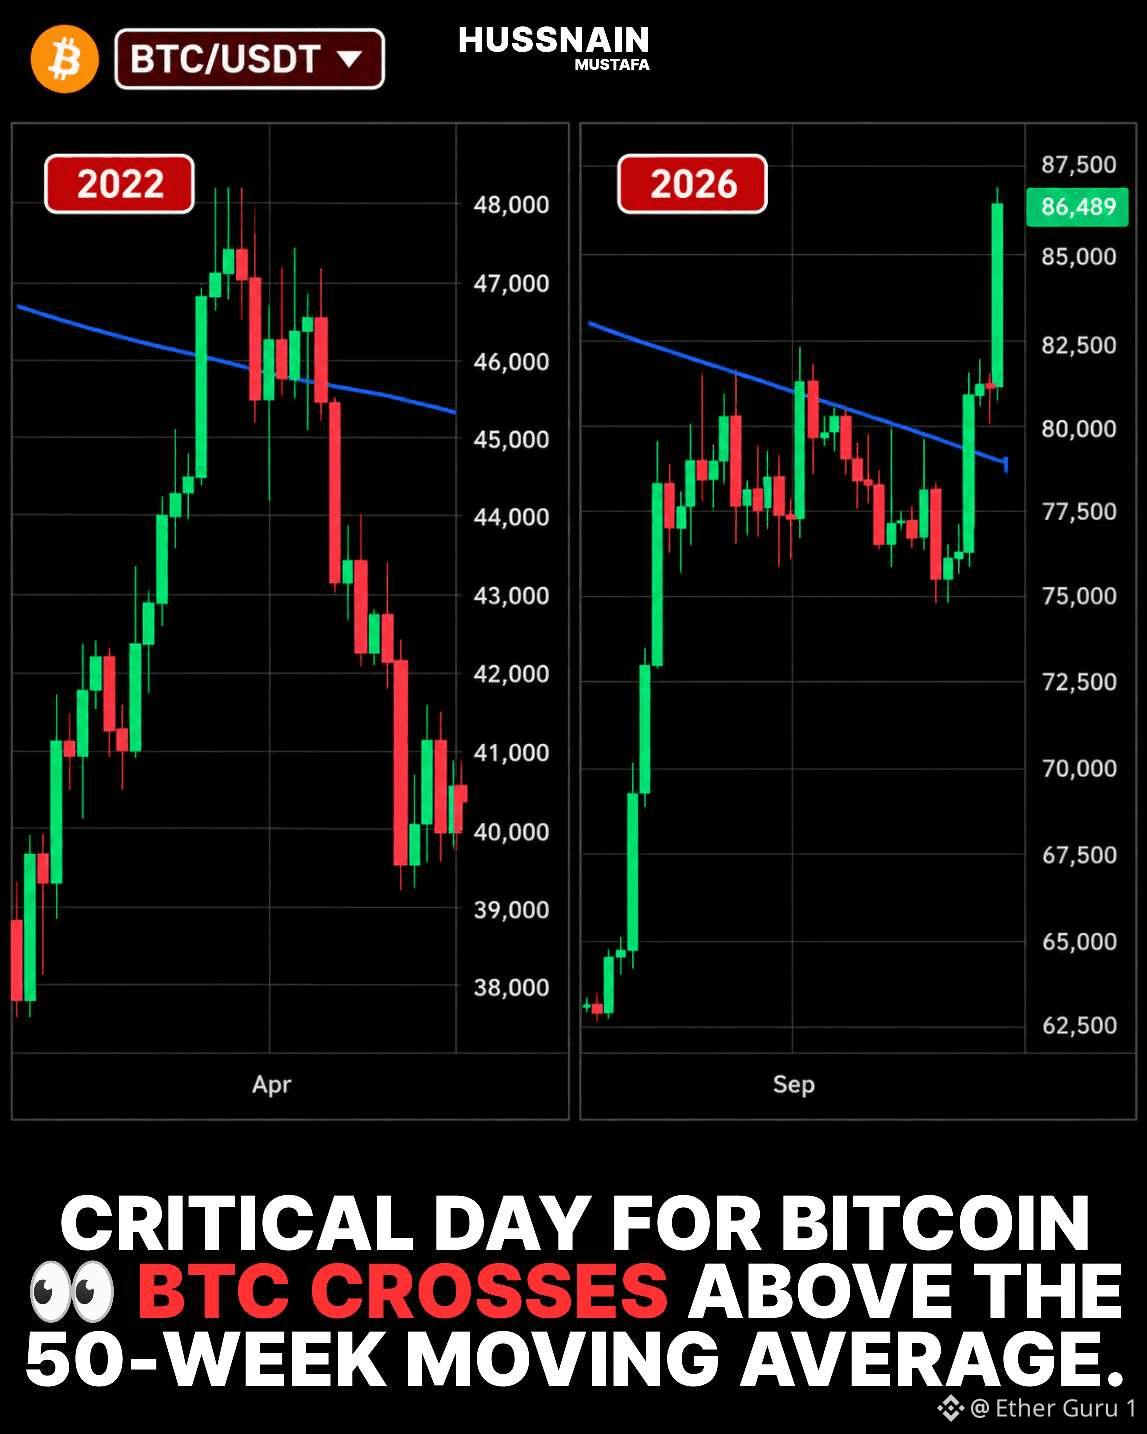
$BTC BITCOIN JUST RECLAIMED A LEVEL THAT MATTERS.
BTC closed around $81,159.
Its 50-week moving average was near $78,788.
That puts Bitcoin roughly 3% above the line.
But history makes this setup interesting.
Galaxy Research found 13 previous weekly reclaims.
Eleven were not followed by a new cycle low.
Two were different.
December 2021 and March 2022 both reclaimed the average before Bitcoin eventually fell much further.
So one successful close is not a guaranteed trend reversal.
The important question now is whether BTC can stay above the moving average.
That is where this signal becomes more useful.
A failed reclaim would turn the same level back into resistance.
A sustained move above it would strengthen the case that the market structure has changed.
Technical indicators work best as evidence, not certainty.
And right now, Bitcoin is sitting directly on one of its most watched long-term trend lines.
The next weekly closes may matter more than today’s breakout.
$BTC BITCOIN JUST RECLAIMED A LEVEL THAT MATTERS.
BTC closed around $81,159.
Its 50-week moving average was near $78,788.
That puts Bitcoin roughly 3% above the line.
But history makes this setup interesting.
Galaxy Research found 13 previous weekly reclaims.
Eleven were not followed by a new cycle low.
Two were different.
December 2021 and March 2022 both reclaimed the average before Bitcoin eventually fell much further.
So one successful close is not a guaranteed trend reversal.
The important question now is whether BTC can stay above the moving average.
That is where this signal becomes more useful.
A failed reclaim would turn the same level back into resistance.
A sustained move above it would strengthen the case that the market structure has changed.
Technical indicators work best as evidence, not certainty.
And right now, Bitcoin is sitting directly on one of its most watched long-term trend lines.
The next weekly closes may matter more than today’s breakout.
BTC closed around $81,159.
Its 50-week moving average was near $78,788.
That puts Bitcoin roughly 3% above the line.
But history makes this setup interesting.
Galaxy Research found 13 previous weekly reclaims.
Eleven were not followed by a new cycle low.
Two were different.
December 2021 and March 2022 both reclaimed the average before Bitcoin eventually fell much further.
So one successful close is not a guaranteed trend reversal.
The important question now is whether BTC can stay above the moving average.
That is where this signal becomes more useful.
A failed reclaim would turn the same level back into resistance.
A sustained move above it would strengthen the case that the market structure has changed.
Technical indicators work best as evidence, not certainty.
And right now, Bitcoin is sitting directly on one of its most watched long-term trend lines.
The next weekly closes may matter more than today’s breakout.
70
·
--
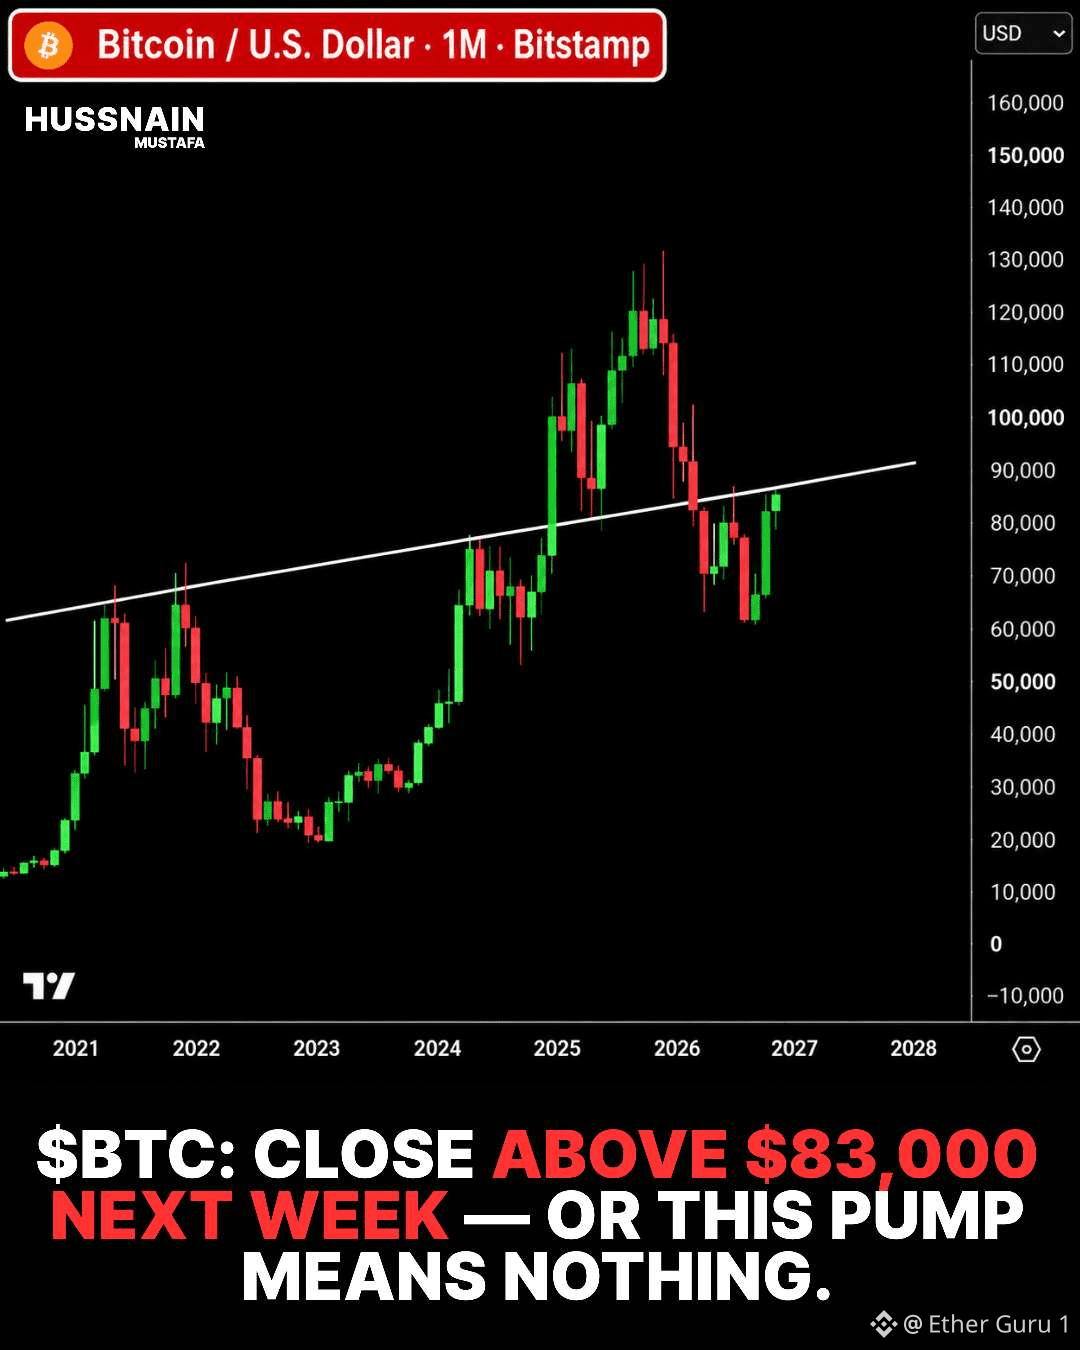
$BTC Bitcoin’s $83K Weekly Test
A weekly close above $83,000 would put Bitcoin at a new short-term milestone.
The level matters because weekly closes show where buyers and sellers finished the period.
An intraday move above $83K tells a different story.
A sustained close would provide stronger evidence of acceptance above that price.
Bitcoin’s recent rebound has already pushed it away from its September lows.
But short-term momentum can disappear quickly in crypto.
Volume, ETF flows, and liquidity can all influence the follow-through.
One closing price cannot confirm an entire market cycle.
The next weekly candle will reveal whether $83K becomes support.
Or whether this rally was simply another temporary move.
$BTC Bitcoin’s $83K Weekly Test
A weekly close above $83,000 would put Bitcoin at a new short-term milestone.
The level matters because weekly closes show where buyers and sellers finished the period.
An intraday move above $83K tells a different story.
A sustained close would provide stronger evidence of acceptance above that price.
Bitcoin’s recent rebound has already pushed it away from its September lows.
But short-term momentum can disappear quickly in crypto.
Volume, ETF flows, and liquidity can all influence the follow-through.
One closing price cannot confirm an entire market cycle.
The next weekly candle will reveal whether $83K becomes support.
Or whether this rally was simply another temporary move.
A weekly close above $83,000 would put Bitcoin at a new short-term milestone.
The level matters because weekly closes show where buyers and sellers finished the period.
An intraday move above $83K tells a different story.
A sustained close would provide stronger evidence of acceptance above that price.
Bitcoin’s recent rebound has already pushed it away from its September lows.
But short-term momentum can disappear quickly in crypto.
Volume, ETF flows, and liquidity can all influence the follow-through.
One closing price cannot confirm an entire market cycle.
The next weekly candle will reveal whether $83K becomes support.
Or whether this rally was simply another temporary move.
63
·
--
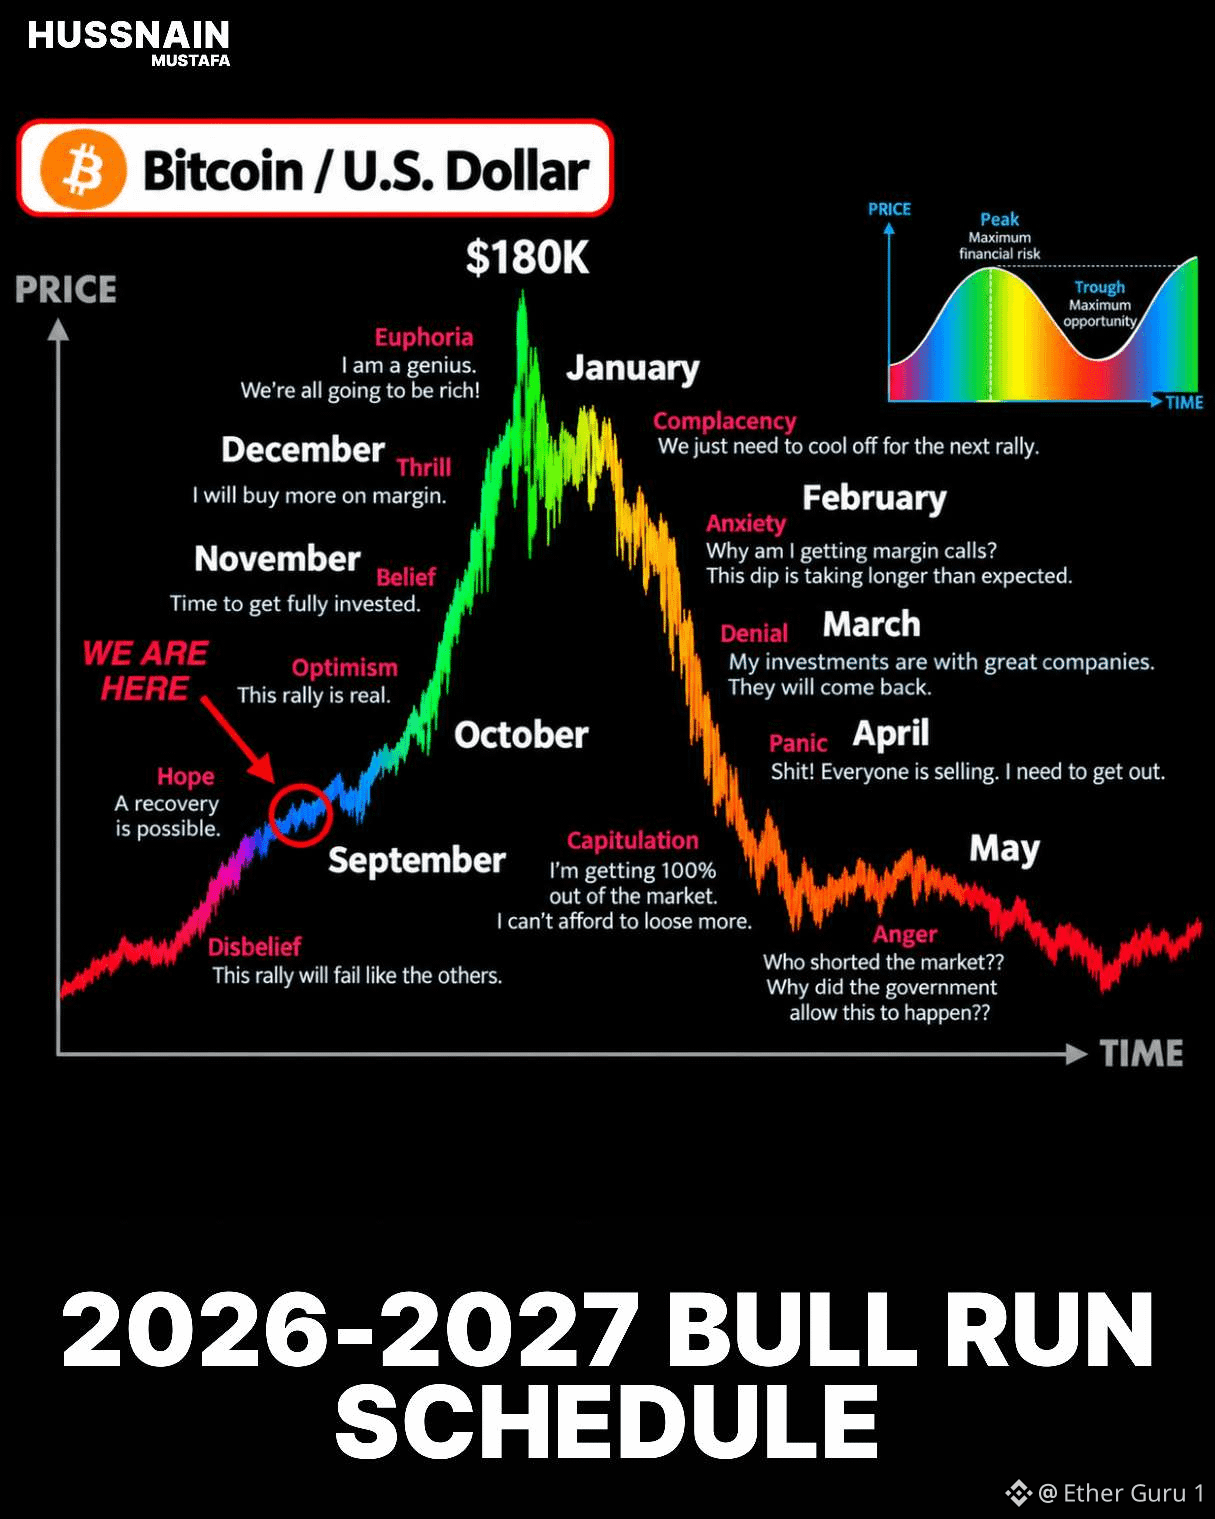
$BTC THERE IS NO MAGIC BITCOIN NUMBER FOR RETIREMENT.
One viral chart says 0.05 BTC at 16.
Then 0.25 BTC by your 30s.
And 5 BTC after age 65.
But those targets are not a financial rule.
Bitcoin has a fixed maximum supply of 21 million coins.
At 5 BTC per person, only about 4.2 million people could theoretically hold that amount.
That ignores lost coins, institutions, governments, exchanges, and uneven ownership.
The bigger lesson is actually about accumulation.
Someone holding 0.10 BTC today owns a different share of the network than someone starting ten years from now.
But Bitcoin’s price can also fall dramatically.
A target measured only in BTC ignores income, debt, emergency savings, taxes, retirement accounts, and overall net worth.
For one person, 0.25 BTC could be a small speculative allocation.
For another, it could represent an outsized concentration of their wealth.
So “winning the game” cannot be defined by one Bitcoin number.
The useful question is how much risk an individual can responsibly carry.
Bitcoin ownership matters, but financial context matters more.
$BTC THERE IS NO MAGIC BITCOIN NUMBER FOR RETIREMENT.
One viral chart says 0.05 BTC at 16.
Then 0.25 BTC by your 30s.
And 5 BTC after age 65.
But those targets are not a financial rule.
Bitcoin has a fixed maximum supply of 21 million coins.
At 5 BTC per person, only about 4.2 million people could theoretically hold that amount.
That ignores lost coins, institutions, governments, exchanges, and uneven ownership.
The bigger lesson is actually about accumulation.
Someone holding 0.10 BTC today owns a different share of the network than someone starting ten years from now.
But Bitcoin’s price can also fall dramatically.
A target measured only in BTC ignores income, debt, emergency savings, taxes, retirement accounts, and overall net worth.
For one person, 0.25 BTC could be a small speculative allocation.
For another, it could represent an outsized concentration of their wealth.
So “winning the game” cannot be defined by one Bitcoin number.
The useful question is how much risk an individual can responsibly carry.
Bitcoin ownership matters, but financial context matters more.
One viral chart says 0.05 BTC at 16.
Then 0.25 BTC by your 30s.
And 5 BTC after age 65.
But those targets are not a financial rule.
Bitcoin has a fixed maximum supply of 21 million coins.
At 5 BTC per person, only about 4.2 million people could theoretically hold that amount.
That ignores lost coins, institutions, governments, exchanges, and uneven ownership.
The bigger lesson is actually about accumulation.
Someone holding 0.10 BTC today owns a different share of the network than someone starting ten years from now.
But Bitcoin’s price can also fall dramatically.
A target measured only in BTC ignores income, debt, emergency savings, taxes, retirement accounts, and overall net worth.
For one person, 0.25 BTC could be a small speculative allocation.
For another, it could represent an outsized concentration of their wealth.
So “winning the game” cannot be defined by one Bitcoin number.
The useful question is how much risk an individual can responsibly carry.
Bitcoin ownership matters, but financial context matters more.
71
·
--
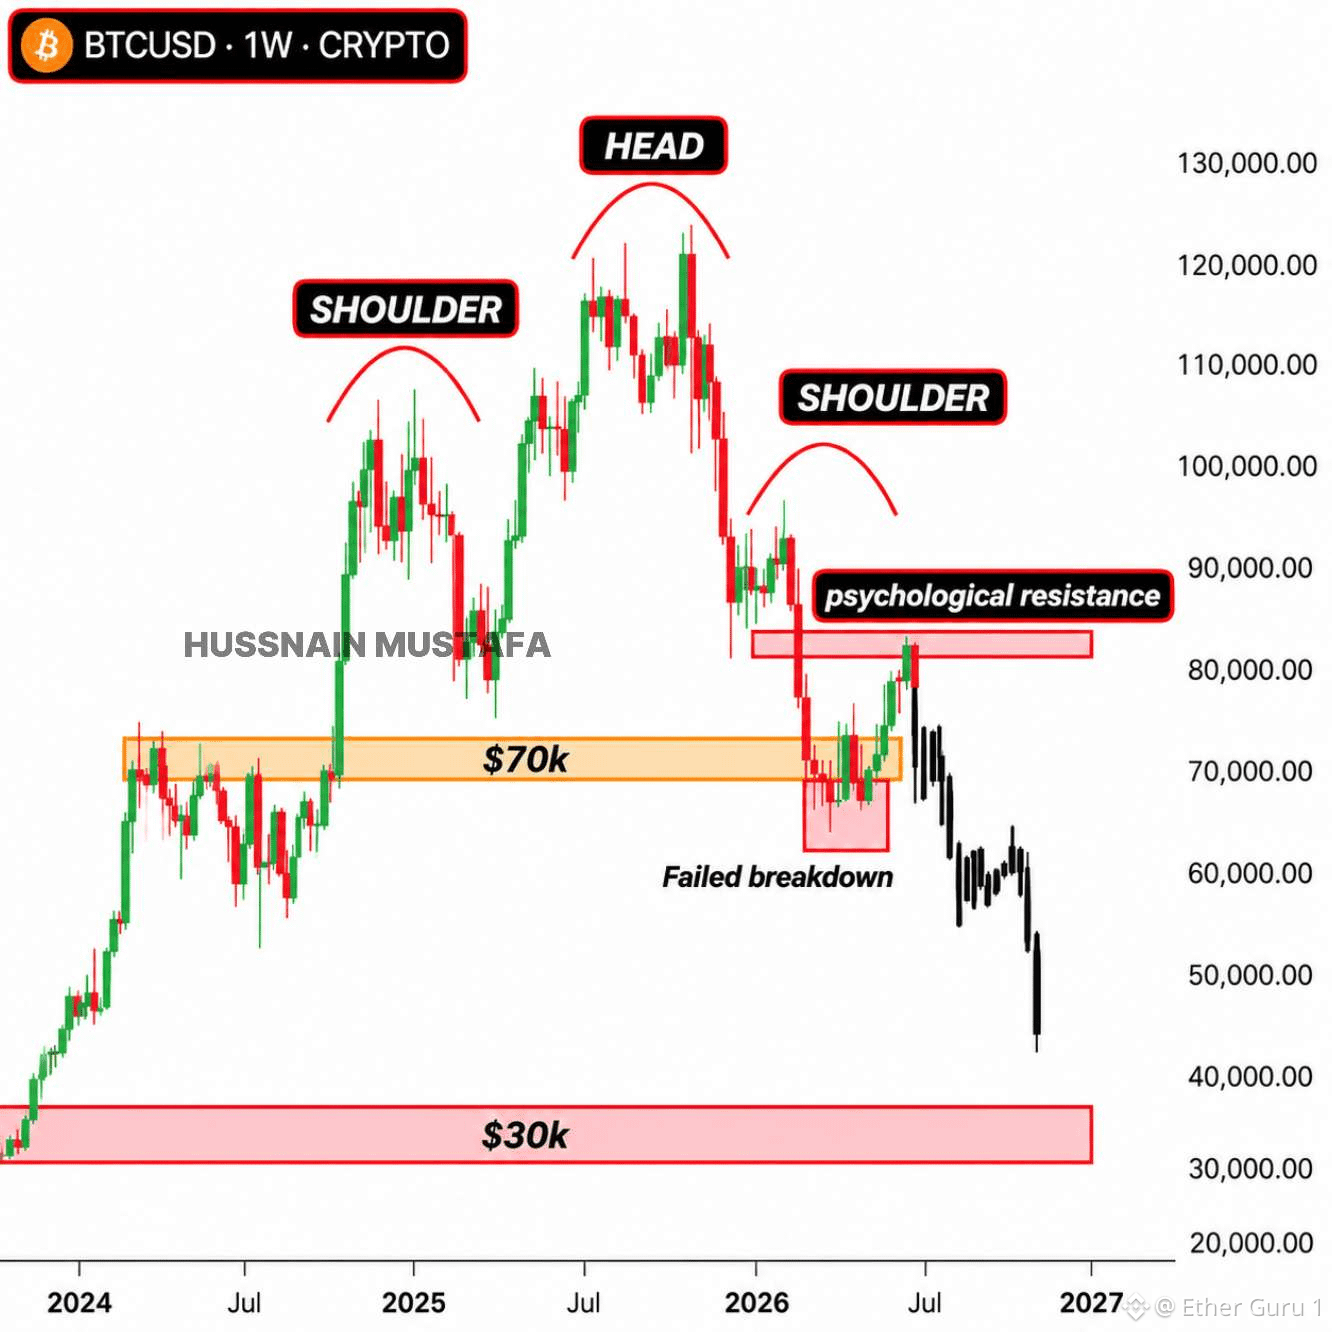
$BTC BITCOIN’S DROP NEEDS MORE THAN ONE EXPLANATION.
A rejected crypto bill can hurt sentiment.
But it does not prove the next price target.
Bitcoin reacts to liquidity, leverage, ETF flows, interest rates, and investor positioning.
A move from $75,000 to $70,000 would be a decline of about 6.7%.
A fall to $63,000 would mean another 10% drop from $70,000.
From $75,000 to $47,000, the loss would reach roughly 37%.
That is why precise forecasts deserve caution.
A trader may correctly identify one major bottom.
That does not make every future prediction reliable.
Markets can follow a pattern for weeks.
Then one policy decision, liquidity shift, or unexpected headline can change the path.
The most important question is not who called the last bottom.
It is whether the current thesis has measurable evidence behind it.
Watch support levels, volume, derivatives leverage, and institutional flows.
Those signals can provide context without promising an exact turning point.
A prediction is not a strategy without risk control.
$BTC BITCOIN’S DROP NEEDS MORE THAN ONE EXPLANATION.
A rejected crypto bill can hurt sentiment.
But it does not prove the next price target.
Bitcoin reacts to liquidity, leverage, ETF flows, interest rates, and investor positioning.
A move from $75,000 to $70,000 would be a decline of about 6.7%.
A fall to $63,000 would mean another 10% drop from $70,000.
From $75,000 to $47,000, the loss would reach roughly 37%.
That is why precise forecasts deserve caution.
A trader may correctly identify one major bottom.
That does not make every future prediction reliable.
Markets can follow a pattern for weeks.
Then one policy decision, liquidity shift, or unexpected headline can change the path.
The most important question is not who called the last bottom.
It is whether the current thesis has measurable evidence behind it.
Watch support levels, volume, derivatives leverage, and institutional flows.
Those signals can provide context without promising an exact turning point.
A prediction is not a strategy without risk control.
A rejected crypto bill can hurt sentiment.
But it does not prove the next price target.
Bitcoin reacts to liquidity, leverage, ETF flows, interest rates, and investor positioning.
A move from $75,000 to $70,000 would be a decline of about 6.7%.
A fall to $63,000 would mean another 10% drop from $70,000.
From $75,000 to $47,000, the loss would reach roughly 37%.
That is why precise forecasts deserve caution.
A trader may correctly identify one major bottom.
That does not make every future prediction reliable.
Markets can follow a pattern for weeks.
Then one policy decision, liquidity shift, or unexpected headline can change the path.
The most important question is not who called the last bottom.
It is whether the current thesis has measurable evidence behind it.
Watch support levels, volume, derivatives leverage, and institutional flows.
Those signals can provide context without promising an exact turning point.
A prediction is not a strategy without risk control.
2
·
--
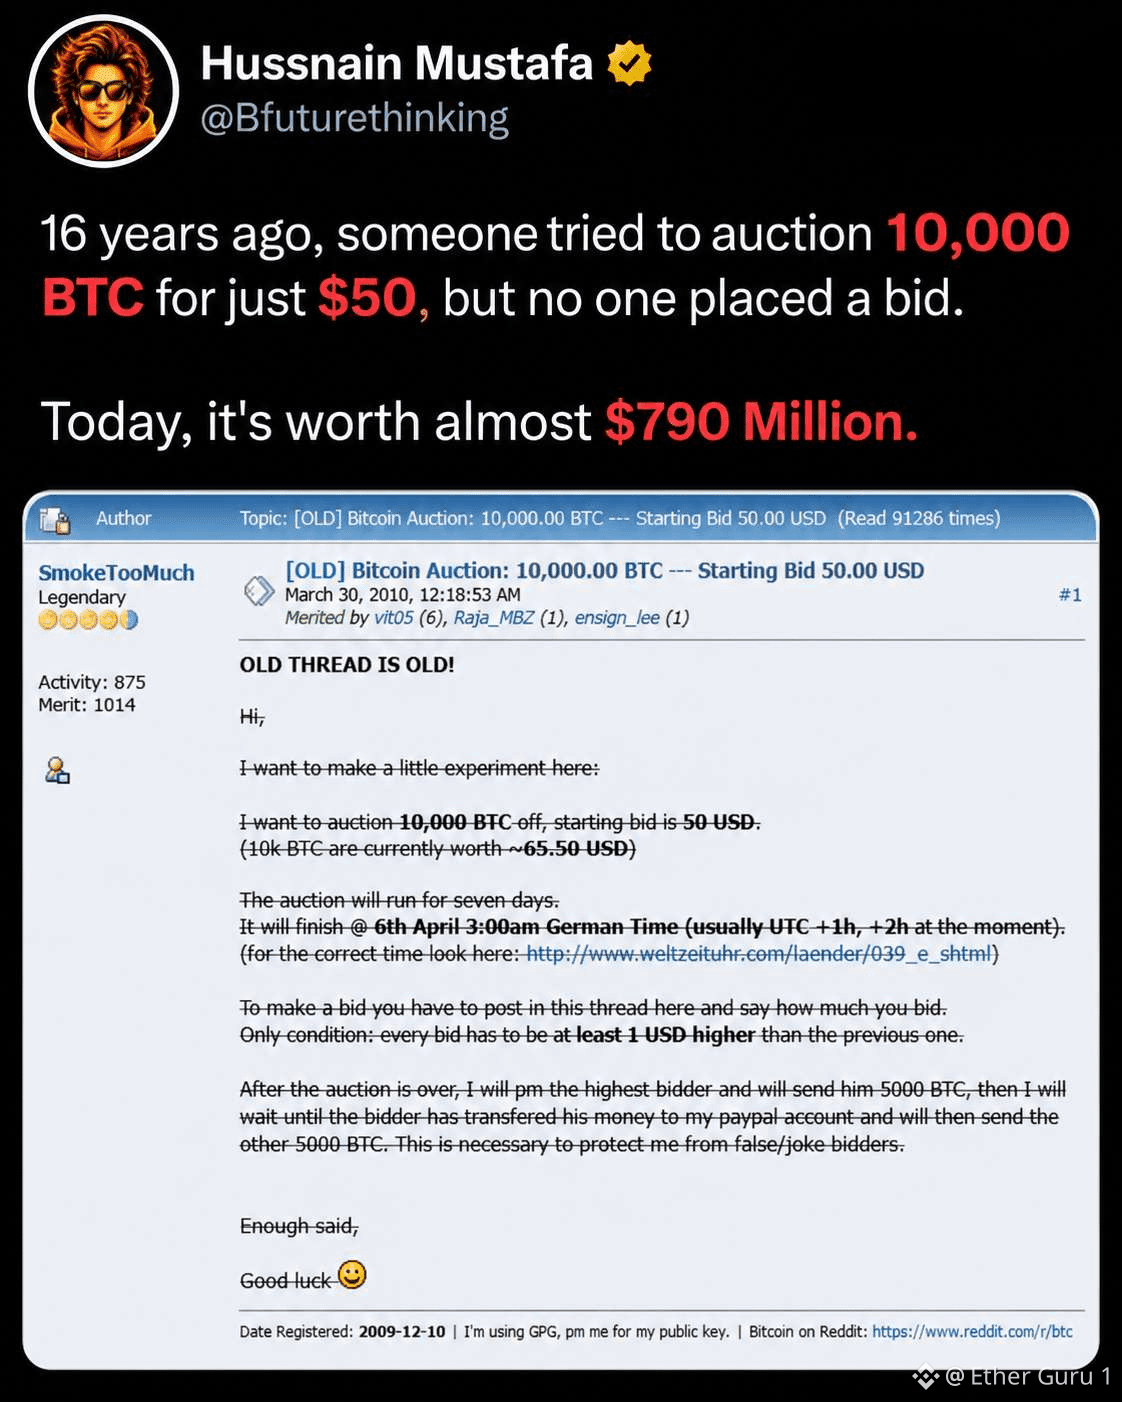
$BTC 10,000 BTC. One $50 auction. Zero bids.
Sixteen years ago, someone reportedly tried to sell a massive Bitcoin stash for just $50.
Nobody wanted it.
Today, that same amount of Bitcoin would be worth hundreds of millions of dollars.
$BTC 10,000 BTC. One $50 auction. Zero bids.
Sixteen years ago, someone reportedly tried to sell a massive Bitcoin stash for just $50.
Nobody wanted it.
Today, that same amount of Bitcoin would be worth hundreds of millions of dollars.
Sixteen years ago, someone reportedly tried to sell a massive Bitcoin stash for just $50.
Nobody wanted it.
Today, that same amount of Bitcoin would be worth hundreds of millions of dollars.
·
--
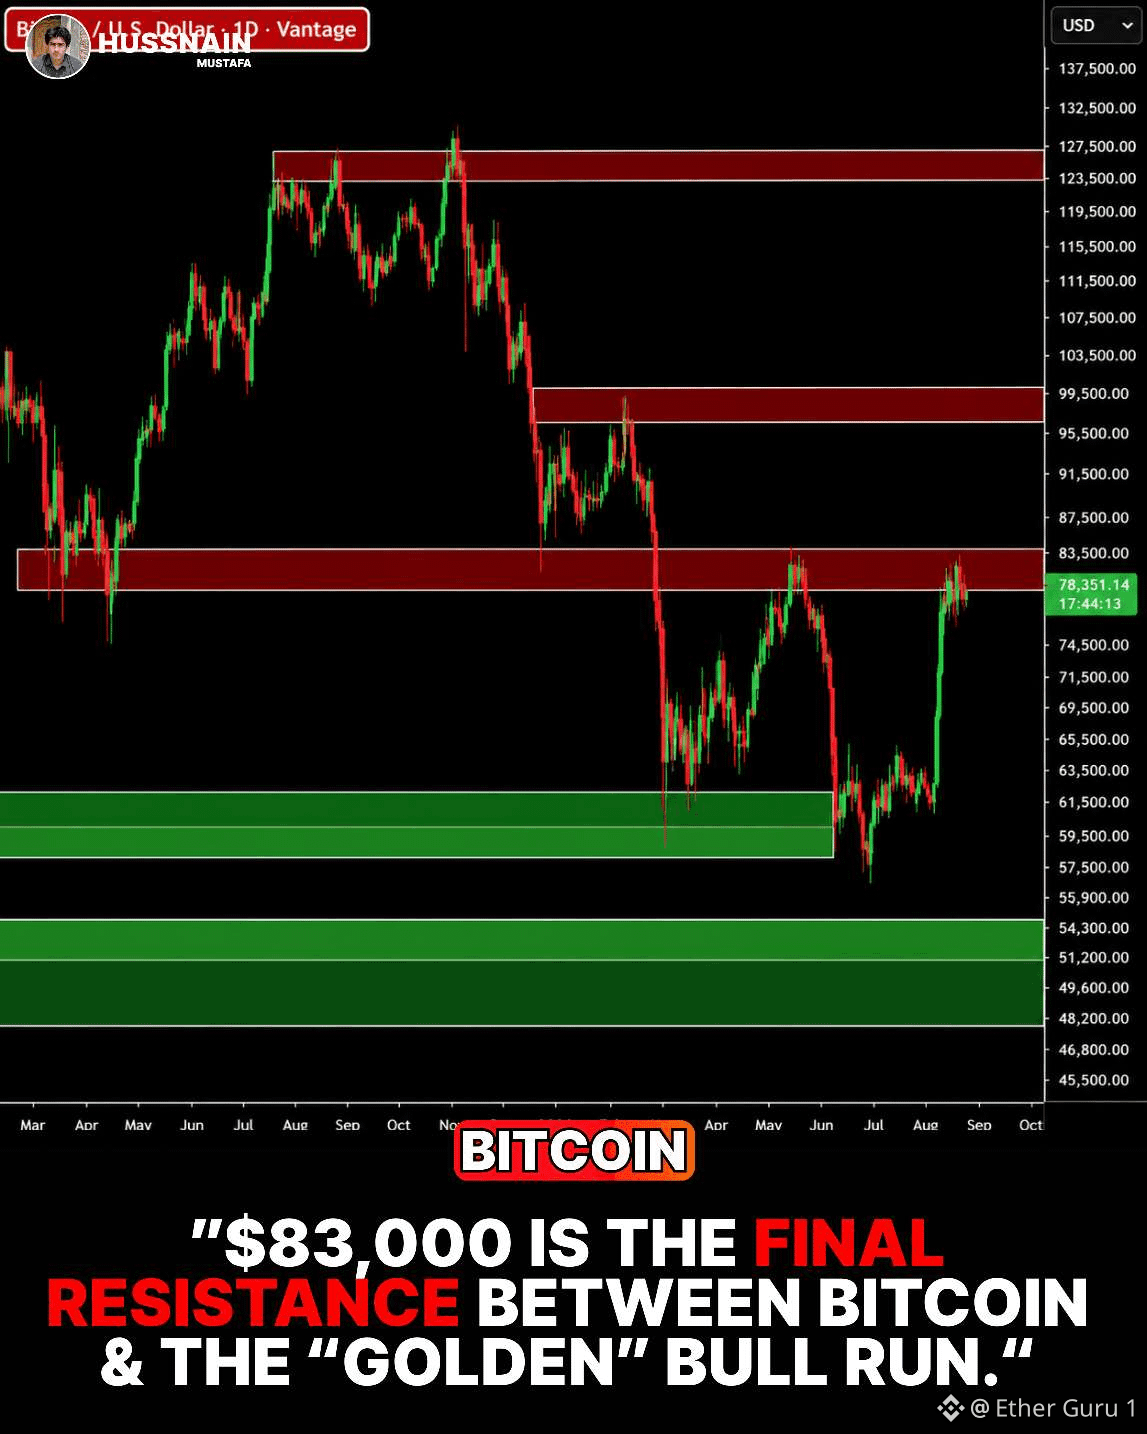
$BTC $83,000 is where the chart gets serious.
That zone lines up with Bitcoin’s May high and sits inside a broader $83K–$86K supply area.
The technical backdrop has improved too.
Bitcoin just printed its first 50-day over 200-day golden cross since May 2025.
But the crossover alone does not confirm a lasting trend reversal.
A decisive break above $83K would remove a major technical barrier.
Until then, sellers still control the most important overhead zone.
$83K remains the gate.
$BTC $83,000 is where the chart gets serious.
That zone lines up with Bitcoin’s May high and sits inside a broader $83K–$86K supply area.
The technical backdrop has improved too.
Bitcoin just printed its first 50-day over 200-day golden cross since May 2025.
But the crossover alone does not confirm a lasting trend reversal.
A decisive break above $83K would remove a major technical barrier.
Until then, sellers still control the most important overhead zone.
$83K remains the gate.
That zone lines up with Bitcoin’s May high and sits inside a broader $83K–$86K supply area.
The technical backdrop has improved too.
Bitcoin just printed its first 50-day over 200-day golden cross since May 2025.
But the crossover alone does not confirm a lasting trend reversal.
A decisive break above $83K would remove a major technical barrier.
Until then, sellers still control the most important overhead zone.
$83K remains the gate.
52
·
--
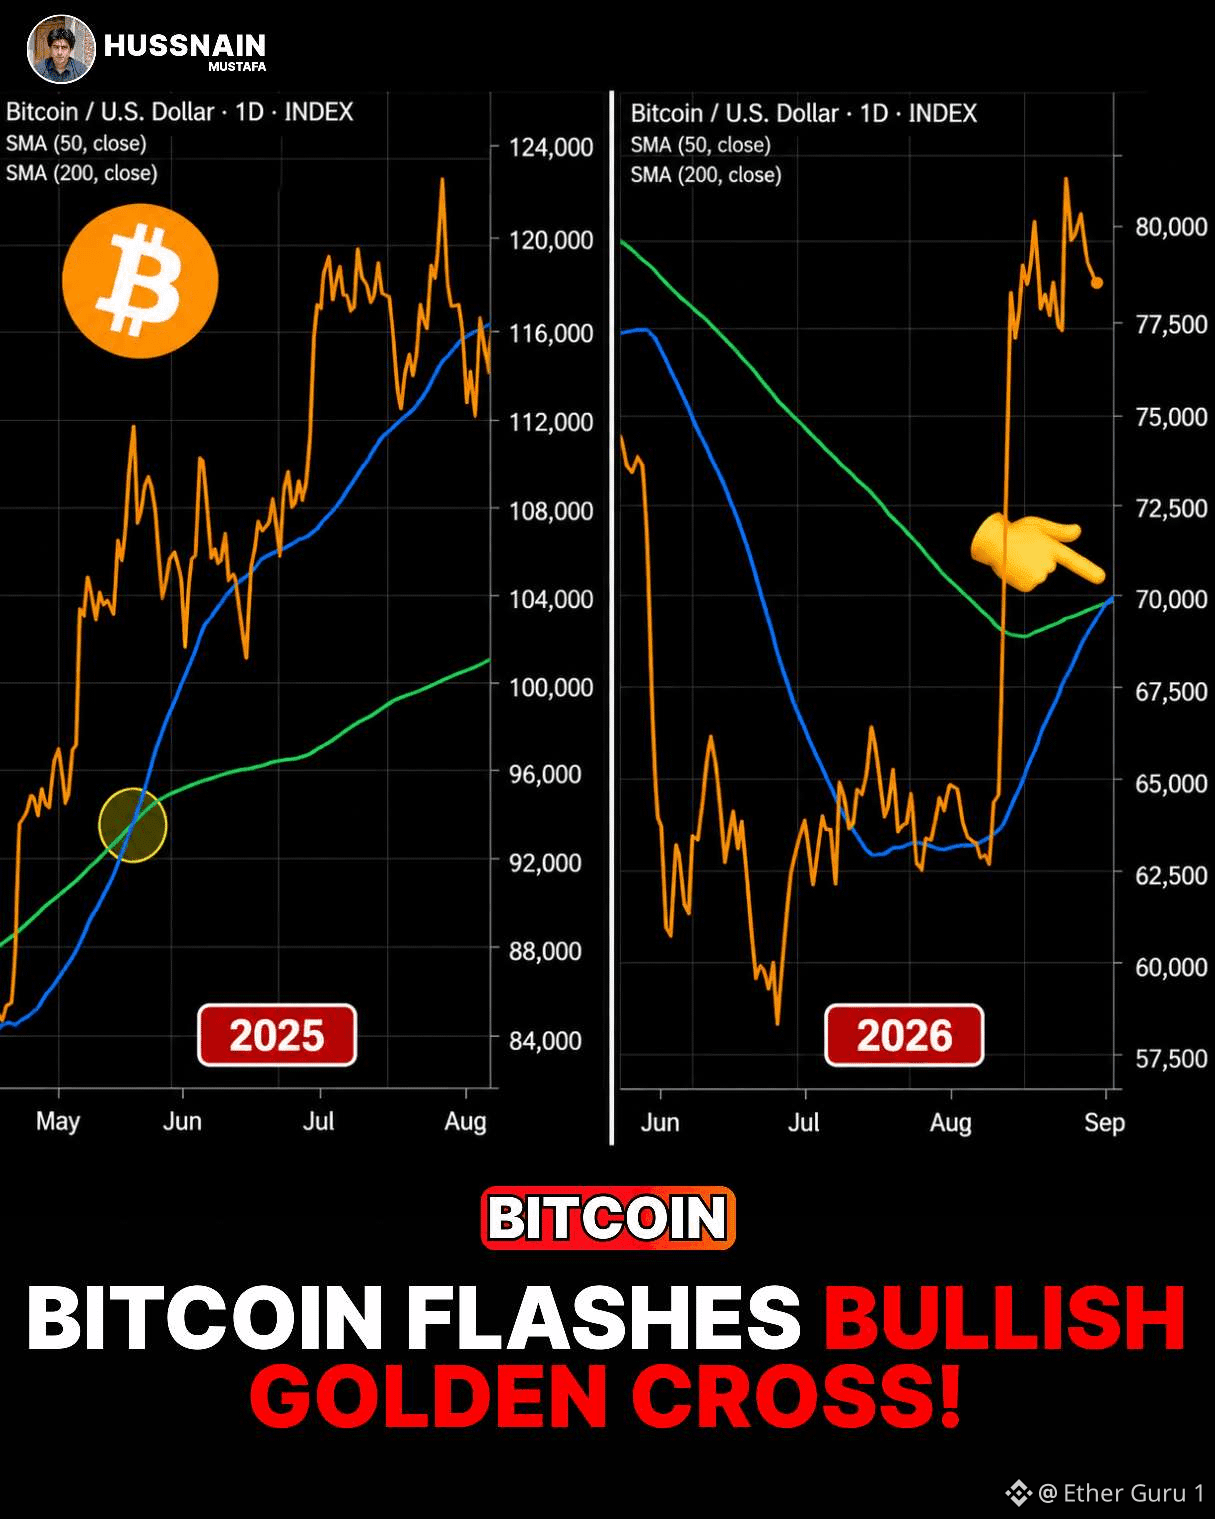
$BTC Bitcoin is flashing a golden-cross setup again.
The same technical pattern appeared in May 2025 before BTC eventually climbed to its $126,200 all-time high.
This time, the chart is again drawing attention to the relationship between Bitcoin’s major moving averages.
But history is a reference, not a promise.
Golden crosses can confirm improving momentum, yet they do not guarantee another straight-line rally. Recent technical analysis still points to major resistance levels that BTC would need to overcome.
The signal is back.
Now price must respond
$BTC Bitcoin is flashing a golden-cross setup again.
The same technical pattern appeared in May 2025 before BTC eventually climbed to its $126,200 all-time high.
This time, the chart is again drawing attention to the relationship between Bitcoin’s major moving averages.
But history is a reference, not a promise.
Golden crosses can confirm improving momentum, yet they do not guarantee another straight-line rally. Recent technical analysis still points to major resistance levels that BTC would need to overcome.
The signal is back.
Now price must respond
The same technical pattern appeared in May 2025 before BTC eventually climbed to its $126,200 all-time high.
This time, the chart is again drawing attention to the relationship between Bitcoin’s major moving averages.
But history is a reference, not a promise.
Golden crosses can confirm improving momentum, yet they do not guarantee another straight-line rally. Recent technical analysis still points to major resistance levels that BTC would need to overcome.
The signal is back.
Now price must respond
73
·
--
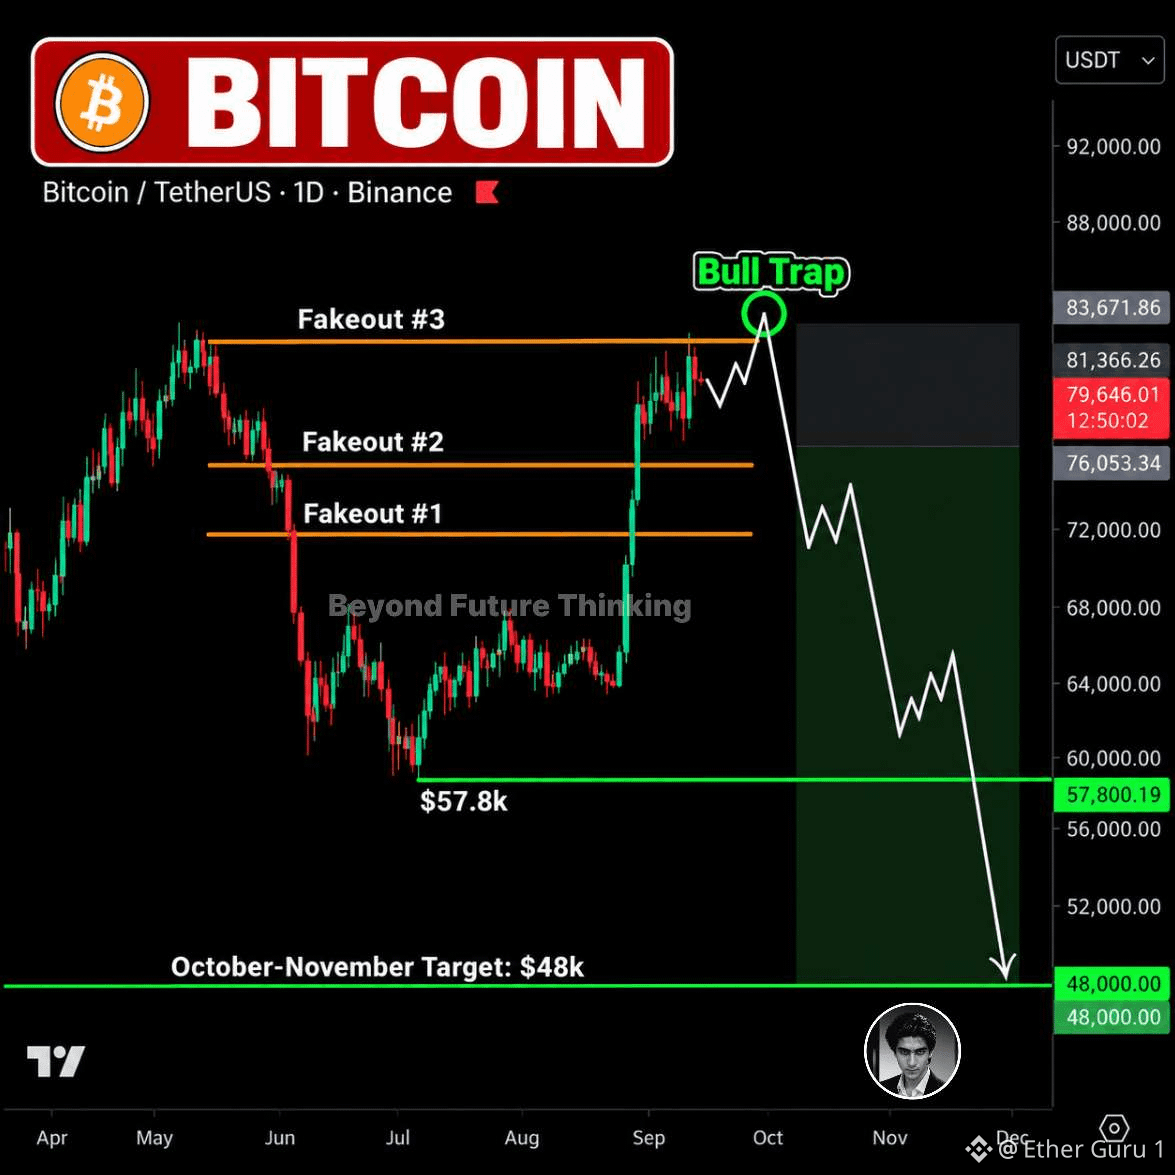
$BTC The $83K Area Could Decide Bitcoin’s Next Major Move
Bitcoin recently pushed back toward $82K, pulling bullish sentiment back into the market.
But there is still a major liquidity zone sitting around $83K.
That means price could potentially make one more move higher before the real direction becomes clear.
My current roadmap remains:
$79K → $83K → $68K
If the market loses momentum after that bounce, the next downside levels I’m watching are:
$57.8K → $49K
The reason I’m not treating the latest bounce as a confirmed recovery is simple.
A sharp move upward can pull new buyers back into the market, especially after weeks of fear and heavy selling.
That liquidity near $83K could become an important area for the next major reaction.
If Bitcoin gets rejected there, the downside structure could quickly come back into focus.
I’ve been watching these major levels closely throughout the cycle, including the moves from $98K → $60K and $83K → $57K.
That doesn’t make every future call guaranteed.
But price action, liquidity and key levels still matter more than emotion.
The next few moves could reveal whether this was a genuine recovery — or simply another trap before a deeper flush.
$83K is the line.
$BTC The $83K Area Could Decide Bitcoin’s Next Major Move
Bitcoin recently pushed back toward $82K, pulling bullish sentiment back into the market.
But there is still a major liquidity zone sitting around $83K.
That means price could potentially make one more move higher before the real direction becomes clear.
My current roadmap remains:
$79K → $83K → $68K
If the market loses momentum after that bounce, the next downside levels I’m watching are:
$57.8K → $49K
The reason I’m not treating the latest bounce as a confirmed recovery is simple.
A sharp move upward can pull new buyers back into the market, especially after weeks of fear and heavy selling.
That liquidity near $83K could become an important area for the next major reaction.
If Bitcoin gets rejected there, the downside structure could quickly come back into focus.
I’ve been watching these major levels closely throughout the cycle, including the moves from $98K → $60K and $83K → $57K.
That doesn’t make every future call guaranteed.
But price action, liquidity and key levels still matter more than emotion.
The next few moves could reveal whether this was a genuine recovery — or simply another trap before a deeper flush.
$83K is the line.
Bitcoin recently pushed back toward $82K, pulling bullish sentiment back into the market.
But there is still a major liquidity zone sitting around $83K.
That means price could potentially make one more move higher before the real direction becomes clear.
My current roadmap remains:
$79K → $83K → $68K
If the market loses momentum after that bounce, the next downside levels I’m watching are:
$57.8K → $49K
The reason I’m not treating the latest bounce as a confirmed recovery is simple.
A sharp move upward can pull new buyers back into the market, especially after weeks of fear and heavy selling.
That liquidity near $83K could become an important area for the next major reaction.
If Bitcoin gets rejected there, the downside structure could quickly come back into focus.
I’ve been watching these major levels closely throughout the cycle, including the moves from $98K → $60K and $83K → $57K.
That doesn’t make every future call guaranteed.
But price action, liquidity and key levels still matter more than emotion.
The next few moves could reveal whether this was a genuine recovery — or simply another trap before a deeper flush.
$83K is the line.
134
·
--
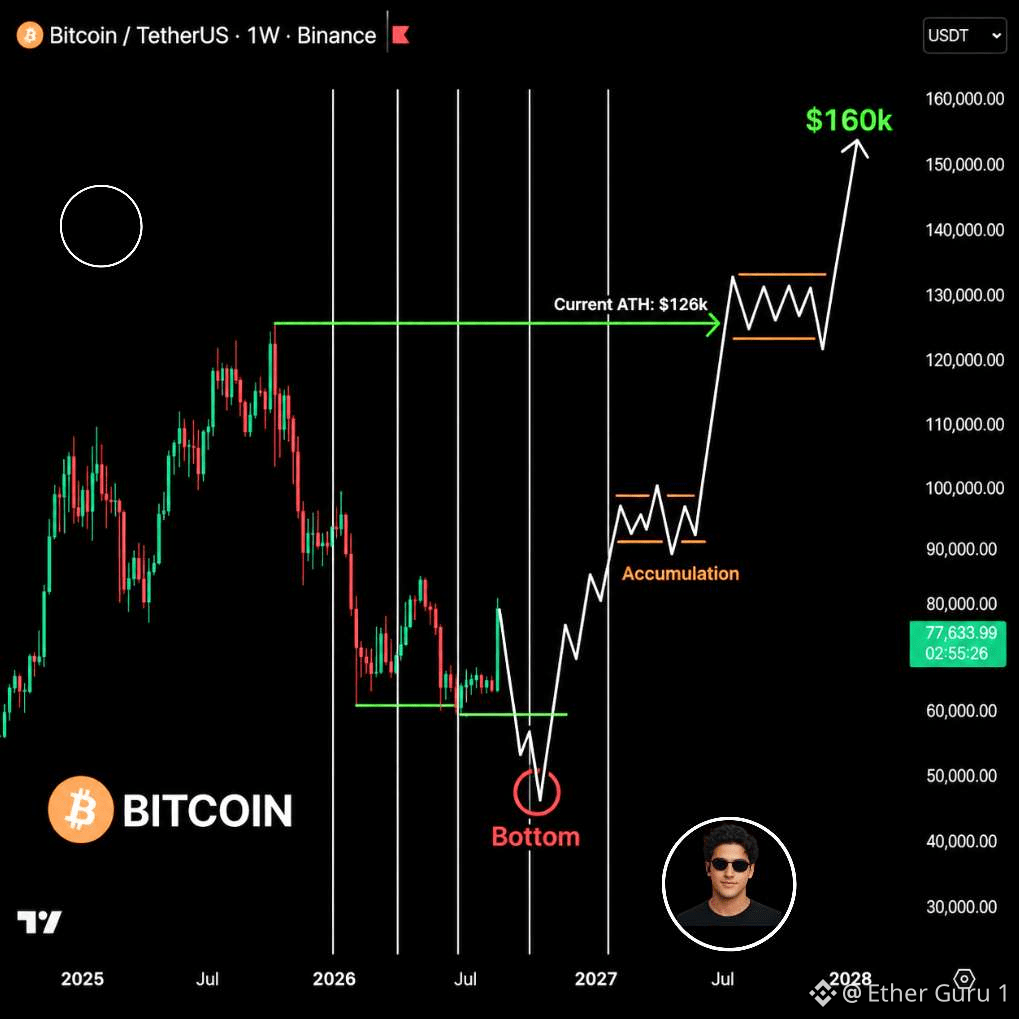
$BTC 🚨 THE 2026–27 MACRO RESET
Q3 2026 could become a major test for risk assets if monetary policy and crypto sentiment weaken together.
BTC: potential bottoming phase
SPX: ~7.3K downside scenario
A new Fed leadership cycle could reshape expectations around rates, liquidity and financial conditions.
The first rate cut would not automatically mean a bull market.
If recession fears intensify, markets could initially interpret easing as a response to economic weakness.
Crypto sentiment: extreme-fear scenario
Q4 could bring a different setup if Bitcoin reclaims important resistance and institutional demand strengthens.
BTC: above $84K
Regulatory clarity could become another catalyst if the CLARITY Act ultimately becomes law.
AI infrastructure and crypto adoption could also create new narratives for capital rotation.
2027 BTC scenario: $160K+
Three Fed cuts would represent a meaningful shift in monetary conditions if economic weakness becomes pronounced.
Bitcoin could increasingly be viewed alongside other scarce assets during periods of monetary uncertainty.
But the path will not be linear.
A 2x return within 12 months would require Bitcoin to reach roughly double the Q3 entry level.
That remains a scenario, not a guaranteed outcome.
The strongest opportunities often appear when sentiment is weakest.
Fear creates the setup.
Liquidity decides the timing.
$BTC 🚨 THE 2026–27 MACRO RESET
Q3 2026 could become a major test for risk assets if monetary policy and crypto sentiment weaken together.
BTC: potential bottoming phase
SPX: ~7.3K downside scenario
A new Fed leadership cycle could reshape expectations around rates, liquidity and financial conditions.
The first rate cut would not automatically mean a bull market.
If recession fears intensify, markets could initially interpret easing as a response to economic weakness.
Crypto sentiment: extreme-fear scenario
Q4 could bring a different setup if Bitcoin reclaims important resistance and institutional demand strengthens.
BTC: above $84K
Regulatory clarity could become another catalyst if the CLARITY Act ultimately becomes law.
AI infrastructure and crypto adoption could also create new narratives for capital rotation.
2027 BTC scenario: $160K+
Three Fed cuts would represent a meaningful shift in monetary conditions if economic weakness becomes pronounced.
Bitcoin could increasingly be viewed alongside other scarce assets during periods of monetary uncertainty.
But the path will not be linear.
A 2x return within 12 months would require Bitcoin to reach roughly double the Q3 entry level.
That remains a scenario, not a guaranteed outcome.
The strongest opportunities often appear when sentiment is weakest.
Fear creates the setup.
Liquidity decides the timing.
Q3 2026 could become a major test for risk assets if monetary policy and crypto sentiment weaken together.
BTC: potential bottoming phase
SPX: ~7.3K downside scenario
A new Fed leadership cycle could reshape expectations around rates, liquidity and financial conditions.
The first rate cut would not automatically mean a bull market.
If recession fears intensify, markets could initially interpret easing as a response to economic weakness.
Crypto sentiment: extreme-fear scenario
Q4 could bring a different setup if Bitcoin reclaims important resistance and institutional demand strengthens.
BTC: above $84K
Regulatory clarity could become another catalyst if the CLARITY Act ultimately becomes law.
AI infrastructure and crypto adoption could also create new narratives for capital rotation.
2027 BTC scenario: $160K+
Three Fed cuts would represent a meaningful shift in monetary conditions if economic weakness becomes pronounced.
Bitcoin could increasingly be viewed alongside other scarce assets during periods of monetary uncertainty.
But the path will not be linear.
A 2x return within 12 months would require Bitcoin to reach roughly double the Q3 entry level.
That remains a scenario, not a guaranteed outcome.
The strongest opportunities often appear when sentiment is weakest.
Fear creates the setup.
Liquidity decides the timing.
118
·
--
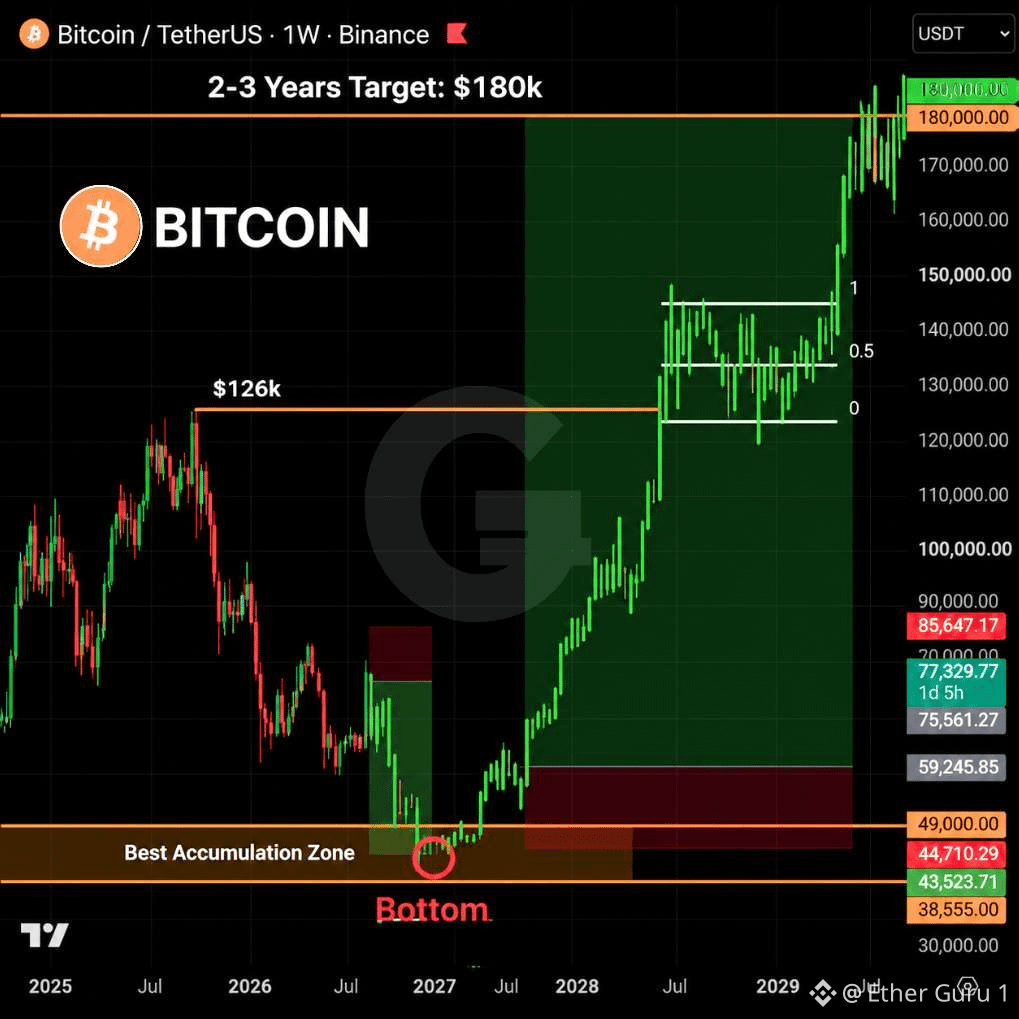
$BTC $BTC ROADMAP 🧭
Bitcoin’s Current Setup Is Being Mapped Around A $77K Starting Point.
The Bear-Case Projection Targets $39K–$49K For A Potential Cycle-Bottom Zone.
That Would Represent A Possible 36%–49% Drawdown From $77K.
The Long-Term Bull Case Then Targets $180K Over The Following 2–3 Years.
From A $45K Midpoint, $180K Would Require Roughly 4× Growth.
This Is A Technical Scenario — The $39K–$49K Zone Is Not A Confirmed Bottom.
The Strategy Is To Watch Fear, Liquidity And Structure Before Treating The Zone As An Accumulation Opportunity.
$BTC $BTC ROADMAP 🧭
Bitcoin’s Current Setup Is Being Mapped Around A $77K Starting Point.
The Bear-Case Projection Targets $39K–$49K For A Potential Cycle-Bottom Zone.
That Would Represent A Possible 36%–49% Drawdown From $77K.
The Long-Term Bull Case Then Targets $180K Over The Following 2–3 Years.
From A $45K Midpoint, $180K Would Require Roughly 4× Growth.
This Is A Technical Scenario — The $39K–$49K Zone Is Not A Confirmed Bottom.
The Strategy Is To Watch Fear, Liquidity And Structure Before Treating The Zone As An Accumulation Opportunity.
Bitcoin’s Current Setup Is Being Mapped Around A $77K Starting Point.
The Bear-Case Projection Targets $39K–$49K For A Potential Cycle-Bottom Zone.
That Would Represent A Possible 36%–49% Drawdown From $77K.
The Long-Term Bull Case Then Targets $180K Over The Following 2–3 Years.
From A $45K Midpoint, $180K Would Require Roughly 4× Growth.
This Is A Technical Scenario — The $39K–$49K Zone Is Not A Confirmed Bottom.
The Strategy Is To Watch Fear, Liquidity And Structure Before Treating The Zone As An Accumulation Opportunity.
91
·
--
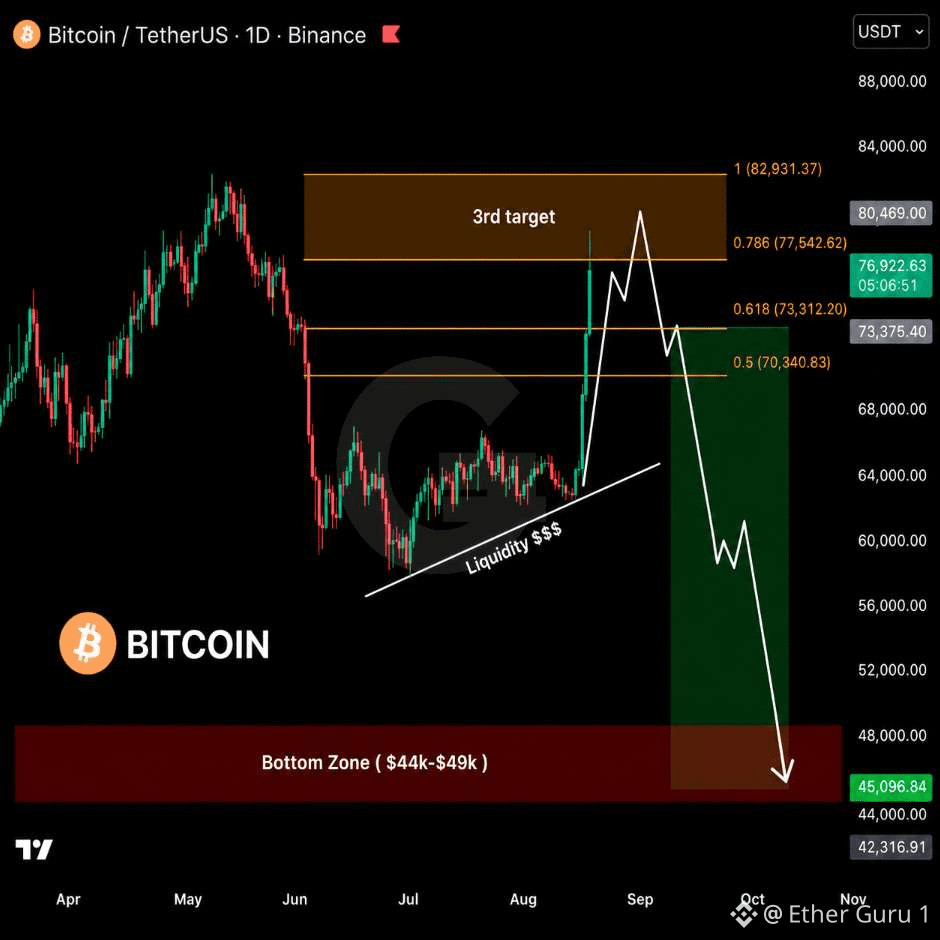
$BTC TACTICAL FLIP 🧭
All Previous $BTC Long Targets Have Now Been Hit — The Strategy Has Shifted Toward A Potential Short Setup.
$52K–$63K Long Zone: DONE ✅
1H/4H Bearish Structure Break: DONE ✅
0.618–0.786 Fibonacci Zone: DONE ✅
Bull Trap Formation: DONE ✅
Next Trigger: Build Shorts Only After Bearish Structure Confirmation.
The Downside Roadmap Targets A Liquidity Sweep Below $57K.
Final Flush Scenario: $42K–$49K.
BTC Completed The Entire Long-Side Roadmap In Just 2 Days, Accelerated By Heavy Short Liquidations.
The Latest BTC Surge Has Also Triggered Major Breakouts Across Multiple Altcoins.
The Strategy Now Depends On Whether BTC Prints A Confirmed Lower High + Bearish Structure Before The Next Move.
$BTC TACTICAL FLIP 🧭
All Previous $BTC Long Targets Have Now Been Hit — The Strategy Has Shifted Toward A Potential Short Setup.
$52K–$63K Long Zone: DONE ✅
1H/4H Bearish Structure Break: DONE ✅
0.618–0.786 Fibonacci Zone: DONE ✅
Bull Trap Formation: DONE ✅
Next Trigger: Build Shorts Only After Bearish Structure Confirmation.
The Downside Roadmap Targets A Liquidity Sweep Below $57K.
Final Flush Scenario: $42K–$49K.
BTC Completed The Entire Long-Side Roadmap In Just 2 Days, Accelerated By Heavy Short Liquidations.
The Latest BTC Surge Has Also Triggered Major Breakouts Across Multiple Altcoins.
The Strategy Now Depends On Whether BTC Prints A Confirmed Lower High + Bearish Structure Before The Next Move.
All Previous $BTC Long Targets Have Now Been Hit — The Strategy Has Shifted Toward A Potential Short Setup.
$52K–$63K Long Zone: DONE ✅
1H/4H Bearish Structure Break: DONE ✅
0.618–0.786 Fibonacci Zone: DONE ✅
Bull Trap Formation: DONE ✅
Next Trigger: Build Shorts Only After Bearish Structure Confirmation.
The Downside Roadmap Targets A Liquidity Sweep Below $57K.
Final Flush Scenario: $42K–$49K.
BTC Completed The Entire Long-Side Roadmap In Just 2 Days, Accelerated By Heavy Short Liquidations.
The Latest BTC Surge Has Also Triggered Major Breakouts Across Multiple Altcoins.
The Strategy Now Depends On Whether BTC Prints A Confirmed Lower High + Bearish Structure Before The Next Move.
64
·
--
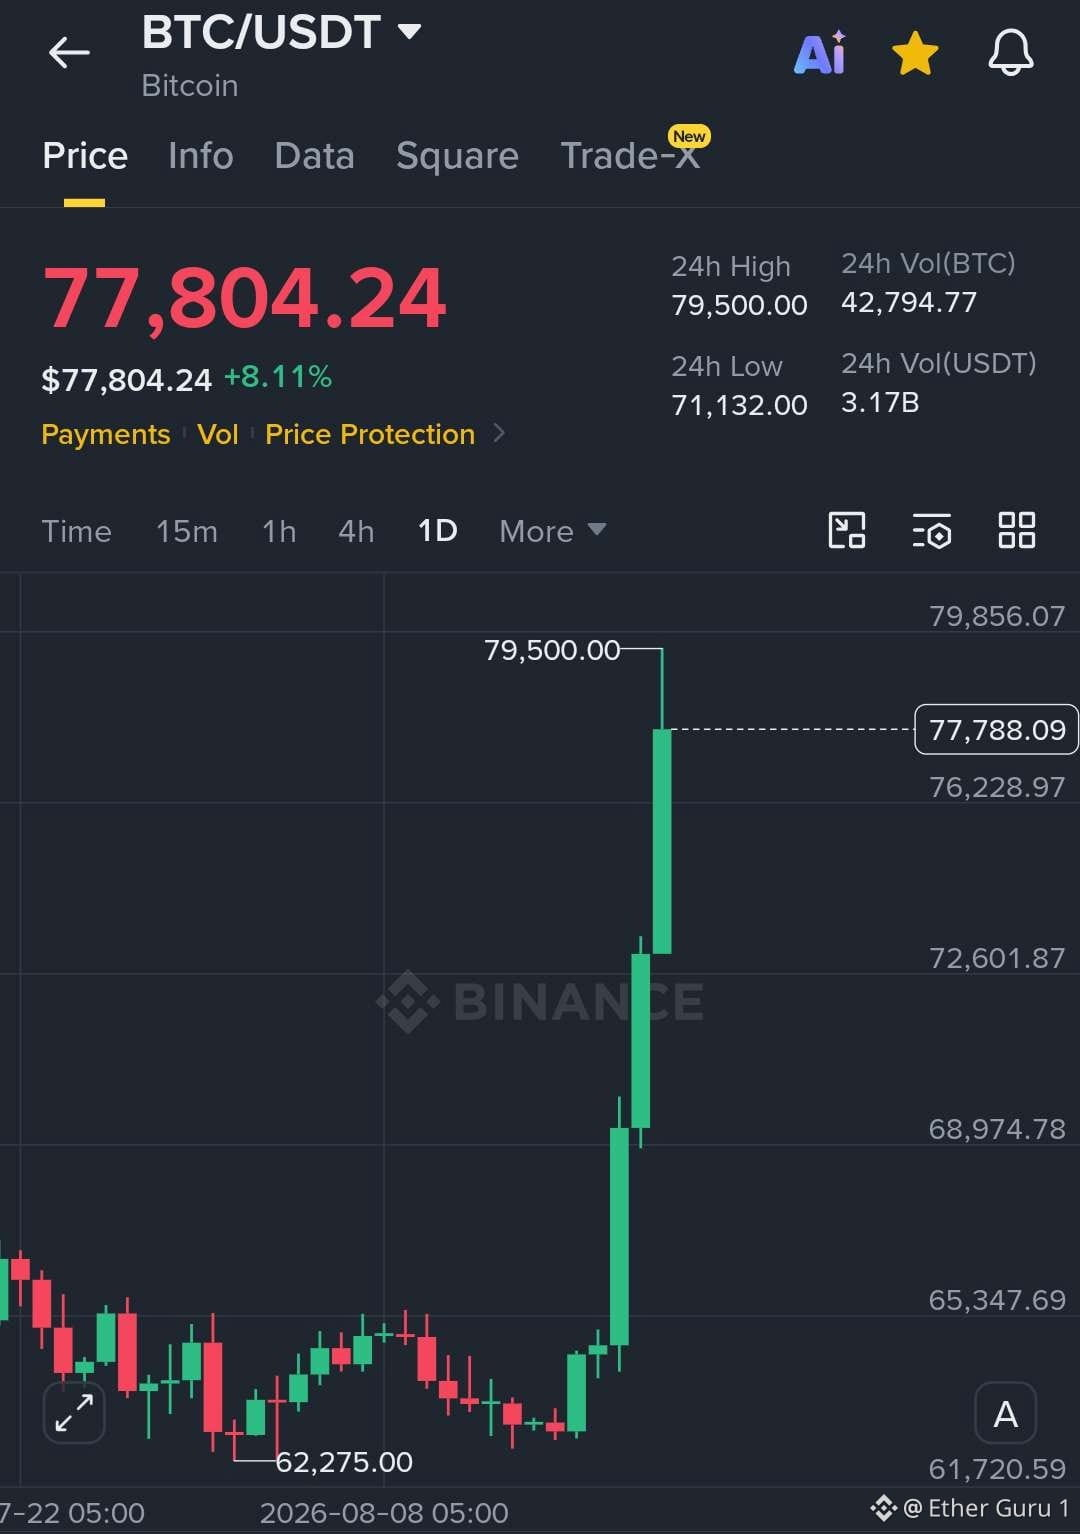
$BTC BREAKING 🚀
Bitcoin Just Touched $78,000 For The First Time In Roughly Three Months.
BTC Has Rallied About 24% From The $63K Area In Just A Few Days.
The Move Has Forced Billions Of Dollars In Leveraged Short Positions To Close.
A Short Squeeze Can Accelerate Price Gains As Liquidated Shorts Are Forced To Buy BTC Back.
Calling It The “Biggest Short Squeeze In History” Would Require A Verified Record Comparison.
But The Speed Of This Move Is Clearly Reshaping Crypto Market Positioning.
$BTC BREAKING 🚀
Bitcoin Just Touched $78,000 For The First Time In Roughly Three Months.
BTC Has Rallied About 24% From The $63K Area In Just A Few Days.
The Move Has Forced Billions Of Dollars In Leveraged Short Positions To Close.
A Short Squeeze Can Accelerate Price Gains As Liquidated Shorts Are Forced To Buy BTC Back.
Calling It The “Biggest Short Squeeze In History” Would Require A Verified Record Comparison.
But The Speed Of This Move Is Clearly Reshaping Crypto Market Positioning.
Bitcoin Just Touched $78,000 For The First Time In Roughly Three Months.
BTC Has Rallied About 24% From The $63K Area In Just A Few Days.
The Move Has Forced Billions Of Dollars In Leveraged Short Positions To Close.
A Short Squeeze Can Accelerate Price Gains As Liquidated Shorts Are Forced To Buy BTC Back.
Calling It The “Biggest Short Squeeze In History” Would Require A Verified Record Comparison.
But The Speed Of This Move Is Clearly Reshaping Crypto Market Positioning.
69
ເຂົ້າສູ່ລະບົບເພື່ອສຳຫຼວດເນື້ອຫາເພີ່ມເຕີມ
ເຂົ້າຮ່ວມກຸ່ມຜູ້ໃຊ້ຄຣິບໂຕທົ່ວໂລກໃນ Binance Square.
⚡️ ໄດ້ຮັບຂໍ້ມູນຫຼ້າສຸດ ແລະ ທີ່ມີປະໂຫຍດກ່ຽວກັບຄຣິບໂຕ.
💬 ໄດ້ຮັບຄວາມໄວ້ວາງໃຈຈາກຕະຫຼາດແລກປ່ຽນຄຣິບໂຕທີ່ໃຫຍ່ທີ່ສຸດໃນໂລກ.
👍 ຄົ້ນຫາຂໍ້ມູນເຊີງເລິກທີ່ແທ້ຈາກນັກສ້າງທີ່ໄດ້ຮັບການຢືນຢັນ.
ອີເມວ / ເບີໂທລະສັບ