
AR _Trader
51.3k ໂພສ

AR _Trader
ລາຍງານ
ບລັອກຜູ້ໃຊ້
ເປີດການຊື້ຂາຍ
1.4 ປີ
29 ກໍາລັງຕິດຕາມ
14.0K+ ຜູ້ຕິດຕາມ
81.1K+ Liked
ໂພສ
Portfolio
ທັງໝົດ
ວົງຢືມ
ຖ່າຍທອດສົດ
ປັກໝຸດ
·
--
ສັນຍານກະທິງ
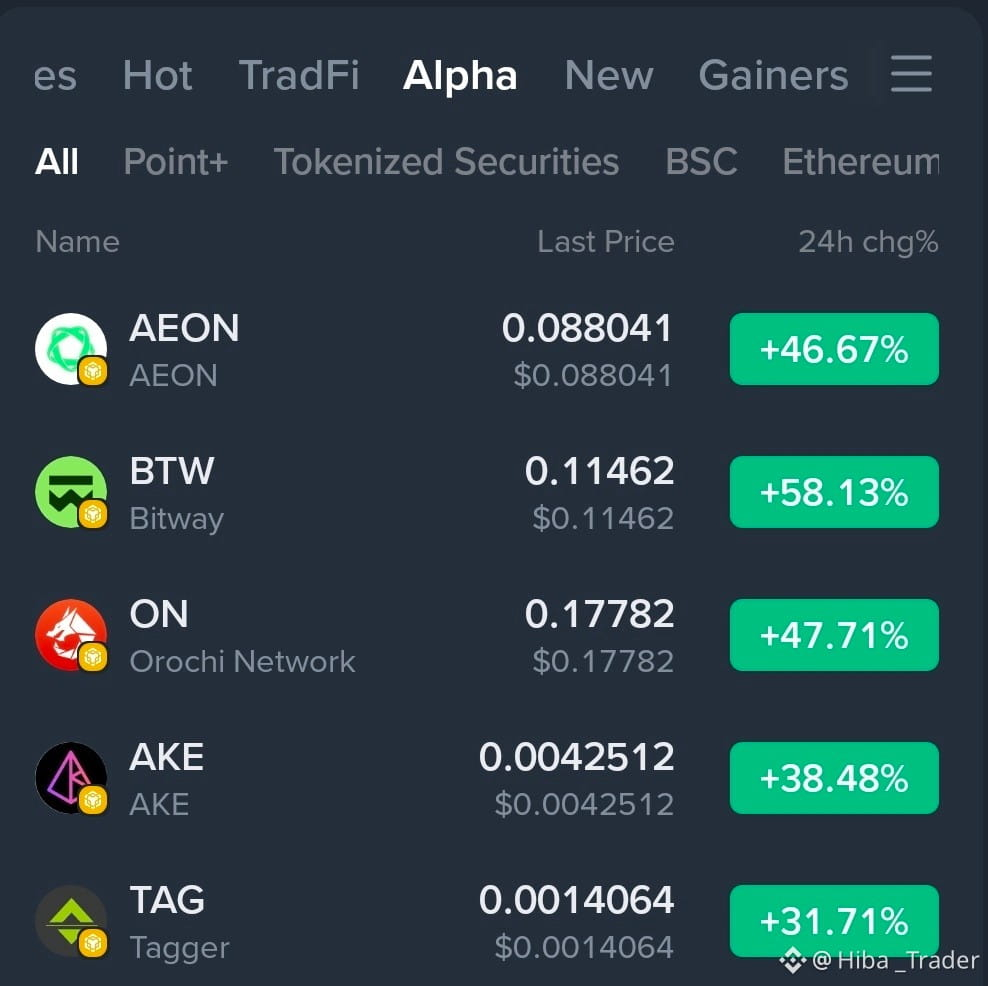
🔥 TOP GAINERS OF THE DAY 🔥
🥇 $BTW — +58.13% 🚀🚀🚀🚀🚀
🥈 #ONDO:
Orochi Network (ON) — +47.71% 🚀🚀🚀🚀⭐
🥉 $AEON — +46.67% 🚀🚀🚀🚀
⭐ $AKE — +38.48% 🚀🚀🚀
📈 #TAG — Watchlist 👀
Market Sentiment: 🟢 Bullish
Momentum Rating: ⭐⭐⭐⭐⭐ (5/5)
This format looks much more eye-catching and engaging for Telegram, X, or other crypto communities.
{future}(BTWUSDT)
{alpha}(560x277add739c6e0477616948357af9e79fe1ec9b80)
{future}(AKEUSDT)
🔥 TOP GAINERS OF THE DAY 🔥
🥇 $BTW — +58.13% 🚀🚀🚀🚀🚀
🥈 #ONDO:
Orochi Network (ON) — +47.71% 🚀🚀🚀🚀⭐
🥉 $AEON — +46.67% 🚀🚀🚀🚀
⭐ $AKE — +38.48% 🚀🚀🚀
📈 #TAG — Watchlist 👀
Market Sentiment: 🟢 Bullish
Momentum Rating: ⭐⭐⭐⭐⭐ (5/5)
This format looks much more eye-catching and engaging for Telegram, X, or other crypto communities.
🥇 $BTW — +58.13% 🚀🚀🚀🚀🚀
🥈 #ONDO:
Orochi Network (ON) — +47.71% 🚀🚀🚀🚀⭐
🥉 $AEON — +46.67% 🚀🚀🚀🚀
⭐ $AKE — +38.48% 🚀🚀🚀
📈 #TAG — Watchlist 👀
Market Sentiment: 🟢 Bullish
Momentum Rating: ⭐⭐⭐⭐⭐ (5/5)
This format looks much more eye-catching and engaging for Telegram, X, or other crypto communities.
2
1
24
1.7k
ປັກໝຸດ
·
--
ສັນຍານກະທິງ
ຢືນຢັນແລ້ວ
🔥 #usfiresontankerbreakingiranblockade | ATTENTION TO THE STRICTNESS OF ORMUZ
Reports about an incident in which U.S. forces allegedly opened fire on an oil tanker trying to cross the maritime blockade imposed around Iran, in the context of the Strait of Hormuz crisis.
This episode falls within a much broader military escalation related to U.S. efforts to keep navigation open in the region.
📊 WHAT DOES THIS MEAN?
Regardless of how the conflict evolves, this kind of event usually increases uncertainty in markets.
When a route through which a significant share of the world’s oil transits is threatened, investors begin to monitor closely:
• Oil
• Dollar
• Gold
• Crypto
💬 What do you think? Will this affect global markets?
🔥 #usfiresontankerbreakingiranblockade | ATTENTION TO THE STRICTNESS OF ORMUZ
Reports about an incident in which U.S. forces allegedly opened fire on an oil tanker trying to cross the maritime blockade imposed around Iran, in the context of the Strait of Hormuz crisis.
This episode falls within a much broader military escalation related to U.S. efforts to keep navigation open in the region.
📊 WHAT DOES THIS MEAN?
Regardless of how the conflict evolves, this kind of event usually increases uncertainty in markets.
When a route through which a significant share of the world’s oil transits is threatened, investors begin to monitor closely:
• Oil
• Dollar
• Gold
• Crypto
💬 What do you think? Will this affect global markets?
Reports about an incident in which U.S. forces allegedly opened fire on an oil tanker trying to cross the maritime blockade imposed around Iran, in the context of the Strait of Hormuz crisis.
This episode falls within a much broader military escalation related to U.S. efforts to keep navigation open in the region.
📊 WHAT DOES THIS MEAN?
Regardless of how the conflict evolves, this kind of event usually increases uncertainty in markets.
When a route through which a significant share of the world’s oil transits is threatened, investors begin to monitor closely:
• Oil
• Dollar
• Gold
• Crypto
💬 What do you think? Will this affect global markets?

2
36
24k
·
--
ສັນຍານກະທິງ
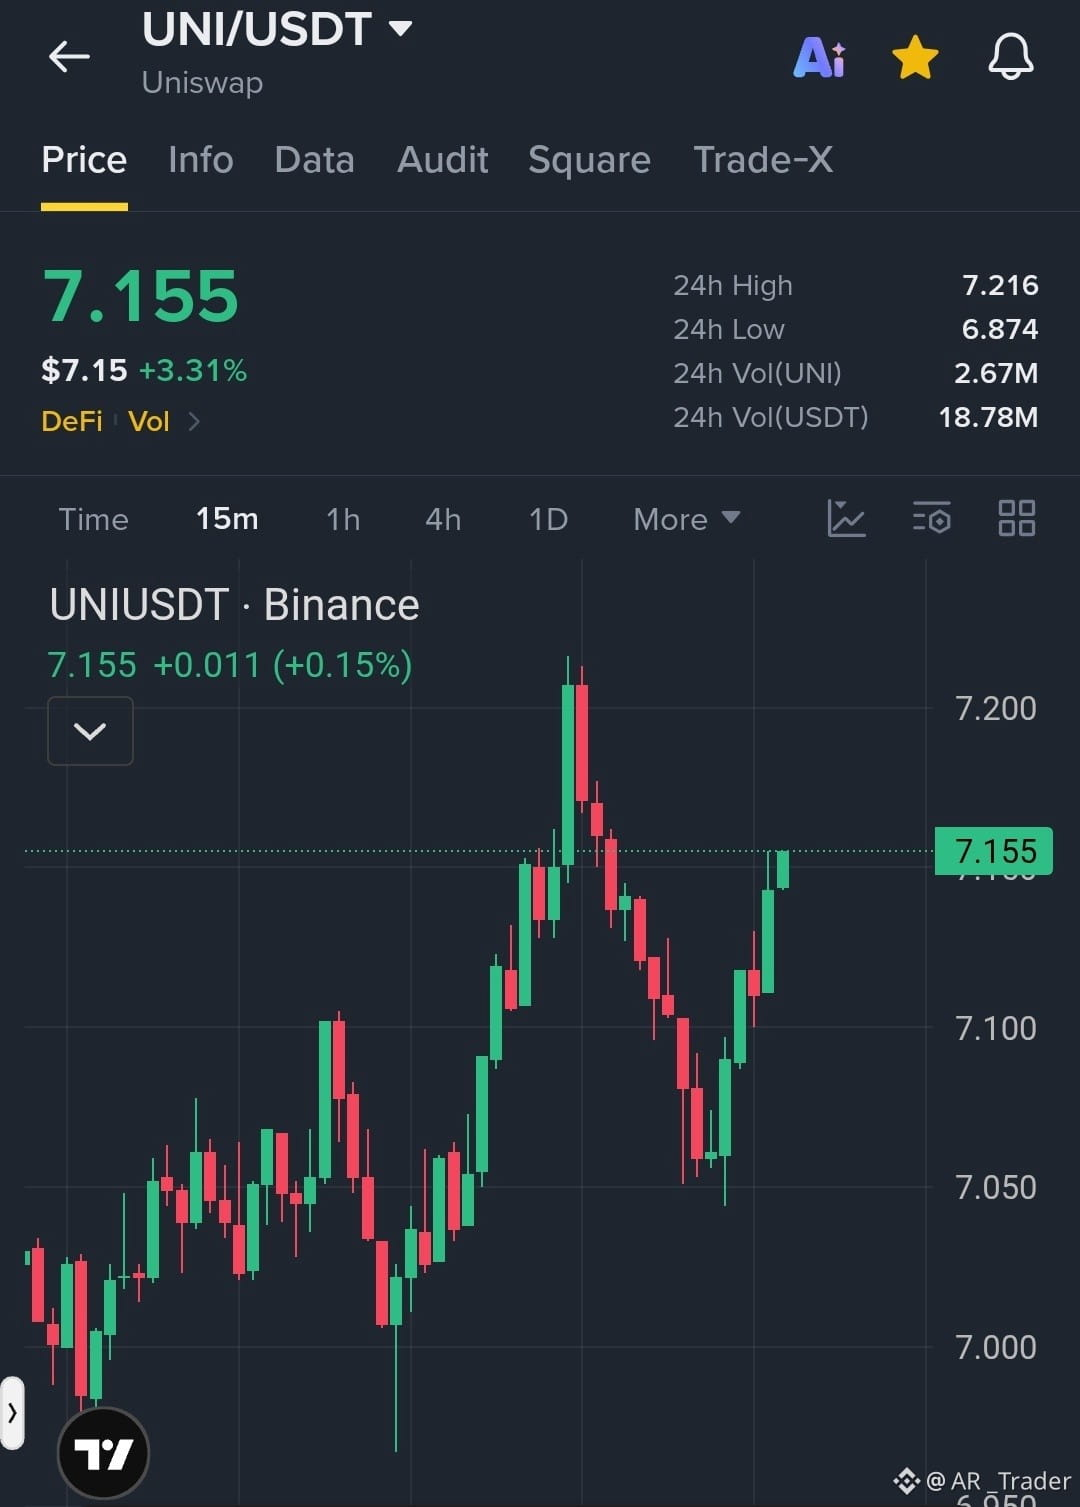
$UNI /USDT Bulls Regain Control as Price Rebounds Toward Key Resistance
Trade Setup: LONG
Entry Zone: 7.130–7.160
TP1: 7.200
TP2: 7.250
TP3: 7.300
SL: 7.080
Market Setup: The 15M chart shows a strong bullish recovery from the 7.050 support zone, with consecutive green candles indicating renewed buying pressure. Price is approaching 7.200 resistance. A confirmed breakout could extend the upward move toward higher targets, while holding above 7.130 remains important.
$UNI /USDT Bulls Regain Control as Price Rebounds Toward Key Resistance
Trade Setup: LONG
Entry Zone: 7.130–7.160
TP1: 7.200
TP2: 7.250
TP3: 7.300
SL: 7.080
Market Setup: The 15M chart shows a strong bullish recovery from the 7.050 support zone, with consecutive green candles indicating renewed buying pressure. Price is approaching 7.200 resistance. A confirmed breakout could extend the upward move toward higher targets, while holding above 7.130 remains important.
Trade Setup: LONG
Entry Zone: 7.130–7.160
TP1: 7.200
TP2: 7.250
TP3: 7.300
SL: 7.080
Market Setup: The 15M chart shows a strong bullish recovery from the 7.050 support zone, with consecutive green candles indicating renewed buying pressure. Price is approaching 7.200 resistance. A confirmed breakout could extend the upward move toward higher targets, while holding above 7.130 remains important.
1
52
·
--
ສັນຍານກະທິງ
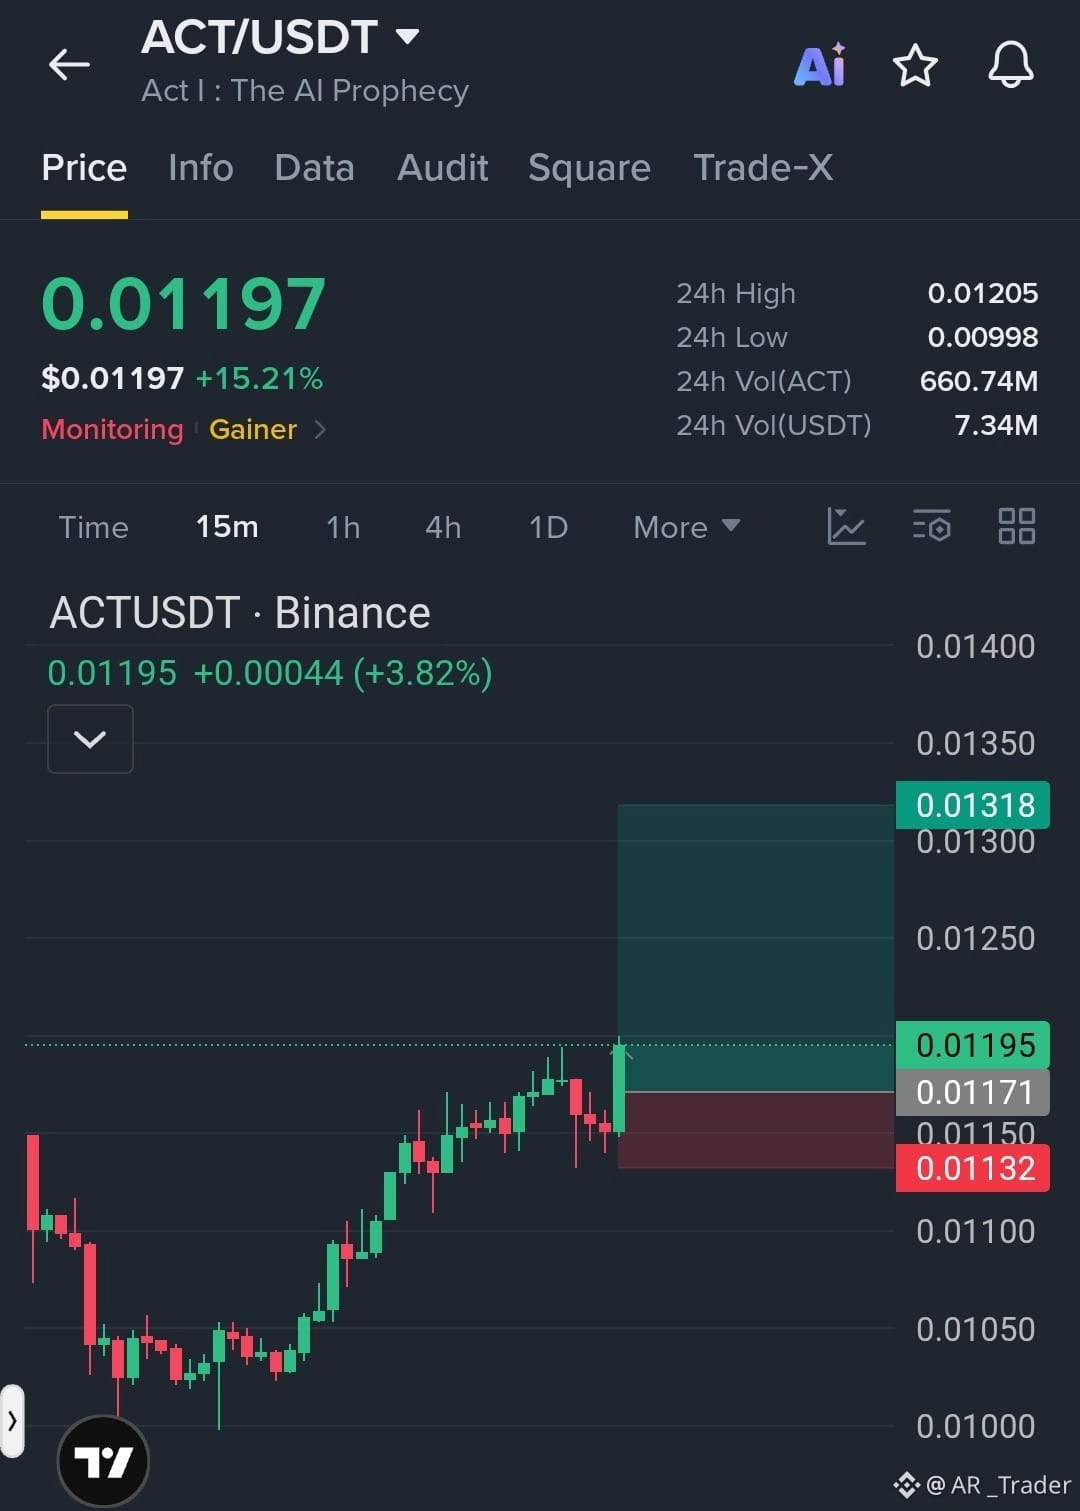
.$ACT /USDT Bulls Strengthen Their Momentum as Price Targets a Fresh Breakout
Trade Setup: LONG
Entry Zone: 0.01170–0.01195
TP1: 0.01220
TP2: 0.01270
TP3: 0.01318
SL: 0.01132
Market Setup: The 15M chart shows a strong bullish recovery with higher highs and higher lows. Fresh buying pressure has pushed price above the 0.01170 level. A sustained hold above this zone could drive another upward move toward 0.01220 and higher targets. Watch for confirmation before entry..
.$ACT /USDT Bulls Strengthen Their Momentum as Price Targets a Fresh Breakout
Trade Setup: LONG
Entry Zone: 0.01170–0.01195
TP1: 0.01220
TP2: 0.01270
TP3: 0.01318
SL: 0.01132
Market Setup: The 15M chart shows a strong bullish recovery with higher highs and higher lows. Fresh buying pressure has pushed price above the 0.01170 level. A sustained hold above this zone could drive another upward move toward 0.01220 and higher targets. Watch for confirmation before entry..
Trade Setup: LONG
Entry Zone: 0.01170–0.01195
TP1: 0.01220
TP2: 0.01270
TP3: 0.01318
SL: 0.01132
Market Setup: The 15M chart shows a strong bullish recovery with higher highs and higher lows. Fresh buying pressure has pushed price above the 0.01170 level. A sustained hold above this zone could drive another upward move toward 0.01220 and higher targets. Watch for confirmation before entry..
1
88
·
--
ສັນຍານໝີ
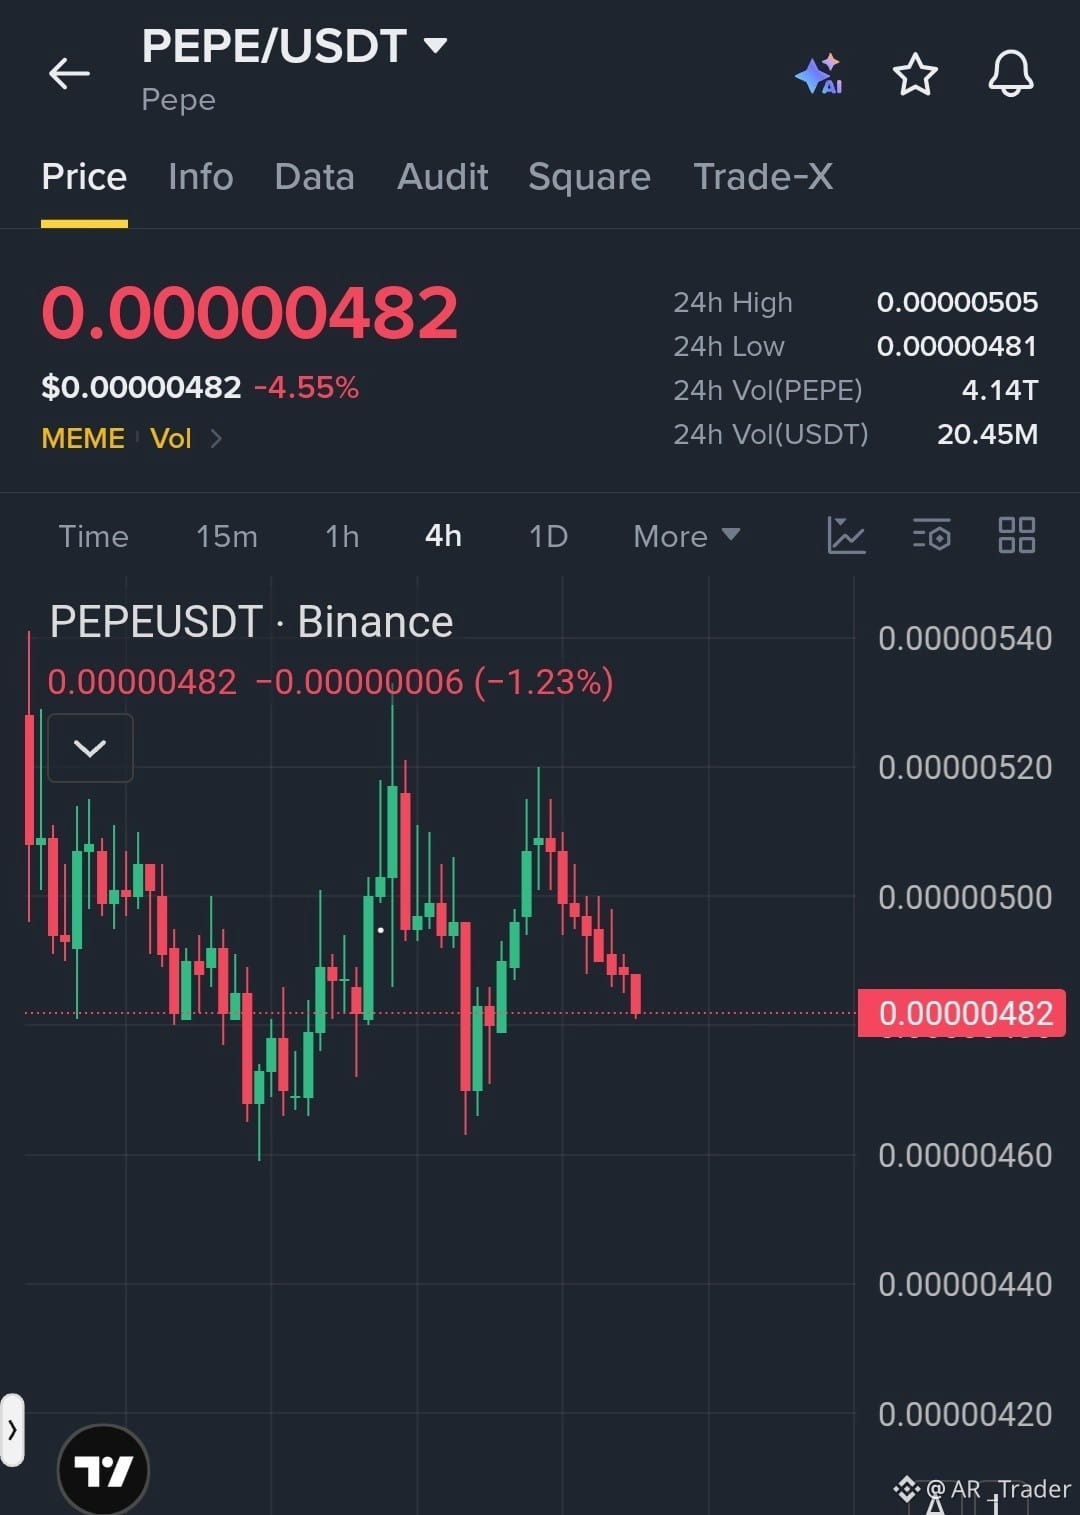
....$PEPE /USDT Bears Pressure Key Support as Downside Momentum Builds
Trade Setup: SHORT
Entry Zone: 0.00000482–0.00000488
TP1: 0.00000470
TP2: 0.00000460
TP3: 0.00000445
SL: 0.00000500
Market Setup: The 4H chart shows weakening momentum, with consecutive bearish candles . lower highs and lower lows. Price is testing the 0.00000481 support zone. A confirmed breakdown could trigger further downside toward lower support levels, while a recovery above 0.00000500 would weaken the bearish setup...
....$PEPE /USDT Bears Pressure Key Support as Downside Momentum Builds
Trade Setup: SHORT
Entry Zone: 0.00000482–0.00000488
TP1: 0.00000470
TP2: 0.00000460
TP3: 0.00000445
SL: 0.00000500
Market Setup: The 4H chart shows weakening momentum, with consecutive bearish candles . lower highs and lower lows. Price is testing the 0.00000481 support zone. A confirmed breakdown could trigger further downside toward lower support levels, while a recovery above 0.00000500 would weaken the bearish setup...
Trade Setup: SHORT
Entry Zone: 0.00000482–0.00000488
TP1: 0.00000470
TP2: 0.00000460
TP3: 0.00000445
SL: 0.00000500
Market Setup: The 4H chart shows weakening momentum, with consecutive bearish candles . lower highs and lower lows. Price is testing the 0.00000481 support zone. A confirmed breakdown could trigger further downside toward lower support levels, while a recovery above 0.00000500 would weaken the bearish setup...
2
69
·
--
ສັນຍານກະທິງ
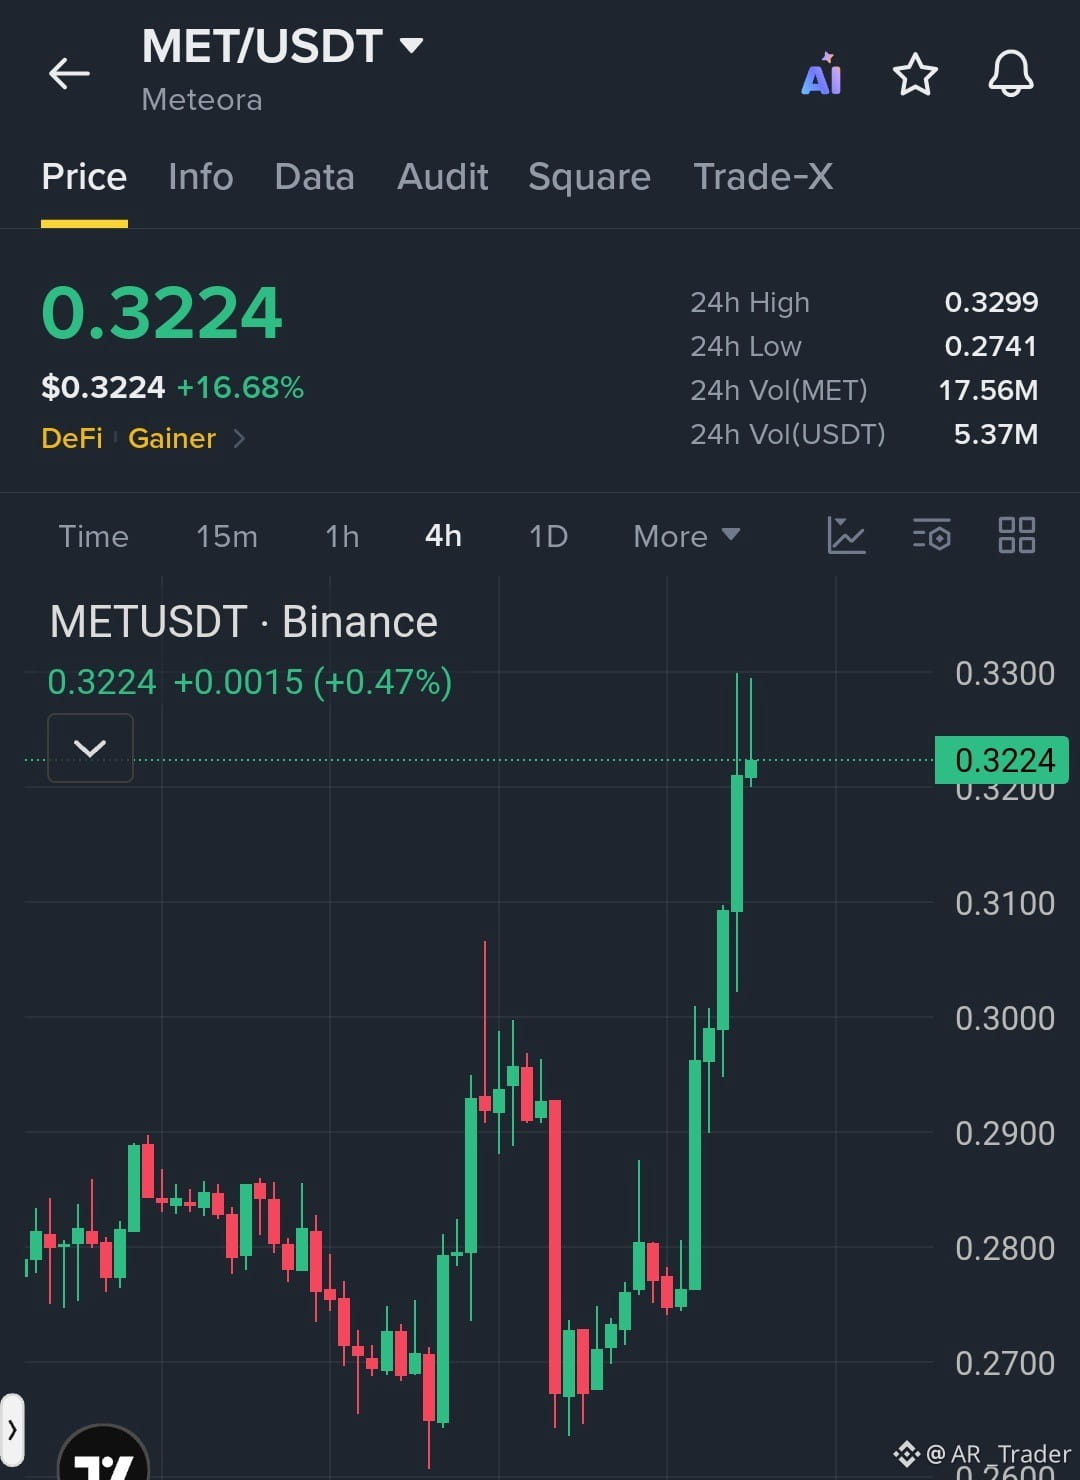
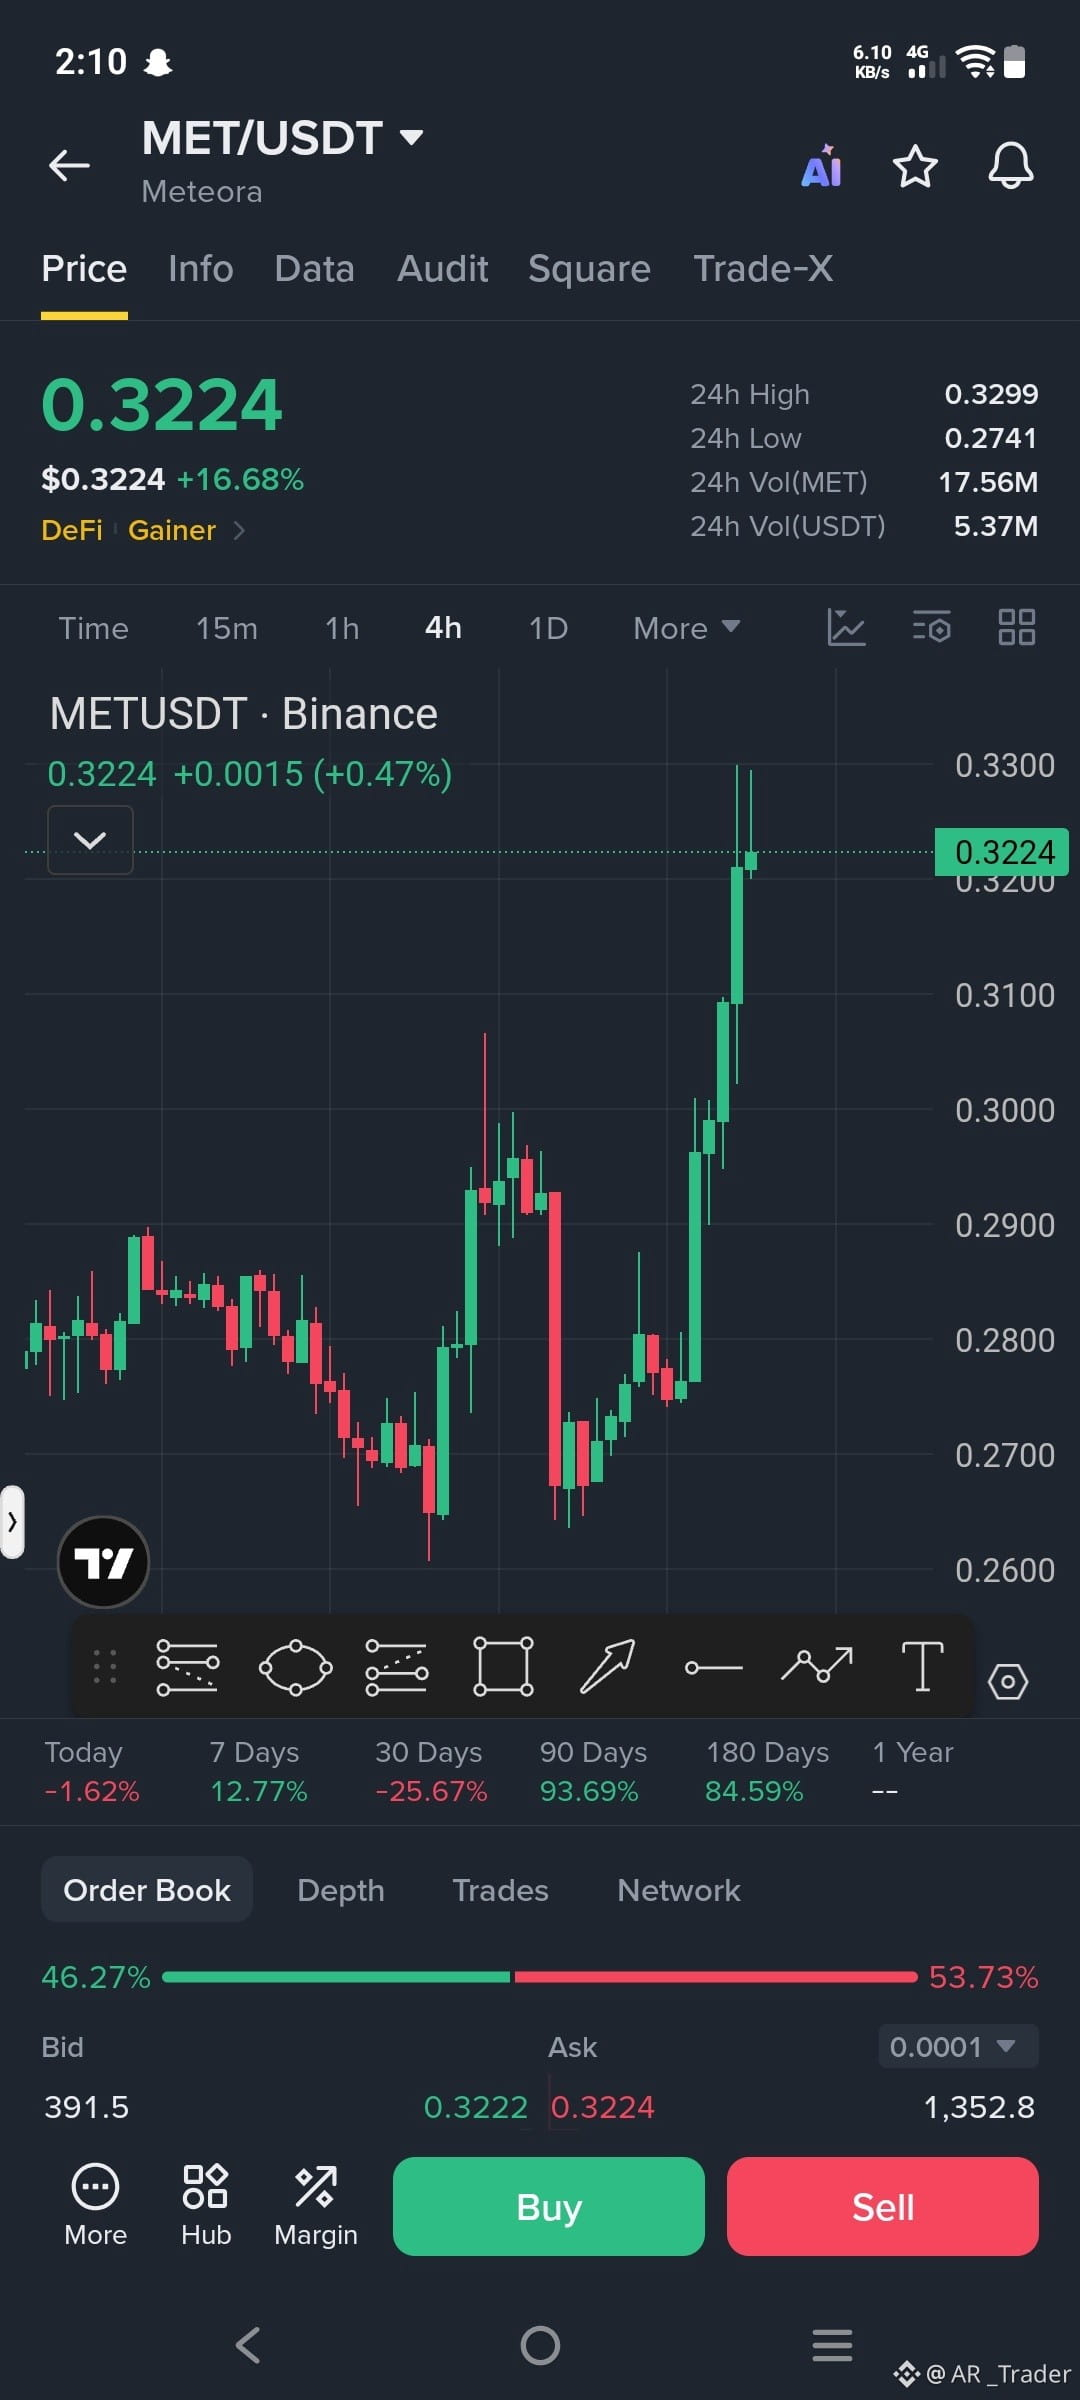
$MET /$MET/USDT Bulls Maintain Explosive Momentum as Price Targets Higher Resistance
Trade Setup: LONG
Entr toy Zone: 0.3180–0.3230
TP1: 0.3300
TP2: 0.3400
TP3: 0.3500
SL: 0.3100
Market Setup: Strong bullish momentum continues on the 4H chart, with consecutive green candles need price above the 0.3100 resistance zone. The next key hurdle is 0.3300. A confirmed breakout could extend the rally toward higher targets, while holding above 0.3180 is important to sustain bullish momentum.USDT Bulls Maintain Explosive Momentum as Price Targets Higher Resistance$MET
{future}(METUSDT)
Trade Setup: LONG
Entr toy Zone: 0.3180–0.3230
TP1: 0.3300
TP2: 0.3400
TP3: 0.3500
SL: 0.3100
Market Setup: Strong bullish momentum continues on the 4H chart, with consecutive green candles need price above the 0.3100 resistance zone. The next key hurdle is 0.3300. A confirmed breakout could extend the rally toward higher targets, while holding above 0.3180 is important to sustain bullish momentum.
$MET /$MET /USDT Bulls Maintain Explosive Momentum as Price Targets Higher Resistance
Trade Setup: LONG
Entr toy Zone: 0.3180–0.3230
TP1: 0.3300
TP2: 0.3400
TP3: 0.3500
SL: 0.3100
Market Setup: Strong bullish momentum continues on the 4H chart, with consecutive green candles need price above the 0.3100 resistance zone. The next key hurdle is 0.3300. A confirmed breakout could extend the rally toward higher targets, while holding above 0.3180 is important to sustain bullish momentum.USDT Bulls Maintain Explosive Momentum as Price Targets Higher Resistance$MET
Trade Setup: LONG
Entr toy Zone: 0.3180–0.3230
TP1: 0.3300
TP2: 0.3400
TP3: 0.3500
SL: 0.3100
Market Setup: Strong bullish momentum continues on the 4H chart, with consecutive green candles need price above the 0.3100 resistance zone. The next key hurdle is 0.3300. A confirmed breakout could extend the rally toward higher targets, while holding above 0.3180 is important to sustain bullish momentum.
Trade Setup: LONG
Entr toy Zone: 0.3180–0.3230
TP1: 0.3300
TP2: 0.3400
TP3: 0.3500
SL: 0.3100
Market Setup: Strong bullish momentum continues on the 4H chart, with consecutive green candles need price above the 0.3100 resistance zone. The next key hurdle is 0.3300. A confirmed breakout could extend the rally toward higher targets, while holding above 0.3180 is important to sustain bullish momentum.USDT Bulls Maintain Explosive Momentum as Price Targets Higher Resistance$MET
Trade Setup: LONG
Entr toy Zone: 0.3180–0.3230
TP1: 0.3300
TP2: 0.3400
TP3: 0.3500
SL: 0.3100
Market Setup: Strong bullish momentum continues on the 4H chart, with consecutive green candles need price above the 0.3100 resistance zone. The next key hurdle is 0.3300. A confirmed breakout could extend the rally toward higher targets, while holding above 0.3180 is important to sustain bullish momentum.
1
34
·
--
ສັນຍານກະທິງ
$MET /USDT Bulls Maintain Explosive Momentum as Price Targets Higher Resistance
Trade Setup: LONG
Entr toy Zone: 0.3180–0.3230
TP1: 0.3300
TP2: 0.3400
TP3: 0.3500
SL: 0.3100
Market Setup: Strong bullish momentum continues on the 4H chart, with consecutive green candles need price above the 0.3100 resistance zone. The next key hurdle is 0.3300. A confirmed breakout could extend the rally toward higher targets, while holding above 0.3180 is important to sustain bullish momentum.$MET
{future}(METUSDT)
$nñbgg
ñ .
$MET /USDT Bulls Maintain Explosive Momentum as Price Targets Higher Resistance
Trade Setup: LONG
Entr toy Zone: 0.3180–0.3230
TP1: 0.3300
TP2: 0.3400
TP3: 0.3500
SL: 0.3100
Market Setup: Strong bullish momentum continues on the 4H chart, with consecutive green candles need price above the 0.3100 resistance zone. The next key hurdle is 0.3300. A confirmed breakout could extend the rally toward higher targets, while holding above 0.3180 is important to sustain bullish momentum.$MET
$nñbgg
ñ .
Trade Setup: LONG
Entr toy Zone: 0.3180–0.3230
TP1: 0.3300
TP2: 0.3400
TP3: 0.3500
SL: 0.3100
Market Setup: Strong bullish momentum continues on the 4H chart, with consecutive green candles need price above the 0.3100 resistance zone. The next key hurdle is 0.3300. A confirmed breakout could extend the rally toward higher targets, while holding above 0.3180 is important to sustain bullish momentum.$MET
$nñbgg
ñ .
46
·
--
ສັນຍານກະທິງ
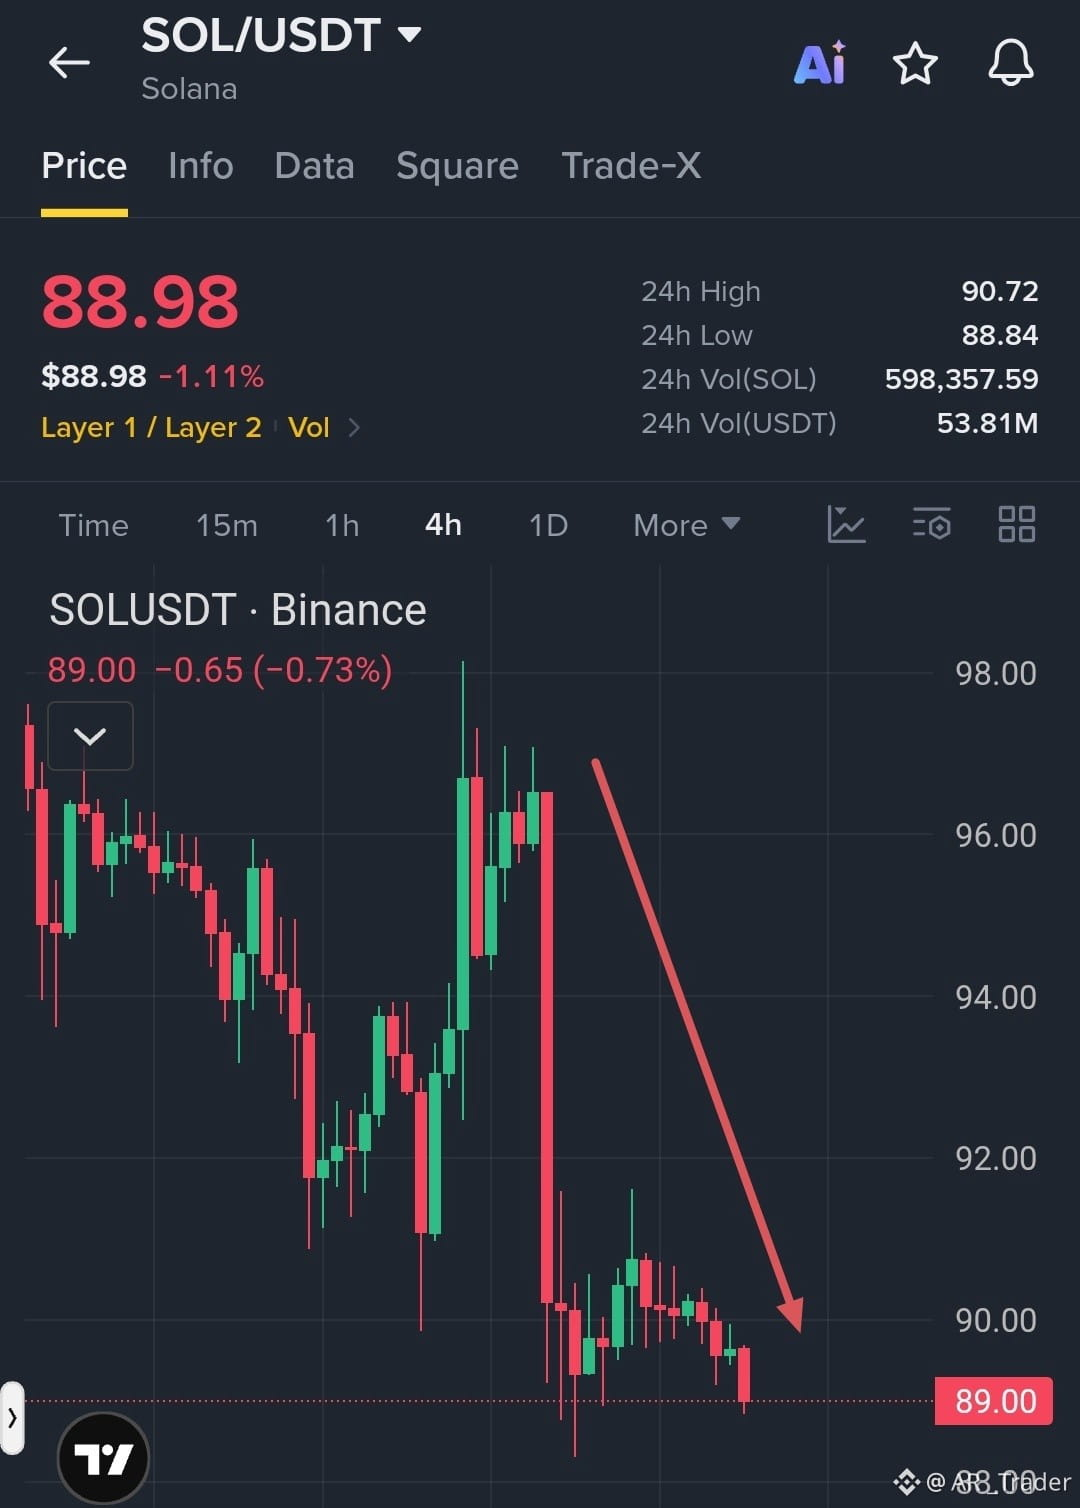
$SOL /USDT Bears Maintain Pressure as Price Risks Another Downside Move
Trade Setup: SHORT
Entry Zone: 89.00–89.50
TP1: 88.00
TP2: 87.00
TP3: 85.50
SL: 91.00
Market Setup: The 4H chart shows a clear bearish structure following a sharp rejection from the 96.00 resistance zone. Price continues forming lower highs and is struggling to recover above 90.00. A breakdown below 88.80 could accelerate selling pressure toward lower support levels$SOL
{future}(SOLUSDT)
.
$SOL /USDT Bears Maintain Pressure as Price Risks Another Downside Move
Trade Setup: SHORT
Entry Zone: 89.00–89.50
TP1: 88.00
TP2: 87.00
TP3: 85.50
SL: 91.00
Market Setup: The 4H chart shows a clear bearish structure following a sharp rejection from the 96.00 resistance zone. Price continues forming lower highs and is struggling to recover above 90.00. A breakdown below 88.80 could accelerate selling pressure toward lower support levels$SOL
.
Trade Setup: SHORT
Entry Zone: 89.00–89.50
TP1: 88.00
TP2: 87.00
TP3: 85.50
SL: 91.00
Market Setup: The 4H chart shows a clear bearish structure following a sharp rejection from the 96.00 resistance zone. Price continues forming lower highs and is struggling to recover above 90.00. A breakdown below 88.80 could accelerate selling pressure toward lower support levels$SOL
.
1
40
·
--
ສັນຍານກະທິງ
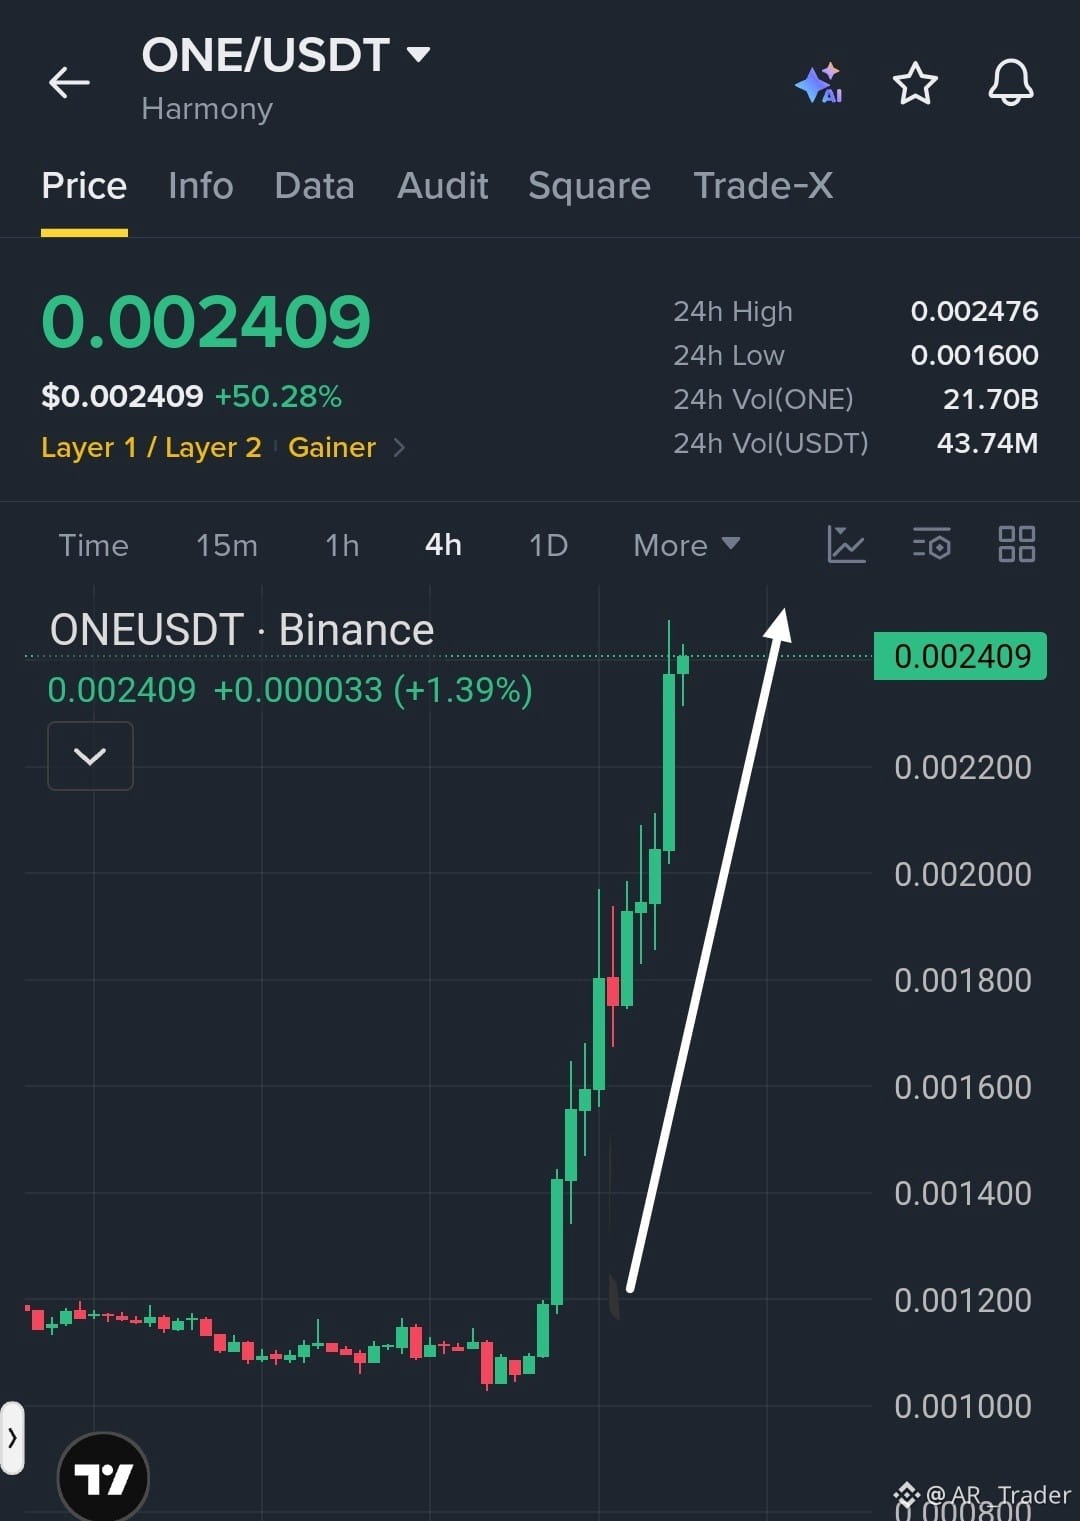
$ONE /USDT Bulls Extend Massive Rally as Breakout Momentum Builds
Trade Setup: LONG
Entry Zone: 0.002350–0.002410
TP1: 0.002476
TP2: 0.002600
TP3: 0.002750
SL: 0.002250
Market Setup: Strong bullish momentum continues on the 4H chart, with consecutive green candles driving a massive breakout. Price is approaching 0.002476 resistance. A confirmed move above this level could trigger another upward extension, while holding above 0.002350 is important to sustain the bullish structure. Avoid chasing after the sharp rally$ONE
{future}(ONEUSDT)
$on.
$ONE /USDT Bulls Extend Massive Rally as Breakout Momentum Builds
Trade Setup: LONG
Entry Zone: 0.002350–0.002410
TP1: 0.002476
TP2: 0.002600
TP3: 0.002750
SL: 0.002250
Market Setup: Strong bullish momentum continues on the 4H chart, with consecutive green candles driving a massive breakout. Price is approaching 0.002476 resistance. A confirmed move above this level could trigger another upward extension, while holding above 0.002350 is important to sustain the bullish structure. Avoid chasing after the sharp rally$ONE
$on.
Trade Setup: LONG
Entry Zone: 0.002350–0.002410
TP1: 0.002476
TP2: 0.002600
TP3: 0.002750
SL: 0.002250
Market Setup: Strong bullish momentum continues on the 4H chart, with consecutive green candles driving a massive breakout. Price is approaching 0.002476 resistance. A confirmed move above this level could trigger another upward extension, while holding above 0.002350 is important to sustain the bullish structure. Avoid chasing after the sharp rally$ONE
$on.
1
61
·
--
ສັນຍານໝີ
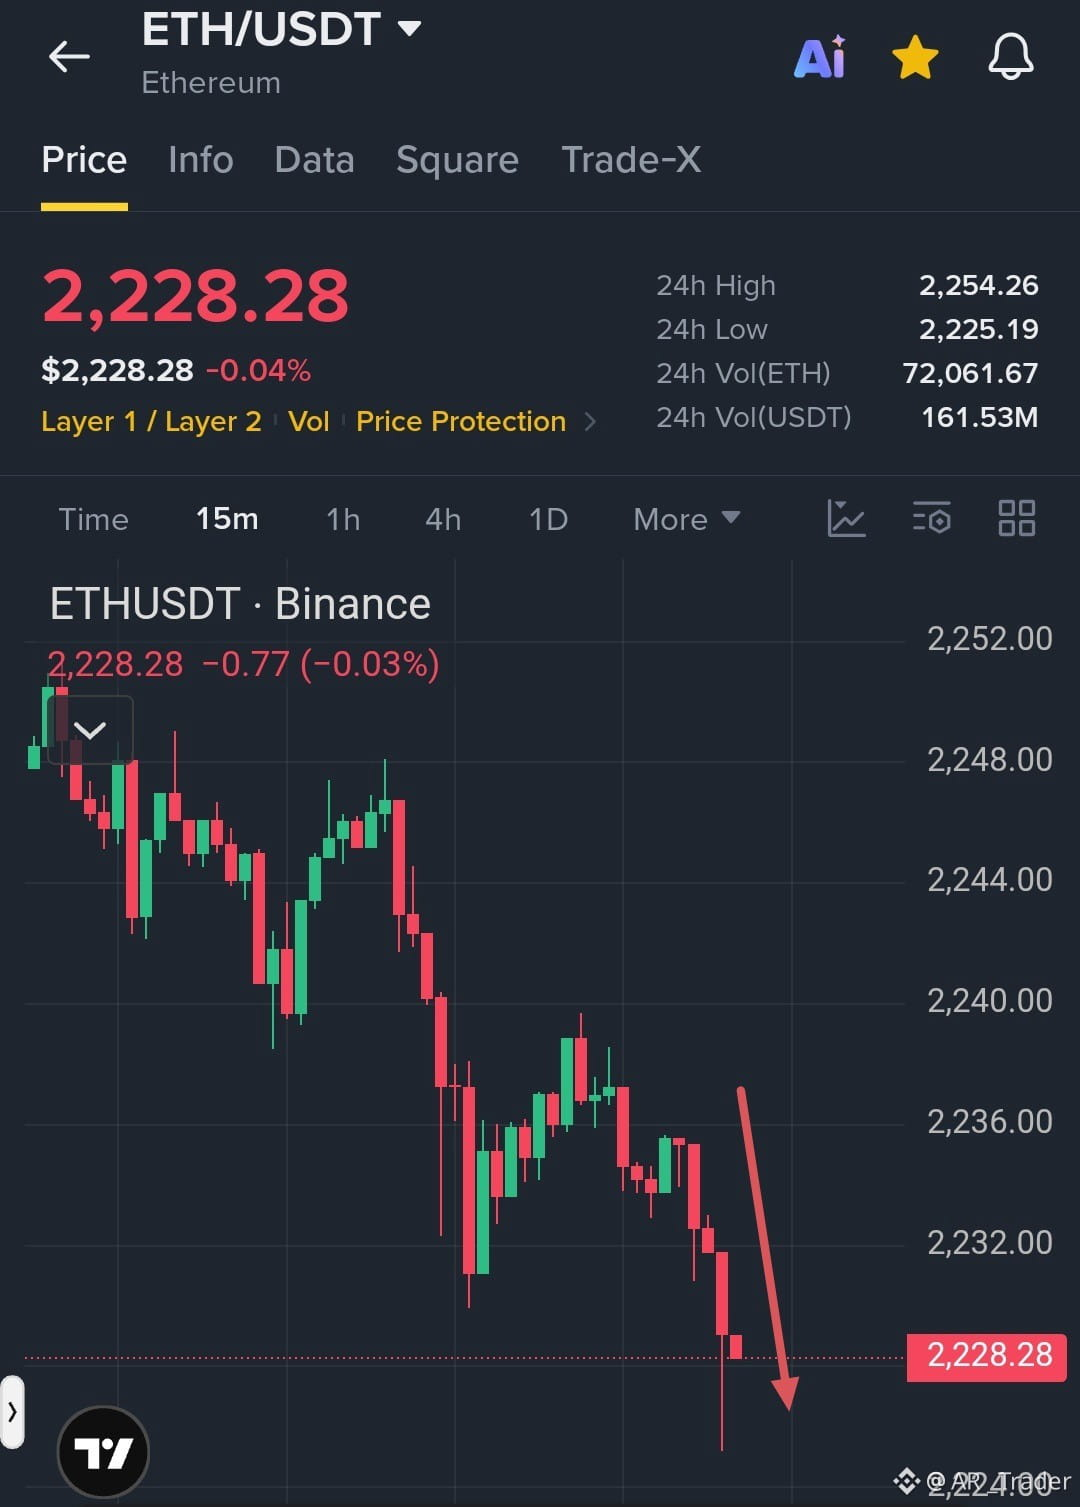
$ETH /USDT Bears Maintain Control as Selling Pressure Drives Price Lower
Trade Setup: SHORT
Entry Zone: 2,228–2,232
TP1: 2,224
TP2: 2,220
TP3: 2,215
SL: 2,240
Market Setup: The 15M chart shows strong bearish momentum, with consecutive lower highs and lower lows. Price is approaching the 2,225 support zone, and a confirmed breakdown could trigger further downside toward the next support levels. A recovery above 2,236 would weaken the bearish setup.y$ETH
{future}(ETHUSDT)
$ETH /USDT Bears Maintain Control as Selling Pressure Drives Price Lower
Trade Setup: SHORT
Entry Zone: 2,228–2,232
TP1: 2,224
TP2: 2,220
TP3: 2,215
SL: 2,240
Market Setup: The 15M chart shows strong bearish momentum, with consecutive lower highs and lower lows. Price is approaching the 2,225 support zone, and a confirmed breakdown could trigger further downside toward the next support levels. A recovery above 2,236 would weaken the bearish setup.y$ETH
Trade Setup: SHORT
Entry Zone: 2,228–2,232
TP1: 2,224
TP2: 2,220
TP3: 2,215
SL: 2,240
Market Setup: The 15M chart shows strong bearish momentum, with consecutive lower highs and lower lows. Price is approaching the 2,225 support zone, and a confirmed breakdown could trigger further downside toward the next support levels. A recovery above 2,236 would weaken the bearish setup.y$ETH
1
60
·
--
ສັນຍານໝີ
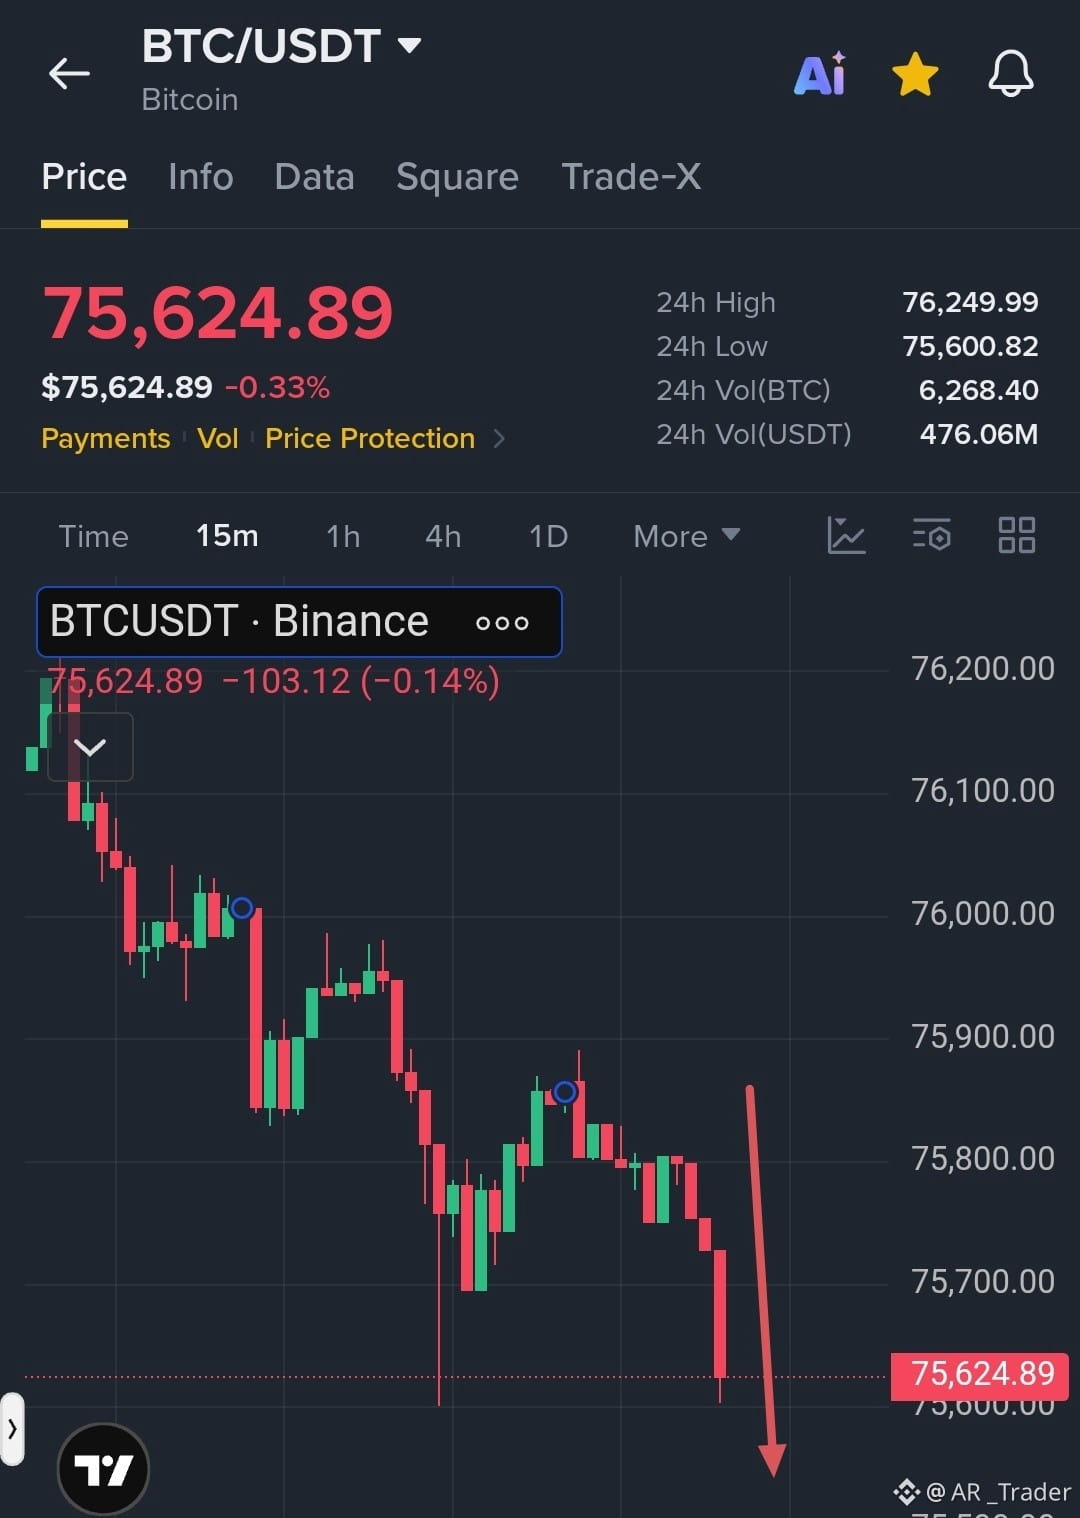
$BTC /USDT Bulls Need a Strong Rebound to Reverse the Short-Term Downtrend
Trade Setup: LONG
Entry Zone: 75,650–75,750
TP1: 75,850
TP2: 76,000
TP3: 76,200
SL: 75,450
Market Setup: The 15M chart is showing strong bearish pressure, with consecutive lower highs and a fresh decline toward 75,600 support. A LONG setup is risky until buyers reclaim 75,750–75,800. A confirmed recovery above this zone could trigger a short-term bounce toward the upside targets$BTC
{future}(BTCUSDT)
.
$BTC /USDT Bulls Need a Strong Rebound to Reverse the Short-Term Downtrend
Trade Setup: LONG
Entry Zone: 75,650–75,750
TP1: 75,850
TP2: 76,000
TP3: 76,200
SL: 75,450
Market Setup: The 15M chart is showing strong bearish pressure, with consecutive lower highs and a fresh decline toward 75,600 support. A LONG setup is risky until buyers reclaim 75,750–75,800. A confirmed recovery above this zone could trigger a short-term bounce toward the upside targets$BTC
.
Trade Setup: LONG
Entry Zone: 75,650–75,750
TP1: 75,850
TP2: 76,000
TP3: 76,200
SL: 75,450
Market Setup: The 15M chart is showing strong bearish pressure, with consecutive lower highs and a fresh decline toward 75,600 support. A LONG setup is risky until buyers reclaim 75,750–75,800. A confirmed recovery above this zone could trigger a short-term bounce toward the upside targets$BTC
.
2
56
·
--
ສັນຍານກະທິງ
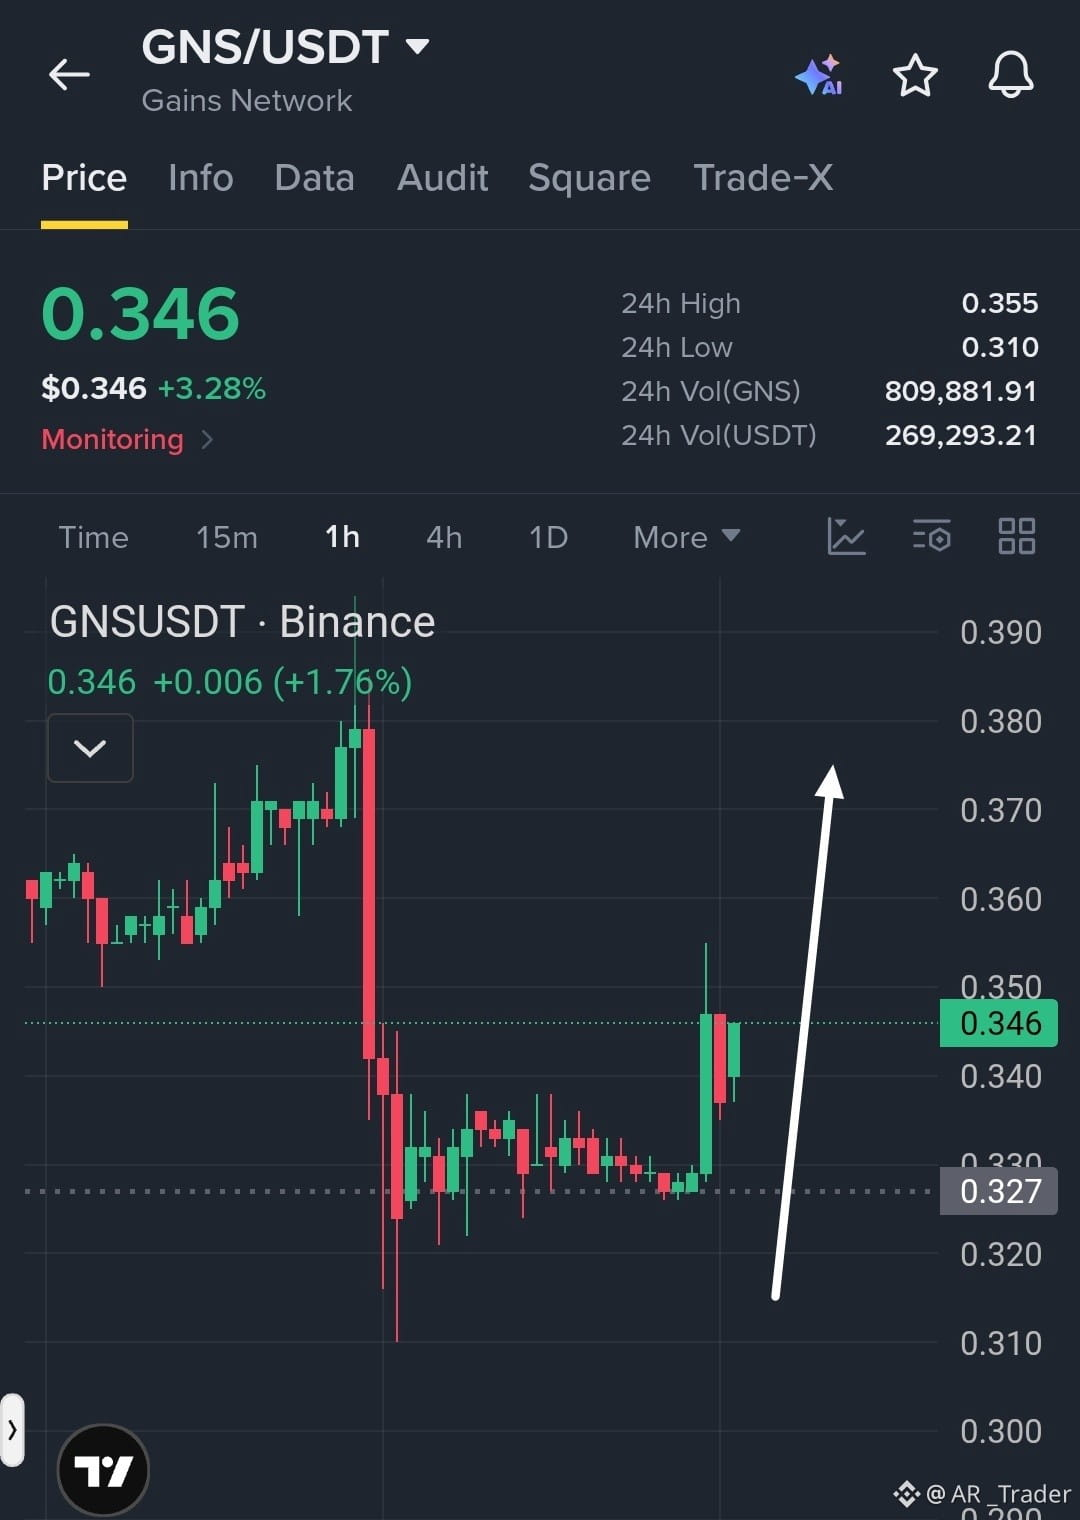
$GNS /USDT Bulls Regain Strength as Price Targets the Next Resistance Zone
Trade Setup: LONG
Entry Zone: 0.343–0.347
TP1: 0.355
TP2: 0.365
TP3: 0.375
SL: 0.327
Market Setup: The 1H chart shows a strong rebound from the 0.327 support zone following consolidation. Fresh buying pressure has pushed price toward 0.350 resistance. A confirmed breakout above this level could open the way toward 0.365 and 0.375, while holding above 0.340 remains important$GNS
{spot}(GNSUSDT)
$GNO
{spot}(GNOUSDT)
.
$GNS /USDT Bulls Regain Strength as Price Targets the Next Resistance Zone
Trade Setup: LONG
Entry Zone: 0.343–0.347
TP1: 0.355
TP2: 0.365
TP3: 0.375
SL: 0.327
Market Setup: The 1H chart shows a strong rebound from the 0.327 support zone following consolidation. Fresh buying pressure has pushed price toward 0.350 resistance. A confirmed breakout above this level could open the way toward 0.365 and 0.375, while holding above 0.340 remains important$GNS
$GNO
.
Trade Setup: LONG
Entry Zone: 0.343–0.347
TP1: 0.355
TP2: 0.365
TP3: 0.375
SL: 0.327
Market Setup: The 1H chart shows a strong rebound from the 0.327 support zone following consolidation. Fresh buying pressure has pushed price toward 0.350 resistance. A confirmed breakout above this level could open the way toward 0.365 and 0.375, while holding above 0.340 remains important$GNS
$GNO
.
1
63
·
--
ສັນຍານກະທິງ
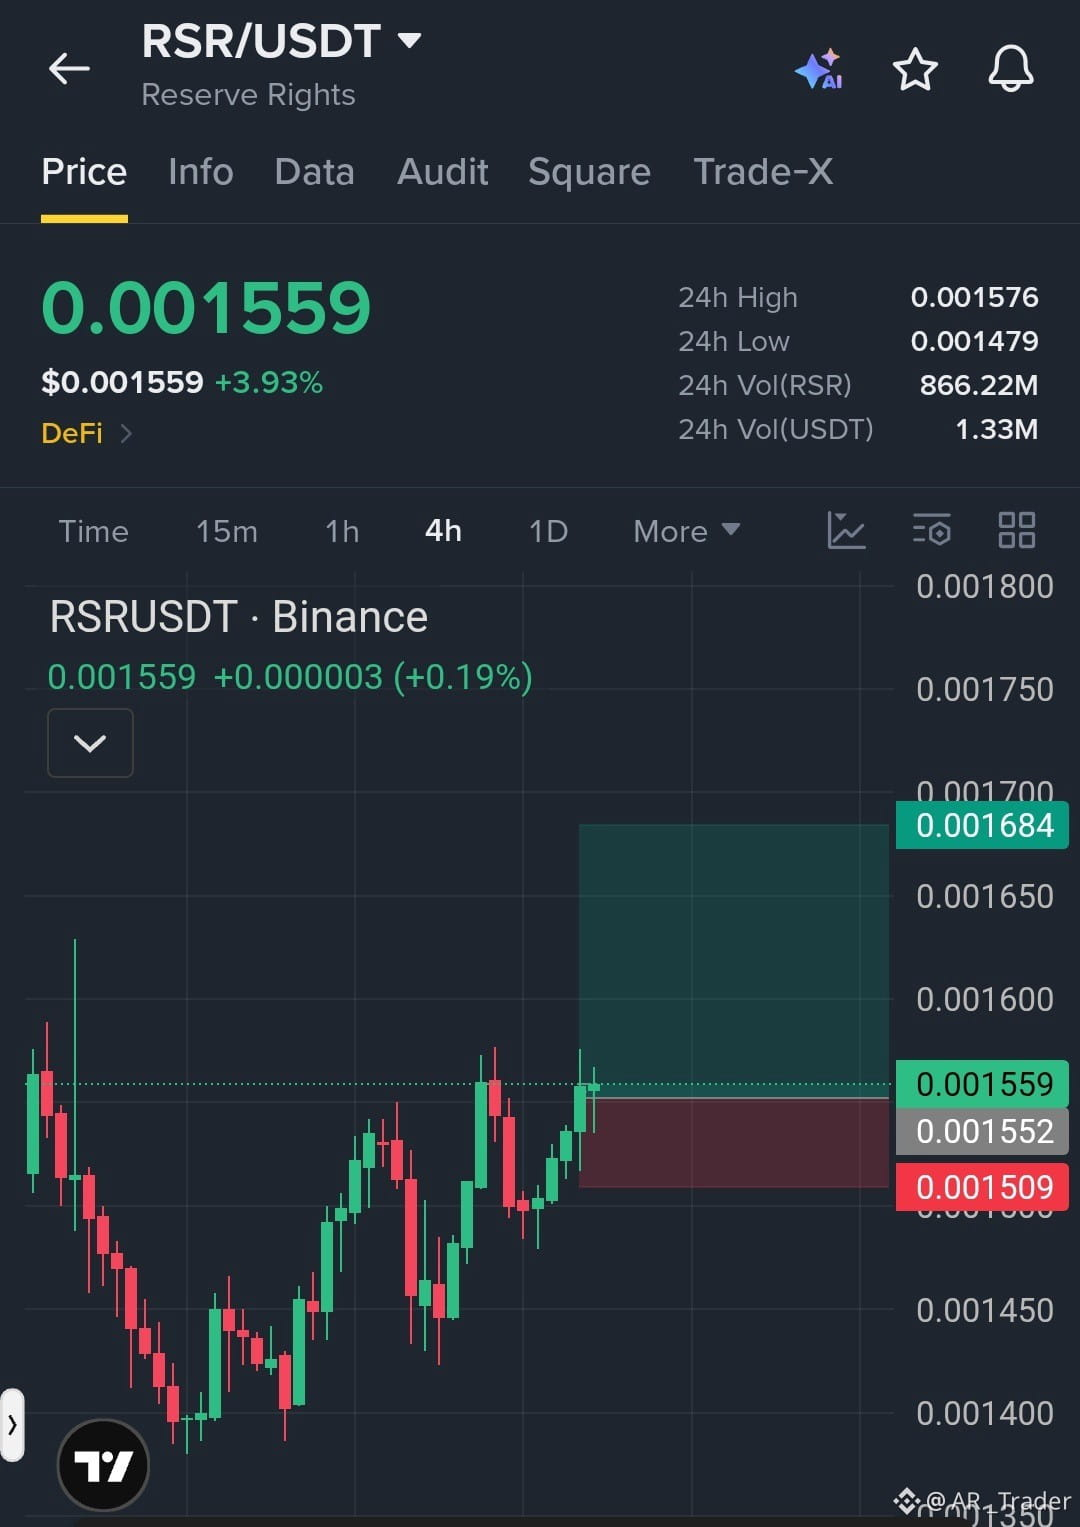
$RSR /USDT Bulls Build Momentum as Price Prepares for Another Upside Move
Trade Setup: LONG
Entry Zone: 0.001550–0.001560
TP1: 0.001600
TP2: 0.001650
TP3: 0.001684
SL: 0.001509
Market Setup: The 4H chart shows a bullish recovery with higher lows and renewed buying pressure. Price is holding above the 0.001550 support area, creating an opportunity for a move toward 0.001600 and higher resistance. A sustained hold above support is important to maintain the bullish structure$RSR
{future}(RSRUSDT)
$RDDTB
{spot}(RDDTBUSDT)
.
$RSR /USDT Bulls Build Momentum as Price Prepares for Another Upside Move
Trade Setup: LONG
Entry Zone: 0.001550–0.001560
TP1: 0.001600
TP2: 0.001650
TP3: 0.001684
SL: 0.001509
Market Setup: The 4H chart shows a bullish recovery with higher lows and renewed buying pressure. Price is holding above the 0.001550 support area, creating an opportunity for a move toward 0.001600 and higher resistance. A sustained hold above support is important to maintain the bullish structure$RSR
$RDDTB
.
Trade Setup: LONG
Entry Zone: 0.001550–0.001560
TP1: 0.001600
TP2: 0.001650
TP3: 0.001684
SL: 0.001509
Market Setup: The 4H chart shows a bullish recovery with higher lows and renewed buying pressure. Price is holding above the 0.001550 support area, creating an opportunity for a move toward 0.001600 and higher resistance. A sustained hold above support is important to maintain the bullish structure$RSR
$RDDTB
.
1
108
·
--
ສັນຍານກະທິງ
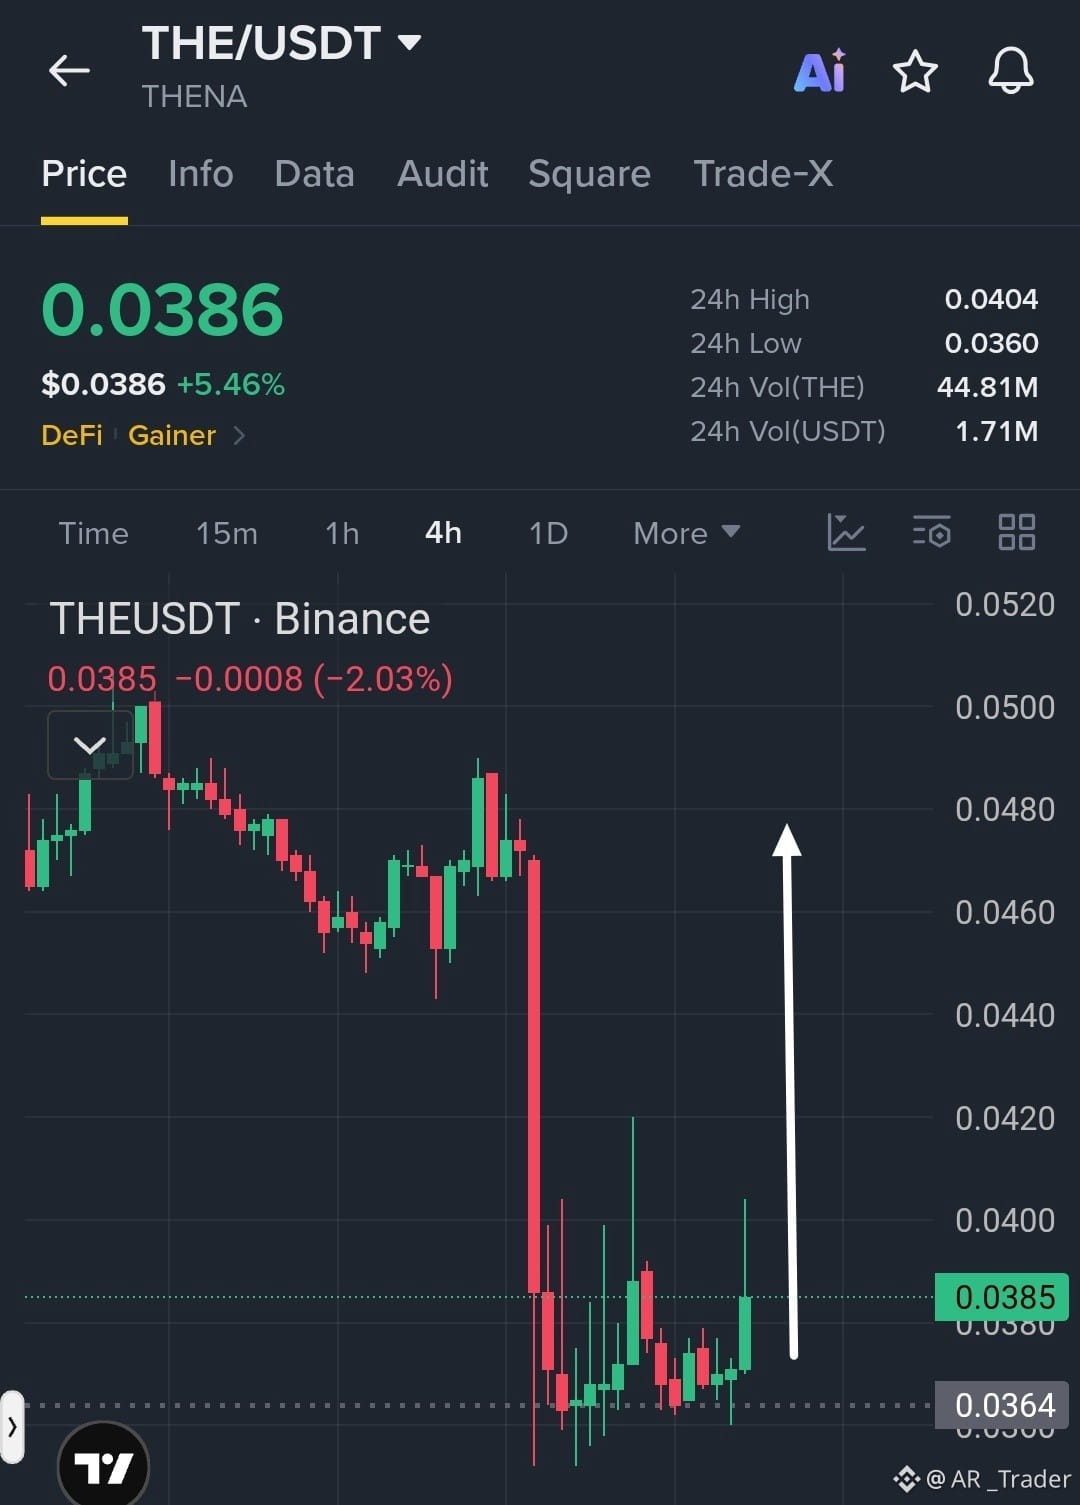
$THE /USDT Bulls Attempt a Strong Recovery After a Major Sell-Off
Trade Setup: LONG
Entry Zone: 0.0380–0.0386
TP1: 0.0404
TP2: 0.0420
TP3: 0.0450
SL: 0.0360
Market Setup: The 4H chart shows a potential bullish recovery after a sharp decline, with price bouncing from the 0.0360–0.0364 support zone. Fresh buying pressure is pushing toward 0.0404 resistance. A confirmed breakout could extend the recovery, while losing support would weaken the setup$THE
{future}(THEUSDT)
.
$THE /USDT Bulls Attempt a Strong Recovery After a Major Sell-Off
Trade Setup: LONG
Entry Zone: 0.0380–0.0386
TP1: 0.0404
TP2: 0.0420
TP3: 0.0450
SL: 0.0360
Market Setup: The 4H chart shows a potential bullish recovery after a sharp decline, with price bouncing from the 0.0360–0.0364 support zone. Fresh buying pressure is pushing toward 0.0404 resistance. A confirmed breakout could extend the recovery, while losing support would weaken the setup$THE
.
Trade Setup: LONG
Entry Zone: 0.0380–0.0386
TP1: 0.0404
TP2: 0.0420
TP3: 0.0450
SL: 0.0360
Market Setup: The 4H chart shows a potential bullish recovery after a sharp decline, with price bouncing from the 0.0360–0.0364 support zone. Fresh buying pressure is pushing toward 0.0404 resistance. A confirmed breakout could extend the recovery, while losing support would weaken the setup$THE
.
1
36
·
--
ສັນຍານກະທິງ
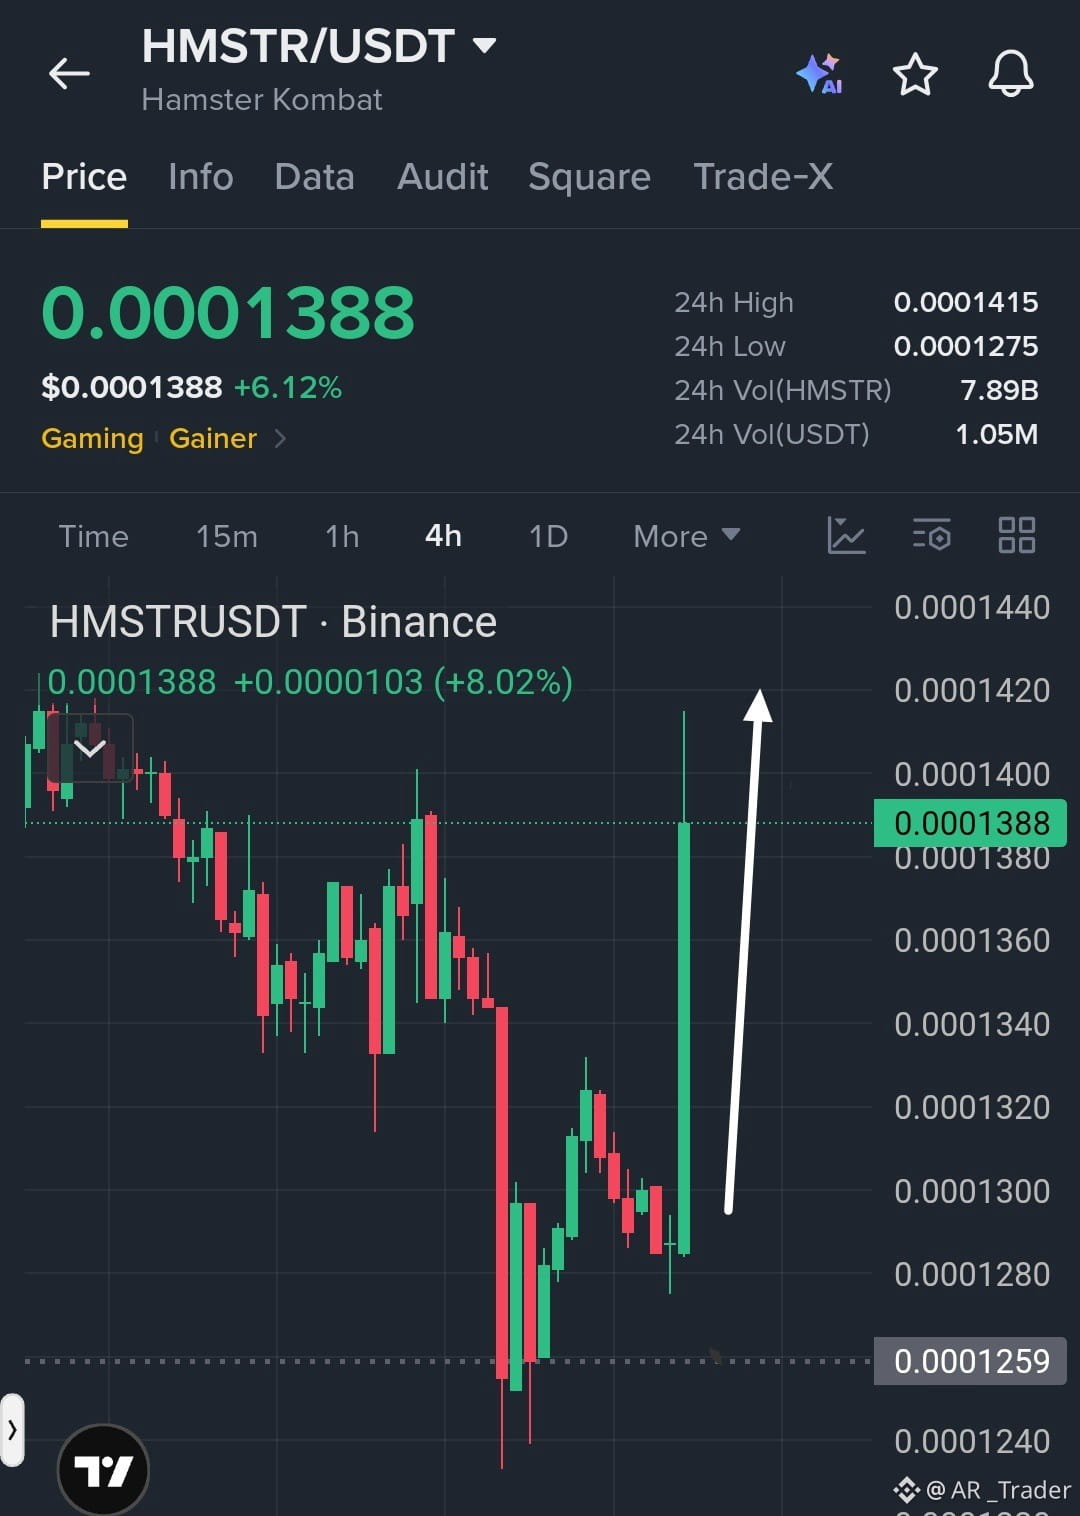
$HMSTR /USDT Bulls Attempt a Powerful Reversal as Buying Pressure Surges
Trade Setup: LONG
Entry Zone: 0.0001370–0.0001388
TP1: 0.0001415
TP2: 0.0001440
TP3: 0.0001480
SL: 0.0001340
Market Setup: A strong bullish candle has emerged on the 4H chart following a recovery from the 0.0001259 support zone. Buyers are pushing toward 0.0001415 resistance. A confirmed breakout could extend the recovery, while holding above 0.0001370 is important for maintaining bullish momentum$HMSTR
{future}(HMSTRUSDT)
.
$HMSTR /USDT Bulls Attempt a Powerful Reversal as Buying Pressure Surges
Trade Setup: LONG
Entry Zone: 0.0001370–0.0001388
TP1: 0.0001415
TP2: 0.0001440
TP3: 0.0001480
SL: 0.0001340
Market Setup: A strong bullish candle has emerged on the 4H chart following a recovery from the 0.0001259 support zone. Buyers are pushing toward 0.0001415 resistance. A confirmed breakout could extend the recovery, while holding above 0.0001370 is important for maintaining bullish momentum$HMSTR
.
Trade Setup: LONG
Entry Zone: 0.0001370–0.0001388
TP1: 0.0001415
TP2: 0.0001440
TP3: 0.0001480
SL: 0.0001340
Market Setup: A strong bullish candle has emerged on the 4H chart following a recovery from the 0.0001259 support zone. Buyers are pushing toward 0.0001415 resistance. A confirmed breakout could extend the recovery, while holding above 0.0001370 is important for maintaining bullish momentum$HMSTR
.
1
54
·
--
ສັນຍານກະທິງ
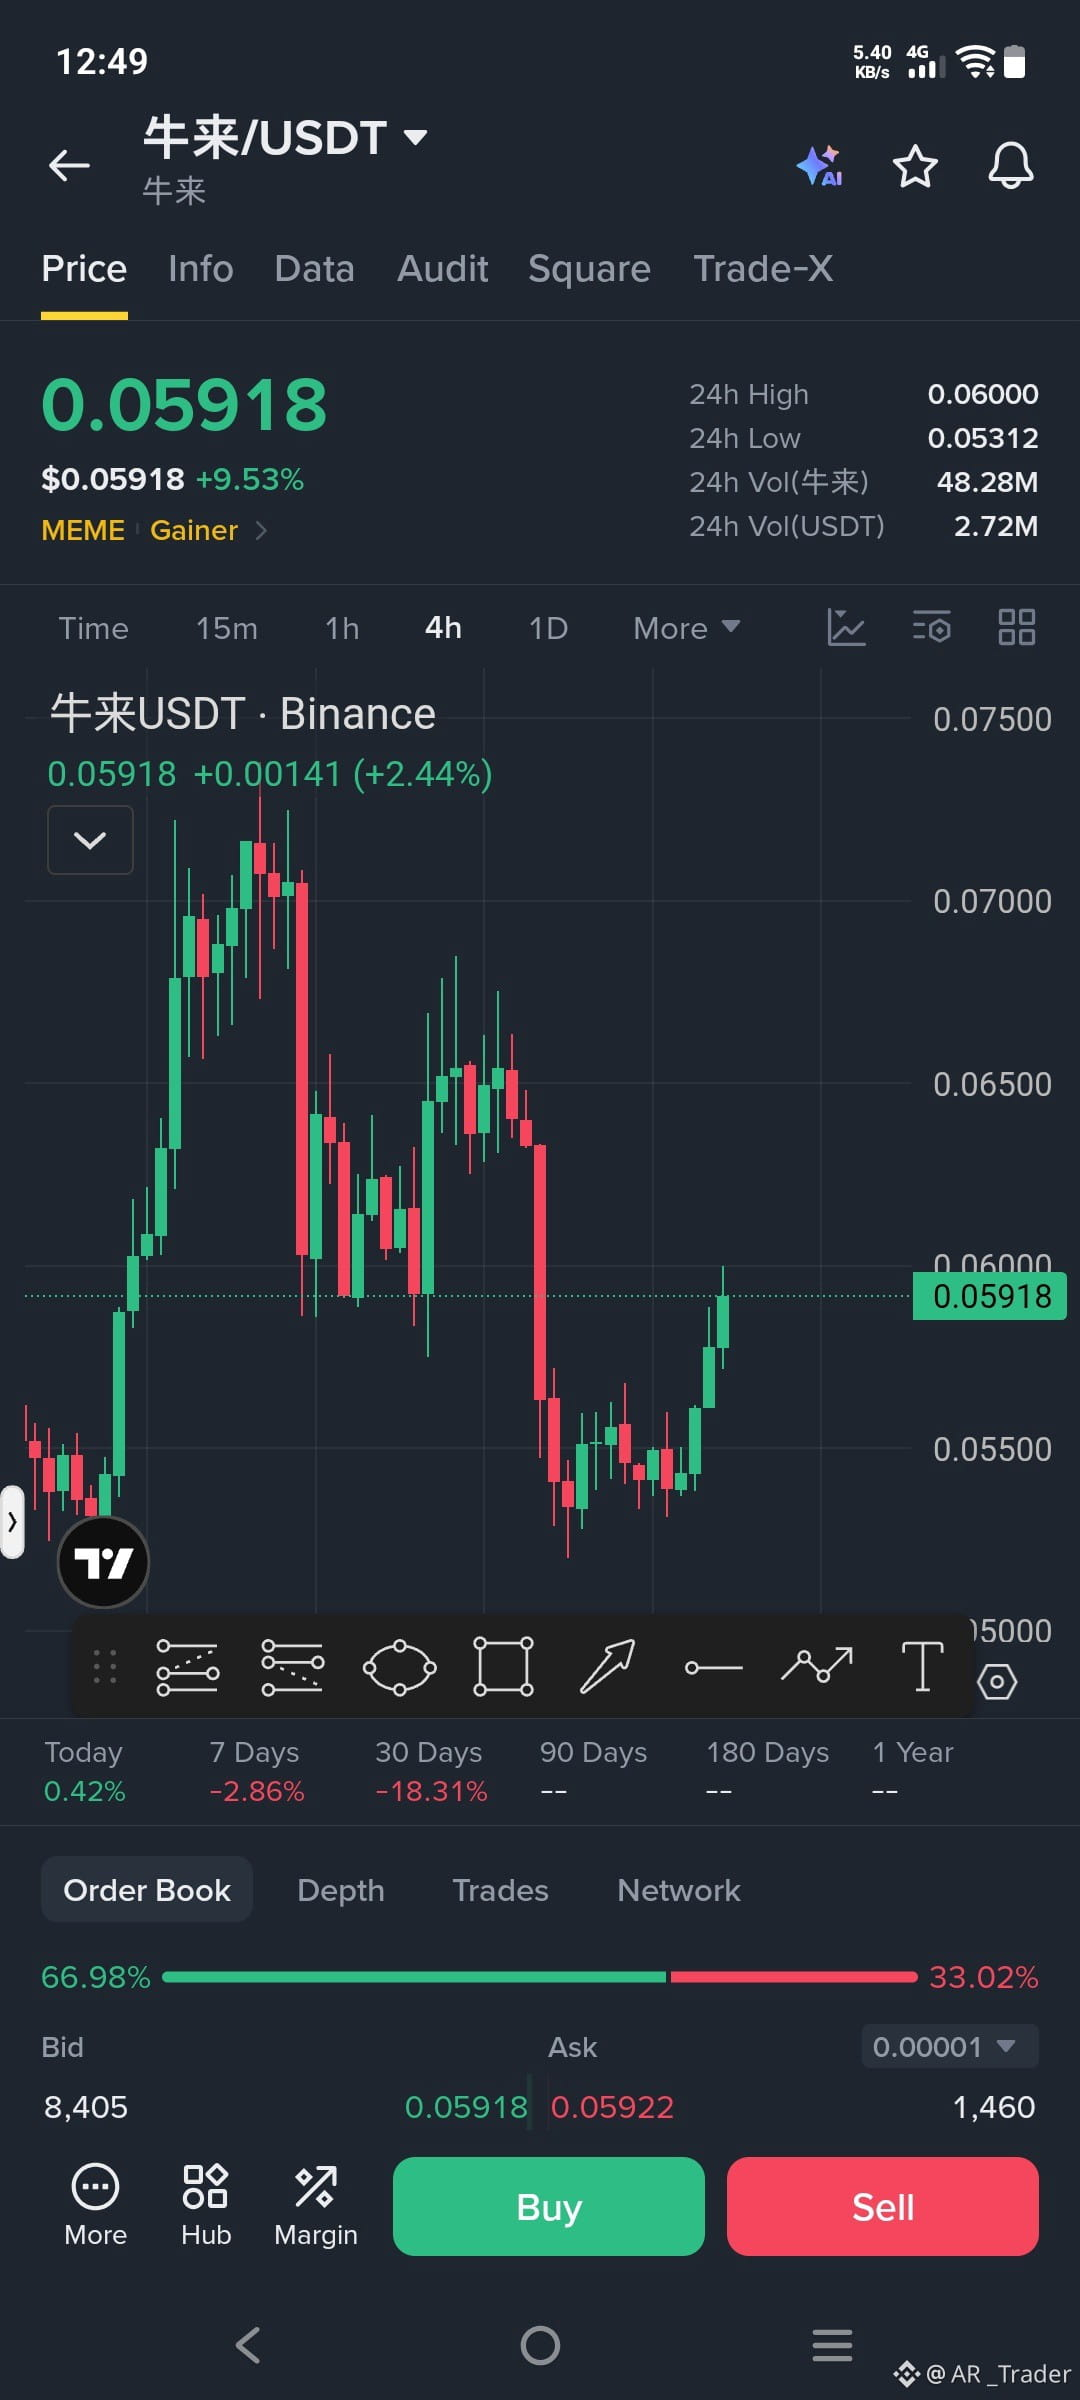
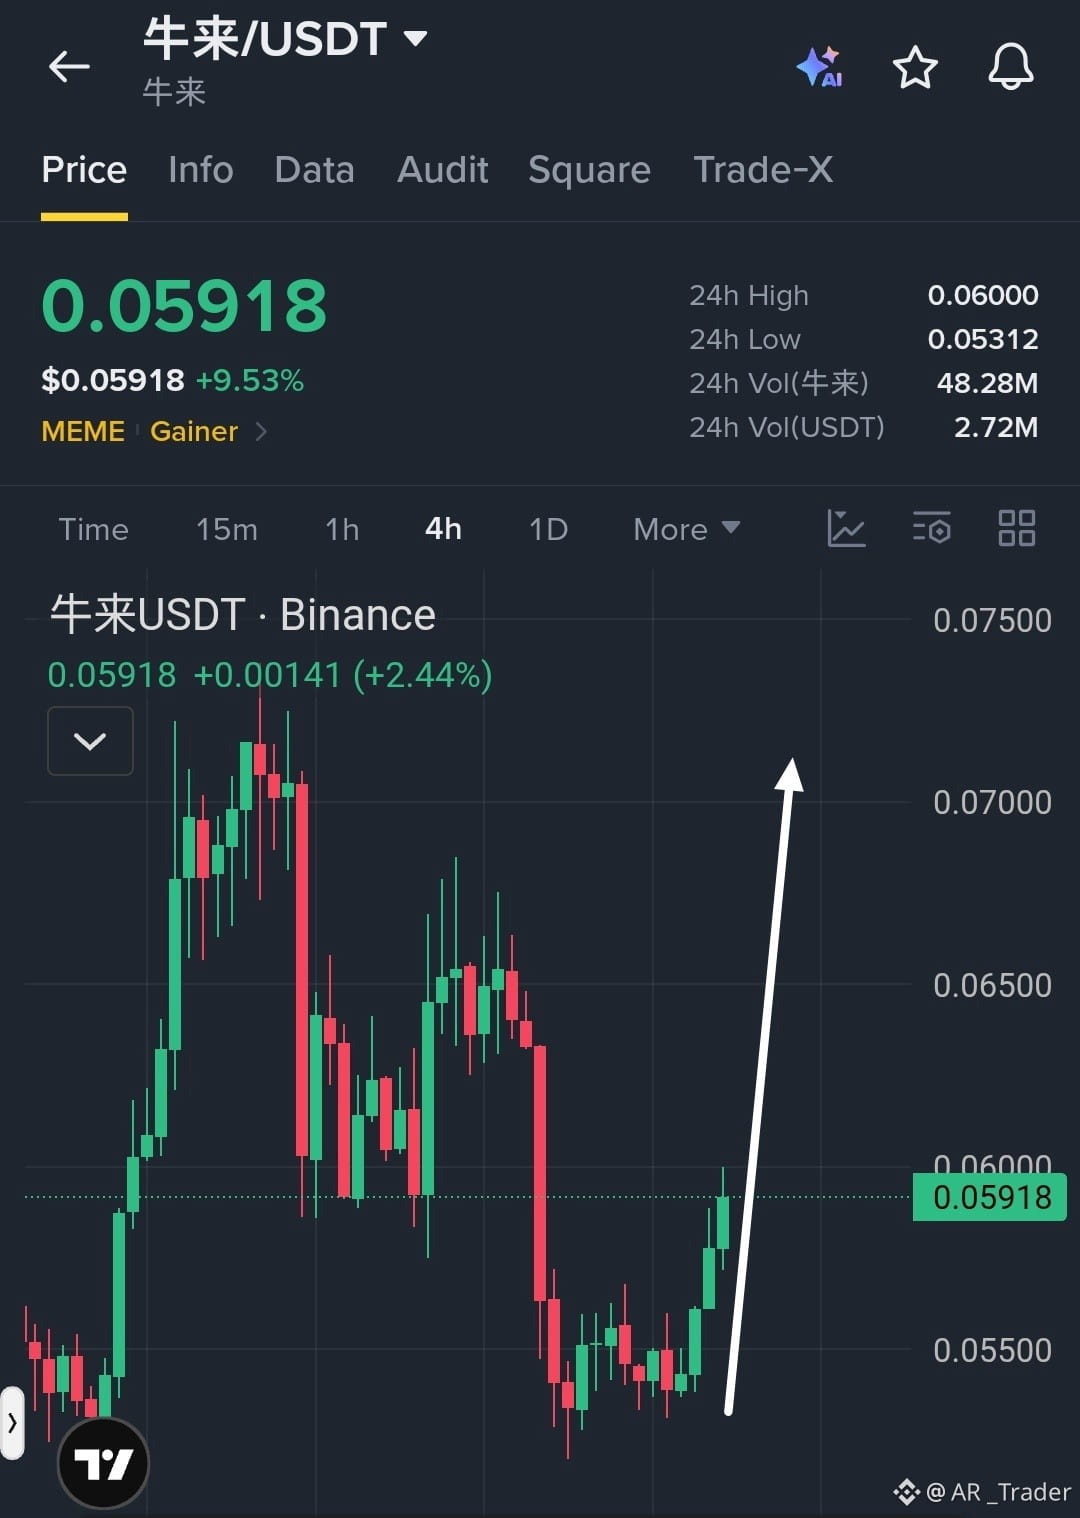
$牛来 /USDT Bulls Stage a Strong Recovery as Upside Momentum Builds
Trade Setup: LONG
Entry Zone: 0.05850–0.05920
TP1: 0.06200
TP2: 0.06500
TP3: 0.07000
SL: 0.05600
Market Setup: The 4H chart shows a strong recovery from the 0.05400 support zone, with consecutive bullish candles indicating renewed buying pressure. A sustained move above 0.06000 could open the way toward 0.06200 and higher resistance levels. Watch for breakout confirmation before entry$WDCB
{spot}(WDCBUSDT)
.
$牛来 /USDT Bulls Stage a Strong Recovery as Upside Momentum Builds
Trade Setup: LONG
Entry Zone: 0.05850–0.05920
TP1: 0.06200
TP2: 0.06500
TP3: 0.07000
SL: 0.05600
Market Setup: The 4H chart shows a strong recovery from the 0.05400 support zone, with consecutive bullish candles indicating renewed buying pressure. A sustained move above 0.06000 could open the way toward 0.06200 and higher resistance levels. Watch for breakout confirmation before entry$WDCB
.
Trade Setup: LONG
Entry Zone: 0.05850–0.05920
TP1: 0.06200
TP2: 0.06500
TP3: 0.07000
SL: 0.05600
Market Setup: The 4H chart shows a strong recovery from the 0.05400 support zone, with consecutive bullish candles indicating renewed buying pressure. A sustained move above 0.06000 could open the way toward 0.06200 and higher resistance levels. Watch for breakout confirmation before entry$WDCB
.
1
76
·
--
ສັນຍານກະທິງ
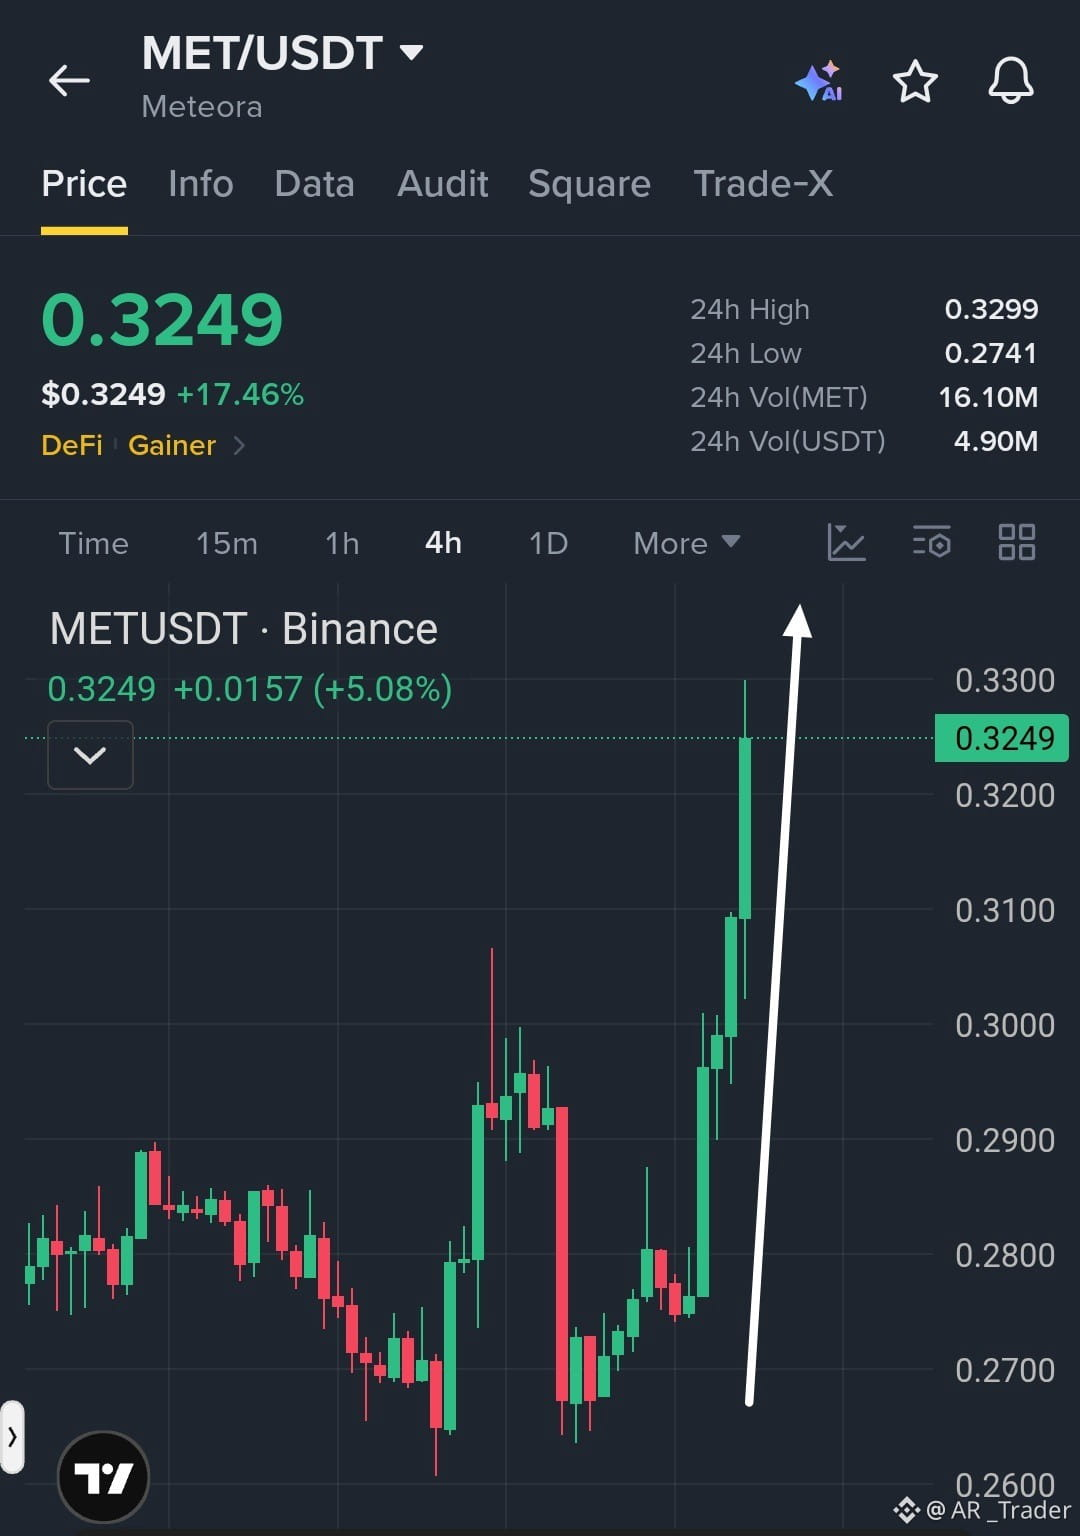
$MET
{future}(METUSDT)
/USDT Bulls Smash Resistance as Powerful Momentum Signals Further Upside
Trade Setup: LONG
Entry Zone: 0.3200–0.3250
TP1: 0.3300
TP2: 0.3400
TP3: 0.3500
SL: 0.3100
Market Setup: Strong bullish momentum is driving a breakout on the 4H chart, with consecutive green candles pushing price toward the 0.3300 resistance zone. A confirmed breakout above this level could trigger another upward move. Holding above 0.3200 remains important to sustain bullish momentum$MET .
$MET
/USDT Bulls Smash Resistance as Powerful Momentum Signals Further Upside
Trade Setup: LONG
Entry Zone: 0.3200–0.3250
TP1: 0.3300
TP2: 0.3400
TP3: 0.3500
SL: 0.3100
Market Setup: Strong bullish momentum is driving a breakout on the 4H chart, with consecutive green candles pushing price toward the 0.3300 resistance zone. A confirmed breakout above this level could trigger another upward move. Holding above 0.3200 remains important to sustain bullish momentum$MET .
/USDT Bulls Smash Resistance as Powerful Momentum Signals Further Upside
Trade Setup: LONG
Entry Zone: 0.3200–0.3250
TP1: 0.3300
TP2: 0.3400
TP3: 0.3500
SL: 0.3100
Market Setup: Strong bullish momentum is driving a breakout on the 4H chart, with consecutive green candles pushing price toward the 0.3300 resistance zone. A confirmed breakout above this level could trigger another upward move. Holding above 0.3200 remains important to sustain bullish momentum$MET .
1
76
·
--
ສັນຍານກະທິງ
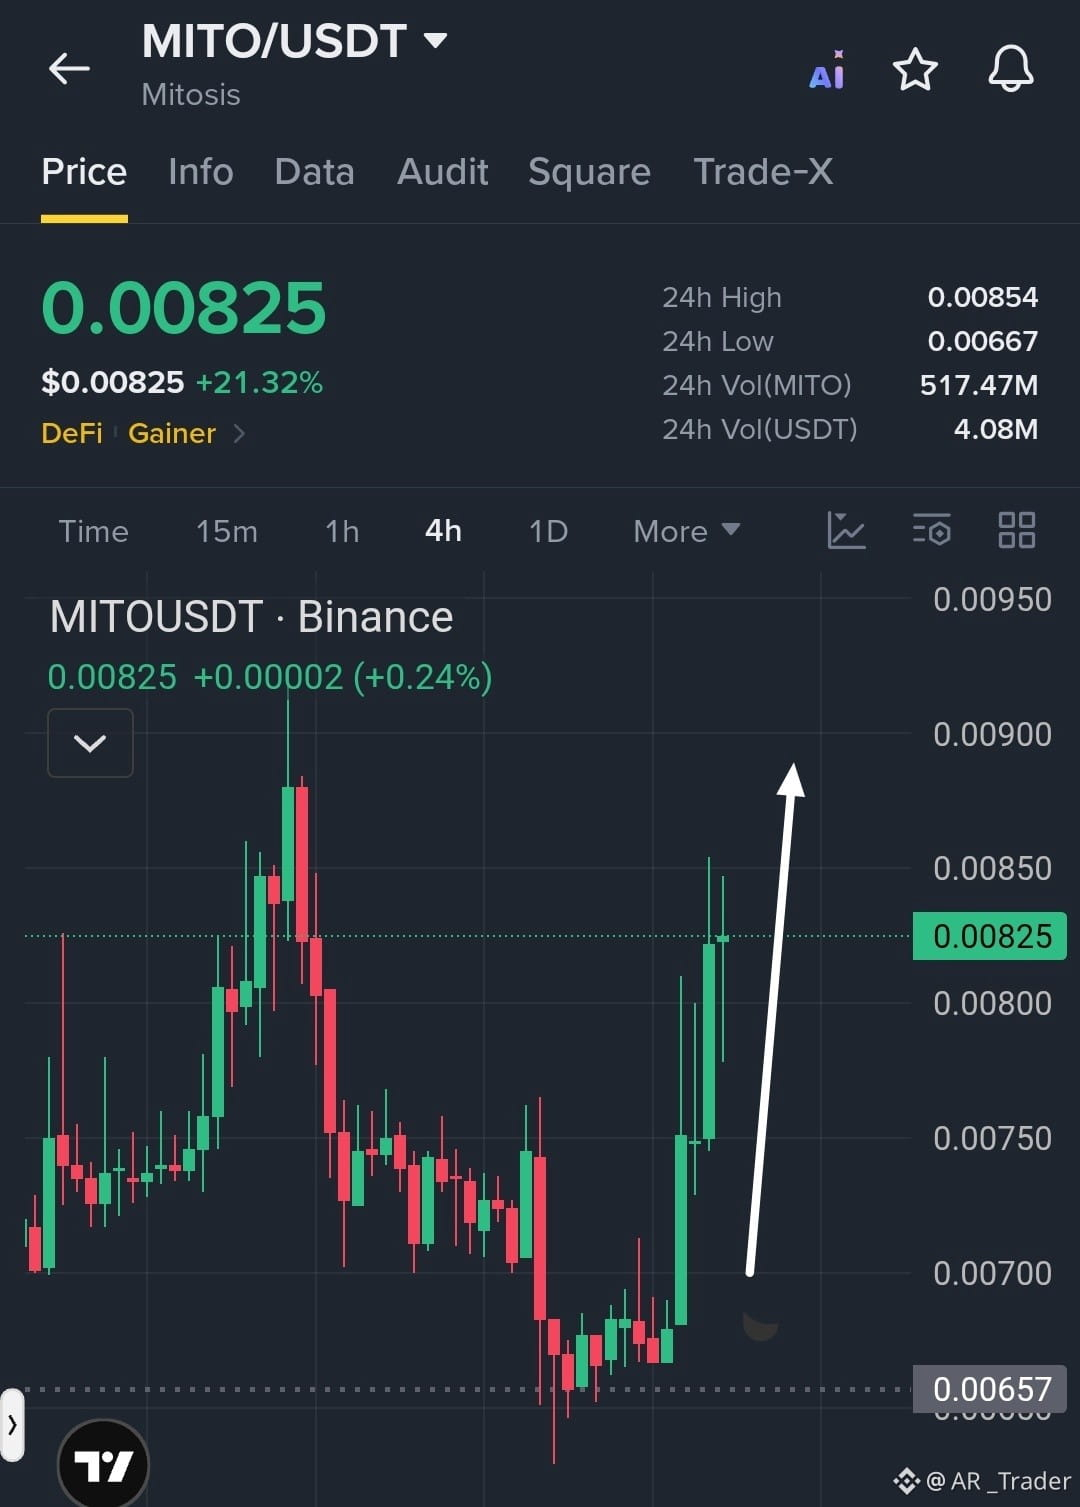
$MITO /USDT Bulls Regain Control as Price Targets Another Major Breakout
Trade Setup: LONG
Entry Zone: 0.00800–0.00825
TP1: 0.00854
TP2: 0.00880
TP3: 0.00920
SL: 0.00765
Market Setup: Strong bullish recovery is visible on the 4H chart after a rebound from the 0.00657 support zone. Consecutive green candles indicate renewed buying pressure. A sustained hold above 0.00800 could push price toward 0.00854 and higher resistance levels. Watch for confirmation before entry$MITO
{spot}(MITOUSDT)
.
$MITO /USDT Bulls Regain Control as Price Targets Another Major Breakout
Trade Setup: LONG
Entry Zone: 0.00800–0.00825
TP1: 0.00854
TP2: 0.00880
TP3: 0.00920
SL: 0.00765
Market Setup: Strong bullish recovery is visible on the 4H chart after a rebound from the 0.00657 support zone. Consecutive green candles indicate renewed buying pressure. A sustained hold above 0.00800 could push price toward 0.00854 and higher resistance levels. Watch for confirmation before entry$MITO
.
Trade Setup: LONG
Entry Zone: 0.00800–0.00825
TP1: 0.00854
TP2: 0.00880
TP3: 0.00920
SL: 0.00765
Market Setup: Strong bullish recovery is visible on the 4H chart after a rebound from the 0.00657 support zone. Consecutive green candles indicate renewed buying pressure. A sustained hold above 0.00800 could push price toward 0.00854 and higher resistance levels. Watch for confirmation before entry$MITO
.
1
30
·
--
ສັນຍານກະທິງ
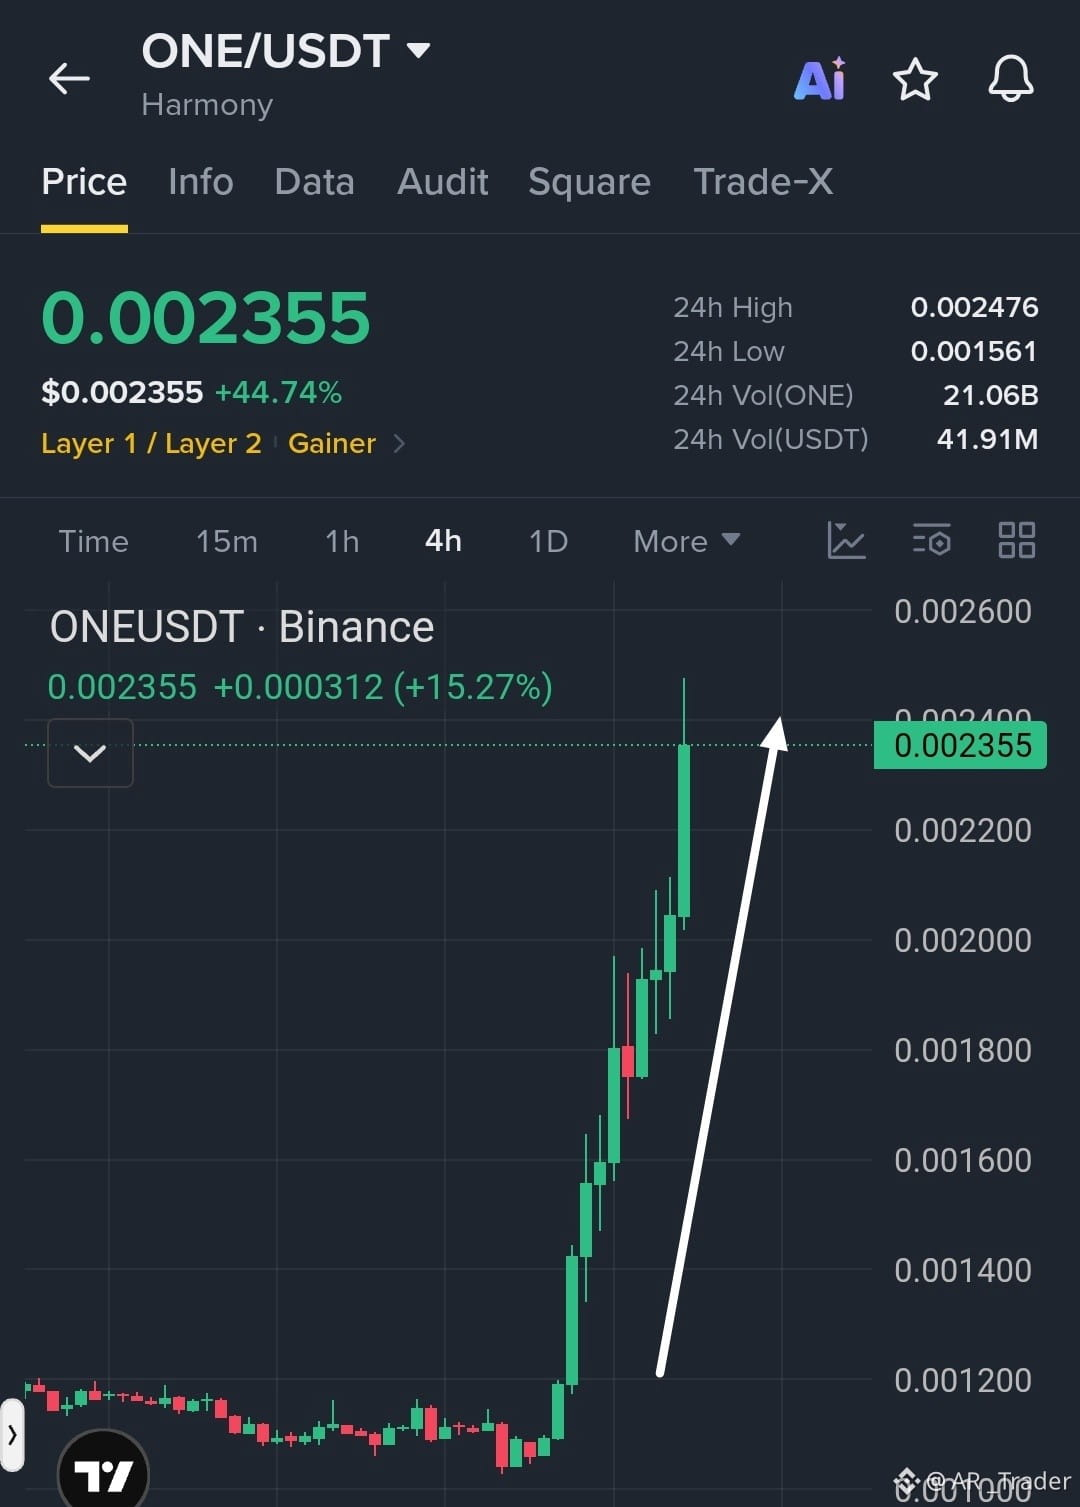
$ONE /USDT Bulls Accelerate Higher as Strong Momentum Fuels Breakout
Trade Setup: LONG
Entry Zone: 0.002280–0.002355
TP1: 0.002476
TP2: 0.002600
TP3: 0.002750
SL: 0.002150
Market Setup: Strong bullish momentum is driving a sharp breakout on the 4H chart, with consecutive green candles showing aggressive buying pressure. Price is approaching resistance near 0.002476. A sustained hold above 0.00228 could support further upside, while a pullback remains possible after this steep rally$ONE
{future}(ONEUSDT)
.
$ONE /USDT Bulls Accelerate Higher as Strong Momentum Fuels Breakout
Trade Setup: LONG
Entry Zone: 0.002280–0.002355
TP1: 0.002476
TP2: 0.002600
TP3: 0.002750
SL: 0.002150
Market Setup: Strong bullish momentum is driving a sharp breakout on the 4H chart, with consecutive green candles showing aggressive buying pressure. Price is approaching resistance near 0.002476. A sustained hold above 0.00228 could support further upside, while a pullback remains possible after this steep rally$ONE
.
Trade Setup: LONG
Entry Zone: 0.002280–0.002355
TP1: 0.002476
TP2: 0.002600
TP3: 0.002750
SL: 0.002150
Market Setup: Strong bullish momentum is driving a sharp breakout on the 4H chart, with consecutive green candles showing aggressive buying pressure. Price is approaching resistance near 0.002476. A sustained hold above 0.00228 could support further upside, while a pullback remains possible after this steep rally$ONE
.
1
46
·
--
ສັນຍານກະທິງ
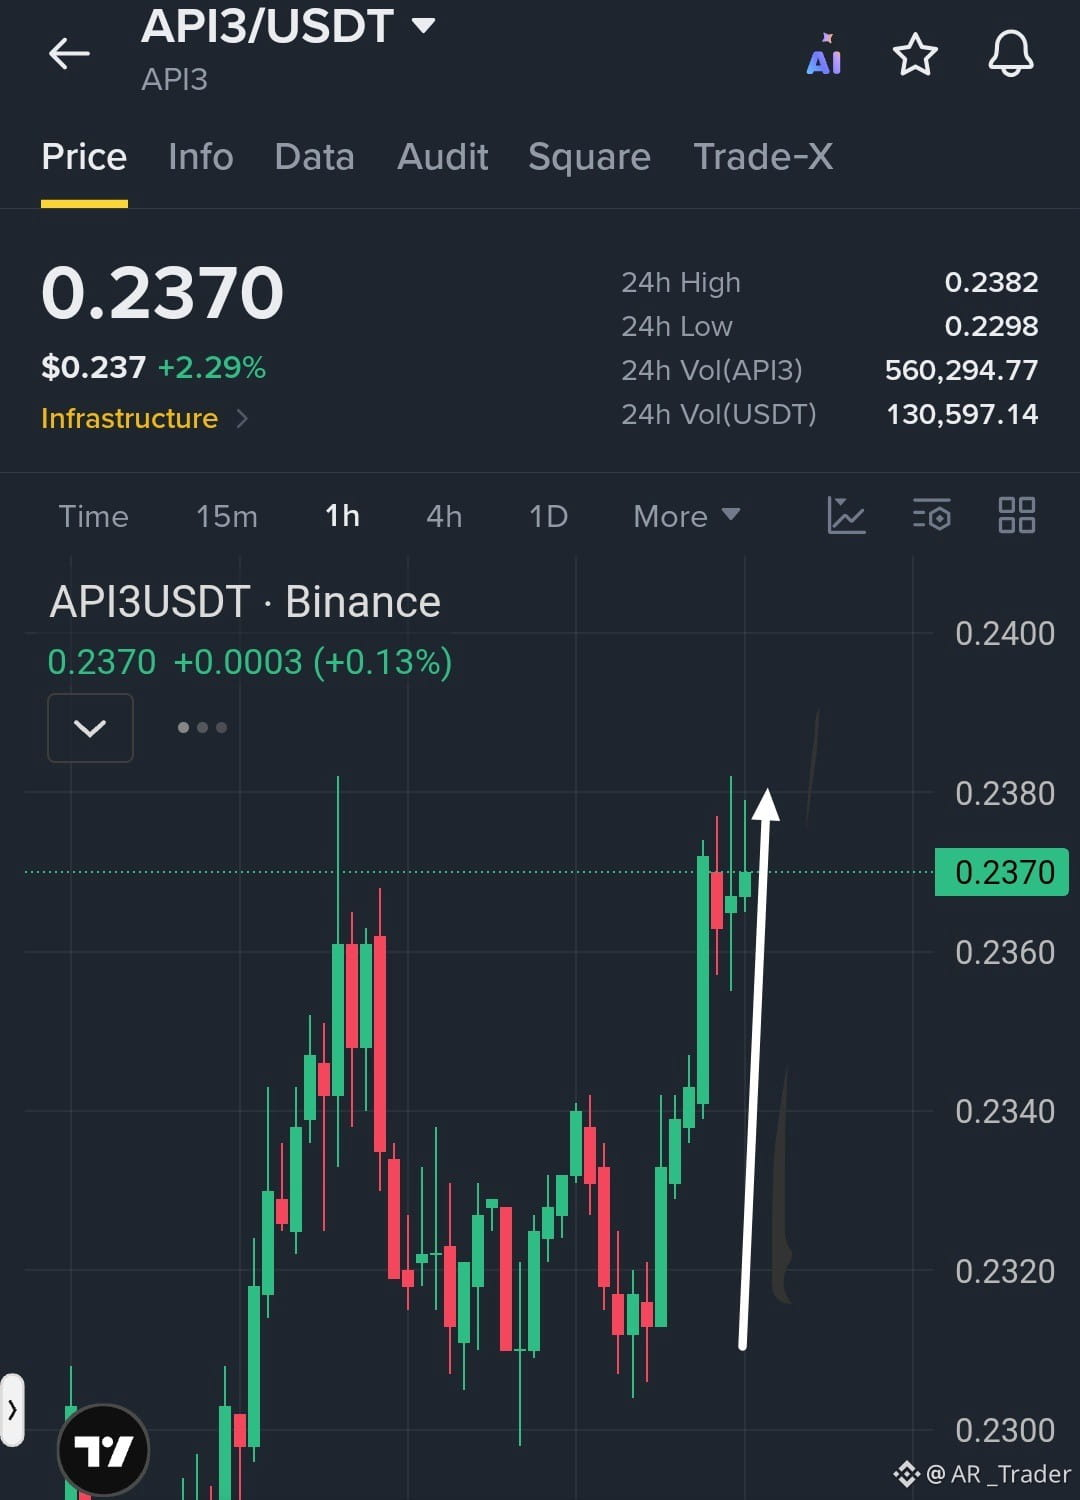
$API3 /USDT Bulls Target a Fresh Breakout Above Key Resistance
Trade Setup: LONG
Entry Zone: 0.2360–0.2375
TP1: 0.2390
TP2: 0.2410
TP3: 0.2440
SL: 0.2325
Market Setup: Strong bullish momentum is visible on the 1H chart, with price recovering from the 0.2310 support area and pushing toward 0.2380 resistance. A confirmed breakout above this level could open the way for further upside. Watch for sustained buying pressure and avoid chasing an unconfirmed breakout$API3
{future}(API3USDT)
.
$API3 /USDT Bulls Target a Fresh Breakout Above Key Resistance
Trade Setup: LONG
Entry Zone: 0.2360–0.2375
TP1: 0.2390
TP2: 0.2410
TP3: 0.2440
SL: 0.2325
Market Setup: Strong bullish momentum is visible on the 1H chart, with price recovering from the 0.2310 support area and pushing toward 0.2380 resistance. A confirmed breakout above this level could open the way for further upside. Watch for sustained buying pressure and avoid chasing an unconfirmed breakout$API3
.
Trade Setup: LONG
Entry Zone: 0.2360–0.2375
TP1: 0.2390
TP2: 0.2410
TP3: 0.2440
SL: 0.2325
Market Setup: Strong bullish momentum is visible on the 1H chart, with price recovering from the 0.2310 support area and pushing toward 0.2380 resistance. A confirmed breakout above this level could open the way for further upside. Watch for sustained buying pressure and avoid chasing an unconfirmed breakout$API3
.
1
28
ເຂົ້າສູ່ລະບົບເພື່ອສຳຫຼວດເນື້ອຫາເພີ່ມເຕີມ
ເຂົ້າຮ່ວມກຸ່ມຜູ້ໃຊ້ຄຣິບໂຕທົ່ວໂລກໃນ Binance Square.
⚡️ ໄດ້ຮັບຂໍ້ມູນຫຼ້າສຸດ ແລະ ທີ່ມີປະໂຫຍດກ່ຽວກັບຄຣິບໂຕ.
💬 ໄດ້ຮັບຄວາມໄວ້ວາງໃຈຈາກຕະຫຼາດແລກປ່ຽນຄຣິບໂຕທີ່ໃຫຍ່ທີ່ສຸດໃນໂລກ.
👍 ຄົ້ນຫາຂໍ້ມູນເຊີງເລິກທີ່ແທ້ຈາກນັກສ້າງທີ່ໄດ້ຮັບການຢືນຢັນ.
ອີເມວ / ເບີໂທລະສັບ
ຫົວຂໍ້ທີ່ກໍາລັງນິຍົມ
JobsReportRaisesHikeOdds
515,224 ຄັ້ງທີ່ເບິ່ງ
3,321 ກຳລັງສົນທະນາ
TradFi News | US Adds 165,000 Jobs in October, More Than Double the 65,000 Forecast, as Unemployment Falls to 4.1%
Binance News
·42 ຖືກໃຈ
·24.2k ຄັ້ງທີ່ເບິ່ງ
CPITestsDecemberRateOutlook
148,467 ຄັ້ງທີ່ເບິ່ງ
1,098 ກຳລັງສົນທະນາ
BitcoinRebounds$75KAsChipsLead
47,455 ຄັ້ງທີ່ເບິ່ງ
341 ກຳລັງສົນທະນາ