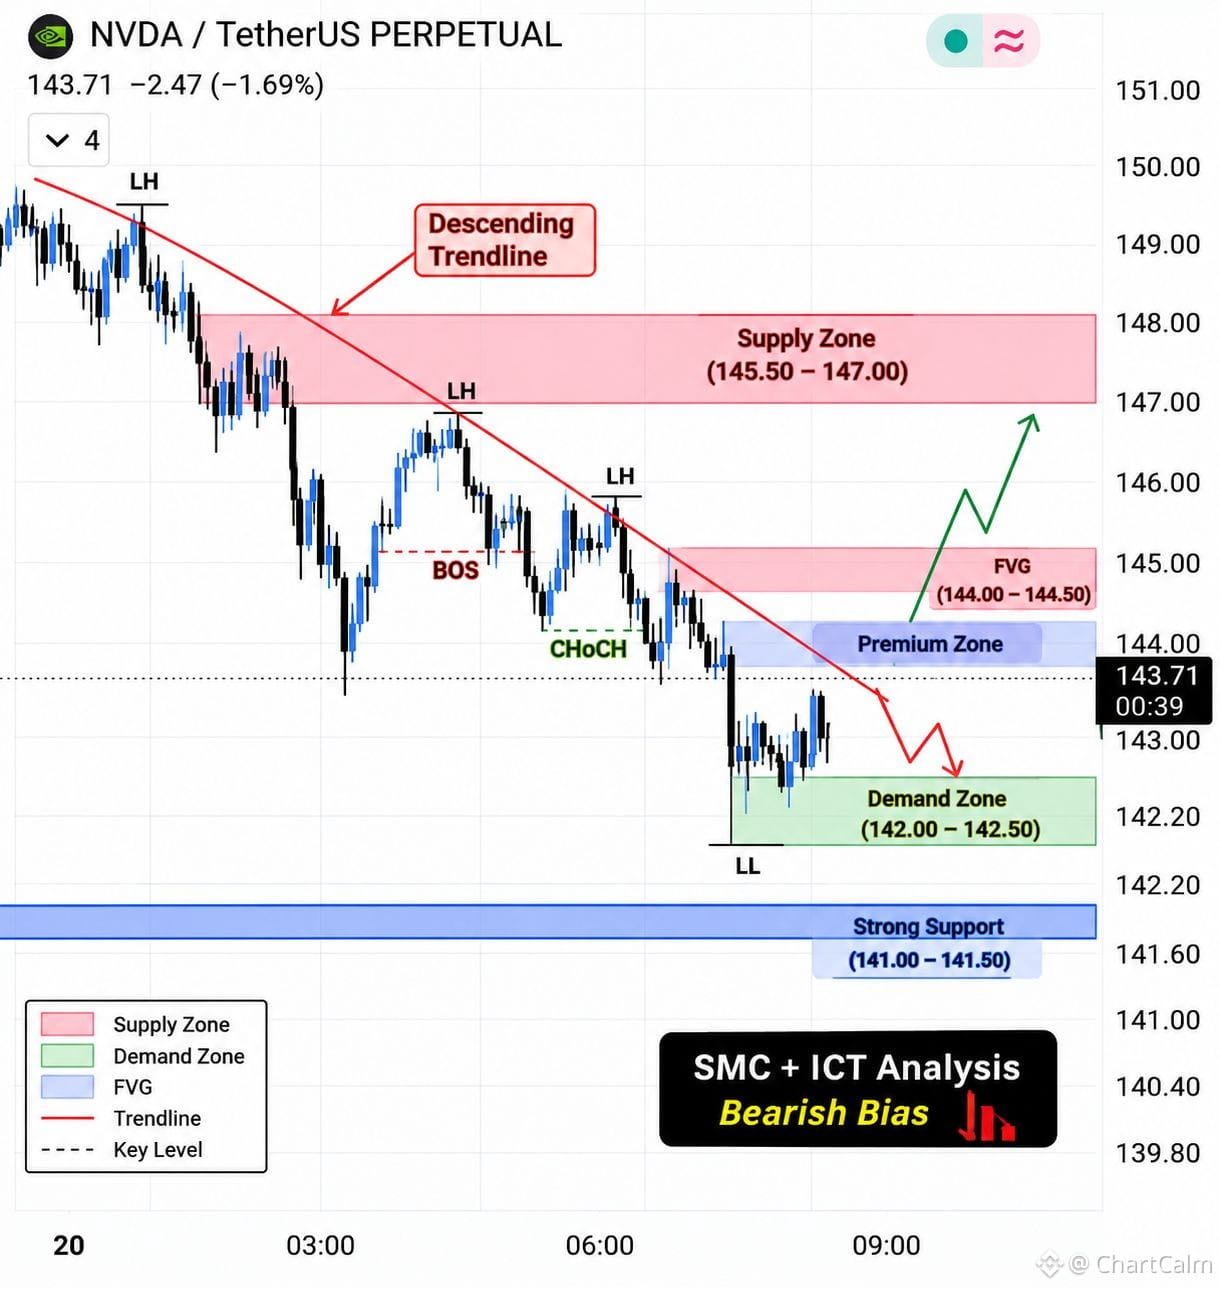
📉 NVDAUSDT | 5M SMC + ICT ANALYSIS
Bearish Structure – Sellers Still in Control?
NVDA is showing a clear bearish market structure with consecutive Lower Highs (LH) and Lower Lows (LL).
🔍 Key Levels & Observations
🔴 Supply Zone: 145.50 – 147.00
🔴 FVG: 144.00 – 144.50
🔵 Premium Zone: Around 144.00
🟢 Demand Zone: 142.00 – 142.50
🔵 Strong Support: 141.00 – 141.50
📊 SMC + ICT Breakdown
• Multiple bearish BOS formations.
• CHoCH indicates a structural shift.
• Descending trendline confirms downward pressure.
• Price is consolidating near the recent lows.
📉 Bearish Scenario: A rejection from nearby resistance could bring another move towards the demand zone.
📈 Bullish Scenario: A confirmed break above the descending trendline may signal a potential recovery.
My View: Bearish bias until the market shows a confirmed structural change.
What is your view on NVDA? Bearish continuation or bullish reversal? 👀
⚠️ Educational analysis only. Not financial advice.
#NVDA #SMC #ICT #PriceAction $NVDA
#cryptotrading
Bearish Structure – Sellers Still in Control?
NVDA is showing a clear bearish market structure with consecutive Lower Highs (LH) and Lower Lows (LL).
🔍 Key Levels & Observations
🔴 Supply Zone: 145.50 – 147.00
🔴 FVG: 144.00 – 144.50
🔵 Premium Zone: Around 144.00
🟢 Demand Zone: 142.00 – 142.50
🔵 Strong Support: 141.00 – 141.50
📊 SMC + ICT Breakdown
• Multiple bearish BOS formations.
• CHoCH indicates a structural shift.
• Descending trendline confirms downward pressure.
• Price is consolidating near the recent lows.
📉 Bearish Scenario: A rejection from nearby resistance could bring another move towards the demand zone.
📈 Bullish Scenario: A confirmed break above the descending trendline may signal a potential recovery.
My View: Bearish bias until the market shows a confirmed structural change.
What is your view on NVDA? Bearish continuation or bullish reversal? 👀
⚠️ Educational analysis only. Not financial advice.
#NVDA #SMC #ICT #PriceAction $NVDA
#cryptotrading