
━━━━━━━━━━━━━━━━━━━━
MARKET OVERVIEW
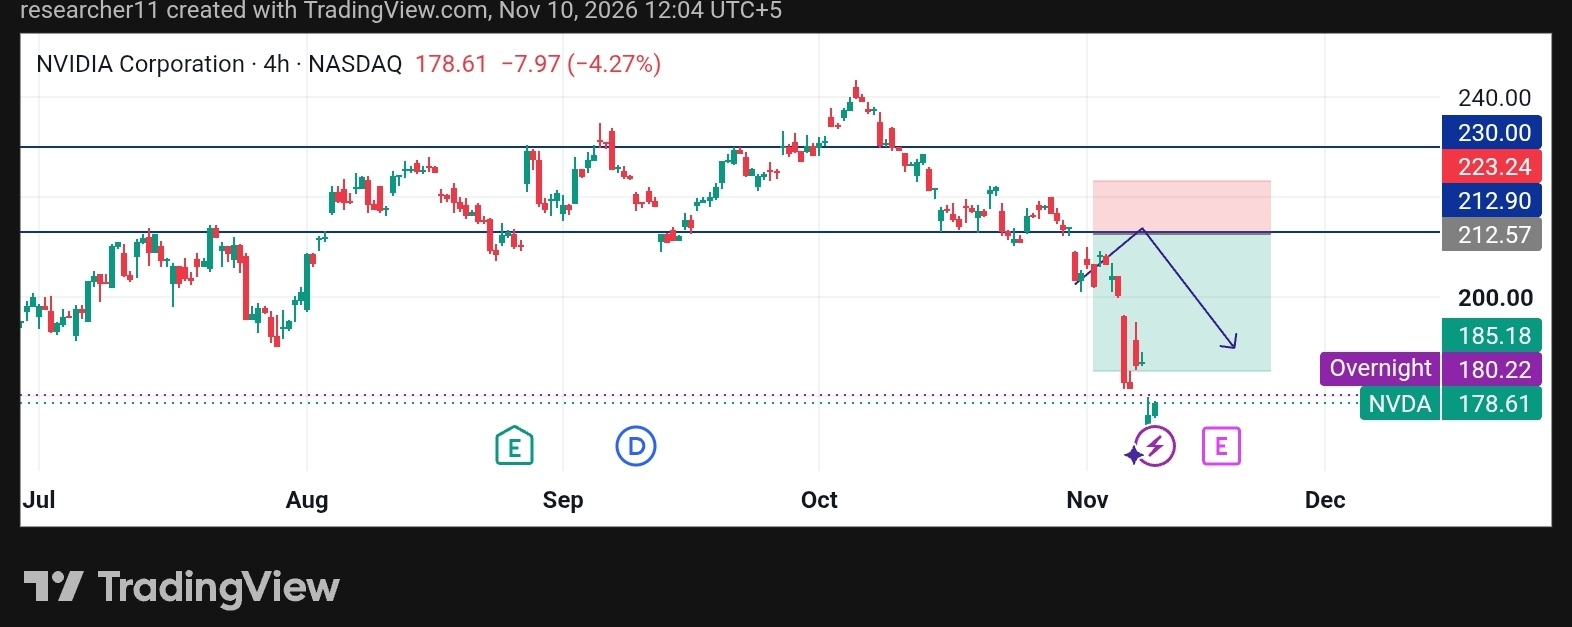
NVIDIA (NVDA) is trading near $178.61 on the 4H chart, down about 4.27% on the day. After peaking in early October, the stock has slid steadily. The early-November drop was sharp and fast, so volatility is clearly elevated.
━━━━━━━━━━━━━━━━━━━━
TECHNICAL ANALYSIS
Price failed to hold the $212.57 zone. A weak bounce into that area was rejected, and sellers pushed price lower in a strong impulsive move. The structure shows lower highs and lower lows, which is a classic bearish trend.
Price has already moved through the $185 area. A small green candle has appeared at the lows, but it looks like a minor reaction, not a confirmed reversal. Overnight trading near $180.22 shows buyers are only testing the waters.
━━━━━━━━━━━━━━━━━━━━
CONTEXT
Other mega-cap tech names are bouncing, while NVDA is lagging. That relative weakness is worth watching.
━━━━━━━━━━━━━━━━━━━━
SCENARIOS
🔴 Bearish Case: A rejection at $185 and a 4H close below the recent low keeps downside momentum alive.
🟢 Bullish Case: A strong 4H close back above $185.18 would suggest the selloff is cooling, with a relief move toward $212 possible.
⚪ Neutral Case: Price chops between the recent low and $185 while the market digests the drop.
━━━━━━━━━━━━━━━━━━━━
KEY LEVELS
🔺 Resistance: R1: $185.18 | R2: $212.57
🔻 Support: S1: ~$175 (recent swing low) | S2: below $175, where price enters fresh lows
━━━━━━━━━━━━━━━━━━━━
CONCLUSION
NVDA is still in a bearish structure. The key question is whether $185 turns into resistance or gets reclaimed. Watch the 4H closes around that level for the next clue.
⚠️ This is market analysis for informational purposes only, not financial advice.
#Nvidia's #CPITestsDecemberRateOutlook $NVDA