


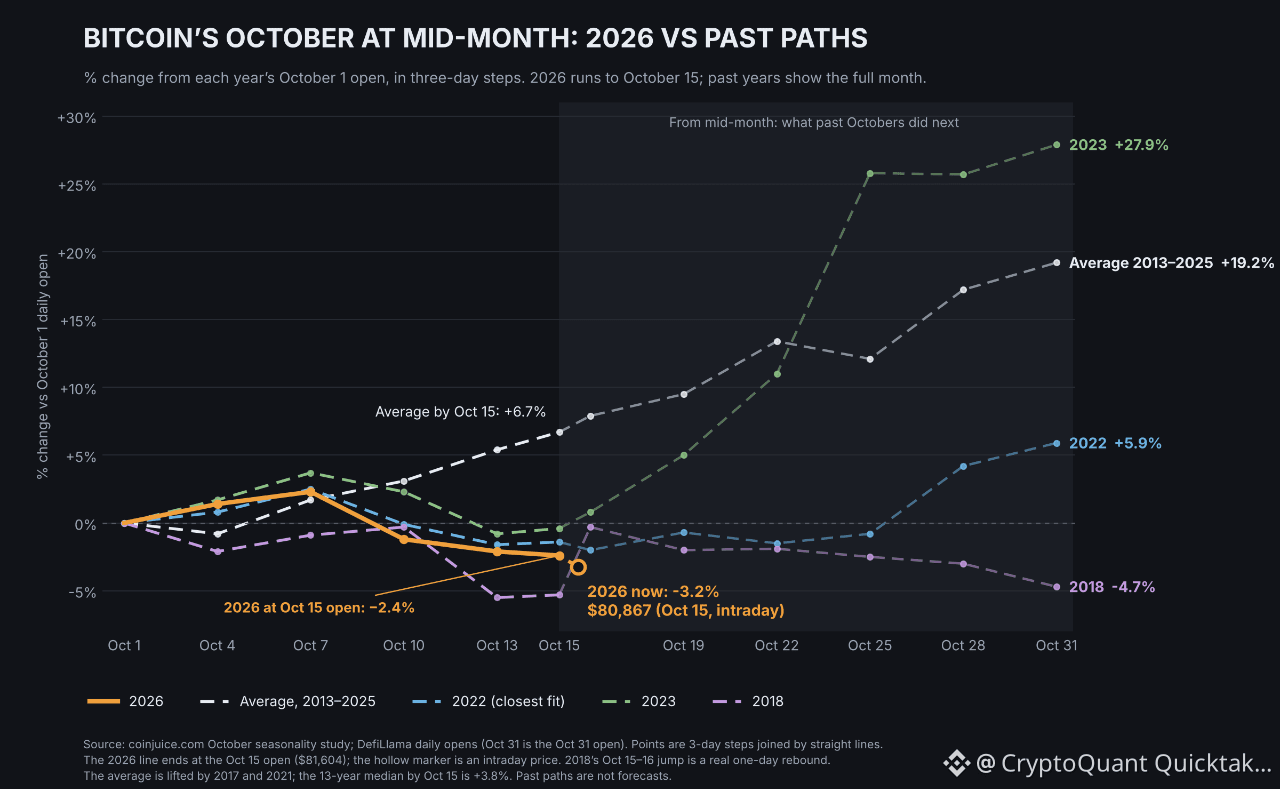
Bitcoin began October stronger than usual, but the move faded during the second week as BTC fell below its October 1 open of $83,576.
As of October 15, BTC trades near $80,867, around 3.2% below its October 1 open.
By the October 15 open, Bitcoin has historically averaged a 6.7% gain across 2013–2025; the median gain was 3.8%. That leaves 2026 roughly 10 percentage points below the historical average path.
Among past Octobers:
- 2022 — closest to 2026 so far: BTC peaked around October 5, turned negative near October 8, then stayed range-bound until about October 25 before ending October 5.9% above its October 1 opening price.
- 2023 — late-month strength: BTC accelerated in the second half and rose 27.9% by the October 31 open, measured from the October 1 open.
- 2018 — stayed weak: BTC ended October 4.7% below its October 1 opening price.
---------
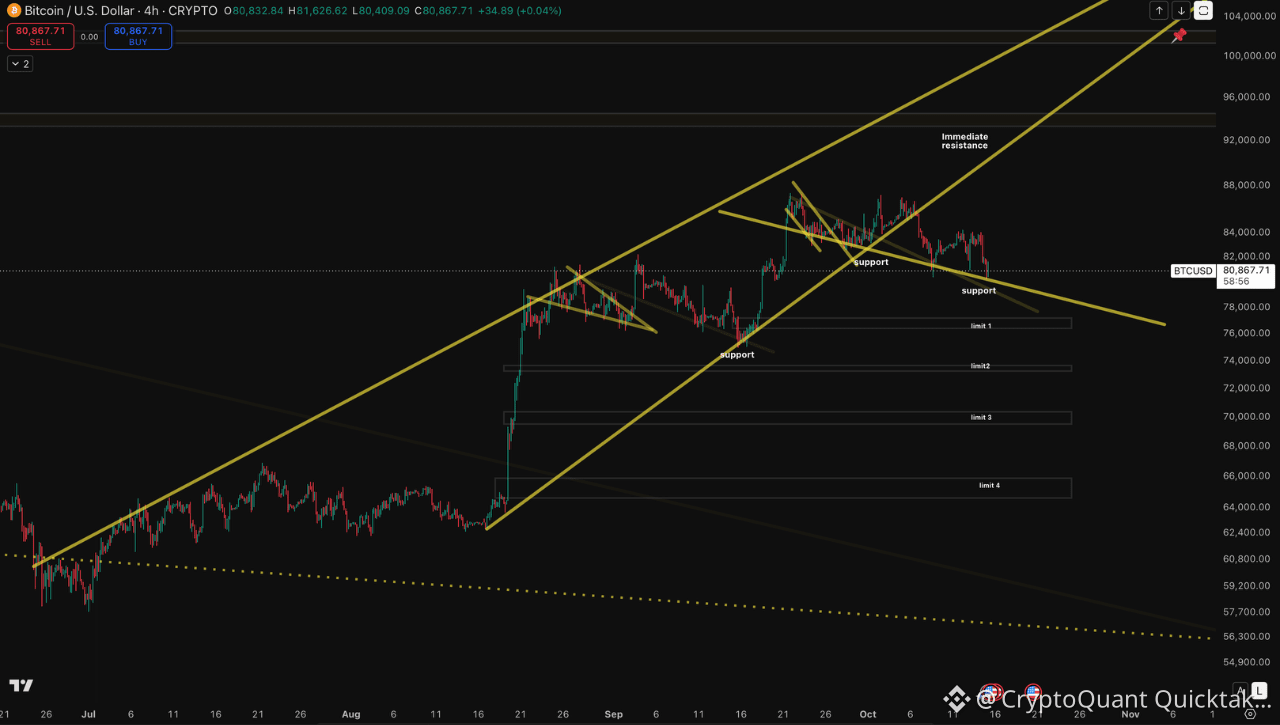
Chart Pattern: BTC broke below a rising ascending-wedge structure on the 4-hour chart on October 7. The pattern had formed over roughly three months, with multiple tests of both boundaries.
BTC is now testing trendline support near $80.4K, close to the October 8 low and being retested today. The line in the sand is the support trendline currently near $80.4K.
A sustained hold would keep a rebound toward the former wedge support, now short-term resistance, in focus. A confirmed 4-hour close below the support trendline would weaken that rebound case and shift attention to prior consolidation areas near $77K, $73.5K, $70K and $64K.
Written by Andrew Kamsky