


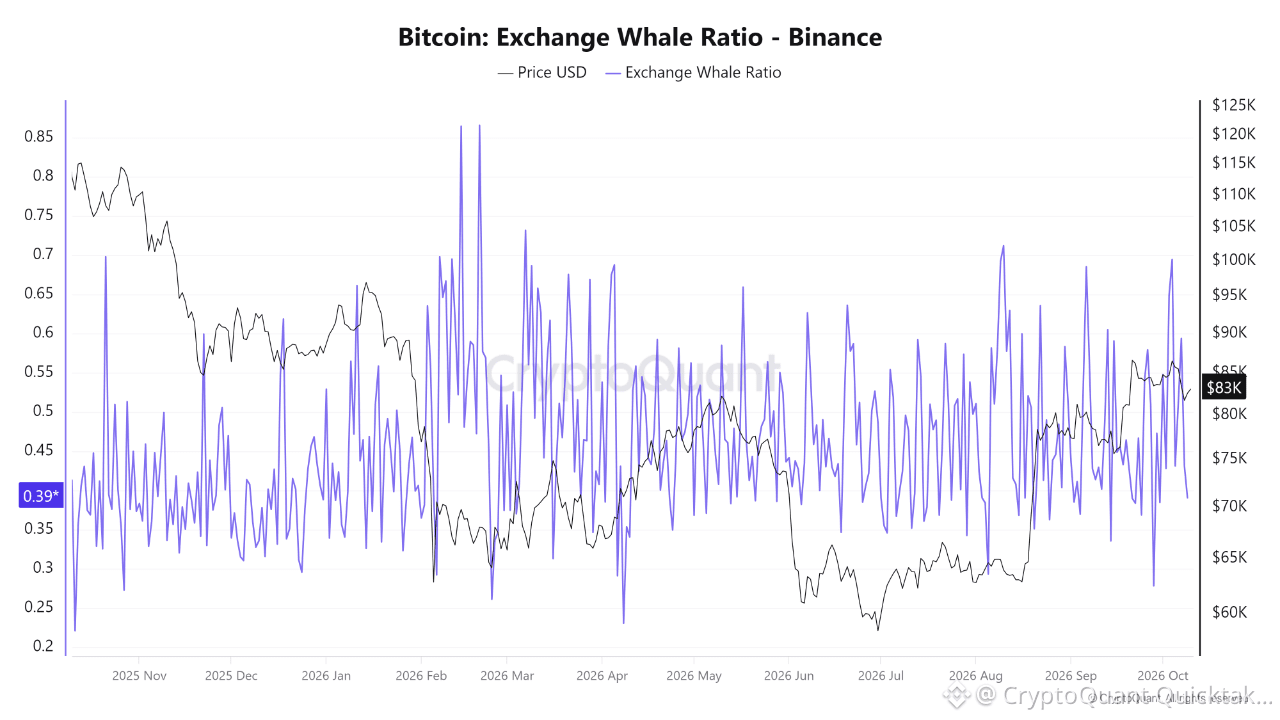
The ten largest deposits accounted for roughly 70% of Binance's Bitcoin inflow in early October. Today that share reads 0.39, with price steady at $83K.
The Exchange Whale Ratio measures how much of exchange inflow comes from the biggest transactions. Low readings mean inflow is spread across many smaller deposits, high readings mean a few large wallets dominate. Across this window the series runs from about 0.2 to 0.87 and swings hard day to day, so single prints carry little information. Clusters matter more.
The heaviest cluster arrived in mid February, shortly after the early February drop, with two readings near 0.86 while price hovered in the mid to high $60Ks. Large deposits stacking up into weakness is the textbook sell side reading. The mid August spike near 0.7 behaves differently. It landed almost on the cycle low near $63K, days before price rallied into the $70Ks. Same signal, opposite outcome, which is a good reason not to treat any single spike as a timing tool.
What stands out to me now is where the ratio sits against its own history. Most of the chart orbits around 0.45, and 0.39 is slightly under that, so large wallets are not dominating Binance inflow at $83K.
That reading has limits. A falling ratio can come from whales going quiet or from smaller deposits growing, and it never reveals intent. A deposit is not a sale.
What would change my view: another jump above 0.6 while price is still stable near $83K. Heavy deposits without a decline already underway would be a cleaner distribution signal than any single reading this year.
Written by R3N