Bitcoin's cyclical trap at the 61% mark?
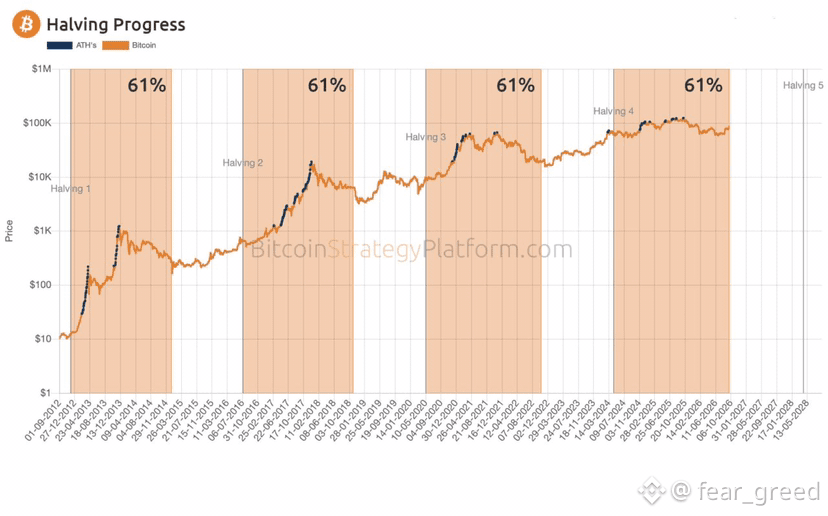
When analyzing the price today, I stumbled upon a mathematical pattern of Bitcoin that repeats from cycle to cycle. We are talking about the point of 61% progress between halvings.
Every time Bitcoin crosses exactly 61% of the time path from one reduction in miner rewards to the next, which is approximately 500 to 550 days after the halving, the uptrend faces a powerful wall of resistance.
For example, in 2013 to 2014 at this mark, the market reversed and plunged into a prolonged bearish trend. In 2017 to 2018 the 61% point coincided with the historic peak near $20,000, after which the crypto winter began. In 2021 to 2022 crossing this border marked the final hype of late 2021 around $69,000 and triggered a long downward cycle.
What to expect now? Right now, the industry has once again approached this dangerous historical zone. However, this cycle has a fundamental difference which is a massive influx of institutional capital through spot ETFs. Unlike previous years when the market was ruled strictly by retail panic, today large funds create a strong foundation of support. This is exactly why the current selling pressure is likely to lead not to a catastrophic 80% collapse, but to a softer consolidation and a moderate correction.
What do you think?
When analyzing the price today, I stumbled upon a mathematical pattern of Bitcoin that repeats from cycle to cycle. We are talking about the point of 61% progress between halvings.
Every time Bitcoin crosses exactly 61% of the time path from one reduction in miner rewards to the next, which is approximately 500 to 550 days after the halving, the uptrend faces a powerful wall of resistance.
For example, in 2013 to 2014 at this mark, the market reversed and plunged into a prolonged bearish trend. In 2017 to 2018 the 61% point coincided with the historic peak near $20,000, after which the crypto winter began. In 2021 to 2022 crossing this border marked the final hype of late 2021 around $69,000 and triggered a long downward cycle.
What to expect now? Right now, the industry has once again approached this dangerous historical zone. However, this cycle has a fundamental difference which is a massive influx of institutional capital through spot ETFs. Unlike previous years when the market was ruled strictly by retail panic, today large funds create a strong foundation of support. This is exactly why the current selling pressure is likely to lead not to a catastrophic 80% collapse, but to a softer consolidation and a moderate correction.
What do you think?