
Arthur Mint
3.7k ໂພສ

Arthur Mint
 Square Verified+
ລາຍງານ
ບລັອກຜູ້ໃຊ້
Arthur is here. Crypto Expert. Web3 Builder. Verified KOL on Binance Square. Let's keep growing together: X - @ArthurMint_
71 ກໍາລັງຕິດຕາມ
42.4K+ ຜູ້ຕິດຕາມ
13.9K+ Liked
ໂພສ
·
--
ເບິ່ງການແປ
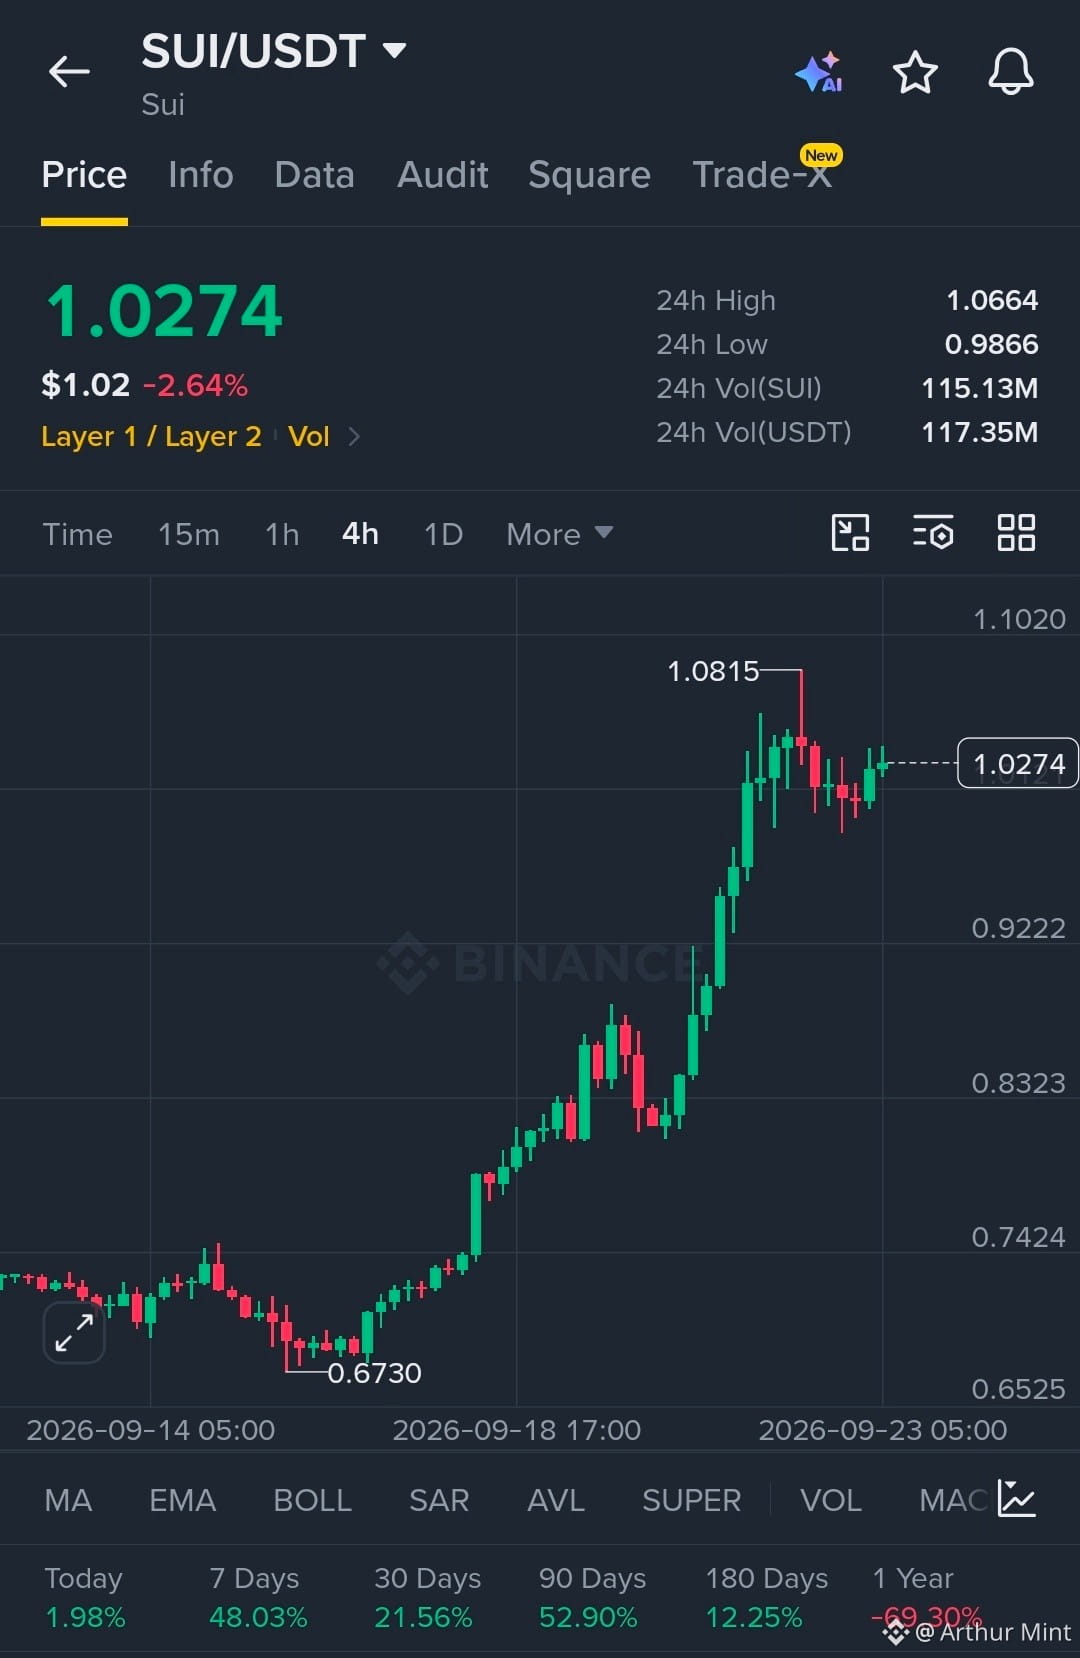
$SUI is holding strong momentum after a sharp breakout and consolidation near the highs.
Structure remains firmly controlled by buyers above the 1.00 zone.
EP
1.00–1.03
TP
TP1 1.08
TP2 1.12
TP3 1.18
SL
0.97
Liquidity remains stacked above 1.08, while price is reacting positively from the recent breakout zone. As long as SUI holds the 1.00–1.03 structure, continuation remains technically supported.
Let’s go $SUI
$SUI is holding strong momentum after a sharp breakout and consolidation near the highs.
Structure remains firmly controlled by buyers above the 1.00 zone.
EP
1.00–1.03
TP
TP1 1.08
TP2 1.12
TP3 1.18
SL
0.97
Liquidity remains stacked above 1.08, while price is reacting positively from the recent breakout zone. As long as SUI holds the 1.00–1.03 structure, continuation remains technically supported.
Let’s go $SUI
Structure remains firmly controlled by buyers above the 1.00 zone.
EP
1.00–1.03
TP
TP1 1.08
TP2 1.12
TP3 1.18
SL
0.97
Liquidity remains stacked above 1.08, while price is reacting positively from the recent breakout zone. As long as SUI holds the 1.00–1.03 structure, continuation remains technically supported.
Let’s go $SUI
1
436
·
--
ເບິ່ງການແປ
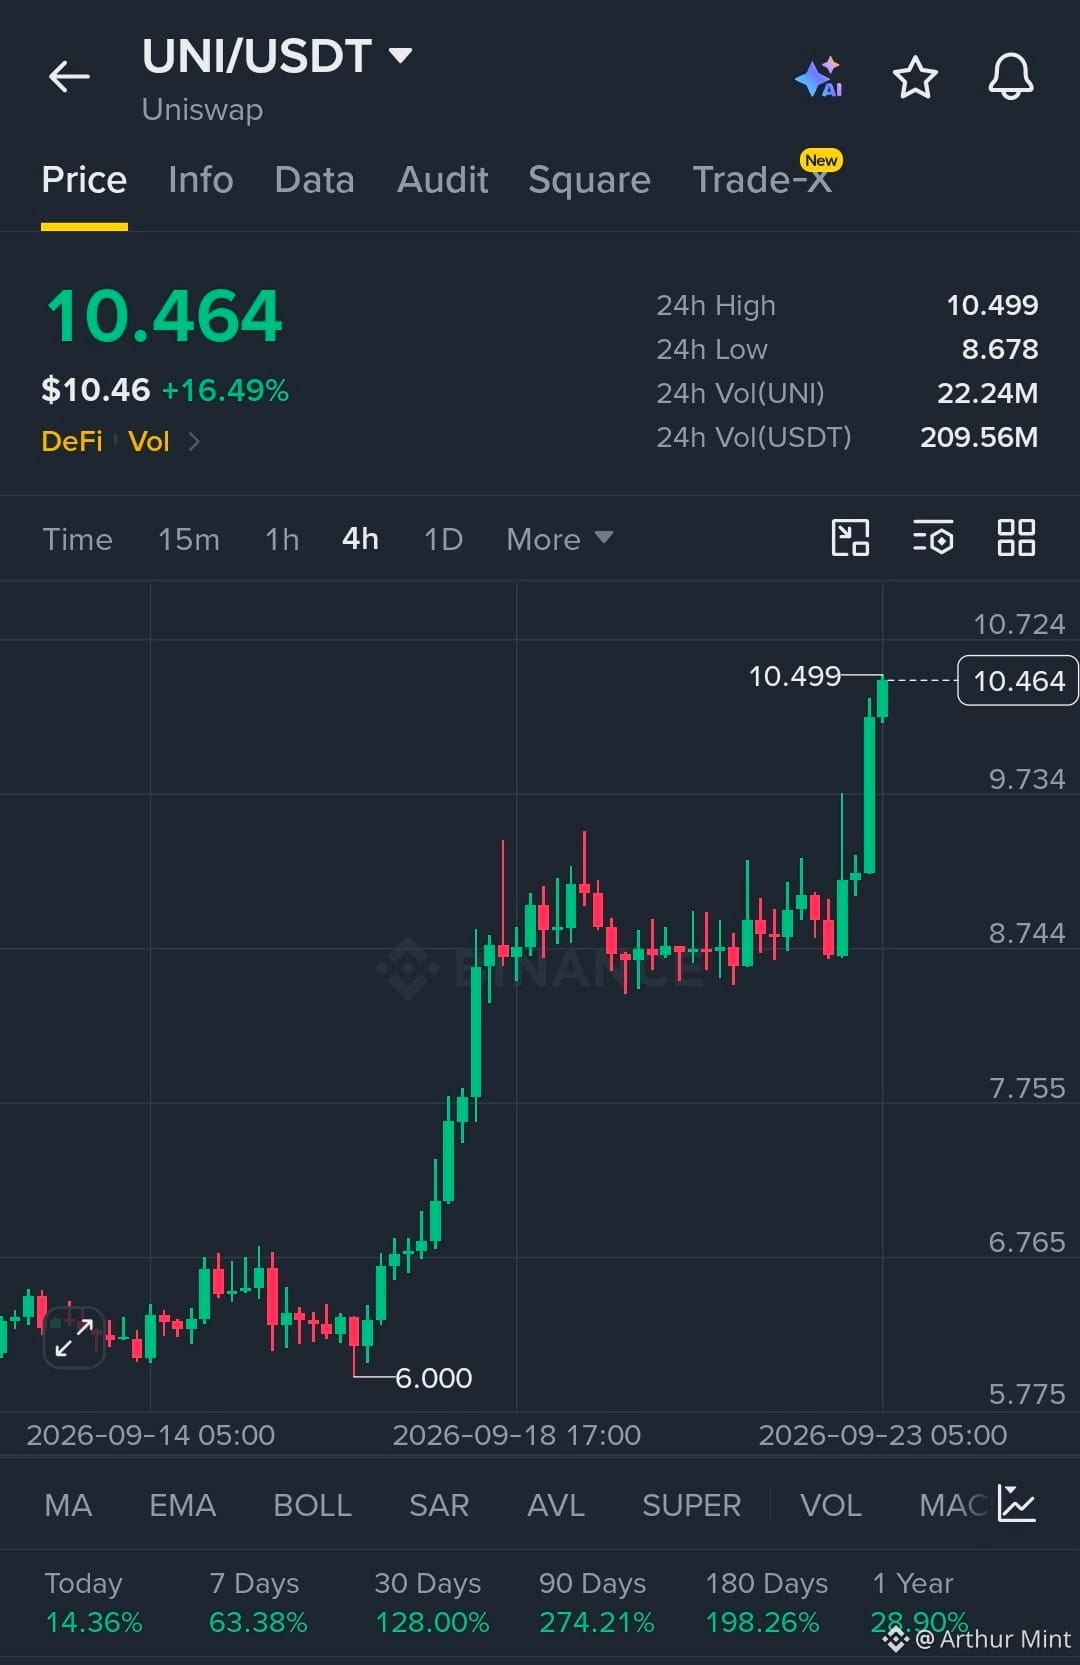
$UNI is showing strong bullish momentum with a clean breakout toward fresh highs.
Structure remains firmly controlled by buyers above the breakout zone.
EP
10.20–10.45
TP
TP1 10.72
TP2 11.20
TP3 11.80
SL
9.73
Liquidity has been swept above the prior range, and price is holding the breakout with strong reaction. As long as UNI maintains the 9.73–10.20 structure, continuation remains technically supported.
Let’s go $UNI
$UNI is showing strong bullish momentum with a clean breakout toward fresh highs.
Structure remains firmly controlled by buyers above the breakout zone.
EP
10.20–10.45
TP
TP1 10.72
TP2 11.20
TP3 11.80
SL
9.73
Liquidity has been swept above the prior range, and price is holding the breakout with strong reaction. As long as UNI maintains the 9.73–10.20 structure, continuation remains technically supported.
Let’s go $UNI
Structure remains firmly controlled by buyers above the breakout zone.
EP
10.20–10.45
TP
TP1 10.72
TP2 11.20
TP3 11.80
SL
9.73
Liquidity has been swept above the prior range, and price is holding the breakout with strong reaction. As long as UNI maintains the 9.73–10.20 structure, continuation remains technically supported.
Let’s go $UNI
439
·
--
ສັນຍານກະທິງ
ເບິ່ງການແປ
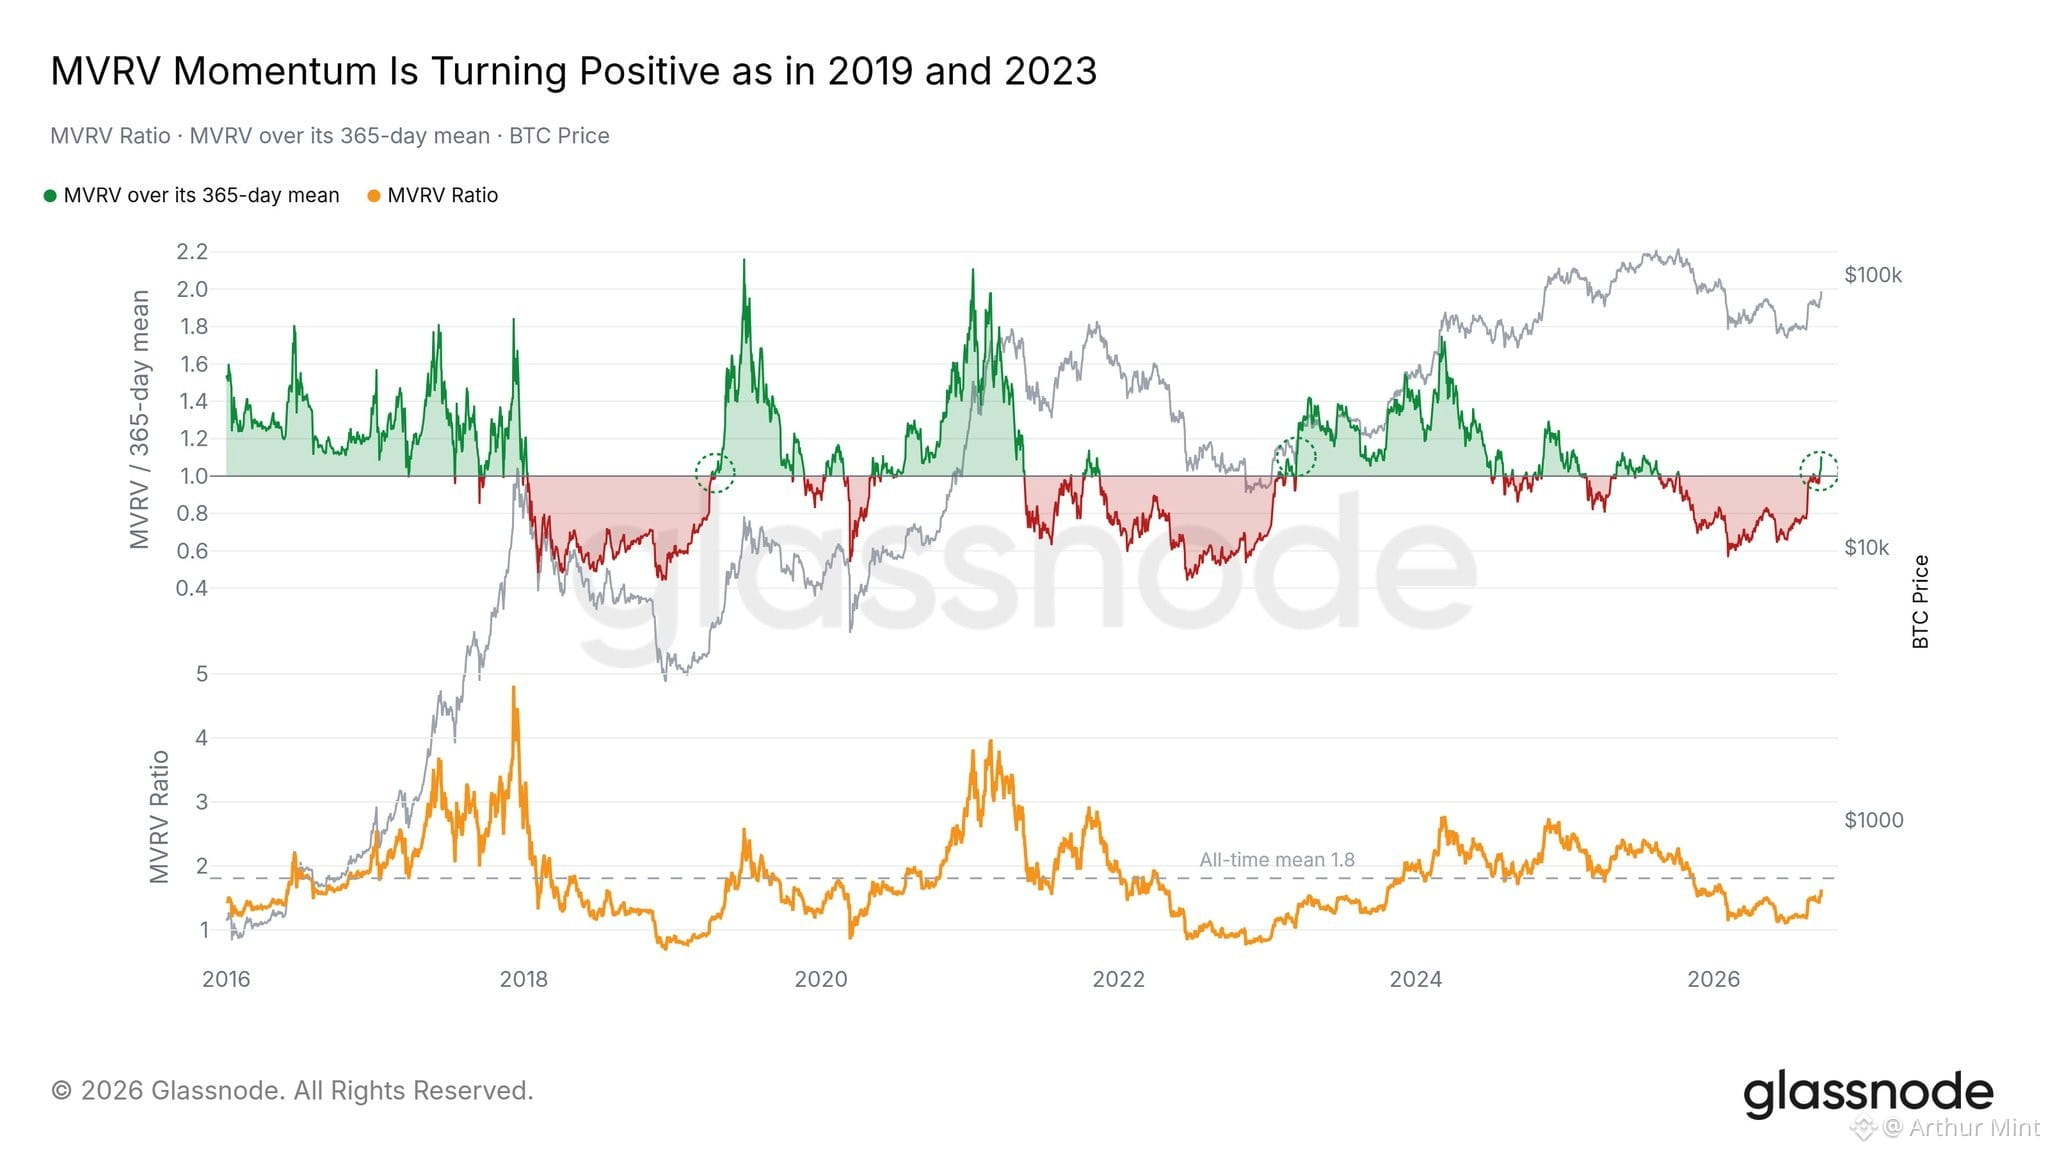
BTC MOMENTUM SIGNAL FLASHES BULLISH AGAIN
Bitcoin’s MVRV has moved back above its 365-day average, a momentum shift clearly highlighted on the chart.
Notably, the same crossover appeared in 2019 and 2023, near the beginning of major $BTC bull markets.
That makes the current setup worth watching closely, as momentum may be turning positive again across crypto.
Still, this signal is not a guarantee of future gains.
Is Bitcoin entering another major momentum phase?
BTC MOMENTUM SIGNAL FLASHES BULLISH AGAIN
Bitcoin’s MVRV has moved back above its 365-day average, a momentum shift clearly highlighted on the chart.
Notably, the same crossover appeared in 2019 and 2023, near the beginning of major $BTC bull markets.
That makes the current setup worth watching closely, as momentum may be turning positive again across crypto.
Still, this signal is not a guarantee of future gains.
Is Bitcoin entering another major momentum phase?
Bitcoin’s MVRV has moved back above its 365-day average, a momentum shift clearly highlighted on the chart.
Notably, the same crossover appeared in 2019 and 2023, near the beginning of major $BTC bull markets.
That makes the current setup worth watching closely, as momentum may be turning positive again across crypto.
Still, this signal is not a guarantee of future gains.
Is Bitcoin entering another major momentum phase?
281
·
--
ສັນຍານກະທິງ
ຢືນຢັນແລ້ວ
ເຮືອນຫຸ້ນ AI ກຳລັງເພີ່ມຂຶ້ນ — ແຕ່ໂອກາດຄັ້ງຕໍ່ໄປອາດບໍ່ແມ່ນຫຸ້ນ AI ອີກ.
ການລະບຸນຂອງ AI ບໍ່ໄດ້ເປັນເລື່ອງ semiconductor ຢ່າງດຽວອີກຕໍ່ໄປ.
ຄາດການລ່າສຸດຂອງ Nvidia ຊີ້ວ່າ ຈະມີອີກຂັ້ນໜຶ່ງທີ່ສຳຄັນຂອງຄວາມຕ້ອງການດ້ານ AI infrastructure. ບໍລິສັດຄາດຫວັງວ່າ ລາຍຮັບຈະເພີ່ມປະມານ 70% ໃນປີການເງິນຖັດໄປ ໃນຂະນະທີ່ທຸລະກິດ data-center ສ້າງໄດ້ $89B ໃນໄຕມາດລ່າສຸດ. Gartner ຄາດວ່າ ການໃຊ້ຈ່າຍດ້ານ AI ທົ່ວໂລກອາດຈະເຖິງ $2.7T ໃນປີ 2026 ເພີ່ມຂຶ້ນ 49.5% YoY.
ດັ່ງນັ້ນ ຄຳຖາມທີ່ໃຫຍ່ກວ່າແມ່ນ:
ເງິນຈະໄປຢູ່ໃສ ຫຼັງຈາກຜູ້ຊະນະທີ່ເຫັນໄດ້ຊັດເຈນຂອງ AI?
ສູນຂໍ້ມູນ AI ທຸກແຫ່ງຕ້ອງການຫຼາຍກວ່າ GPU. ຕ້ອງການໄຟຟ້າ, ເຄືອຂ່າຍ, ເຊີບເວີ, ການເກັບຂໍ້ມູນ, ການລະບາຍຄວາມຮ້ອນ, ການກໍ່ສ້າງ ແລະ cybersecurity.
ນັ້ນໝາຍຄວາມວ່າ ຂັ້ນຕອນຕໍ່ໄປຂອງການທ່ອງທະລົງ AI ອາດຈະແຜ່ໄປສູ່ບໍລິສັດທີ່ກຳລັງສ້າງ infrastructure ທີ່ຢູ່ພາຍໃຕ້ໂມເດວ.
ພະລັງງານກຳລັງກາຍເປັນຄວາມກົດດັນສຳຄັນ. ການຂະຫຍາຍສູນ data-center ກຳລັງບັງຄັບໃຫ້ຕະຫຼາດຈຸ້ງໃສ່ການສະໜອງໄຟຟ້າ ແລະຄວາມສາມາດຂອງກຣິດ.
Cybersecurity ກໍ່ເປັນອີກຈຸດທີ່ຕ້ອງຕິດຕາມ. ເມື່ອ AI agents ແລະລະບົບອັດຕະໂນມັດເພີ່ມຂຶ້ນ ພື້ນທີ່ສ່ຽງຕໍ່ການໂຈມຕີກໍ່ເພີ່ມຂຶ້ນເຊັ່ນກັນ. Gartner ຄາດວ່າ ການໃຊ້ຈ່າຍດ້ານ cybersecurity ຂອງ AI ຈະເພີ່ມຂຶ້ນຢ່າງຮຸນແຮງຜ່ານປີ 2027.
ແຕ່ຍັງມີອີກດ້ານຂອງການທ່ອງທະລົງນີ້.
AI infrastructure ຕ້ອງໃຊ້ງົບລົງທຶນຈຳນວນມະຫາສານ. ຄຳຖາມທີ່ສຳຄັນບໍ່ແມ່ນພຽງແຕ່ “AI demand ຈິງບໍ?” ອີກຕໍ່ໄປ.
ມັນແມ່ນ:
AI revenues ຈະເຕີບໂຕໄວພໍທີ່ຈະສົມທຽບກັບຄ່າໃຊ້ໃນການສ້າງ capacity ທັງໝົດນີ້ໄດ້ບໍ?
ຂ້ອຍເບິ່ງແງ່ບວກຕໍ່ເທມ AI, ແຕ່ເລືອກສັນຄ້າຫຸ້ນ AI ຢ່າງຈົດຈໍາ.
ຂ້ອຍຈະເຝົ້າເບິ່ງ ecosystem ທີ່ກວ້າງຂຶ້ນ: power ແລະ grid infrastructure, ອຸປະກອນ data-center, networking, cybersecurity ແລະ software ທີ່ສາມາດປ່ຽນການນຳໃຊ້ AI ໃຫ້ເປັນ recurring revenue.
ໄລຍະທຳອິດຂອງ AI ໄດ້ລາງວັນໃຫ້ບໍລິສັດທີ່ຂາຍອຸປະກອນທີ່ເຫມາະກັບ “picks and shovels”.
ໄລຍະຕໍ່ໄປ ອາດຈະໄປໃຫ້ລາງວັນແກ່ບໍລິສັດທີ່ກຳລັງສ້າງພະລັງງານ, ຖະໜົນ, ຄວາມປອດໄພ ແລະ infrastructure ທີ່ຢູ່ລ້ອມຮອບການບູມຂອງ AI.
ຄຳຖາມຕົວຈິງບໍ່ແມ່ນວ່າ AI ກຳລັງໃຫຍ່ຂຶ້ນຫຼືບໍ.
ແຕ່ແມ່ນວ່າ ໃຜເປັນຜູ້ຈັບເອົາຂໍ້ມູນເສດຖະກິດ ເມື່ອການກໍ່ສ້າງ AI ຂະຫຍາຍໃຫຍ່ຂຶ້ນ.
#AIStocksWhatNext
ເຮືອນຫຸ້ນ AI ກຳລັງເພີ່ມຂຶ້ນ — ແຕ່ໂອກາດຄັ້ງຕໍ່ໄປອາດບໍ່ແມ່ນຫຸ້ນ AI ອີກ.
ການລະບຸນຂອງ AI ບໍ່ໄດ້ເປັນເລື່ອງ semiconductor ຢ່າງດຽວອີກຕໍ່ໄປ.
ຄາດການລ່າສຸດຂອງ Nvidia ຊີ້ວ່າ ຈະມີອີກຂັ້ນໜຶ່ງທີ່ສຳຄັນຂອງຄວາມຕ້ອງການດ້ານ AI infrastructure. ບໍລິສັດຄາດຫວັງວ່າ ລາຍຮັບຈະເພີ່ມປະມານ 70% ໃນປີການເງິນຖັດໄປ ໃນຂະນະທີ່ທຸລະກິດ data-center ສ້າງໄດ້ $89B ໃນໄຕມາດລ່າສຸດ. Gartner ຄາດວ່າ ການໃຊ້ຈ່າຍດ້ານ AI ທົ່ວໂລກອາດຈະເຖິງ $2.7T ໃນປີ 2026 ເພີ່ມຂຶ້ນ 49.5% YoY.
ດັ່ງນັ້ນ ຄຳຖາມທີ່ໃຫຍ່ກວ່າແມ່ນ:
ເງິນຈະໄປຢູ່ໃສ ຫຼັງຈາກຜູ້ຊະນະທີ່ເຫັນໄດ້ຊັດເຈນຂອງ AI?
ສູນຂໍ້ມູນ AI ທຸກແຫ່ງຕ້ອງການຫຼາຍກວ່າ GPU. ຕ້ອງການໄຟຟ້າ, ເຄືອຂ່າຍ, ເຊີບເວີ, ການເກັບຂໍ້ມູນ, ການລະບາຍຄວາມຮ້ອນ, ການກໍ່ສ້າງ ແລະ cybersecurity.
ນັ້ນໝາຍຄວາມວ່າ ຂັ້ນຕອນຕໍ່ໄປຂອງການທ່ອງທະລົງ AI ອາດຈະແຜ່ໄປສູ່ບໍລິສັດທີ່ກຳລັງສ້າງ infrastructure ທີ່ຢູ່ພາຍໃຕ້ໂມເດວ.
ພະລັງງານກຳລັງກາຍເປັນຄວາມກົດດັນສຳຄັນ. ການຂະຫຍາຍສູນ data-center ກຳລັງບັງຄັບໃຫ້ຕະຫຼາດຈຸ້ງໃສ່ການສະໜອງໄຟຟ້າ ແລະຄວາມສາມາດຂອງກຣິດ.
Cybersecurity ກໍ່ເປັນອີກຈຸດທີ່ຕ້ອງຕິດຕາມ. ເມື່ອ AI agents ແລະລະບົບອັດຕະໂນມັດເພີ່ມຂຶ້ນ ພື້ນທີ່ສ່ຽງຕໍ່ການໂຈມຕີກໍ່ເພີ່ມຂຶ້ນເຊັ່ນກັນ. Gartner ຄາດວ່າ ການໃຊ້ຈ່າຍດ້ານ cybersecurity ຂອງ AI ຈະເພີ່ມຂຶ້ນຢ່າງຮຸນແຮງຜ່ານປີ 2027.
ແຕ່ຍັງມີອີກດ້ານຂອງການທ່ອງທະລົງນີ້.
AI infrastructure ຕ້ອງໃຊ້ງົບລົງທຶນຈຳນວນມະຫາສານ. ຄຳຖາມທີ່ສຳຄັນບໍ່ແມ່ນພຽງແຕ່ “AI demand ຈິງບໍ?” ອີກຕໍ່ໄປ.
ມັນແມ່ນ:
AI revenues ຈະເຕີບໂຕໄວພໍທີ່ຈະສົມທຽບກັບຄ່າໃຊ້ໃນການສ້າງ capacity ທັງໝົດນີ້ໄດ້ບໍ?
ຂ້ອຍເບິ່ງແງ່ບວກຕໍ່ເທມ AI, ແຕ່ເລືອກສັນຄ້າຫຸ້ນ AI ຢ່າງຈົດຈໍາ.
ຂ້ອຍຈະເຝົ້າເບິ່ງ ecosystem ທີ່ກວ້າງຂຶ້ນ: power ແລະ grid infrastructure, ອຸປະກອນ data-center, networking, cybersecurity ແລະ software ທີ່ສາມາດປ່ຽນການນຳໃຊ້ AI ໃຫ້ເປັນ recurring revenue.
ໄລຍະທຳອິດຂອງ AI ໄດ້ລາງວັນໃຫ້ບໍລິສັດທີ່ຂາຍອຸປະກອນທີ່ເຫມາະກັບ “picks and shovels”.
ໄລຍະຕໍ່ໄປ ອາດຈະໄປໃຫ້ລາງວັນແກ່ບໍລິສັດທີ່ກຳລັງສ້າງພະລັງງານ, ຖະໜົນ, ຄວາມປອດໄພ ແລະ infrastructure ທີ່ຢູ່ລ້ອມຮອບການບູມຂອງ AI.
ຄຳຖາມຕົວຈິງບໍ່ແມ່ນວ່າ AI ກຳລັງໃຫຍ່ຂຶ້ນຫຼືບໍ.
ແຕ່ແມ່ນວ່າ ໃຜເປັນຜູ້ຈັບເອົາຂໍ້ມູນເສດຖະກິດ ເມື່ອການກໍ່ສ້າງ AI ຂະຫຍາຍໃຫຍ່ຂຶ້ນ.
#AIStocksWhatNext
ການລະບຸນຂອງ AI ບໍ່ໄດ້ເປັນເລື່ອງ semiconductor ຢ່າງດຽວອີກຕໍ່ໄປ.
ຄາດການລ່າສຸດຂອງ Nvidia ຊີ້ວ່າ ຈະມີອີກຂັ້ນໜຶ່ງທີ່ສຳຄັນຂອງຄວາມຕ້ອງການດ້ານ AI infrastructure. ບໍລິສັດຄາດຫວັງວ່າ ລາຍຮັບຈະເພີ່ມປະມານ 70% ໃນປີການເງິນຖັດໄປ ໃນຂະນະທີ່ທຸລະກິດ data-center ສ້າງໄດ້ $89B ໃນໄຕມາດລ່າສຸດ. Gartner ຄາດວ່າ ການໃຊ້ຈ່າຍດ້ານ AI ທົ່ວໂລກອາດຈະເຖິງ $2.7T ໃນປີ 2026 ເພີ່ມຂຶ້ນ 49.5% YoY.
ດັ່ງນັ້ນ ຄຳຖາມທີ່ໃຫຍ່ກວ່າແມ່ນ:
ເງິນຈະໄປຢູ່ໃສ ຫຼັງຈາກຜູ້ຊະນະທີ່ເຫັນໄດ້ຊັດເຈນຂອງ AI?
ສູນຂໍ້ມູນ AI ທຸກແຫ່ງຕ້ອງການຫຼາຍກວ່າ GPU. ຕ້ອງການໄຟຟ້າ, ເຄືອຂ່າຍ, ເຊີບເວີ, ການເກັບຂໍ້ມູນ, ການລະບາຍຄວາມຮ້ອນ, ການກໍ່ສ້າງ ແລະ cybersecurity.
ນັ້ນໝາຍຄວາມວ່າ ຂັ້ນຕອນຕໍ່ໄປຂອງການທ່ອງທະລົງ AI ອາດຈະແຜ່ໄປສູ່ບໍລິສັດທີ່ກຳລັງສ້າງ infrastructure ທີ່ຢູ່ພາຍໃຕ້ໂມເດວ.
ພະລັງງານກຳລັງກາຍເປັນຄວາມກົດດັນສຳຄັນ. ການຂະຫຍາຍສູນ data-center ກຳລັງບັງຄັບໃຫ້ຕະຫຼາດຈຸ້ງໃສ່ການສະໜອງໄຟຟ້າ ແລະຄວາມສາມາດຂອງກຣິດ.
Cybersecurity ກໍ່ເປັນອີກຈຸດທີ່ຕ້ອງຕິດຕາມ. ເມື່ອ AI agents ແລະລະບົບອັດຕະໂນມັດເພີ່ມຂຶ້ນ ພື້ນທີ່ສ່ຽງຕໍ່ການໂຈມຕີກໍ່ເພີ່ມຂຶ້ນເຊັ່ນກັນ. Gartner ຄາດວ່າ ການໃຊ້ຈ່າຍດ້ານ cybersecurity ຂອງ AI ຈະເພີ່ມຂຶ້ນຢ່າງຮຸນແຮງຜ່ານປີ 2027.
ແຕ່ຍັງມີອີກດ້ານຂອງການທ່ອງທະລົງນີ້.
AI infrastructure ຕ້ອງໃຊ້ງົບລົງທຶນຈຳນວນມະຫາສານ. ຄຳຖາມທີ່ສຳຄັນບໍ່ແມ່ນພຽງແຕ່ “AI demand ຈິງບໍ?” ອີກຕໍ່ໄປ.
ມັນແມ່ນ:
AI revenues ຈະເຕີບໂຕໄວພໍທີ່ຈະສົມທຽບກັບຄ່າໃຊ້ໃນການສ້າງ capacity ທັງໝົດນີ້ໄດ້ບໍ?
ຂ້ອຍເບິ່ງແງ່ບວກຕໍ່ເທມ AI, ແຕ່ເລືອກສັນຄ້າຫຸ້ນ AI ຢ່າງຈົດຈໍາ.
ຂ້ອຍຈະເຝົ້າເບິ່ງ ecosystem ທີ່ກວ້າງຂຶ້ນ: power ແລະ grid infrastructure, ອຸປະກອນ data-center, networking, cybersecurity ແລະ software ທີ່ສາມາດປ່ຽນການນຳໃຊ້ AI ໃຫ້ເປັນ recurring revenue.
ໄລຍະທຳອິດຂອງ AI ໄດ້ລາງວັນໃຫ້ບໍລິສັດທີ່ຂາຍອຸປະກອນທີ່ເຫມາະກັບ “picks and shovels”.
ໄລຍະຕໍ່ໄປ ອາດຈະໄປໃຫ້ລາງວັນແກ່ບໍລິສັດທີ່ກຳລັງສ້າງພະລັງງານ, ຖະໜົນ, ຄວາມປອດໄພ ແລະ infrastructure ທີ່ຢູ່ລ້ອມຮອບການບູມຂອງ AI.
ຄຳຖາມຕົວຈິງບໍ່ແມ່ນວ່າ AI ກຳລັງໃຫຍ່ຂຶ້ນຫຼືບໍ.
ແຕ່ແມ່ນວ່າ ໃຜເປັນຜູ້ຈັບເອົາຂໍ້ມູນເສດຖະກິດ ເມື່ອການກໍ່ສ້າງ AI ຂະຫຍາຍໃຫຍ່ຂຶ້ນ.
#AIStocksWhatNext

1
566
·
--
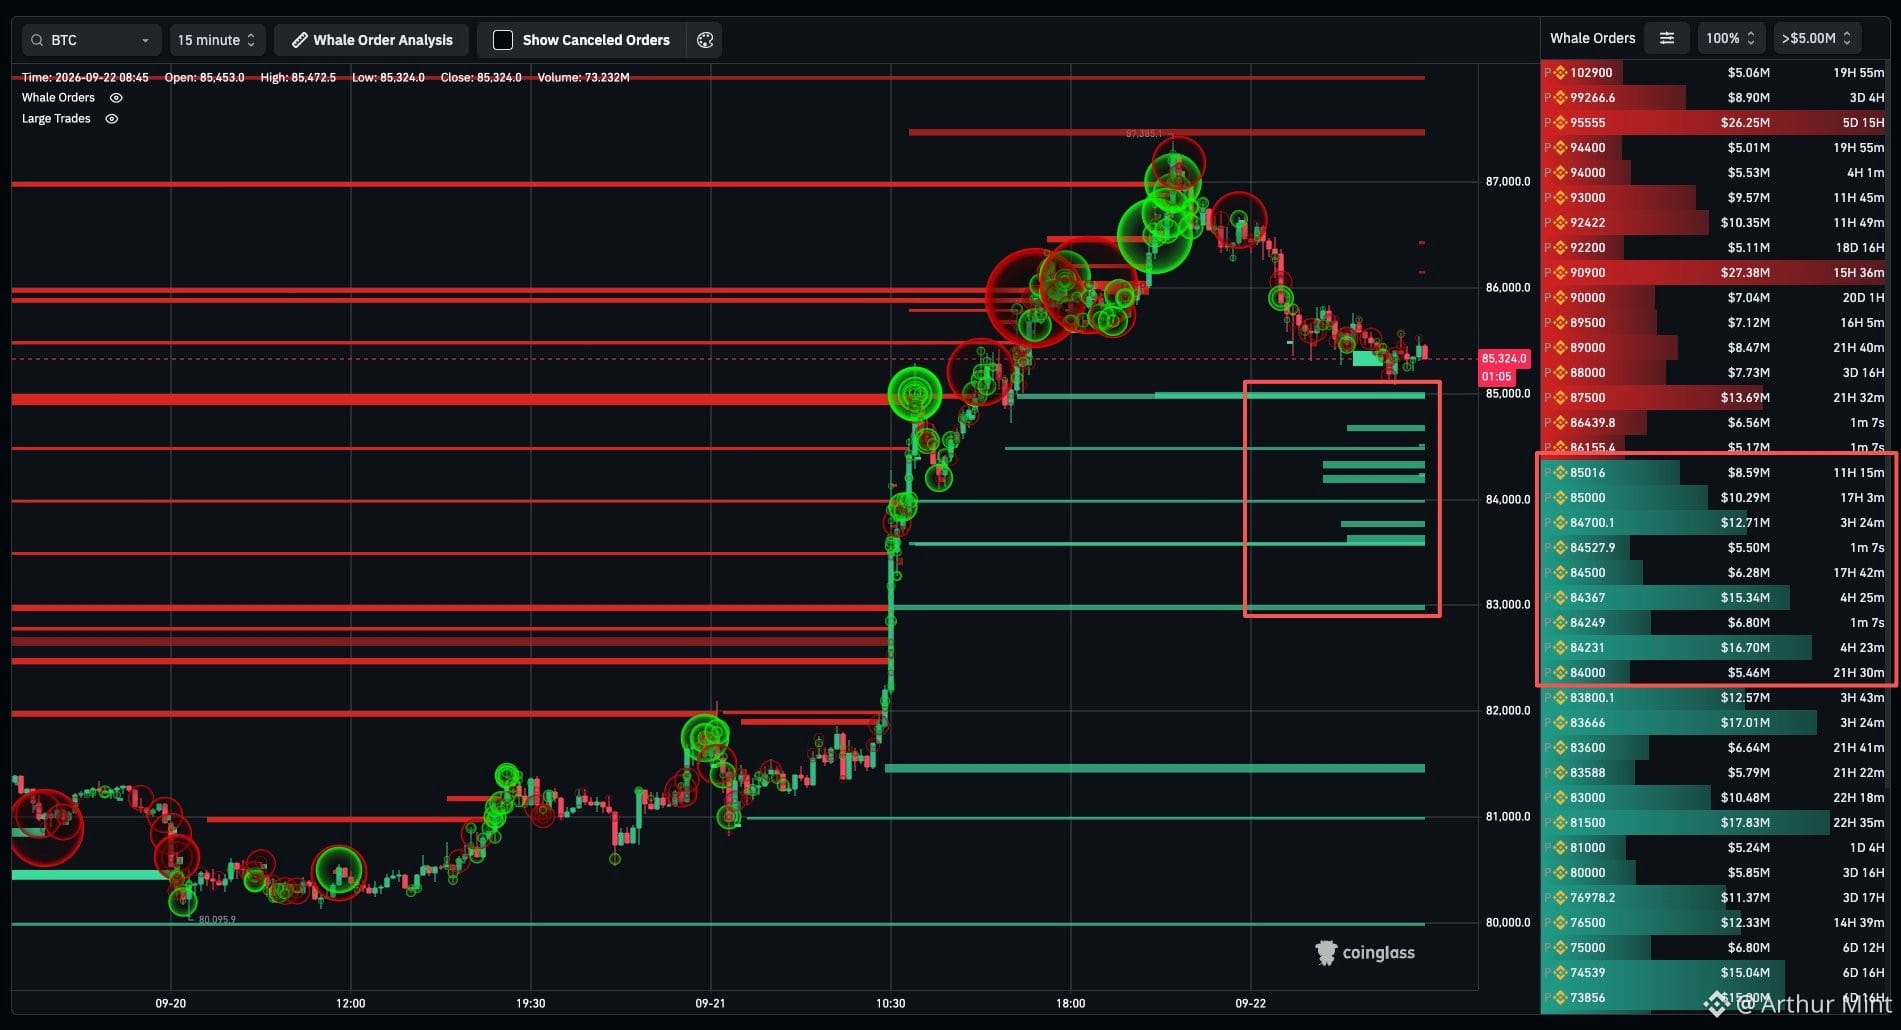
BITCOIN ຜູ້ຊື້ກຳລັງລົງຄຳສັ່ງຊື້ (BIDS) ລຽງລົງຕ່ຳກວ່າ $85K
ຕາຕະລາງ order book ສະແດງຄຳສັ່ງຊື້ສີຂຽວທີ່ເປັນຊັ້ນລຽງຢູ່ພາຍໃຕ້ເຂດປະຈຸບັນຂອງ Bitcoin ສະແດງວ່າຜູ້ຊື້ກຳລັງລໍຖ້າລາຄາຕ່ຳລົງ ບໍ່ແມ່ນໄລ່ຕາມຂຶ້ນ.
ກຸ່ມຄຳສັ່ງຊື້ (bid clusters) ທີ່ນ່າສົນໃຈຢູ່ປະມານ $84,367, $84,231, $83,666 ແລະ $81,500, ໂດຍມີຄຳສັ່ງຂະໜາດໃຫຍ່ໃຫ້ເຫັນຢູ່ແຕ່ລະລະດັບ.
ເລື່ອງນີ້ສຳຄັນ ເພາະການມີ bids ທີ່ແຂງແຮງອາດກໍ່ໃຫ້ເກີດການຄ້ຳຮອງ (support) ຖ້າການຂາຍເລັ່ງຂຶ້ນ.
ແຕ່ຢ່າງໃດກໍຕາມ, ຄຳສັ່ງຂະໜາດໃຫຍ່ອາດຈະຖືກຍ້າຍ ຫຼືຫາຍໄປ ກ່ອນຈະຖືກປະຕິບັດ.
bids ເຫຼົ່ານີ້ຈະດູດຊັບ (absorb) ການດຶງຍ້ອນຄັ້ງຕໍ່ໄປບໍ?
BITCOIN ຜູ້ຊື້ກຳລັງລົງຄຳສັ່ງຊື້ (BIDS) ລຽງລົງຕ່ຳກວ່າ $85K
ຕາຕະລາງ order book ສະແດງຄຳສັ່ງຊື້ສີຂຽວທີ່ເປັນຊັ້ນລຽງຢູ່ພາຍໃຕ້ເຂດປະຈຸບັນຂອງ Bitcoin ສະແດງວ່າຜູ້ຊື້ກຳລັງລໍຖ້າລາຄາຕ່ຳລົງ ບໍ່ແມ່ນໄລ່ຕາມຂຶ້ນ.
ກຸ່ມຄຳສັ່ງຊື້ (bid clusters) ທີ່ນ່າສົນໃຈຢູ່ປະມານ $84,367, $84,231, $83,666 ແລະ $81,500, ໂດຍມີຄຳສັ່ງຂະໜາດໃຫຍ່ໃຫ້ເຫັນຢູ່ແຕ່ລະລະດັບ.
ເລື່ອງນີ້ສຳຄັນ ເພາະການມີ bids ທີ່ແຂງແຮງອາດກໍ່ໃຫ້ເກີດການຄ້ຳຮອງ (support) ຖ້າການຂາຍເລັ່ງຂຶ້ນ.
ແຕ່ຢ່າງໃດກໍຕາມ, ຄຳສັ່ງຂະໜາດໃຫຍ່ອາດຈະຖືກຍ້າຍ ຫຼືຫາຍໄປ ກ່ອນຈະຖືກປະຕິບັດ.
bids ເຫຼົ່ານີ້ຈະດູດຊັບ (absorb) ການດຶງຍ້ອນຄັ້ງຕໍ່ໄປບໍ?
ຕາຕະລາງ order book ສະແດງຄຳສັ່ງຊື້ສີຂຽວທີ່ເປັນຊັ້ນລຽງຢູ່ພາຍໃຕ້ເຂດປະຈຸບັນຂອງ Bitcoin ສະແດງວ່າຜູ້ຊື້ກຳລັງລໍຖ້າລາຄາຕ່ຳລົງ ບໍ່ແມ່ນໄລ່ຕາມຂຶ້ນ.
ກຸ່ມຄຳສັ່ງຊື້ (bid clusters) ທີ່ນ່າສົນໃຈຢູ່ປະມານ $84,367, $84,231, $83,666 ແລະ $81,500, ໂດຍມີຄຳສັ່ງຂະໜາດໃຫຍ່ໃຫ້ເຫັນຢູ່ແຕ່ລະລະດັບ.
ເລື່ອງນີ້ສຳຄັນ ເພາະການມີ bids ທີ່ແຂງແຮງອາດກໍ່ໃຫ້ເກີດການຄ້ຳຮອງ (support) ຖ້າການຂາຍເລັ່ງຂຶ້ນ.
ແຕ່ຢ່າງໃດກໍຕາມ, ຄຳສັ່ງຂະໜາດໃຫຍ່ອາດຈະຖືກຍ້າຍ ຫຼືຫາຍໄປ ກ່ອນຈະຖືກປະຕິບັດ.
bids ເຫຼົ່ານີ້ຈະດູດຊັບ (absorb) ການດຶງຍ້ອນຄັ້ງຕໍ່ໄປບໍ?
2
1k
·
--
ສັນຍານກະທິງ
ເບິ່ງການແປ
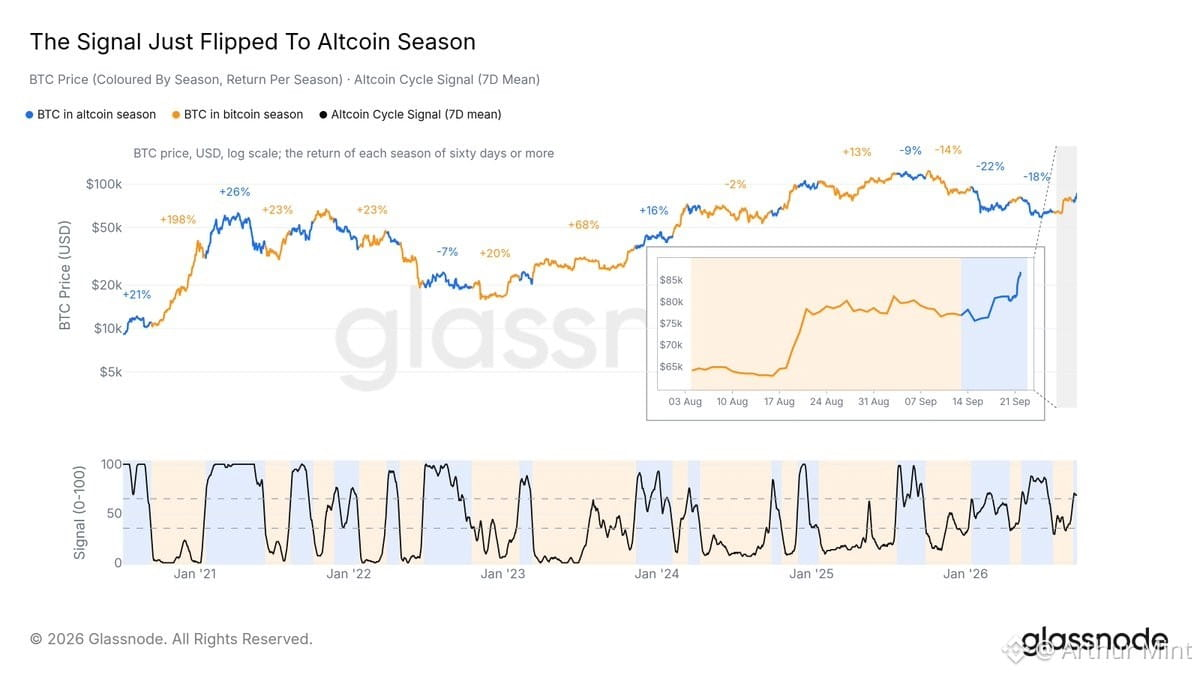
ALTCOIN SEASON SIGNAL FLIPS — MARKET BREADTH IS FINALLY WAKING UP
The latest market-cycle reading shows a clear shift from Bitcoin season toward altcoin season. After spending time favoring BTC, the signal has now moved into the zone associated with broader altcoin strength.
The earlier August rally told a different story. Bitcoin pushed higher while many altcoins remained relatively muted, showing that capital was still concentrated around $BTC rather than spreading across the market.
Today’s move looks broader. The chart indicates renewed strength across the altcoin space, suggesting market participation is expanding beyond Bitcoin and creating a more supportive backdrop for alternative crypto assets.
For Bitcoin, this does not automatically mean weakness. Historically, a widening market can mean BTC has already attracted attention and liquidity is beginning to rotate into higher-beta parts of crypto.
Still, the signal is not a guarantee that every altcoin will outperform. Momentum can reverse quickly, and continued confirmation matters.
The rotation has started — but how far can altcoin strength run?
ALTCOIN SEASON SIGNAL FLIPS — MARKET BREADTH IS FINALLY WAKING UP
The latest market-cycle reading shows a clear shift from Bitcoin season toward altcoin season. After spending time favoring BTC, the signal has now moved into the zone associated with broader altcoin strength.
The earlier August rally told a different story. Bitcoin pushed higher while many altcoins remained relatively muted, showing that capital was still concentrated around $BTC rather than spreading across the market.
Today’s move looks broader. The chart indicates renewed strength across the altcoin space, suggesting market participation is expanding beyond Bitcoin and creating a more supportive backdrop for alternative crypto assets.
For Bitcoin, this does not automatically mean weakness. Historically, a widening market can mean BTC has already attracted attention and liquidity is beginning to rotate into higher-beta parts of crypto.
Still, the signal is not a guarantee that every altcoin will outperform. Momentum can reverse quickly, and continued confirmation matters.
The rotation has started — but how far can altcoin strength run?
The latest market-cycle reading shows a clear shift from Bitcoin season toward altcoin season. After spending time favoring BTC, the signal has now moved into the zone associated with broader altcoin strength.
The earlier August rally told a different story. Bitcoin pushed higher while many altcoins remained relatively muted, showing that capital was still concentrated around $BTC rather than spreading across the market.
Today’s move looks broader. The chart indicates renewed strength across the altcoin space, suggesting market participation is expanding beyond Bitcoin and creating a more supportive backdrop for alternative crypto assets.
For Bitcoin, this does not automatically mean weakness. Historically, a widening market can mean BTC has already attracted attention and liquidity is beginning to rotate into higher-beta parts of crypto.
Still, the signal is not a guarantee that every altcoin will outperform. Momentum can reverse quickly, and continued confirmation matters.
The rotation has started — but how far can altcoin strength run?
396
·
--
ສັນຍານກະທິງ
BitMine yuav $75 milyon ntawm $ETH as Tom Lee hais kom muaj kev nce lag luam loj heev rau Q4.
Tom Lee’s BitMine tau ntxiv $75 lab tsim nyog ntawm Ethereum. Lee hais tias Q4 pib “yog ib qho ntawm kev nce lag luam loj tshaj plaws ntawm peb lub neej.”
Qhov kev hloov no ua rau pom tseeb dua txog kev yuav ETH uas loj rau cov koom haum thaum lub quarter thib plaub tab tom los txog.
Tam sim no, qhov tseem ceeb yog qhov loj ntawm BitMine txoj kev yuav thiab Lee qhov kev xav bullish rau Q4. ETH tseem nyob ruaj khov hauv kev mloog.
BitMine yuav $75 milyon ntawm $ETH as Tom Lee hais kom muaj kev nce lag luam loj heev rau Q4.
Tom Lee’s BitMine tau ntxiv $75 lab tsim nyog ntawm Ethereum. Lee hais tias Q4 pib “yog ib qho ntawm kev nce lag luam loj tshaj plaws ntawm peb lub neej.”
Qhov kev hloov no ua rau pom tseeb dua txog kev yuav ETH uas loj rau cov koom haum thaum lub quarter thib plaub tab tom los txog.
Tam sim no, qhov tseem ceeb yog qhov loj ntawm BitMine txoj kev yuav thiab Lee qhov kev xav bullish rau Q4. ETH tseem nyob ruaj khov hauv kev mloog.
Tom Lee’s BitMine tau ntxiv $75 lab tsim nyog ntawm Ethereum. Lee hais tias Q4 pib “yog ib qho ntawm kev nce lag luam loj tshaj plaws ntawm peb lub neej.”
Qhov kev hloov no ua rau pom tseeb dua txog kev yuav ETH uas loj rau cov koom haum thaum lub quarter thib plaub tab tom los txog.
Tam sim no, qhov tseem ceeb yog qhov loj ntawm BitMine txoj kev yuav thiab Lee qhov kev xav bullish rau Q4. ETH tseem nyob ruaj khov hauv kev mloog.

1
1
389
·
--
ສັນຍານກະທິງ
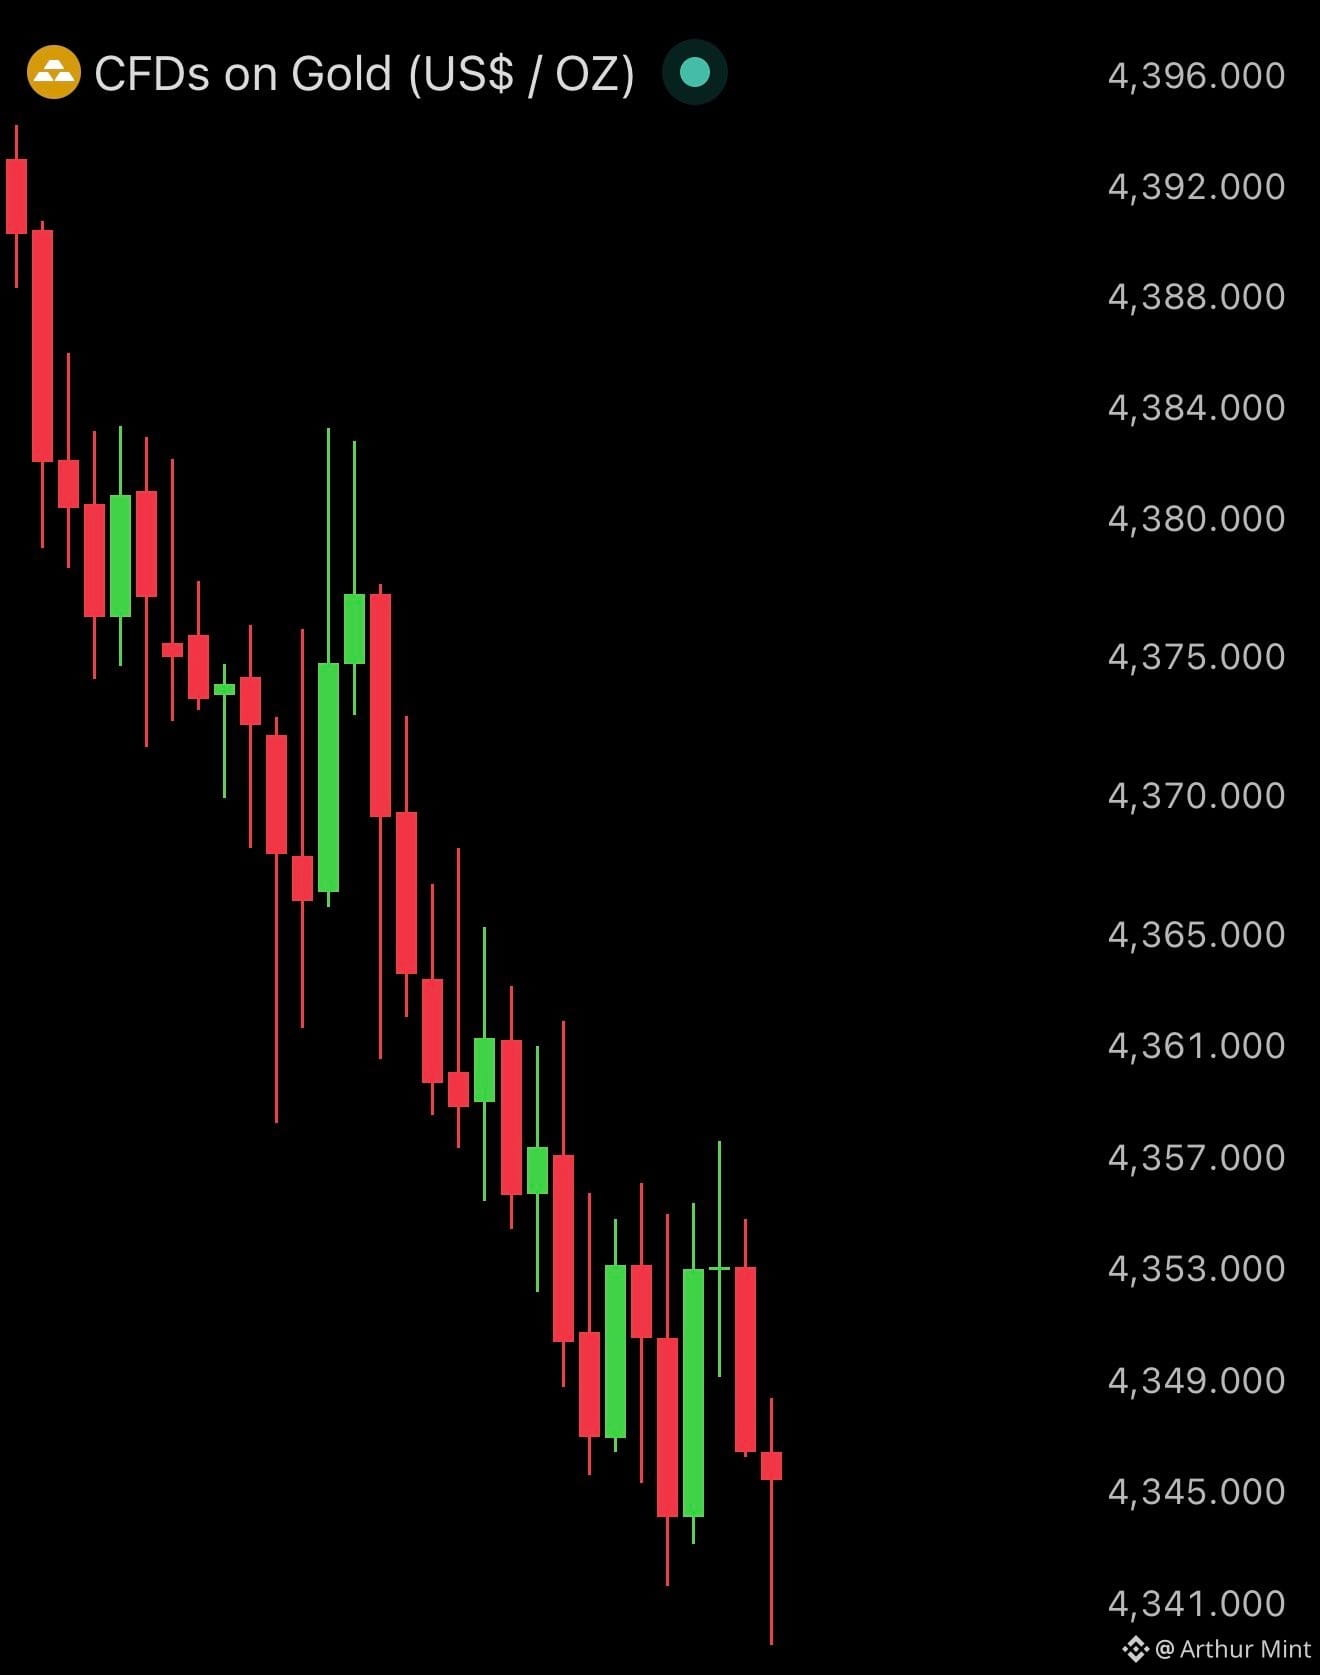
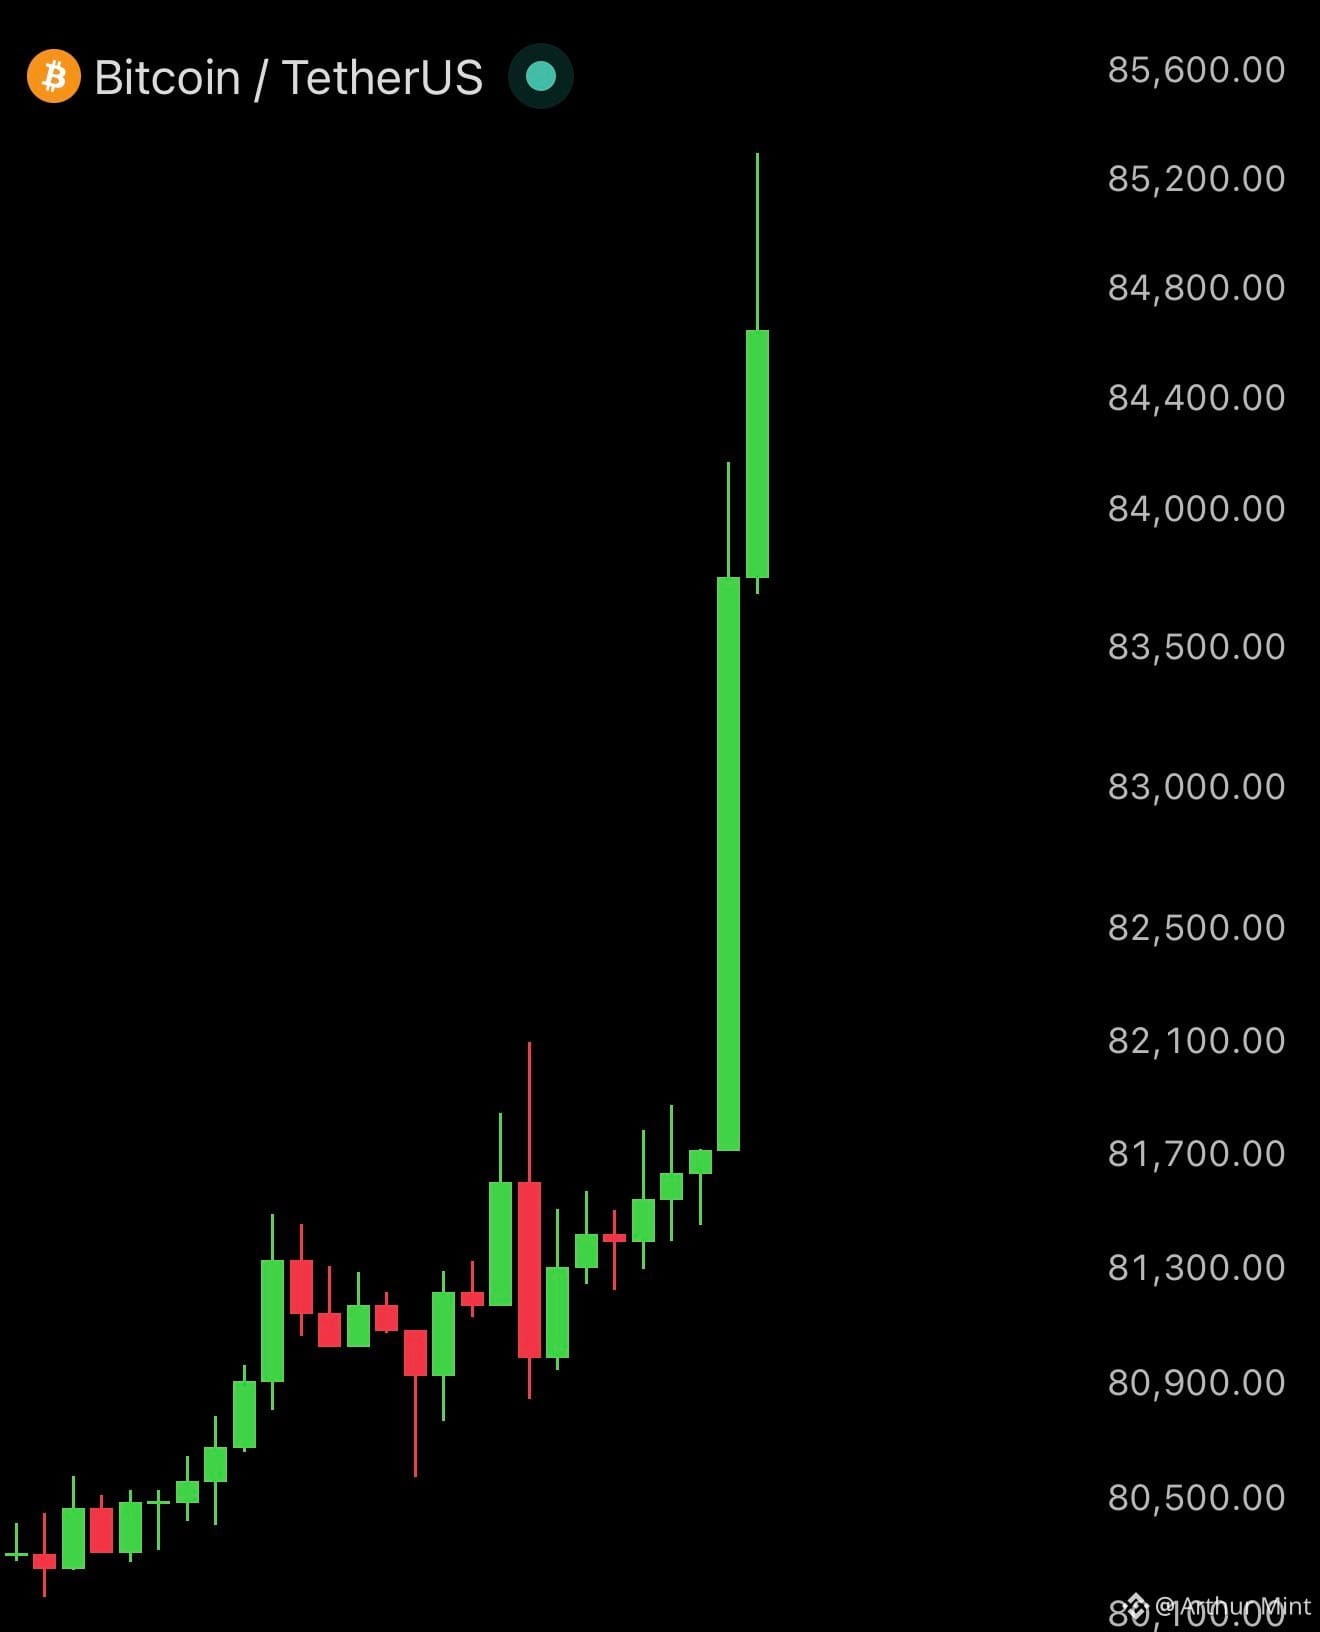
ຕະຫຼາດກຳລັງສົ່ງສັນຍານແຮງທີ່ເຫັນໄດ້: ຄຳກຳລັງລົງຂະໜາດເຢັນ ໃນຂະນະທີ່ Bitcoin ກຳລັງເຕີບຂຶ້ນ.
ຄວາມແຕກຕ່າງນີ້ຫຼີກບໍ່ໄດ້ ໂດຍສົ່ງ crypto ແລະການຄ້າທີ່ເປັນທາງປອດໄພແບບດັ້ງເດີມໄປໃນທິດທາງທີ່ຕ່າງກັນ.
ຕອນນີ້ຄຳຖາມໃຫຍ່ຄືວ່າຄວາມຂັດແຍ້ງນີ້ຈະດຳລົງຕໍ່ໄປບໍ?
ຕະຫຼາດກຳລັງສົ່ງສັນຍານແຮງທີ່ເຫັນໄດ້: ຄຳກຳລັງລົງຂະໜາດເຢັນ ໃນຂະນະທີ່ Bitcoin ກຳລັງເຕີບຂຶ້ນ.
ຄວາມແຕກຕ່າງນີ້ຫຼີກບໍ່ໄດ້ ໂດຍສົ່ງ crypto ແລະການຄ້າທີ່ເປັນທາງປອດໄພແບບດັ້ງເດີມໄປໃນທິດທາງທີ່ຕ່າງກັນ.
ຕອນນີ້ຄຳຖາມໃຫຍ່ຄືວ່າຄວາມຂັດແຍ້ງນີ້ຈະດຳລົງຕໍ່ໄປບໍ?
ຄວາມແຕກຕ່າງນີ້ຫຼີກບໍ່ໄດ້ ໂດຍສົ່ງ crypto ແລະການຄ້າທີ່ເປັນທາງປອດໄພແບບດັ້ງເດີມໄປໃນທິດທາງທີ່ຕ່າງກັນ.
ຕອນນີ້ຄຳຖາມໃຫຍ່ຄືວ່າຄວາມຂັດແຍ້ງນີ້ຈະດຳລົງຕໍ່ໄປບໍ?
381
·
--
ເບິ່ງການແປ
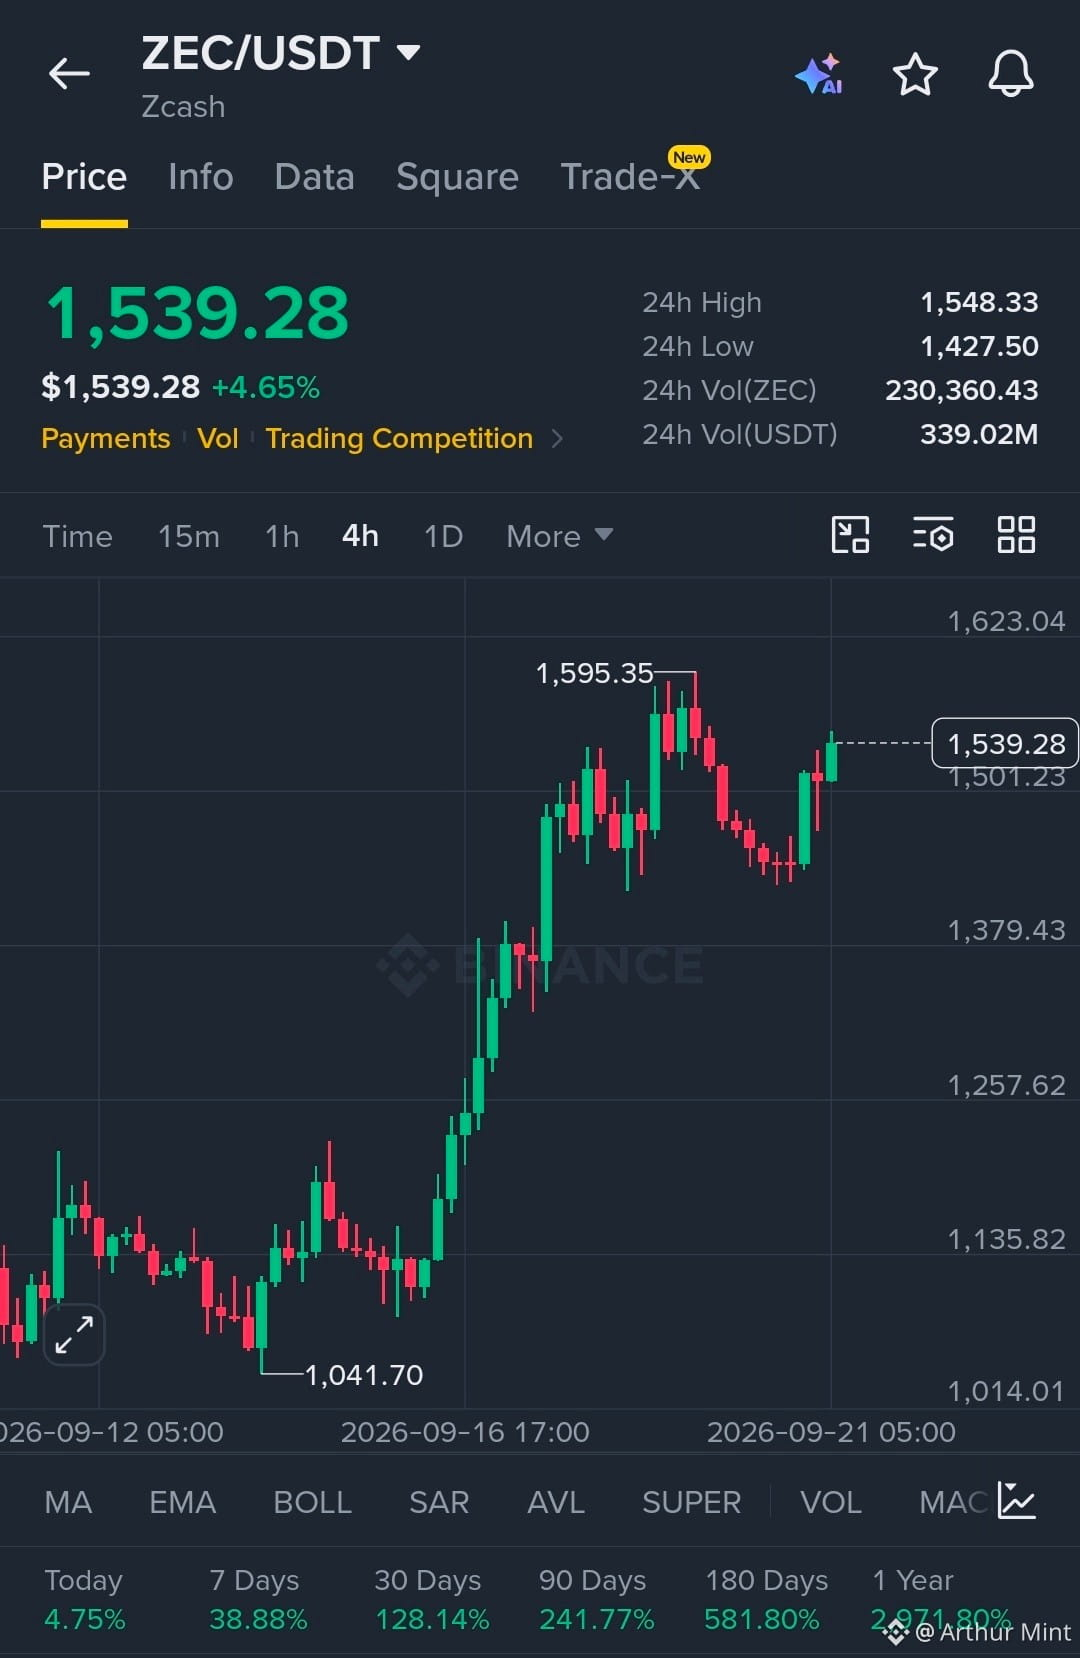
$ZEC is showing strong momentum with buyers firmly in control.
Structure remains bullish with price holding above the breakout zone.
EP
1,510 - 1,540
TP
TP1 1,595
TP2 1,650
TP3 1,720
SL
1,460
Liquidity is building above the 1,595 high, while price continues to hold the 1,501 support area. A clean reaction from this zone keeps the bullish continuation structure intact, with 1,595 as the first liquidity target.
Let’s go $ZEC
$ZEC is showing strong momentum with buyers firmly in control.
Structure remains bullish with price holding above the breakout zone.
EP
1,510 - 1,540
TP
TP1 1,595
TP2 1,650
TP3 1,720
SL
1,460
Liquidity is building above the 1,595 high, while price continues to hold the 1,501 support area. A clean reaction from this zone keeps the bullish continuation structure intact, with 1,595 as the first liquidity target.
Let’s go $ZEC
Structure remains bullish with price holding above the breakout zone.
EP
1,510 - 1,540
TP
TP1 1,595
TP2 1,650
TP3 1,720
SL
1,460
Liquidity is building above the 1,595 high, while price continues to hold the 1,501 support area. A clean reaction from this zone keeps the bullish continuation structure intact, with 1,595 as the first liquidity target.
Let’s go $ZEC
354
·
--
ເບິ່ງການແປ
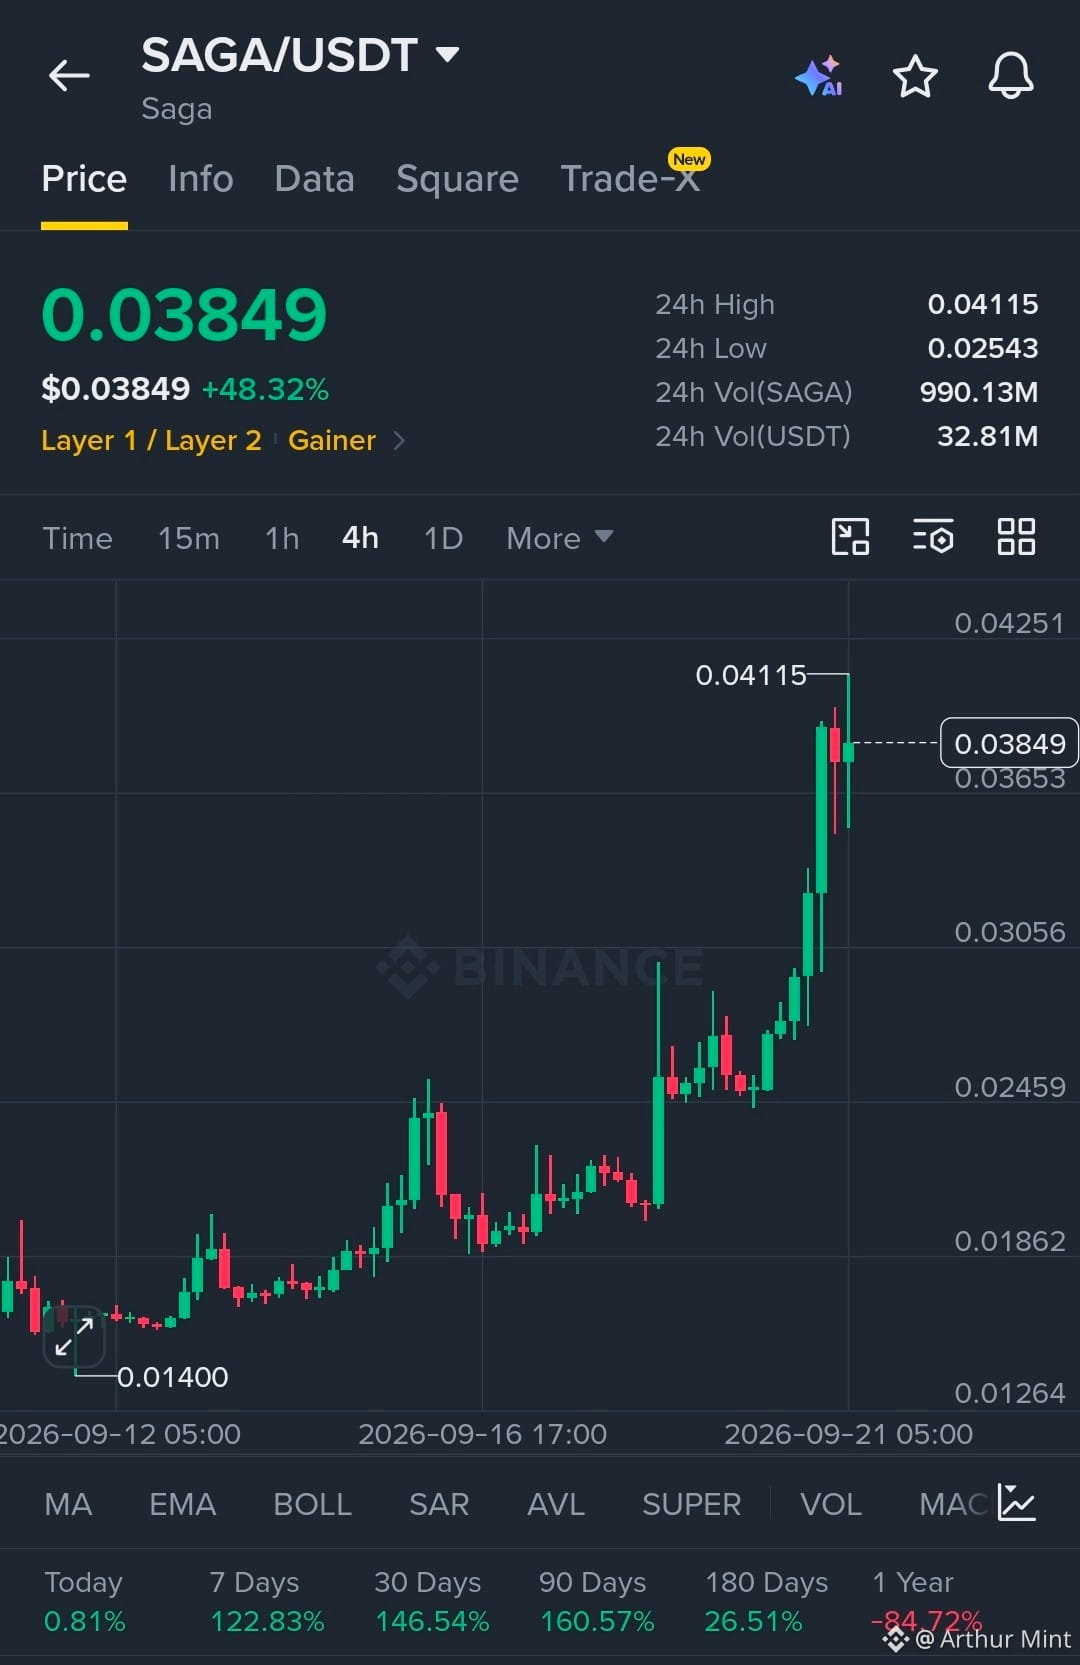
$SAGA is showing strong momentum with buyers firmly in control.
Structure remains bullish with price holding above the breakout zone.
EP
0.0370 - 0.0385
TP
TP1 0.0425
TP2 0.0460
TP3 0.0500
SL
0.0345
Liquidity has been swept above the previous high, while price continues to hold the breakout structure. A clean reaction around the 0.0370 area keeps the bullish continuation setup intact, with 0.0425 as the first liquidity target.
Let’s go $SAGA
$SAGA is showing strong momentum with buyers firmly in control.
Structure remains bullish with price holding above the breakout zone.
EP
0.0370 - 0.0385
TP
TP1 0.0425
TP2 0.0460
TP3 0.0500
SL
0.0345
Liquidity has been swept above the previous high, while price continues to hold the breakout structure. A clean reaction around the 0.0370 area keeps the bullish continuation setup intact, with 0.0425 as the first liquidity target.
Let’s go $SAGA
Structure remains bullish with price holding above the breakout zone.
EP
0.0370 - 0.0385
TP
TP1 0.0425
TP2 0.0460
TP3 0.0500
SL
0.0345
Liquidity has been swept above the previous high, while price continues to hold the breakout structure. A clean reaction around the 0.0370 area keeps the bullish continuation setup intact, with 0.0425 as the first liquidity target.
Let’s go $SAGA
263
·
--
ເບິ່ງການແປ
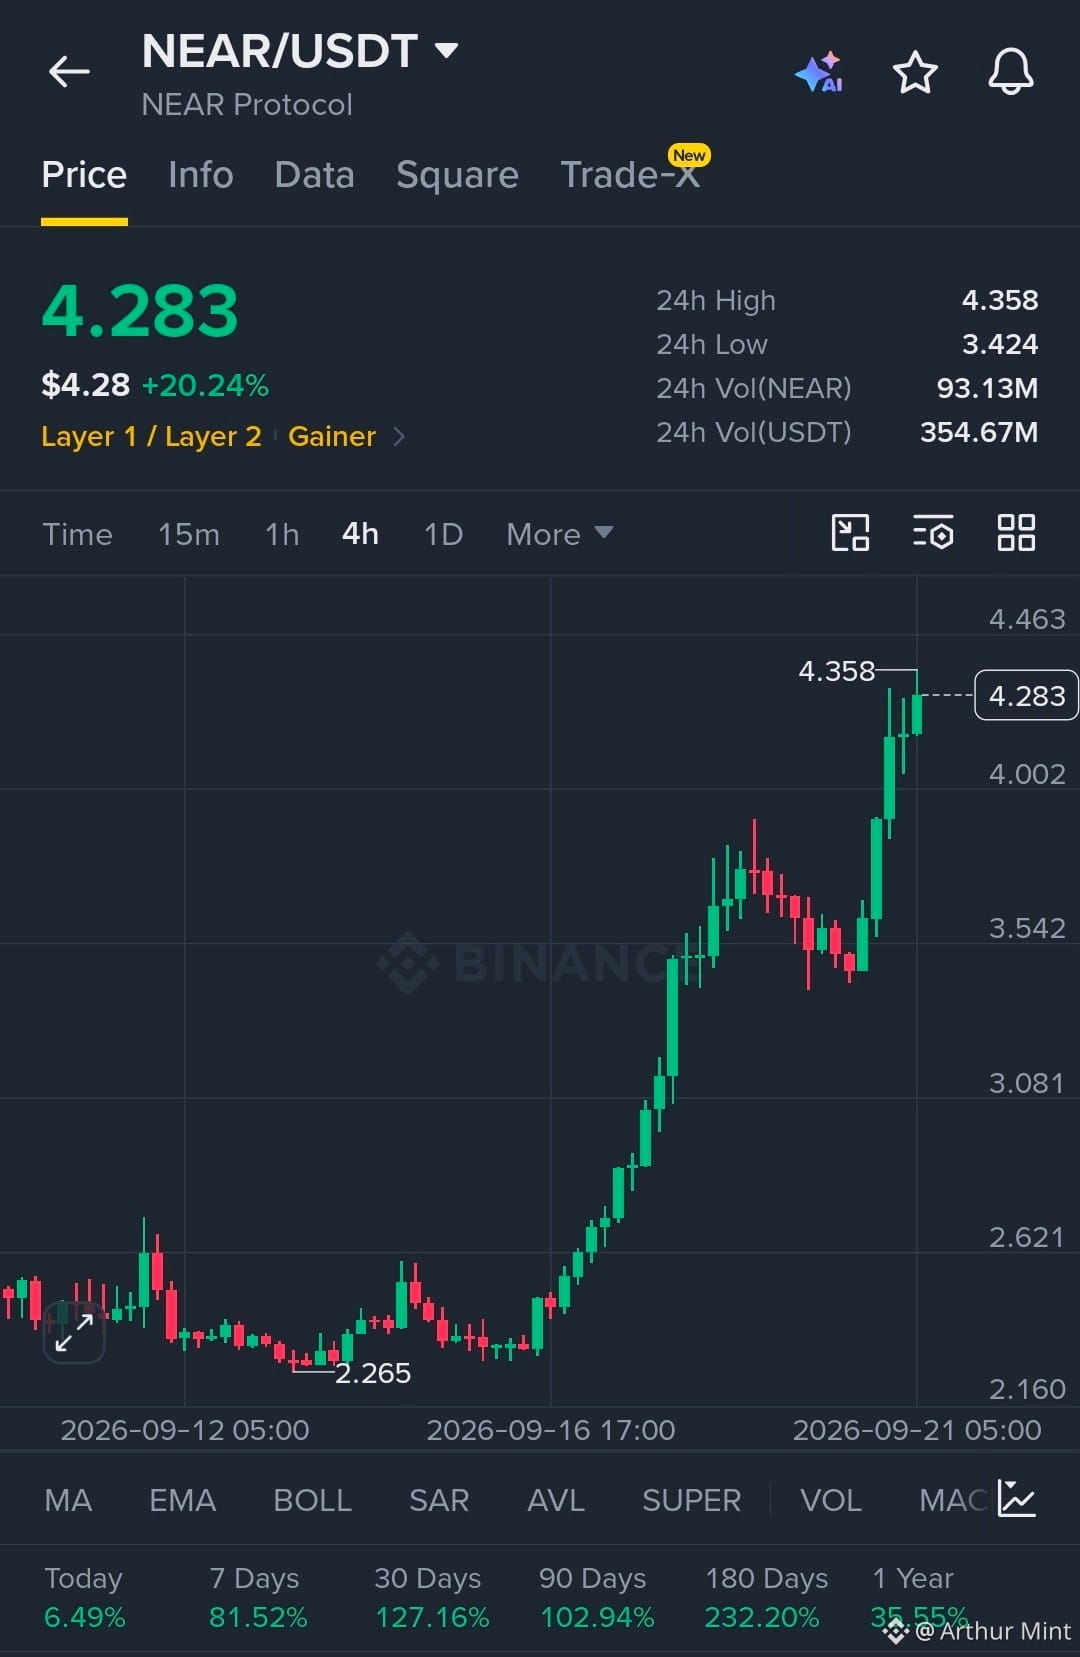
$NEAR is showing strong momentum with buyers firmly in control.
Structure remains bullish with price holding above the breakout zone.
EP
4.20 - 4.28
TP
TP1 4.45
TP2 4.65
TP3 4.90
SL
3.98
Liquidity has been swept above the previous highs, while price continues to hold the breakout structure. A clean reaction around the 4.20 area keeps the bullish continuation setup intact, with 4.45 as the first liquidity target.
Let’s go $NEAR
$NEAR is showing strong momentum with buyers firmly in control.
Structure remains bullish with price holding above the breakout zone.
EP
4.20 - 4.28
TP
TP1 4.45
TP2 4.65
TP3 4.90
SL
3.98
Liquidity has been swept above the previous highs, while price continues to hold the breakout structure. A clean reaction around the 4.20 area keeps the bullish continuation setup intact, with 4.45 as the first liquidity target.
Let’s go $NEAR
Structure remains bullish with price holding above the breakout zone.
EP
4.20 - 4.28
TP
TP1 4.45
TP2 4.65
TP3 4.90
SL
3.98
Liquidity has been swept above the previous highs, while price continues to hold the breakout structure. A clean reaction around the 4.20 area keeps the bullish continuation setup intact, with 4.45 as the first liquidity target.
Let’s go $NEAR
337
·
--
ສັນຍານກະທິງ
ເບິ່ງການແປ
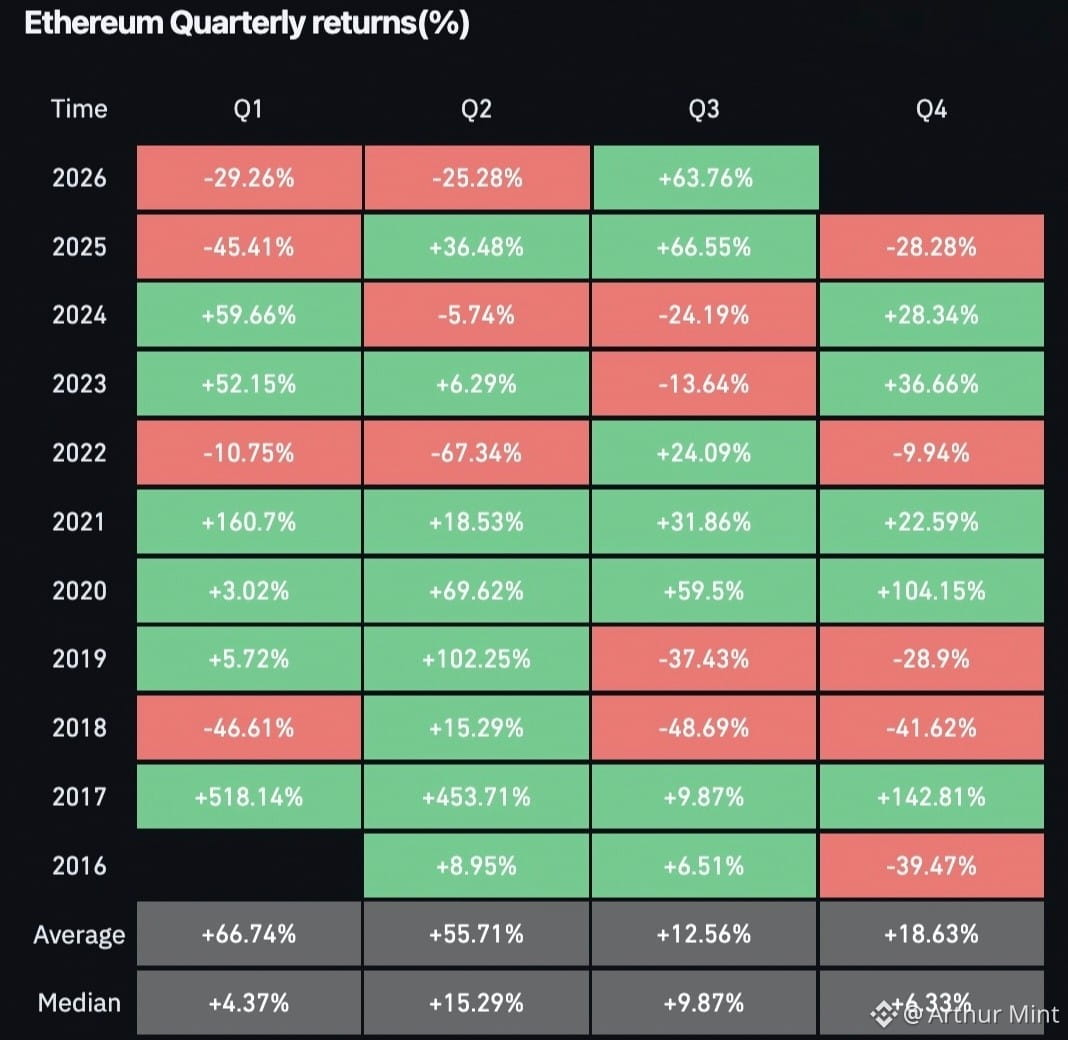
ETH JUST POSTED ITS 2ND-STRONGEST Q3 EVER — AND THE MOMENTUM IS HARD TO IGNORE
Ethereum is currently showing a +63.76% return for Q3 2026, putting this quarter in second place among the Q3 performances shown, just behind Q3 2025 at +66.55%.
That is a significant shift in momentum. After Q1 and Q2 declines of -29.26% and -25.28%, $ETH has delivered a powerful rebound, showing how quickly market sentiment can change within a few months.
For Bitcoin and the wider crypto market, this kind of strength in ETH suggests that upside momentum is still capable of returning aggressively after periods of weakness. It also puts renewed focus on whether that momentum can carry into the next quarter.
But there is one important caution: strong Q3 performance does not guarantee a strong Q4. In 2025, ETH gained 66.55% in Q3, only to fall 28.28% in Q4.
The momentum is impressive — but can Ethereum turn this Q3 strength into another breakout quarter?
ETH JUST POSTED ITS 2ND-STRONGEST Q3 EVER — AND THE MOMENTUM IS HARD TO IGNORE
Ethereum is currently showing a +63.76% return for Q3 2026, putting this quarter in second place among the Q3 performances shown, just behind Q3 2025 at +66.55%.
That is a significant shift in momentum. After Q1 and Q2 declines of -29.26% and -25.28%, $ETH has delivered a powerful rebound, showing how quickly market sentiment can change within a few months.
For Bitcoin and the wider crypto market, this kind of strength in ETH suggests that upside momentum is still capable of returning aggressively after periods of weakness. It also puts renewed focus on whether that momentum can carry into the next quarter.
But there is one important caution: strong Q3 performance does not guarantee a strong Q4. In 2025, ETH gained 66.55% in Q3, only to fall 28.28% in Q4.
The momentum is impressive — but can Ethereum turn this Q3 strength into another breakout quarter?
Ethereum is currently showing a +63.76% return for Q3 2026, putting this quarter in second place among the Q3 performances shown, just behind Q3 2025 at +66.55%.
That is a significant shift in momentum. After Q1 and Q2 declines of -29.26% and -25.28%, $ETH has delivered a powerful rebound, showing how quickly market sentiment can change within a few months.
For Bitcoin and the wider crypto market, this kind of strength in ETH suggests that upside momentum is still capable of returning aggressively after periods of weakness. It also puts renewed focus on whether that momentum can carry into the next quarter.
But there is one important caution: strong Q3 performance does not guarantee a strong Q4. In 2025, ETH gained 66.55% in Q3, only to fall 28.28% in Q4.
The momentum is impressive — but can Ethereum turn this Q3 strength into another breakout quarter?
1
357
·
--
ສັນຍານກະທິງ
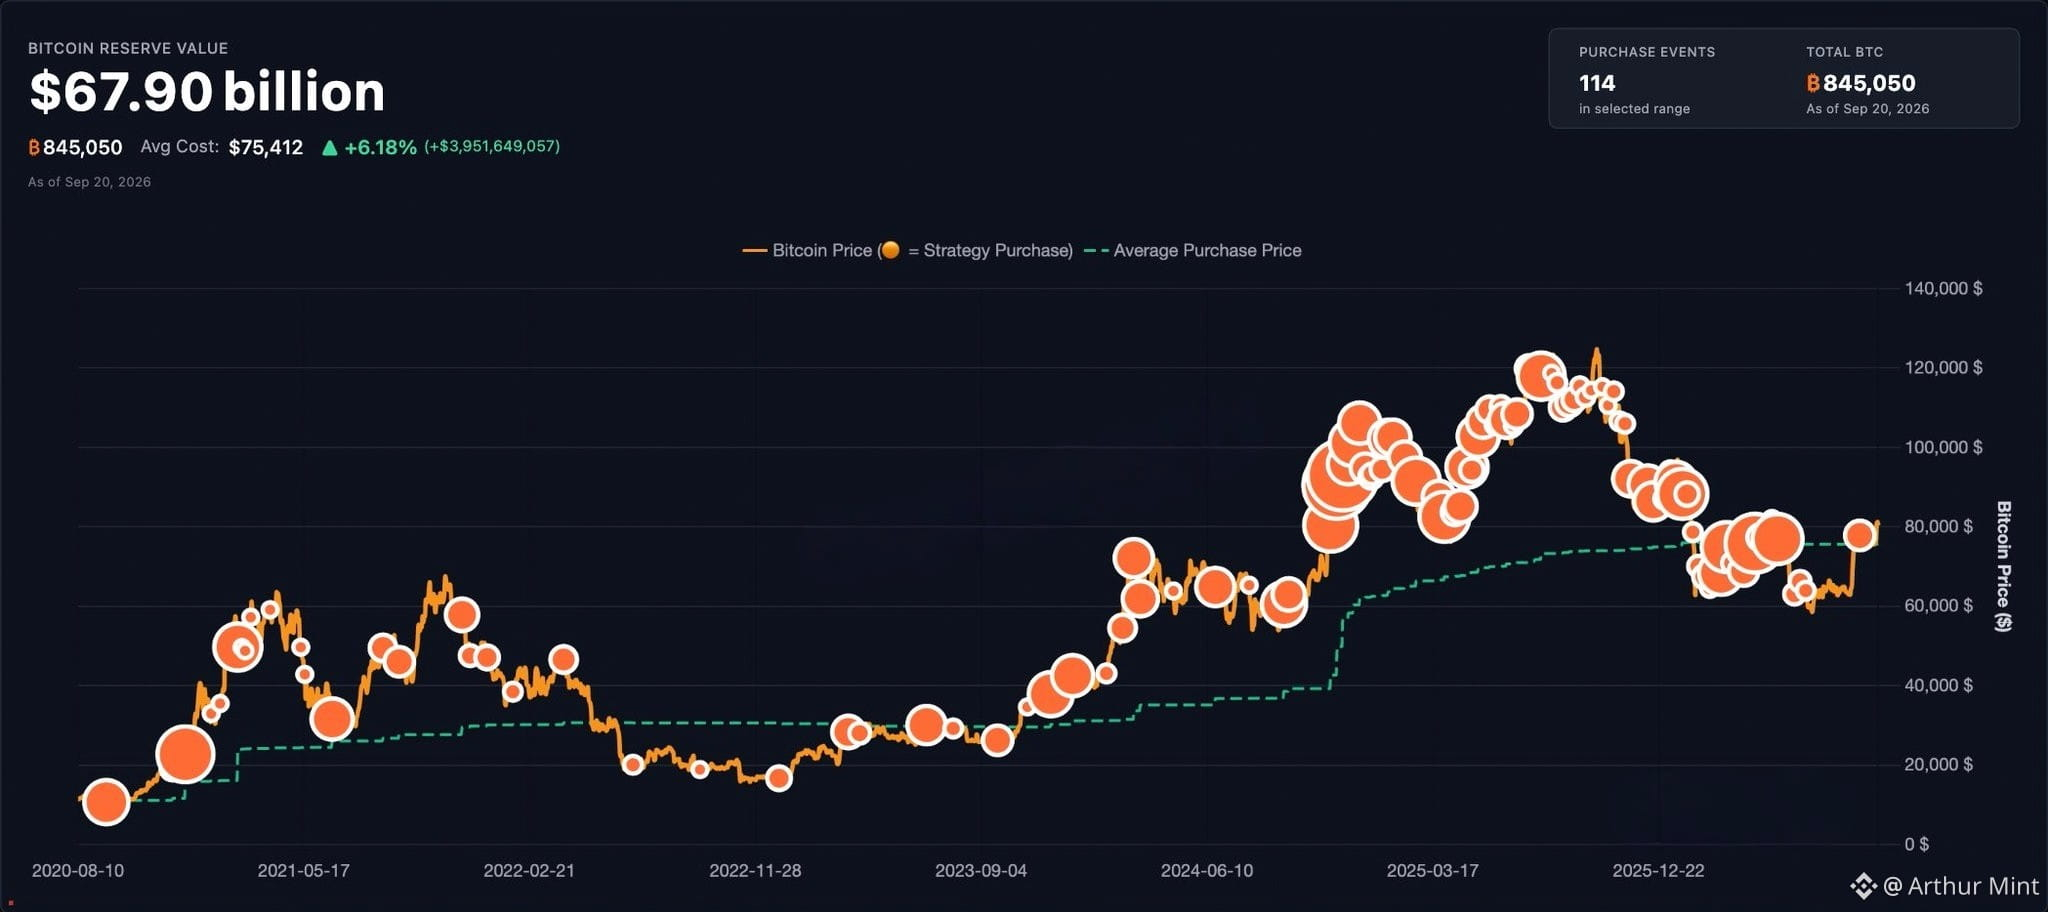
SIGNA KA PANGIPON SA BITCOIN NANANATILING MALAKAS
Ang reserbang halaga ng Bitcoin ay nasa $67.90B, na may 845,050 BTC sa kabuuang 114 na pagbili.
Ipinapakita ng karaniwang halaga na $75,412 at +6.18% na kita ang tuloy-tuloy na pangangalap, habang ang kamakailang galaw ng presyo ay nagpapanatili ng momentum—ngunit posibleng magdulot pa rin ng biglang pag-urong ang pagkasumpungin. Mga bull na nanonood?
SIGNA KA PANGIPON SA BITCOIN NANANATILING MALAKAS
Ang reserbang halaga ng Bitcoin ay nasa $67.90B, na may 845,050 BTC sa kabuuang 114 na pagbili.
Ipinapakita ng karaniwang halaga na $75,412 at +6.18% na kita ang tuloy-tuloy na pangangalap, habang ang kamakailang galaw ng presyo ay nagpapanatili ng momentum—ngunit posibleng magdulot pa rin ng biglang pag-urong ang pagkasumpungin. Mga bull na nanonood?
Ang reserbang halaga ng Bitcoin ay nasa $67.90B, na may 845,050 BTC sa kabuuang 114 na pagbili.
Ipinapakita ng karaniwang halaga na $75,412 at +6.18% na kita ang tuloy-tuloy na pangangalap, habang ang kamakailang galaw ng presyo ay nagpapanatili ng momentum—ngunit posibleng magdulot pa rin ng biglang pag-urong ang pagkasumpungin. Mga bull na nanonood?
1
145
·
--
ສັນຍານກະທິງ
Bitcoin i $150,000. Ethereum i $10,000.
Akojọ àwọn ìfojúsọ́nà iye owo ńláńlá fún 2027–2029 ni a ń sọ àsọtẹ́lẹ̀, èyí sì ń mú àwọn ọdún díẹ̀ tó ń bọ̀ dojú kọ àwọn òṣòwò àti àwọn olùdótó gidigidi.
Kí ló ṣe pàtàkì: àwọn ìfojúsọ́nà wọ̀nyí ń tọ́ka sí ìrètí ìlọ̀síwájú tó lágbára fún méjì lára àwọn ohun-ìní tó tóbi jù nínú ọjà.
Ohun tí ọjà fi hàn: 2027–2029 lè di àkókò tó ṣàkóso fún àwọn ìrètí iye owo Bitcoin àti Ethereum.
Bitcoin i $150,000. Ethereum i $10,000.
Akojọ àwọn ìfojúsọ́nà iye owo ńláńlá fún 2027–2029 ni a ń sọ àsọtẹ́lẹ̀, èyí sì ń mú àwọn ọdún díẹ̀ tó ń bọ̀ dojú kọ àwọn òṣòwò àti àwọn olùdótó gidigidi.
Kí ló ṣe pàtàkì: àwọn ìfojúsọ́nà wọ̀nyí ń tọ́ka sí ìrètí ìlọ̀síwájú tó lágbára fún méjì lára àwọn ohun-ìní tó tóbi jù nínú ọjà.
Ohun tí ọjà fi hàn: 2027–2029 lè di àkókò tó ṣàkóso fún àwọn ìrètí iye owo Bitcoin àti Ethereum.
Akojọ àwọn ìfojúsọ́nà iye owo ńláńlá fún 2027–2029 ni a ń sọ àsọtẹ́lẹ̀, èyí sì ń mú àwọn ọdún díẹ̀ tó ń bọ̀ dojú kọ àwọn òṣòwò àti àwọn olùdótó gidigidi.
Kí ló ṣe pàtàkì: àwọn ìfojúsọ́nà wọ̀nyí ń tọ́ka sí ìrètí ìlọ̀síwájú tó lágbára fún méjì lára àwọn ohun-ìní tó tóbi jù nínú ọjà.
Ohun tí ọjà fi hàn: 2027–2029 lè di àkókò tó ṣàkóso fún àwọn ìrètí iye owo Bitcoin àti Ethereum.
1
565
·
--
ສັນຍານກະທິງ
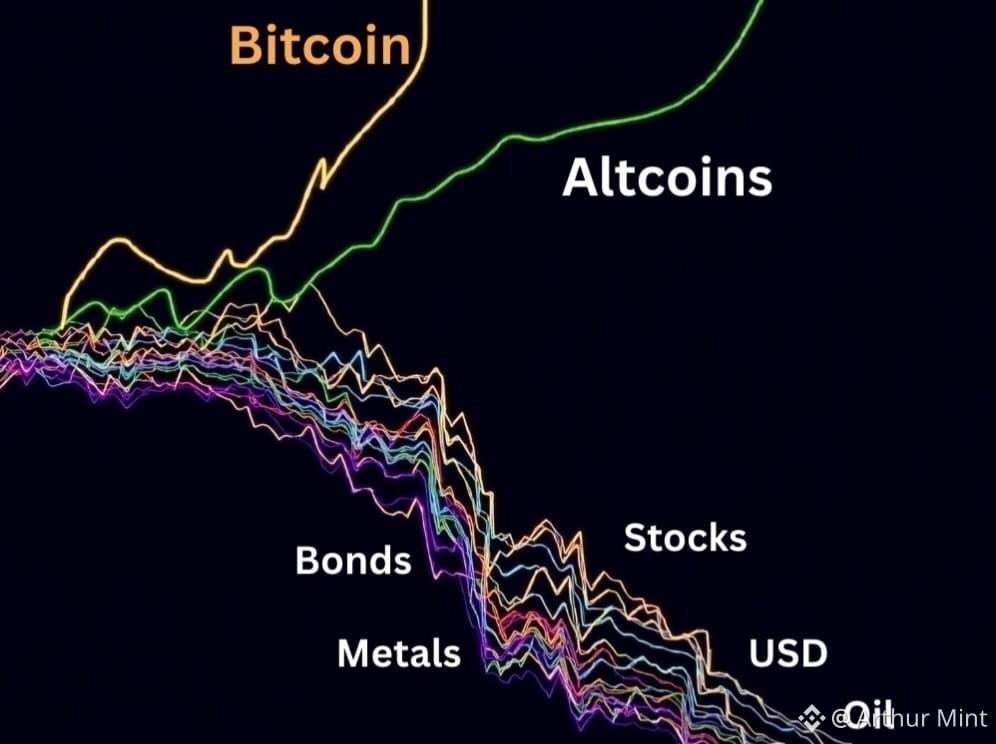
CAPITAL ROTATION ອາດກຳລັງຊີ້ໄປທາງ CRYPTO
ແຜນວາດສະແດງການໝຸນວຽນທີ່ໜ້າສົນໃຈ: Bitcoin ພຸ່ງຂຶ້ນຢ່າງແຮງ ໃນຂະນະທີ່ຮຸ້ນ, ພັນທະບັດ, ໂລຫະ, USD ແລະນ້ຳມັນ ມີແນວໂນ້ມລົງ.
Altcoins ກໍເລີ່ມແຂງແຮງຂຶ້ນ ເຊິ່ງຊີ້ວ່າ crypto ກຳລັງດຶງດູທຶນ ເມື່ອຊັບສິນດັ້ງເດີມອ່ອນລົງ.
ສຳລັບ Bitcoin, ເລື່ອງນີ້ສຳຄັນ ເພາະວ່າຄວາມແຂງແຮງແບບຍືນຍົງທຽບກັບອື່ນ (relative strength) ສາມາດເສริมແຮງແຮງການເຄື່ອນໄຫວທົ່ວໄປຂອງ crypto ແລະອາດຈະຊ່ວຍສະໜັບຂາຂຶ້ນອີກຮອບໜຶ່ງຢູ່ໃນຕະຫຼາດ.
ແຕ່ຢ່າງໃດກໍຕາມ, ການໝຸນວຽນສາມາດປີ້ນກັບໄດ້ໄວ ດັ່ງນັ້ນ ຄວາມແຮງແຮງຢ່າງດຽວກໍບໍ່ແນ່ນອນ.
ນີ້ອາດແມ່ນການໝຸນວຽນທີ່ crypto ກຳລັງລໍຖ້າຢູ່ບໍ?
CAPITAL ROTATION ອາດກຳລັງຊີ້ໄປທາງ CRYPTO
ແຜນວາດສະແດງການໝຸນວຽນທີ່ໜ້າສົນໃຈ: Bitcoin ພຸ່ງຂຶ້ນຢ່າງແຮງ ໃນຂະນະທີ່ຮຸ້ນ, ພັນທະບັດ, ໂລຫະ, USD ແລະນ້ຳມັນ ມີແນວໂນ້ມລົງ.
Altcoins ກໍເລີ່ມແຂງແຮງຂຶ້ນ ເຊິ່ງຊີ້ວ່າ crypto ກຳລັງດຶງດູທຶນ ເມື່ອຊັບສິນດັ້ງເດີມອ່ອນລົງ.
ສຳລັບ Bitcoin, ເລື່ອງນີ້ສຳຄັນ ເພາະວ່າຄວາມແຂງແຮງແບບຍືນຍົງທຽບກັບອື່ນ (relative strength) ສາມາດເສริมແຮງແຮງການເຄື່ອນໄຫວທົ່ວໄປຂອງ crypto ແລະອາດຈະຊ່ວຍສະໜັບຂາຂຶ້ນອີກຮອບໜຶ່ງຢູ່ໃນຕະຫຼາດ.
ແຕ່ຢ່າງໃດກໍຕາມ, ການໝຸນວຽນສາມາດປີ້ນກັບໄດ້ໄວ ດັ່ງນັ້ນ ຄວາມແຮງແຮງຢ່າງດຽວກໍບໍ່ແນ່ນອນ.
ນີ້ອາດແມ່ນການໝຸນວຽນທີ່ crypto ກຳລັງລໍຖ້າຢູ່ບໍ?
ແຜນວາດສະແດງການໝຸນວຽນທີ່ໜ້າສົນໃຈ: Bitcoin ພຸ່ງຂຶ້ນຢ່າງແຮງ ໃນຂະນະທີ່ຮຸ້ນ, ພັນທະບັດ, ໂລຫະ, USD ແລະນ້ຳມັນ ມີແນວໂນ້ມລົງ.
Altcoins ກໍເລີ່ມແຂງແຮງຂຶ້ນ ເຊິ່ງຊີ້ວ່າ crypto ກຳລັງດຶງດູທຶນ ເມື່ອຊັບສິນດັ້ງເດີມອ່ອນລົງ.
ສຳລັບ Bitcoin, ເລື່ອງນີ້ສຳຄັນ ເພາະວ່າຄວາມແຂງແຮງແບບຍືນຍົງທຽບກັບອື່ນ (relative strength) ສາມາດເສริมແຮງແຮງການເຄື່ອນໄຫວທົ່ວໄປຂອງ crypto ແລະອາດຈະຊ່ວຍສະໜັບຂາຂຶ້ນອີກຮອບໜຶ່ງຢູ່ໃນຕະຫຼາດ.
ແຕ່ຢ່າງໃດກໍຕາມ, ການໝຸນວຽນສາມາດປີ້ນກັບໄດ້ໄວ ດັ່ງນັ້ນ ຄວາມແຮງແຮງຢ່າງດຽວກໍບໍ່ແນ່ນອນ.
ນີ້ອາດແມ່ນການໝຸນວຽນທີ່ crypto ກຳລັງລໍຖ້າຢູ່ບໍ?
2
253
·
--
ສັນຍານກະທິງ
ເບິ່ງການແປ
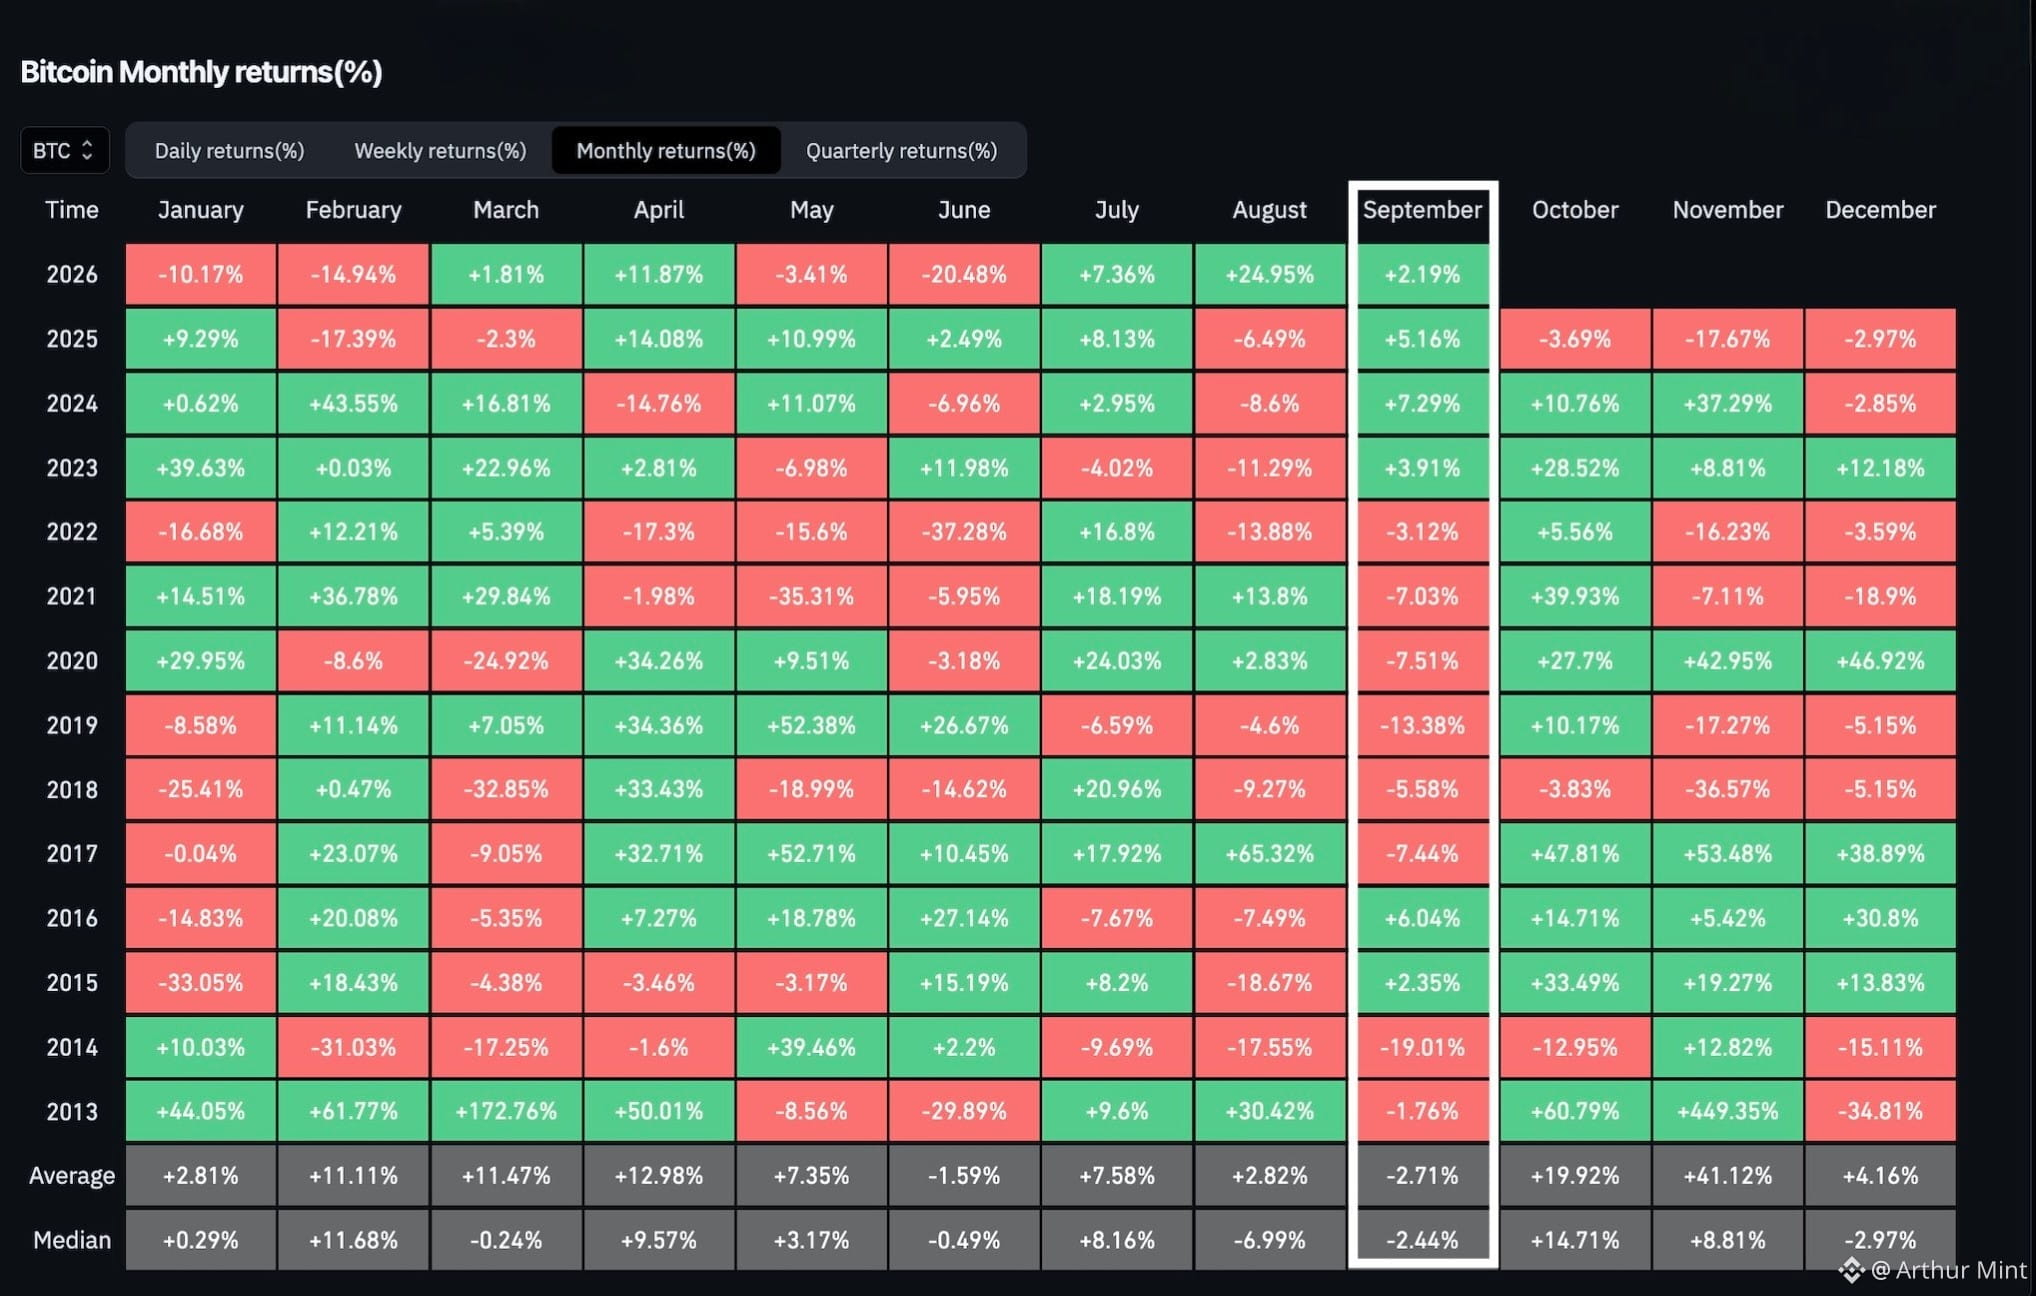
BITCOIN IS CHALLENGING ITS MOST NOTORIOUS MONTHLY PATTERN
September has historically been one of Bitcoin’s weakest months, with the chart showing a negative average and median performance for the month. Yet this September is currently in positive territory, breaking from the usual seasonal pressure.
More importantly, $BTC has a chance to record three consecutive green monthly performances during a bear market — something that has never happened before, according to the historical pattern highlighted here.
July and August were already positive, while September remains green as the month approaches its close. That puts Bitcoin just days away from a potentially notable historical milestone.
For the broader crypto market, such a move could signal that Bitcoin’s recent strength is pushing beyond the weakness normally associated with this period and challenging expectations around bearish market behavior.
Still, September has not officially closed yet, and historical patterns do not guarantee what comes next.
Will Bitcoin finally rewrite the bear-market playbook?
BITCOIN IS CHALLENGING ITS MOST NOTORIOUS MONTHLY PATTERN
September has historically been one of Bitcoin’s weakest months, with the chart showing a negative average and median performance for the month. Yet this September is currently in positive territory, breaking from the usual seasonal pressure.
More importantly, $BTC has a chance to record three consecutive green monthly performances during a bear market — something that has never happened before, according to the historical pattern highlighted here.
July and August were already positive, while September remains green as the month approaches its close. That puts Bitcoin just days away from a potentially notable historical milestone.
For the broader crypto market, such a move could signal that Bitcoin’s recent strength is pushing beyond the weakness normally associated with this period and challenging expectations around bearish market behavior.
Still, September has not officially closed yet, and historical patterns do not guarantee what comes next.
Will Bitcoin finally rewrite the bear-market playbook?
September has historically been one of Bitcoin’s weakest months, with the chart showing a negative average and median performance for the month. Yet this September is currently in positive territory, breaking from the usual seasonal pressure.
More importantly, $BTC has a chance to record three consecutive green monthly performances during a bear market — something that has never happened before, according to the historical pattern highlighted here.
July and August were already positive, while September remains green as the month approaches its close. That puts Bitcoin just days away from a potentially notable historical milestone.
For the broader crypto market, such a move could signal that Bitcoin’s recent strength is pushing beyond the weakness normally associated with this period and challenging expectations around bearish market behavior.
Still, September has not officially closed yet, and historical patterns do not guarantee what comes next.
Will Bitcoin finally rewrite the bear-market playbook?
1
187
·
--
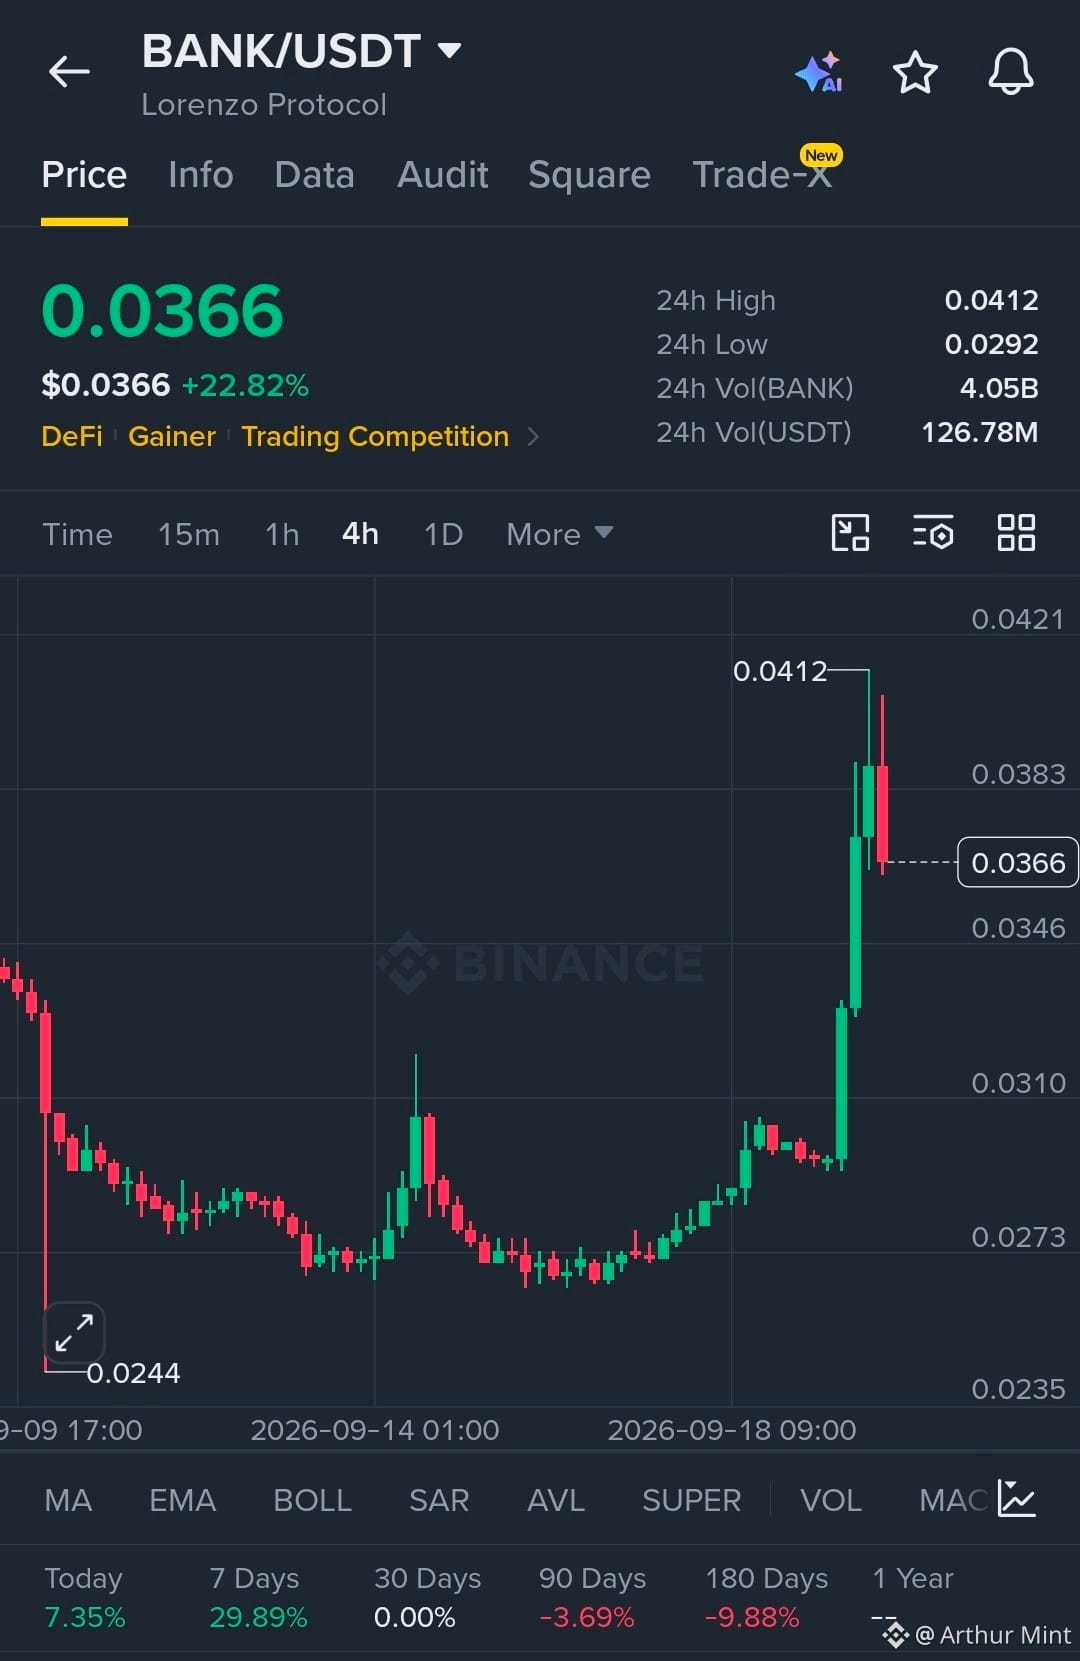
$BANK ກຳລັງສະແດງແນວໂນ້ມແຂງແຮງ ພ້ອມການເພີ່ມຂຶ້ນຢ່າງກ້າຫານ.
ຜູ້ຊື້ຄວບຄຸມຢູ່ ເພາະໂຄງສ້າງຍັງຄົງພິມຄ່າ higher highs ແລະ higher lows ຕໍ່ເນື່ອງ.
EP
0.0355–0.0368
TP
TP1 0.0383
TP2 0.0412
TP3 0.0421
SL
0.0340
ຄວາມຂົ້ນແຂງ (liquidity) ຢູ່ເໜືອ 0.0383 ແມ່ນເຂດປະຕິກິລິຍາຫຼັກ ທີ່ຕ້ອງຈັບຕາ, ໃນຂະນະທີ່ການຄອງຢູ່ 0.0340 ຈະຮັກສາໂຄງສ້າງຂາຂຶ້ນໃຫ້ຍັງຄົງ. ການທະລຸຢ່າງຊັດເຈນເໜືອ 0.0412 ອາດເປີດຖົງຄວາມຂົ້ນຂັ້ນຕໍ່ໄປ ໄປຫາ 0.0421.
ໄປເລີຍ $BANK
$BANK ກຳລັງສະແດງແນວໂນ້ມແຂງແຮງ ພ້ອມການເພີ່ມຂຶ້ນຢ່າງກ້າຫານ.
ຜູ້ຊື້ຄວບຄຸມຢູ່ ເພາະໂຄງສ້າງຍັງຄົງພິມຄ່າ higher highs ແລະ higher lows ຕໍ່ເນື່ອງ.
EP
0.0355–0.0368
TP
TP1 0.0383
TP2 0.0412
TP3 0.0421
SL
0.0340
ຄວາມຂົ້ນແຂງ (liquidity) ຢູ່ເໜືອ 0.0383 ແມ່ນເຂດປະຕິກິລິຍາຫຼັກ ທີ່ຕ້ອງຈັບຕາ, ໃນຂະນະທີ່ການຄອງຢູ່ 0.0340 ຈະຮັກສາໂຄງສ້າງຂາຂຶ້ນໃຫ້ຍັງຄົງ. ການທະລຸຢ່າງຊັດເຈນເໜືອ 0.0412 ອາດເປີດຖົງຄວາມຂົ້ນຂັ້ນຕໍ່ໄປ ໄປຫາ 0.0421.
ໄປເລີຍ $BANK
ຜູ້ຊື້ຄວບຄຸມຢູ່ ເພາະໂຄງສ້າງຍັງຄົງພິມຄ່າ higher highs ແລະ higher lows ຕໍ່ເນື່ອງ.
EP
0.0355–0.0368
TP
TP1 0.0383
TP2 0.0412
TP3 0.0421
SL
0.0340
ຄວາມຂົ້ນແຂງ (liquidity) ຢູ່ເໜືອ 0.0383 ແມ່ນເຂດປະຕິກິລິຍາຫຼັກ ທີ່ຕ້ອງຈັບຕາ, ໃນຂະນະທີ່ການຄອງຢູ່ 0.0340 ຈະຮັກສາໂຄງສ້າງຂາຂຶ້ນໃຫ້ຍັງຄົງ. ການທະລຸຢ່າງຊັດເຈນເໜືອ 0.0412 ອາດເປີດຖົງຄວາມຂົ້ນຂັ້ນຕໍ່ໄປ ໄປຫາ 0.0421.
ໄປເລີຍ $BANK
2
428
·
--
ເບິ່ງການແປ
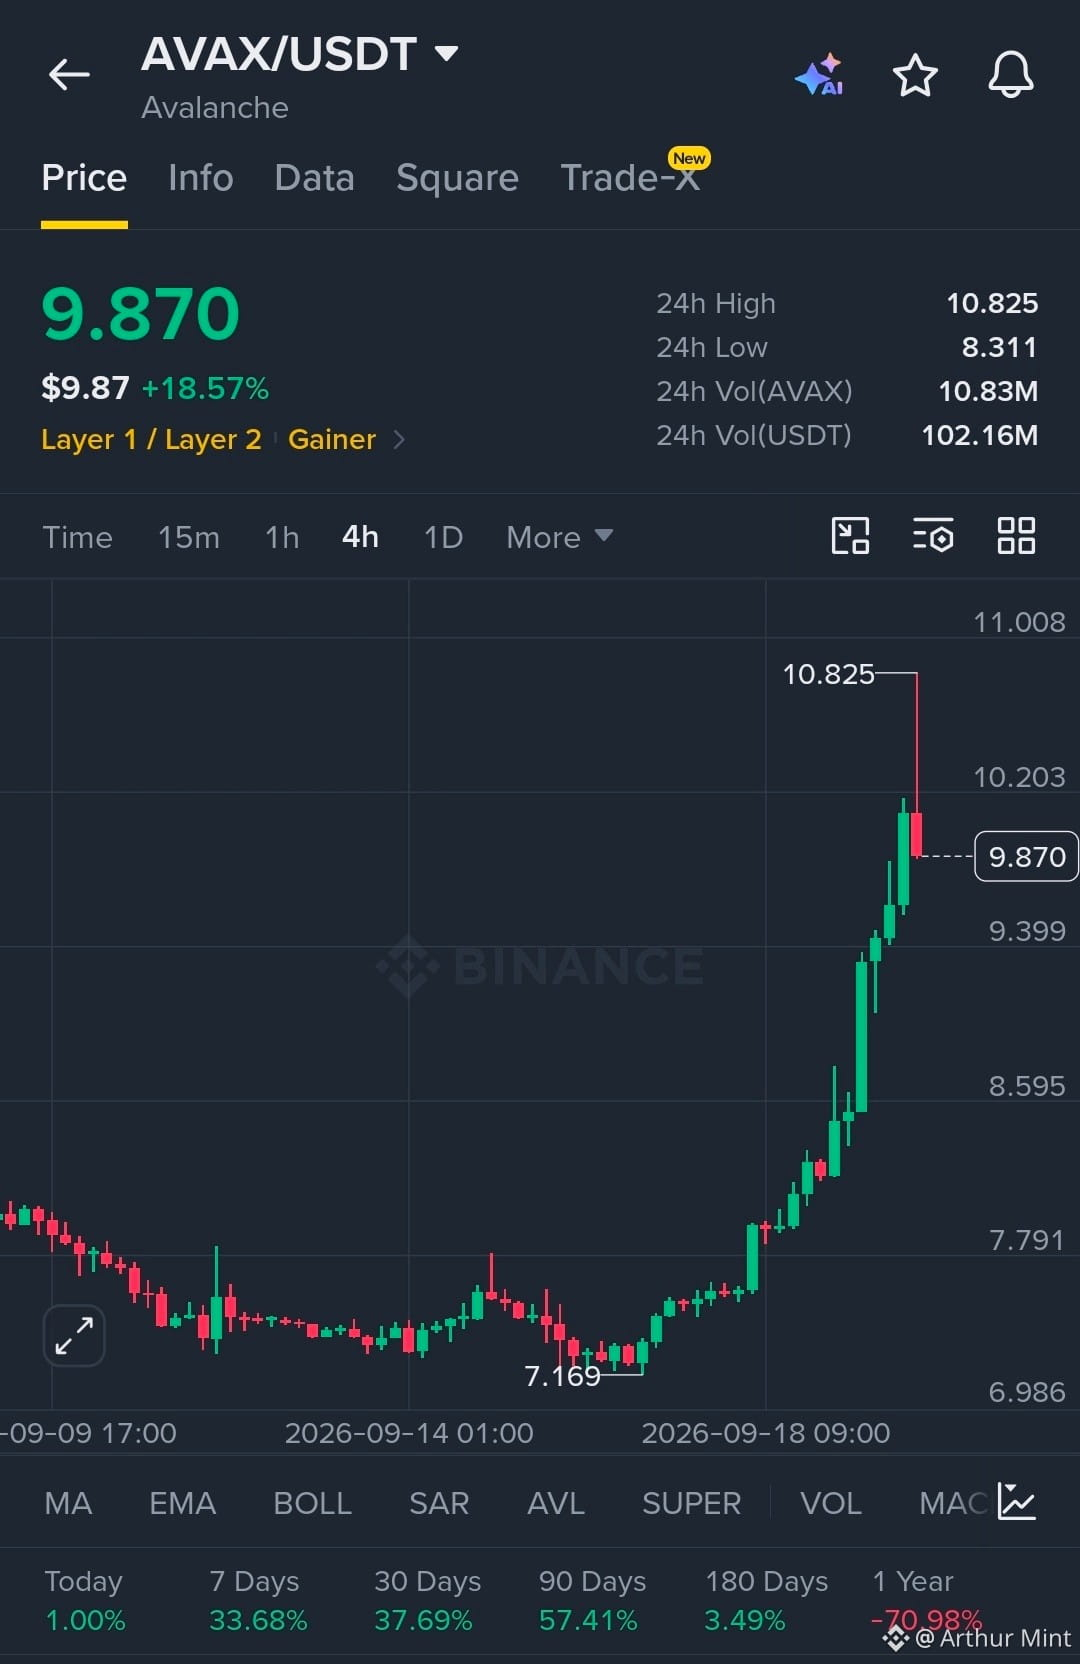
$AVAX is showing strong momentum with aggressive upside expansion.
Buyers are in control as structure continues to print higher highs and higher lows.
EP
9.70–9.90
TP
TP1 10.20
TP2 10.80
TP3 11.00
SL
9.35
Liquidity above 10.20 remains the key reaction zone, while holding 9.35 keeps the bullish structure intact. A clean break above 10.80 could open the next liquidity pocket toward 11.00.
Let’s go $AVAX
$AVAX is showing strong momentum with aggressive upside expansion.
Buyers are in control as structure continues to print higher highs and higher lows.
EP
9.70–9.90
TP
TP1 10.20
TP2 10.80
TP3 11.00
SL
9.35
Liquidity above 10.20 remains the key reaction zone, while holding 9.35 keeps the bullish structure intact. A clean break above 10.80 could open the next liquidity pocket toward 11.00.
Let’s go $AVAX
Buyers are in control as structure continues to print higher highs and higher lows.
EP
9.70–9.90
TP
TP1 10.20
TP2 10.80
TP3 11.00
SL
9.35
Liquidity above 10.20 remains the key reaction zone, while holding 9.35 keeps the bullish structure intact. A clean break above 10.80 could open the next liquidity pocket toward 11.00.
Let’s go $AVAX
1
469
·
--
ສັນຍານກະທິງ
ເບິ່ງການແປ
Bitcoin jumped $18,000 in just one week — from $63,000 to $81,000.
That move came right in the middle of a bear market, showing how sharply Bitcoin can accelerate even when broader conditions remain weak.
Why it matters: A single week erased a massive price gap, highlighting the scale of Bitcoin’s upside moves.
Market takeaway: Bear markets can still produce explosive rallies — and bull markets could amplify that volatility.
Bitcoin jumped $18,000 in just one week — from $63,000 to $81,000.
That move came right in the middle of a bear market, showing how sharply Bitcoin can accelerate even when broader conditions remain weak.
Why it matters: A single week erased a massive price gap, highlighting the scale of Bitcoin’s upside moves.
Market takeaway: Bear markets can still produce explosive rallies — and bull markets could amplify that volatility.
That move came right in the middle of a bear market, showing how sharply Bitcoin can accelerate even when broader conditions remain weak.
Why it matters: A single week erased a massive price gap, highlighting the scale of Bitcoin’s upside moves.
Market takeaway: Bear markets can still produce explosive rallies — and bull markets could amplify that volatility.
2
230
·
--
ສັນຍານກະທິງ
ເບິ່ງການແປ
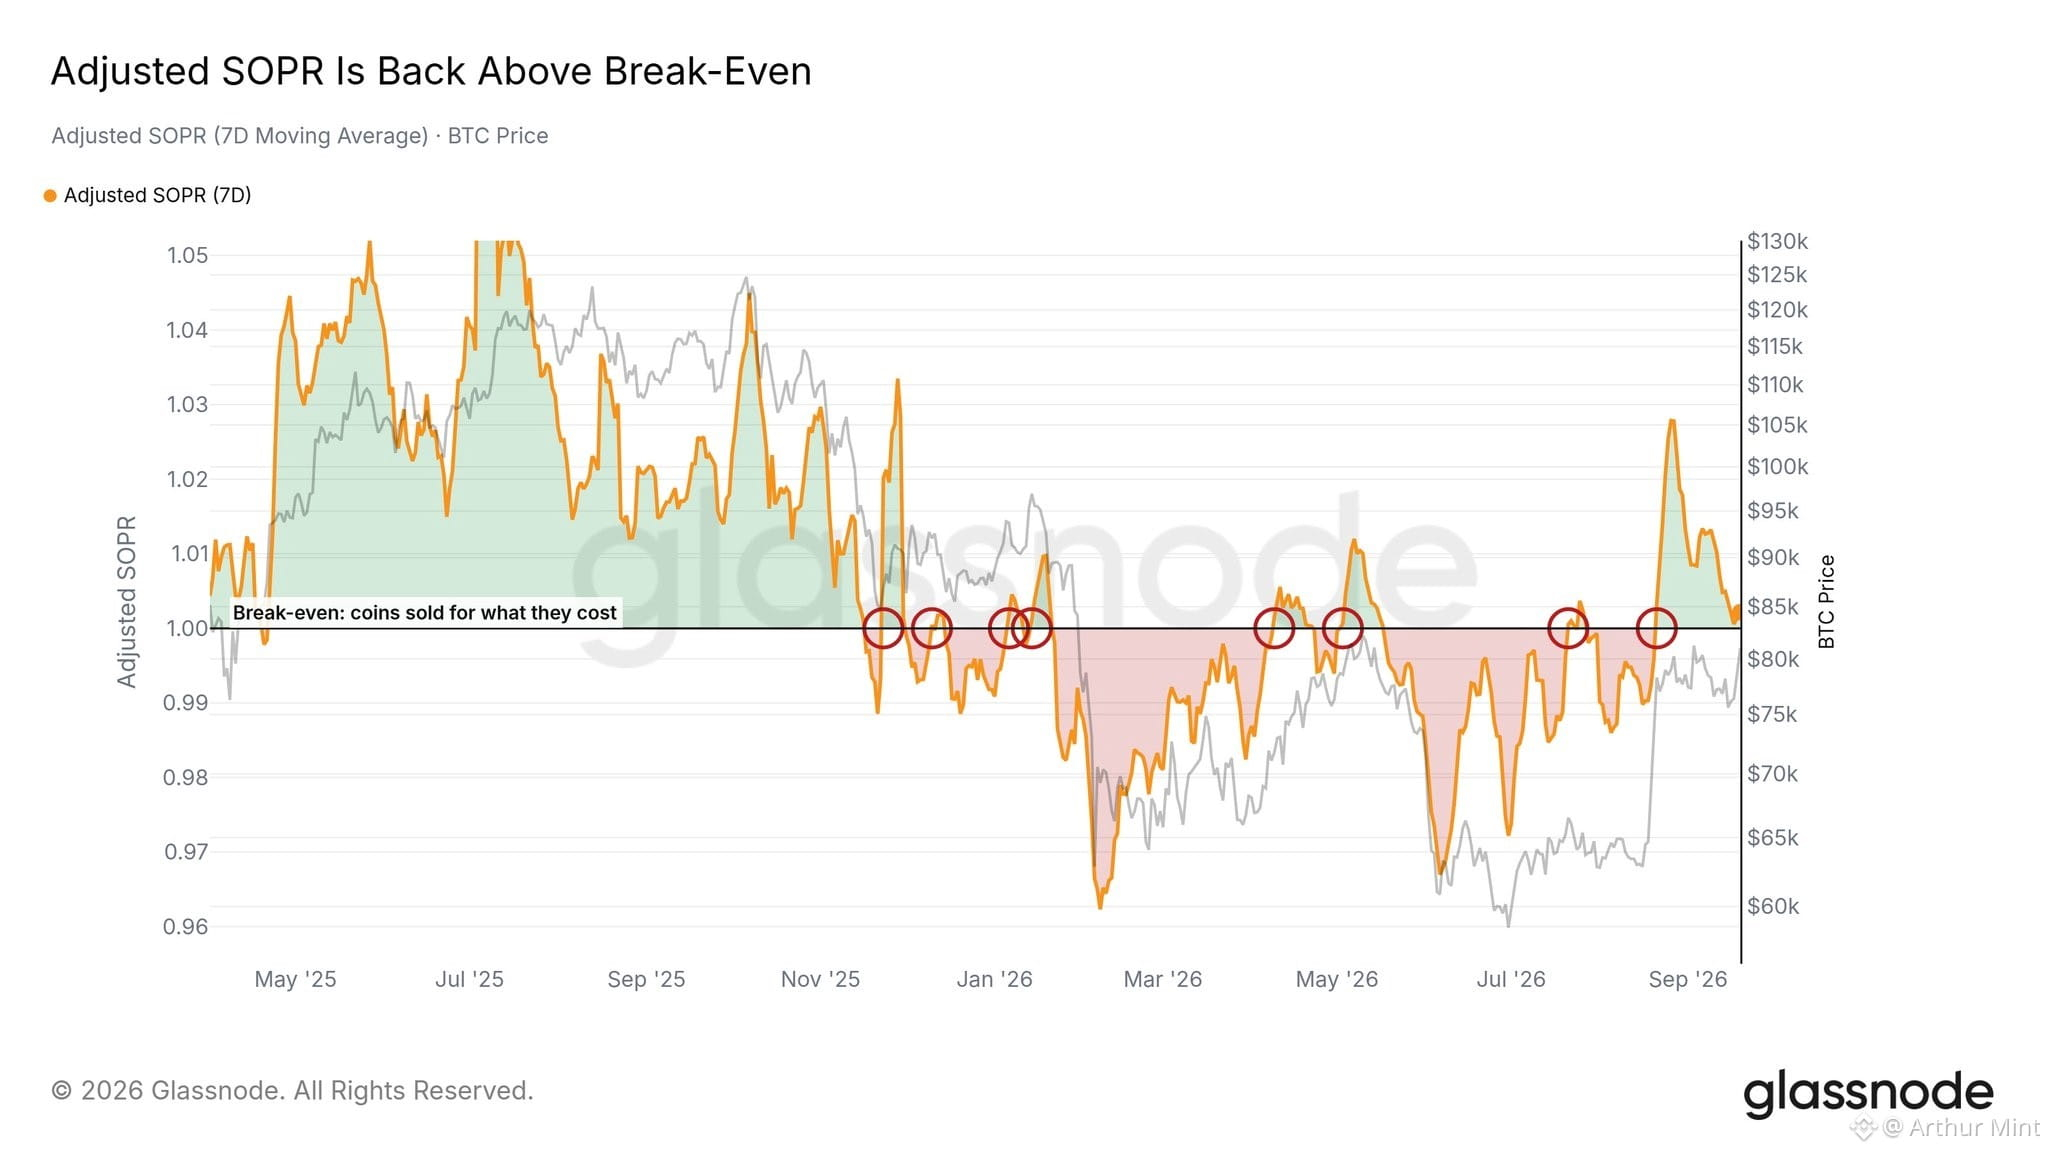
BITCOIN’S PROFITABILITY SIGNAL IS BACK ABOVE BREAK-EVEN
Bitcoin’s latest on-chain setup is showing renewed strength. The chart indicates that entity-adjusted SOPR has moved back above 1, suggesting coins are being spent at a profit rather than immediately triggering broad selling pressure.
This level matters because sustained SOPR above 1 has historically been associated with a bull-market environment. The current move therefore points to demand holding up well enough for profitable spending without an immediate rollover.
The chart also highlights several previous moves around the break-even line, showing how important the 1.0 level has become. Staying above it would keep the constructive signal intact and support the broader bullish narrative.
The next key test is simple: can SOPR remain above 1? A continued hold could reinforce confidence in current demand, while a drop back below 1 would suggest that this strength is starting to fade.
Still, SOPR is not a guarantee of future price action. Market conditions can change quickly, so the signal should be monitored alongside the broader trend.
$BTC is back on the profit side of the line — can the bulls keep it there?
BITCOIN’S PROFITABILITY SIGNAL IS BACK ABOVE BREAK-EVEN
Bitcoin’s latest on-chain setup is showing renewed strength. The chart indicates that entity-adjusted SOPR has moved back above 1, suggesting coins are being spent at a profit rather than immediately triggering broad selling pressure.
This level matters because sustained SOPR above 1 has historically been associated with a bull-market environment. The current move therefore points to demand holding up well enough for profitable spending without an immediate rollover.
The chart also highlights several previous moves around the break-even line, showing how important the 1.0 level has become. Staying above it would keep the constructive signal intact and support the broader bullish narrative.
The next key test is simple: can SOPR remain above 1? A continued hold could reinforce confidence in current demand, while a drop back below 1 would suggest that this strength is starting to fade.
Still, SOPR is not a guarantee of future price action. Market conditions can change quickly, so the signal should be monitored alongside the broader trend.
$BTC is back on the profit side of the line — can the bulls keep it there?
Bitcoin’s latest on-chain setup is showing renewed strength. The chart indicates that entity-adjusted SOPR has moved back above 1, suggesting coins are being spent at a profit rather than immediately triggering broad selling pressure.
This level matters because sustained SOPR above 1 has historically been associated with a bull-market environment. The current move therefore points to demand holding up well enough for profitable spending without an immediate rollover.
The chart also highlights several previous moves around the break-even line, showing how important the 1.0 level has become. Staying above it would keep the constructive signal intact and support the broader bullish narrative.
The next key test is simple: can SOPR remain above 1? A continued hold could reinforce confidence in current demand, while a drop back below 1 would suggest that this strength is starting to fade.
Still, SOPR is not a guarantee of future price action. Market conditions can change quickly, so the signal should be monitored alongside the broader trend.
$BTC is back on the profit side of the line — can the bulls keep it there?
3
199
ເຂົ້າສູ່ລະບົບເພື່ອສຳຫຼວດເນື້ອຫາເພີ່ມເຕີມ
ເຂົ້າຮ່ວມກຸ່ມຜູ້ໃຊ້ຄຣິບໂຕທົ່ວໂລກໃນ Binance Square.
⚡️ ໄດ້ຮັບຂໍ້ມູນຫຼ້າສຸດ ແລະ ທີ່ມີປະໂຫຍດກ່ຽວກັບຄຣິບໂຕ.
💬 ໄດ້ຮັບຄວາມໄວ້ວາງໃຈຈາກຕະຫຼາດແລກປ່ຽນຄຣິບໂຕທີ່ໃຫຍ່ທີ່ສຸດໃນໂລກ.
👍 ຄົ້ນຫາຂໍ້ມູນເຊີງເລິກທີ່ແທ້ຈາກນັກສ້າງທີ່ໄດ້ຮັບການຢືນຢັນ.
ອີເມວ / ເບີໂທລະສັບ
ຫົວຂໍ້ທີ່ກໍາລັງນິຍົມ
AIStocksWhatNext
482,760 views
3,572 ກຳລັງສົນທະນາ
Пាចែក ແລະ ຮັບຮາງວັນຈາກການແຂ່ງຂັນ Trending Hashtag ຂອງພວກເຮົາ
✨ຫົວຂໍ້: ມີໂອກາດການລົງທຶນອື່ນໃດອີກ ຍັງເຫຼືອບໍ ໃນເວລາທີ່ຫຸ້ນ AI ຍັງຂຶ້ນຢ່າງຕໍ່ເນື່ອງ?
👉ວິທີເຂົ້າຮ່ວມ:
ໂພດຂໍ້ຄວາມສັ້ນຫຼືບົດຄວາມພ້ອມ hashtag #AIStocksWhatNext
ແບ່ງປັນວ່າທ່ານເບີກບວກ (bullish) ຫຼືຂາດບວກ (bearish) ແລະ ໂພດການຖືຫຸ້ນ AI ຫຼືການຊື້ຂາຍຂອງທ່ານ — ການໃຊ້ trade widget ອາດຊ່ວຍໃຫ້ມີສິດກໍານົດໄດ້ດີຂຶ້ນ.
ທ່ານຍັງສາມາດເສີມໃຫ້ໂພດຂອງທ່ານໂດຍການແບ່ງປັນຂໍ້ມູນ ຫຼື ກຣາຟ, ແລະຫຼີກລ້ຽງຮູບພາບທີ່ສ້າງຈາກ AI.
✍️ສ້າງເນື້ອຫາຕາມມຸມມອງດ້ານລຸ່ມນີ້:
- Nvidia ກ່າວວ່າຍອດຂາຍຊິບຈະເພີ່ມເປັນສອງເທົ່າໃນປີໜ້າ, ແລະ ບໍລິສັດ AI ຊັ້ນນໍາຍັງຕີຍອດລາຍຮັບສູງສຸດຕໍ່ເນື່ອງ—ການໃຊ້ຈ່າຍດ້ານ compute ທີ່ຢູ່ຫຼັງມັນກໍ່ຊັດເຈນຫຼາຍ. ຄວາມຕ້ອງການຂອງ AI ຈິງໆກໍາລັງຂຶ້ນບໍ? ແລະ ມັນຈະຢູ່ໄດ້ດົນປານໃດ? ຫຸ້ນ AI ຂຶ້ນທົ່ວກະດານ. ນີ້ແມ່ນການປະຕິບັດສະລຸດຈິງ (real breakout) ຫຼືແພ້ແຄ່ການເດັ້ງກັ້ນໄລຍະສັ້ນ?
- ຜູ້ນໍາໃນອຸດສາຫະກໍາເອີ້ນໃຫ້ຊະລໍການພັດທະນາ AI, ໃນຂະນະທີ່ Trump ວາງແຜນຈະສ້າງ “AI Force” ໂດຍອ້າງວ່າ AI ອາດຈະກວມ 25% ຂອງ GDP ຂອງສະຫະລັດ ໃນອະນາຄົດ. ທ່ານຢູ່ຝ່າຍໃດ? ການໜູນຊ່ວຍຈາກລະດັບລັດ (state-level backing) ຈະເປັນໄຊຊະນະໄລຍະຍາວສໍາລັບຫຸ້ນ AI ບໍ?
- ທ່ານກໍ່າລັງຊື້ຫຸ້ນ AI ບໍ? ແບ່ງປັນການຊື້ຂາຍ/ການຖືຄອງທີ່ກ່ຽວຂ້ອງກັບ AI ຂອງທ່ານຜ່ານ trade sharing widget ຂອງພວກເຮົາ.
⏰ໄລຍະການແຄມເປນ:
- 2026-09-22 7:00 - 2026-09-24 4:00 UTC
🎁ລາງວັນ:
- ໂພດທີ່ມີຄຸນສົມບັດຕາມກົດລະບຽບຂ້າງເທິງ ແລະ ມີຫຼາຍກວ່າ 100 ຄໍາຈະຖືກທວດສອບ ແລະ ອາດຈະໄດ້ຮັບການເພີ່ມເຂົ້າເບິ່ງແບບສຸ່ມ 500 ຫາ 3,000 ຄັ້ງ. ທ່ານຈະໄດ້ຮັບແຈ້ງເຕືອນຈາກເຈົ້າໜ້າທີ່ຂອງ feed ຂອງພວກເຮົາ ຖ້າໂພດຂອງທ່ານຖືກເລືອກ.
- ມີໂອກາດໃຫ້ບົດຄວາມຂອງທ່ານຖືກນໍາໄປສະແດງໃນ Binance Square Official
ຕ້ອງການໄອເດຍສໍາລັບໂພດຂອງທ່ານບໍ? ເຂົ້າໄປທີ່ໜ້າຫົວຂໍ້ #AIStocksWhatNext ຫຼື Square Guide on How to Post for Better Reach.
Binance Square Official
·418 ຖືກໃຈ
·1.1M views
BitcoinTops$87KAtEightMonthHigh
374 views
21 ກຳລັງສົນທະນາ
ZECBreaksAbove$1600AtRecordHigh
166 views
8 ກຳລັງສົນທະນາ