Article 2: The Chart Tells a Story -Can You Read It?-
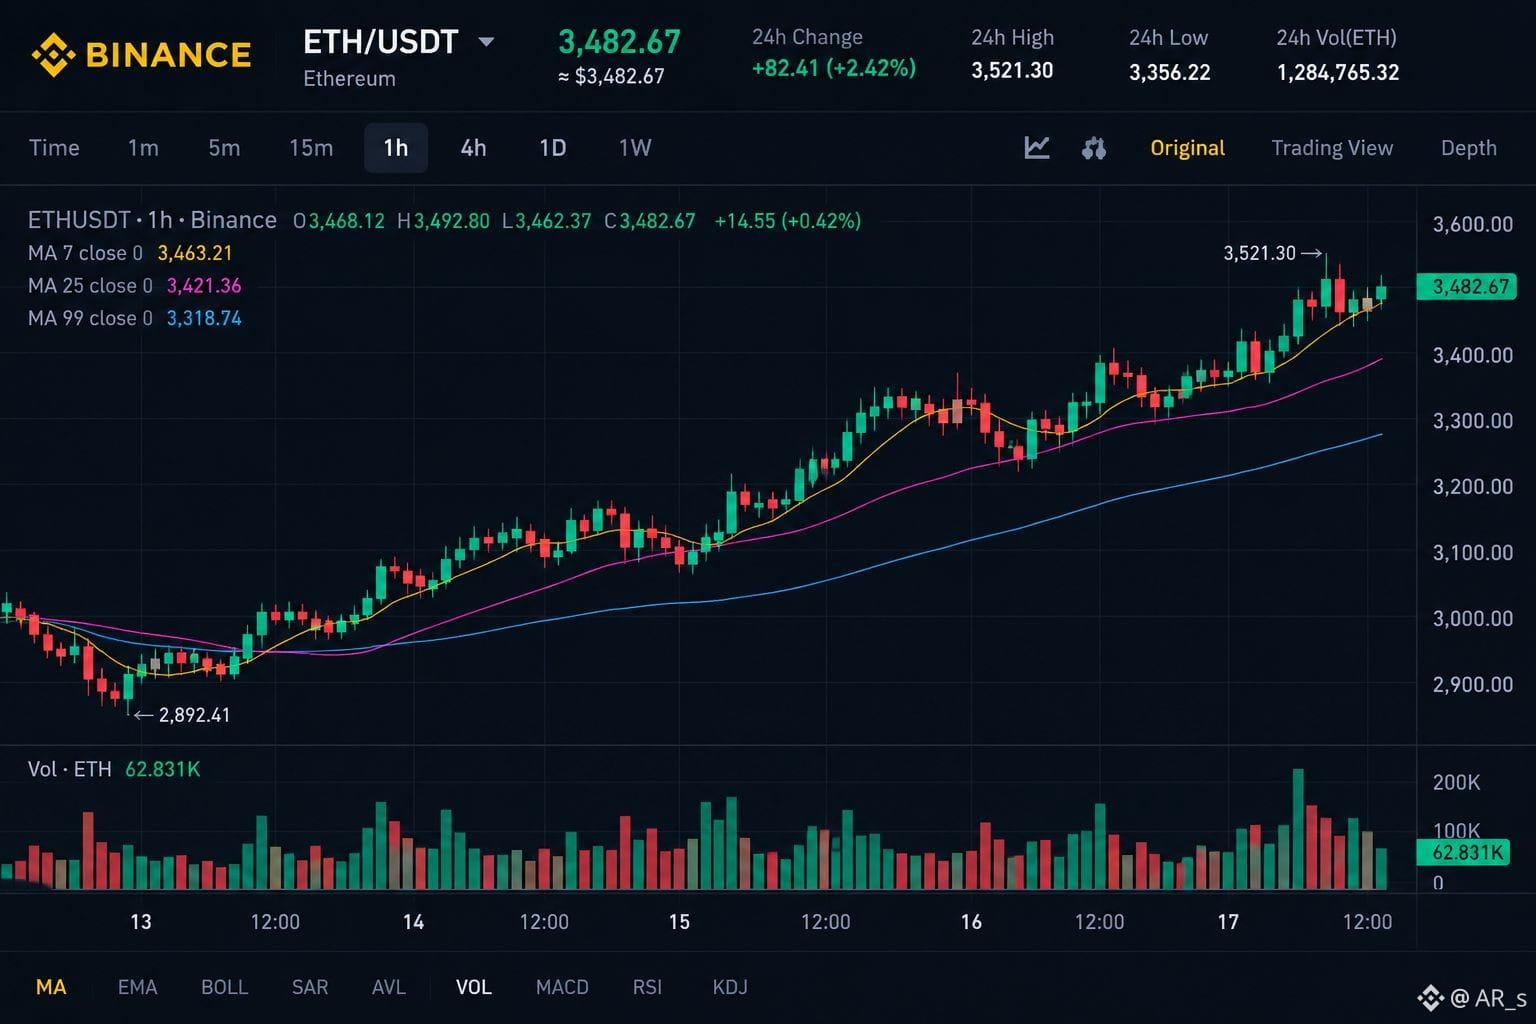
A candlestick chart is more than red and green candles-it's a visual record of market psychology. Higher highs and higher lows can suggest bullish momentum, while volume helps show how strong that move may be-
Before entering any trade, ask yourself:
Where is the support? Where is the resistance?- How much am I willing to risk?-
Successful traders don't predict the market-they prepare for different outcomes. Build a strategy, follow it consistently, and let discipline guide your decisions-
What's your view on ETH next-bullish bearish? Share your thoughts below! or-
#ETH
#Binance
#cryptotrading
#TechnicalAnalysis
#BinanceSquareBTC
#Blockchain
#InvestSmart
A candlestick chart is more than red and green candles-it's a visual record of market psychology. Higher highs and higher lows can suggest bullish momentum, while volume helps show how strong that move may be-
Before entering any trade, ask yourself:
Where is the support? Where is the resistance?- How much am I willing to risk?-
Successful traders don't predict the market-they prepare for different outcomes. Build a strategy, follow it consistently, and let discipline guide your decisions-
What's your view on ETH next-bullish bearish? Share your thoughts below! or-
#ETH
#Binance
#cryptotrading
#TechnicalAnalysis
#BinanceSquareBTC
#Blockchain
#InvestSmart