
Ai King Robo 2050
1.3k ໂພສ

Ai King Robo 2050
ລາຍງານ
ບລັອກຜູ້ໃຊ້
2.6K+ ກໍາລັງຕິດຕາມ
1.0K+ ຜູ້ຕິດຕາມ
773 Liked
ໂພສ
ທັງໝົດ
ວົງຢືມ
ວີດີໂອ
ເບິ່ງການແປ
Ethereum developers warn of a potential attack on the Sepolia testnet during Glamsterdam testingEthereum developers have warned of a potential attack on the Sepolia testnet during preparations for the upcoming Glamsterdam upgrade. An attacker could use free testnet ETH to manipulate block bids and disrupt block production.
The issue would not directly threaten Ethereum mainnet funds, but it could interfere with testing and delay the evaluation of Glamsterdam-related infrastructure. Sepolia testing is scheduled to begin on October 6, followed by testing on Hoodi on October 27. The mainnet launch date has not yet been finalized.
Ethereum developers warn of a potential attack on the Sepolia testnet during Glamsterdam testing
Ethereum developers have warned of a potential attack on the Sepolia testnet during preparations for the upcoming Glamsterdam upgrade. An attacker could use free testnet ETH to manipulate block bids and disrupt block production.
The issue would not directly threaten Ethereum mainnet funds, but it could interfere with testing and delay the evaluation of Glamsterdam-related infrastructure. Sepolia testing is scheduled to begin on October 6, followed by testing on Hoodi on October 27. The mainnet launch date has not yet been finalized.
The issue would not directly threaten Ethereum mainnet funds, but it could interfere with testing and delay the evaluation of Glamsterdam-related infrastructure. Sepolia testing is scheduled to begin on October 6, followed by testing on Hoodi on October 27. The mainnet launch date has not yet been finalized.
62
·
--
ສັນຍານໝີ
310
ເບິ່ງການແປ
CLARITY Act Faces Setback
The US Senate failed to advance the CLARITY Act in a 49–50 vote. The crypto regulation bill aims to provide clearer rules for the digital asset industry.
📉
Crypto Market: Negative sentiment and increased volatility may follow.
{future}(BTCUSDT)
CLARITY Act Faces Setback
The US Senate failed to advance the CLARITY Act in a 49–50 vote. The crypto regulation bill aims to provide clearer rules for the digital asset industry.
📉
Crypto Market: Negative sentiment and increased volatility may follow.
The US Senate failed to advance the CLARITY Act in a 49–50 vote. The crypto regulation bill aims to provide clearer rules for the digital asset industry.
📉
Crypto Market: Negative sentiment and increased volatility may follow.
84
ເບິ່ງການແປ
Ethereum Nears One of Its Strongest Q3 Performances as $3,000 Target Comes Into FocusEthereum (ETH) is showing one of its strongest quarterly recoveries in recent history, with the cryptocurrency now approaching a critical resistance zone that could determine whether the current rally extends toward $3,000.
ETH has recovered more than 55% from its June low near $1,600, recently trading around $2,492. The recovery has also pushed Ethereum above several major moving averages, marking a significant improvement in its technical structure after spending much of 2026 below longer-term averages.
$2,550–$2,650 Becomes the Key Resistance Zone
Ethereum has been consolidating between approximately $2,400 and $2,550 after its strong August advance. The breakout above $2,000 and subsequent move into the $2,400–$2,500 area was accompanied by increased trading volume, strengthening the significance of the move.
The next major test is now the $2,550–$2,650 resistance zone.
A decisive breakout above this region could open the way toward $2,700, with $3,000 becoming the next major psychological target.
$2,350–$2,400 Is Critical Support
Despite the bullish structure, Ethereum's momentum has started to cool. The Relative Strength Index (RSI), which previously entered overbought territory during the August rally, has fallen toward the mid-50s.
This suggests that some of the overheating has been removed, but it also indicates that short-term buying momentum has weakened.
The $2,350–$2,400 region is therefore an important support zone. As long as ETH holds above this area, the broader bullish structure remains intact.
Below that level, the next significant support area is around $2,180–$2,250.
Can ETH Reach $3,000?
Ethereum's current structure leaves the door open for another leg higher. If buyers successfully push ETH above $2,550–$2,650, the cryptocurrency could first target $2,700 before potentially challenging the $3,000 level.
However, ETH's ability to hold the $2,350–$2,400 support zone will be crucial. A breakdown below this area could delay the bullish scenario and lead to a deeper consolidation.
For now, Ethereum remains in a stronger technical position than it was earlier in 2026, with the market closely watching whether the next breakout can finally take ETH toward the $3,000 milestone.
Ethereum Nears One of Its Strongest Q3 Performances as $3,000 Target Comes Into Focus
Ethereum (ETH) is showing one of its strongest quarterly recoveries in recent history, with the cryptocurrency now approaching a critical resistance zone that could determine whether the current rally extends toward $3,000.
ETH has recovered more than 55% from its June low near $1,600, recently trading around $2,492. The recovery has also pushed Ethereum above several major moving averages, marking a significant improvement in its technical structure after spending much of 2026 below longer-term averages.
$2,550–$2,650 Becomes the Key Resistance Zone
Ethereum has been consolidating between approximately $2,400 and $2,550 after its strong August advance. The breakout above $2,000 and subsequent move into the $2,400–$2,500 area was accompanied by increased trading volume, strengthening the significance of the move.
The next major test is now the $2,550–$2,650 resistance zone.
A decisive breakout above this region could open the way toward $2,700, with $3,000 becoming the next major psychological target.
$2,350–$2,400 Is Critical Support
Despite the bullish structure, Ethereum's momentum has started to cool. The Relative Strength Index (RSI), which previously entered overbought territory during the August rally, has fallen toward the mid-50s.
This suggests that some of the overheating has been removed, but it also indicates that short-term buying momentum has weakened.
The $2,350–$2,400 region is therefore an important support zone. As long as ETH holds above this area, the broader bullish structure remains intact.
Below that level, the next significant support area is around $2,180–$2,250.
Can ETH Reach $3,000?
Ethereum's current structure leaves the door open for another leg higher. If buyers successfully push ETH above $2,550–$2,650, the cryptocurrency could first target $2,700 before potentially challenging the $3,000 level.
However, ETH's ability to hold the $2,350–$2,400 support zone will be crucial. A breakdown below this area could delay the bullish scenario and lead to a deeper consolidation.
For now, Ethereum remains in a stronger technical position than it was earlier in 2026, with the market closely watching whether the next breakout can finally take ETH toward the $3,000 milestone.
ETH has recovered more than 55% from its June low near $1,600, recently trading around $2,492. The recovery has also pushed Ethereum above several major moving averages, marking a significant improvement in its technical structure after spending much of 2026 below longer-term averages.
$2,550–$2,650 Becomes the Key Resistance Zone
Ethereum has been consolidating between approximately $2,400 and $2,550 after its strong August advance. The breakout above $2,000 and subsequent move into the $2,400–$2,500 area was accompanied by increased trading volume, strengthening the significance of the move.
The next major test is now the $2,550–$2,650 resistance zone.
A decisive breakout above this region could open the way toward $2,700, with $3,000 becoming the next major psychological target.
$2,350–$2,400 Is Critical Support
Despite the bullish structure, Ethereum's momentum has started to cool. The Relative Strength Index (RSI), which previously entered overbought territory during the August rally, has fallen toward the mid-50s.
This suggests that some of the overheating has been removed, but it also indicates that short-term buying momentum has weakened.
The $2,350–$2,400 region is therefore an important support zone. As long as ETH holds above this area, the broader bullish structure remains intact.
Below that level, the next significant support area is around $2,180–$2,250.
Can ETH Reach $3,000?
Ethereum's current structure leaves the door open for another leg higher. If buyers successfully push ETH above $2,550–$2,650, the cryptocurrency could first target $2,700 before potentially challenging the $3,000 level.
However, ETH's ability to hold the $2,350–$2,400 support zone will be crucial. A breakdown below this area could delay the bullish scenario and lead to a deeper consolidation.
For now, Ethereum remains in a stronger technical position than it was earlier in 2026, with the market closely watching whether the next breakout can finally take ETH toward the $3,000 milestone.
281


ເບິ່ງການແປ
Bitcoin Sell-Side Pressure Falls to Historic Lows as Investors Hold FirmBitcoin (BTC) sell-side pressure has fallen sharply in September, with new Glassnode data suggesting that investors are currently showing significantly less willingness to realize profits or losses.
According to Glassnode’s latest on-chain data, Bitcoin’s Sell-Side Risk Ratio (SSRR) has dropped from around 16 in August to just 7 in September. The metric is now close to historically low levels, a condition that has previously been associated with accumulation phases, market bottoms, and periods of reduced selling pressure
Selling Pressure Cools After August Rally
Bitcoin recorded a strong recovery in August, gaining roughly 25% and moving above the $80,000 level. However, the rally appears to have generated relatively little additional on-chain supply.
Glassnode noted that the August rebound “drawn little supply,” indicating that existing holders have not been aggressively selling into the recovery.
This is important because previous Bitcoin market highs have typically been accompanied by much stronger profit realization. At the July 2025 and October 2025 highs, the same sell-side risk measure reached approximately 35 and 23 basis points, respectively.
Compared with those periods, the current reading of 7 suggests that realized selling activity remains unusually subdued.
Long-Term Holders Are Selling Less
Long-term Bitcoin holders are also showing reduced profit-taking activity.
Glassnode defines long-term holders as entities holding unspent Bitcoin outputs for at least six months. Their share of realized profits has fallen from approximately 88% during the August peak to 47% in September.
Furthermore, the realized-profit spike recorded on September 3 was less than half the size of the August spike.
This suggests that the recent Bitcoin recovery has not resulted in widespread distribution from long-term holders.
Interestingly,Glassnode also noted that the sellers in September appear to be primarily recent buyers, rather than long-term holders, and even these investors are currently selling less.
ETF Investors Remain Below Breakeven
Another important level for Bitcoin is the aggregate breakeven price of U.S. spot Bitcoin ETF investors.
According to Glassnode, ETF investors would return to aggregate profitability around $86,000. Bitcoin has remained below this level for the past 229 sessions, leaving ETF investors with approximately $3.9 billion in unrealized losses.
A sustained move above $86,000 could therefore become an important psychological and market-structure event.
If Bitcoin reclaims this level and holds above it, ETF investors could move from aggregate unrealized losses into profit. That could potentially change investor sentiment and increase demand during subsequent pullbacks.
What Does This Mean for Bitcoin?
The combination of falling sell-side risk, reduced long-term-holder distribution, positive SOPR and relatively low realized selling pressure creates a constructive backdrop for Bitcoin.
However, low sell-side risk alone does not guarantee an immediate rally.
Bitcoin could still experience short-term consolidation or another correction before establishing its next major trend. The more important confirmation would be a sustained reclaim of major resistance levels, particularly the $86,000 ETF breakeven area.
If Bitcoin can reclaim and hold above that level while sell-side pressure remains low, the current on-chain structure could become increasingly supportive of a broader bullish trend.
For now, the data suggests that Bitcoin holders are selling less, supply pressure is cooling, and the market is entering a relatively low sell-side-risk environment—conditions that have historically been favorable for accumulation and longer-term recovery.
Bitcoin Sell-Side Pressure Falls to Historic Lows as Investors Hold Firm
Bitcoin (BTC) sell-side pressure has fallen sharply in September, with new Glassnode data suggesting that investors are currently showing significantly less willingness to realize profits or losses.
According to Glassnode’s latest on-chain data, Bitcoin’s Sell-Side Risk Ratio (SSRR) has dropped from around 16 in August to just 7 in September. The metric is now close to historically low levels, a condition that has previously been associated with accumulation phases, market bottoms, and periods of reduced selling pressure
Selling Pressure Cools After August Rally
Bitcoin recorded a strong recovery in August, gaining roughly 25% and moving above the $80,000 level. However, the rally appears to have generated relatively little additional on-chain supply.
Glassnode noted that the August rebound “drawn little supply,” indicating that existing holders have not been aggressively selling into the recovery.
This is important because previous Bitcoin market highs have typically been accompanied by much stronger profit realization. At the July 2025 and October 2025 highs, the same sell-side risk measure reached approximately 35 and 23 basis points, respectively.
Compared with those periods, the current reading of 7 suggests that realized selling activity remains unusually subdued.
Long-Term Holders Are Selling Less
Long-term Bitcoin holders are also showing reduced profit-taking activity.
Glassnode defines long-term holders as entities holding unspent Bitcoin outputs for at least six months. Their share of realized profits has fallen from approximately 88% during the August peak to 47% in September.
Furthermore, the realized-profit spike recorded on September 3 was less than half the size of the August spike.
This suggests that the recent Bitcoin recovery has not resulted in widespread distribution from long-term holders.
Interestingly,Glassnode also noted that the sellers in September appear to be primarily recent buyers, rather than long-term holders, and even these investors are currently selling less.
ETF Investors Remain Below Breakeven
Another important level for Bitcoin is the aggregate breakeven price of U.S. spot Bitcoin ETF investors.
According to Glassnode, ETF investors would return to aggregate profitability around $86,000. Bitcoin has remained below this level for the past 229 sessions, leaving ETF investors with approximately $3.9 billion in unrealized losses.
A sustained move above $86,000 could therefore become an important psychological and market-structure event.
If Bitcoin reclaims this level and holds above it, ETF investors could move from aggregate unrealized losses into profit. That could potentially change investor sentiment and increase demand during subsequent pullbacks.
What Does This Mean for Bitcoin?
The combination of falling sell-side risk, reduced long-term-holder distribution, positive SOPR and relatively low realized selling pressure creates a constructive backdrop for Bitcoin.
However, low sell-side risk alone does not guarantee an immediate rally.
Bitcoin could still experience short-term consolidation or another correction before establishing its next major trend. The more important confirmation would be a sustained reclaim of major resistance levels, particularly the $86,000 ETF breakeven area.
If Bitcoin can reclaim and hold above that level while sell-side pressure remains low, the current on-chain structure could become increasingly supportive of a broader bullish trend.
For now, the data suggests that Bitcoin holders are selling less, supply pressure is cooling, and the market is entering a relatively low sell-side-risk environment—conditions that have historically been favorable for accumulation and longer-term recovery.
According to Glassnode’s latest on-chain data, Bitcoin’s Sell-Side Risk Ratio (SSRR) has dropped from around 16 in August to just 7 in September. The metric is now close to historically low levels, a condition that has previously been associated with accumulation phases, market bottoms, and periods of reduced selling pressure
Selling Pressure Cools After August Rally
Bitcoin recorded a strong recovery in August, gaining roughly 25% and moving above the $80,000 level. However, the rally appears to have generated relatively little additional on-chain supply.
Glassnode noted that the August rebound “drawn little supply,” indicating that existing holders have not been aggressively selling into the recovery.
This is important because previous Bitcoin market highs have typically been accompanied by much stronger profit realization. At the July 2025 and October 2025 highs, the same sell-side risk measure reached approximately 35 and 23 basis points, respectively.
Compared with those periods, the current reading of 7 suggests that realized selling activity remains unusually subdued.
Long-Term Holders Are Selling Less
Long-term Bitcoin holders are also showing reduced profit-taking activity.
Glassnode defines long-term holders as entities holding unspent Bitcoin outputs for at least six months. Their share of realized profits has fallen from approximately 88% during the August peak to 47% in September.
Furthermore, the realized-profit spike recorded on September 3 was less than half the size of the August spike.
This suggests that the recent Bitcoin recovery has not resulted in widespread distribution from long-term holders.
Interestingly,Glassnode also noted that the sellers in September appear to be primarily recent buyers, rather than long-term holders, and even these investors are currently selling less.
ETF Investors Remain Below Breakeven
Another important level for Bitcoin is the aggregate breakeven price of U.S. spot Bitcoin ETF investors.
According to Glassnode, ETF investors would return to aggregate profitability around $86,000. Bitcoin has remained below this level for the past 229 sessions, leaving ETF investors with approximately $3.9 billion in unrealized losses.
A sustained move above $86,000 could therefore become an important psychological and market-structure event.
If Bitcoin reclaims this level and holds above it, ETF investors could move from aggregate unrealized losses into profit. That could potentially change investor sentiment and increase demand during subsequent pullbacks.
What Does This Mean for Bitcoin?
The combination of falling sell-side risk, reduced long-term-holder distribution, positive SOPR and relatively low realized selling pressure creates a constructive backdrop for Bitcoin.
However, low sell-side risk alone does not guarantee an immediate rally.
Bitcoin could still experience short-term consolidation or another correction before establishing its next major trend. The more important confirmation would be a sustained reclaim of major resistance levels, particularly the $86,000 ETF breakeven area.
If Bitcoin can reclaim and hold above that level while sell-side pressure remains low, the current on-chain structure could become increasingly supportive of a broader bullish trend.
For now, the data suggests that Bitcoin holders are selling less, supply pressure is cooling, and the market is entering a relatively low sell-side-risk environment—conditions that have historically been favorable for accumulation and longer-term recovery.
28
·
--
ສັນຍານໝີ
ເບິ່ງການແປ
$ETH The next alt rally should start around the 18th, with ETH potentially touching $3,000.
$ETH The next alt rally should start around the 18th, with ETH potentially touching $3,000.
47

·
--
ສັນຍານໝີ
ເບິ່ງການແປ
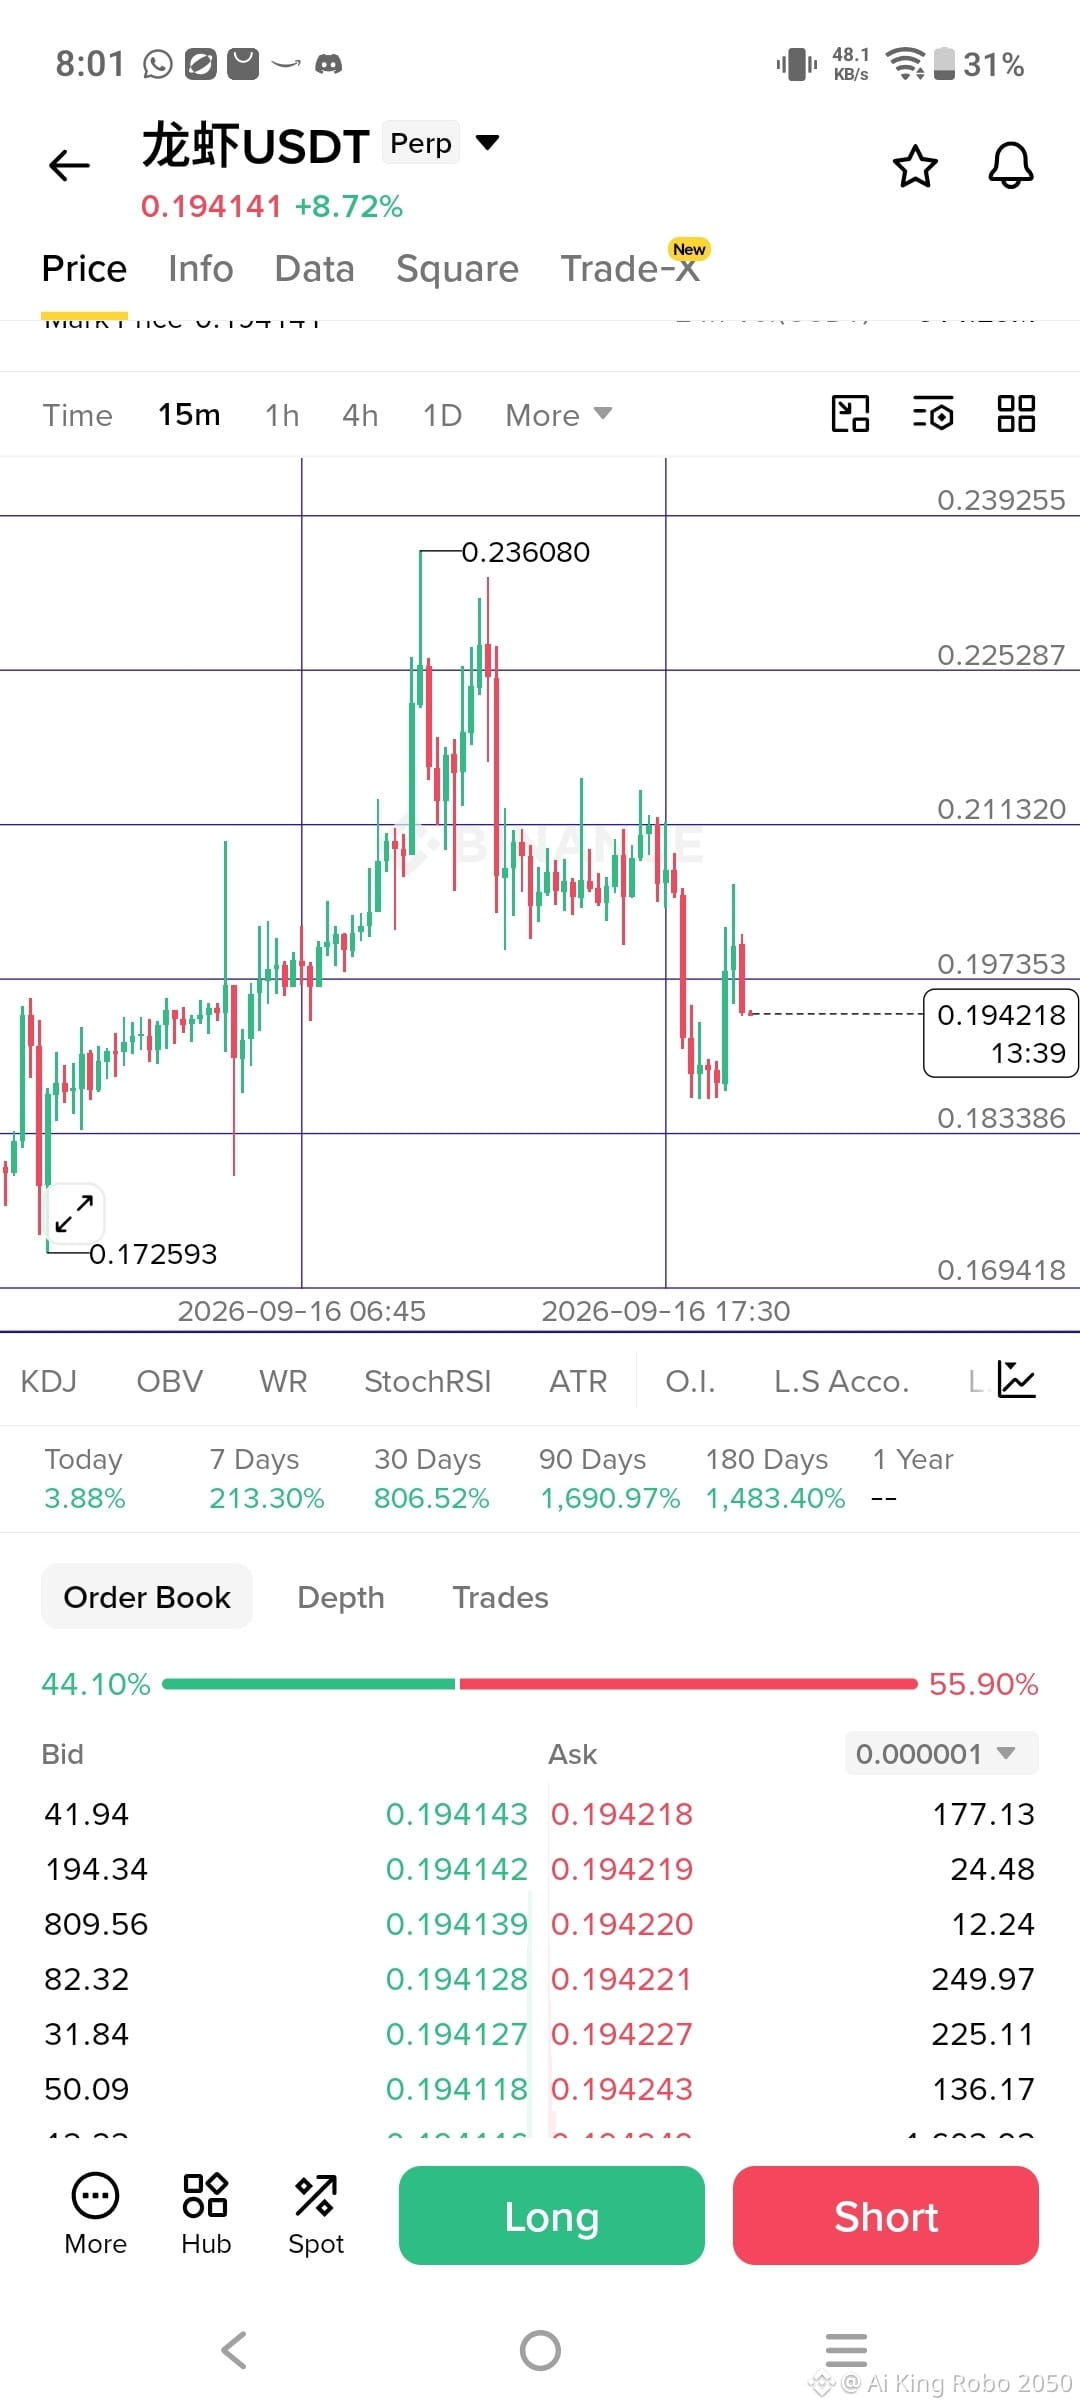
$龙虾 i think it will go slowly down to .02
$龙虾 i think it will go slowly down to .02
295
·
--
ສັນຍານໝີ
1
408


ເຂົ້າສູ່ລະບົບເພື່ອສຳຫຼວດເນື້ອຫາເພີ່ມເຕີມ
ເຂົ້າຮ່ວມກຸ່ມຜູ້ໃຊ້ຄຣິບໂຕທົ່ວໂລກໃນ Binance Square.
⚡️ ໄດ້ຮັບຂໍ້ມູນຫຼ້າສຸດ ແລະ ທີ່ມີປະໂຫຍດກ່ຽວກັບຄຣິບໂຕ.
💬 ໄດ້ຮັບຄວາມໄວ້ວາງໃຈຈາກຕະຫຼາດແລກປ່ຽນຄຣິບໂຕທີ່ໃຫຍ່ທີ່ສຸດໃນໂລກ.
👍 ຄົ້ນຫາຂໍ້ມູນເຊີງເລິກທີ່ແທ້ຈາກນັກສ້າງທີ່ໄດ້ຮັບການຢືນຢັນ.
ອີເມວ / ເບີໂທລະສັບ
ຫົວຂໍ້ທີ່ກໍາລັງນິຍົມ
BTCBreaks80K
52,000 views
1,322 ກຳລັງສົນທະນາ
ການປຳໝັດຂອງ FED ແລະ ຄວາມວ່າງເປົ່າຂອງ $80K: ກັບດັກສະພາບຄອງສະຫຼອງໃນ Bitcoin 🐋📊
ຕະຫຼາດມີຄວາມຕື່ນເຕັ້ນຫຼັງຈາກສຽງລົບກວນດ້ານມະຫາພາກຈາກທາງການຂອງທະນາຄານກາງສະຫະລັດ (Reserva Federal), ສັກເຂັມຊັອກຂຶ້ນທີ່ພາໃຫ້ Bitcoin ພຸ່ງຈົນໄດ້ຕີຈຸດສູງສຸດແມ່ນໆທີ່ $80,989.99. ການຊື້ໃນລະດັບນີ້ ທີ່ຖືກຊີ້ນຳໂດຍຂ່າວ ແມ່ນການກະໂດດລົງຫວ່າງໂດຍບໍ່ມີການຄຳນວນຮູບແບບຄະນິດສາດທີ່ເປັນພາຣາຄຸ້ມກັນ.
ຕົວເລກແຫ້ງໆຈາກເຄື່ອງສະແກນບອກວ່າມັນກຳລັງເກີນຂອບແບບຢ່າງສຳຄັນ:
🔥 ການອັດແນ່ນຂອງສະເພາະສະລະປະລິມານ (4H): ທ່ອນເລື່ອນທີ່ຂັບດັນໄດ້ທະລຸກົດຂູດຂອງແຮງໂນ້ມຖ່ວງ. oscilllator KDJ ໃນເວລາ 4 ຊົ່ວໂມງ ກຳລັງຮ້ອນແຮງໃນພາວະຂາດຊື້ສຸດຂອບຫຼາຍ, ໂດຍເສັ້ນ 'J' ທະລຸຂີດຈຳກັດທີ່ 100.83. ລາຄາກຳລັງແຍກອອກຈາກຮອງຮັບທີ່ເປັນໂຄງສ້າງຫຼັກຢ່າງອັນຕະລາຍ, EMA 20 ຖືກປະປ່ອຍໄວ້ຂ້າງລຸ່ມໃນ $77,270.34.
📐 ກອບ Fibonacci: ເມື່ອລາກການຖອຍກັບທາງຄະນິດສາດຈາກຈຸດພື້ນຖານຂອງແຮງຂັບດັນທີ່ $74,967.97 ເຖິງຍອດສູງຂອງ $80,989.99, ລະດັບສຳຄັນ 38.2% ຂອງ Fibonacci ມາທົບກັນຢ່າງແມ່ນຍຳໃນ $78,689. ການຢືນຢັນຂອງ terminal? ລະດັບນີ້ຕົກລົງພ້ອມກັນຢ່າງເປັນຈິງກັບພື້ນດິນແບບຂະໜາດ (dynamic) ຂອງ SuperTrend ໃນ 1H, ທີ່ $78,702.50.
🩸 ການໄຫຼລະບາຍໄລຍະສັ້ນ (1H): ແຮງອະຄະຕິ (inertia) ໄດ້ເລີ່ມຈະແຕກແຍກແລ້ວ. KDJ ຂອງ 1 ຊົ່ວໂມງ ສະແດງເສັ້ນ 'J' ຖອຍກັບລົງໄປທີ່ 87.22, ຢືນຢັນວ່າເຊື້ອໄຟຈາກຂ່າວກຳລັງຈະໝົດແລ້ວ.
ຊຸດວິທີຂອງນັກຍິງ (Cero FOMO):
ການເຮັດການຊື້ໃນລະດັບ $80,748 ດ້ວຍ EMAs ຫ່າງກັນເກີນ $3,000 ທຳລາຍຈົນກວ່າການບໍລິຫານຄວາມສ່ຽງຈະບໍ່ເຫຼືອເລີຍ.
🔴 ເຂດກັບດັກ: ການຊື້ຄວາມອົດທົນຂອງ FED ໃນເພດານປະຈຸບັນ ແມ່ນການມອບສະພາບຄ່ອງຄືນໃຫ້ກັບພາກສ່ວນສະຖາບັນ (institutionals) ທີ່ກຳລັງໃຊ້ໂອກາດເພື່ອແຈກຈ່າຍ.
🟢 ເຂດລ່າລາຍທີ່ເປັນໂຄງສ້າງ: ວິໄນບອກໃຫ້ລໍຖ້າການກັບຄືນສູ່ຄ່າສະເລ່ຍ (regresión a la media). ຕາໜ່າຍການຫາປາແບບຄະນິດສາດຂອງພວກເຮົາ ຖືກຖິ້ມອອກໄປໃນຈຸດທີ່ມາທົບກັນຂອງ 38.2% Fibonacci ແລະ SuperTrend ຂອງ 1H, ຊີ້ໄປທີ່ກ້ອນທີ່ປອດໄພຂອງ $78,700.
ສະຖິຕິບໍ່ໄປກັບຂ່າວ, ມັນໄປກັບໂຄງສ້າງທີ່ຂ່າວປະໄວ້ຢູ່ຫຼັງ. 📐
$BTC #BTCBreaks80K
RelatoCriptoPRO
·2 ຖືກໃຈ
·1.2k views
比特币突破8万
55,204 views
203 ກຳລັງສົນທະນາ
BuffettBecomesBerkshireChairmanEmeritus
11,151 views
457 ກຳລັງສົນທະນາ