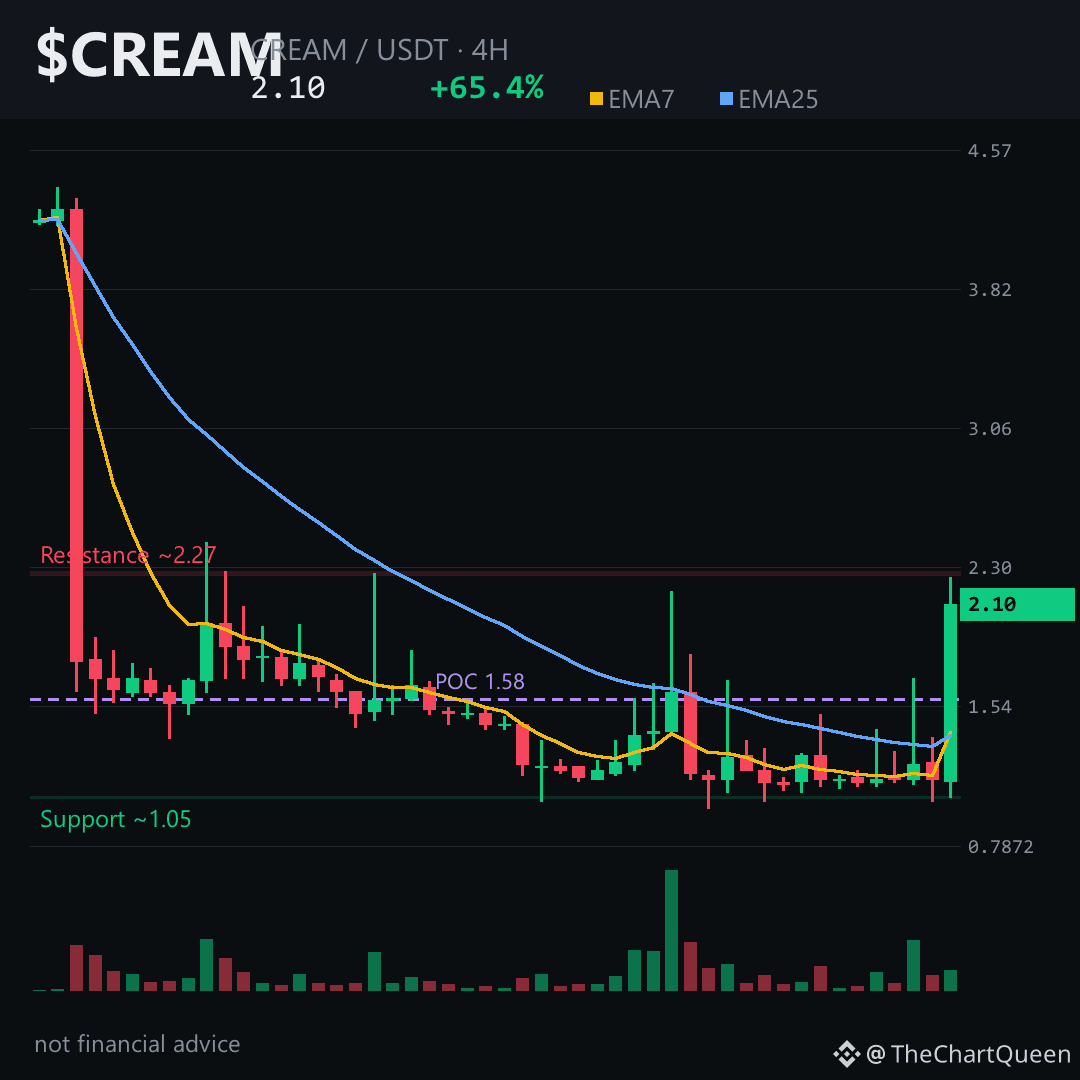
$CREAM just printed an 84% candle — the kind of move that makes you wonder if you’re early or already late. The chart answers that, but only if you know which timeframe to trust.
Zoom out and the story changes fast. The daily and weekly trends are still pointing down, with price trading far below its longer moving averages — think of those as gravity wells. The 4-hour chart, though, just flipped bullish: shorter-term momentum is curling up, and buyers stepped in hard after that violent dip to the low 1.20s.
That’s the tension. A bounce inside a bigger downtrend often runs out of fuel near the first serious shelf of overhead supply. For $CREAM, that shelf sits around the 2.28 zone — a natural magnet if the bounce has legs. The line in the sand is near 1.99. Lose that on a 4-hour close and the bounce narrative quietly dies.
My read: the 4-hour momentum is real but fragile, and the reward-to-risk leans cautious until price proves it can hold above the 2.00 area. Tap $CREAM to pull up the chart and see whether that 84% candle is building a floor or just filling a gap.
Follow for the level-by-level breakdown when this bounce either confirms or fades — I’ll map it as it happens. What’s the one level you’re watching on CREAM right now 👇
⚠️ Not financial advice. DYOR.
#CREAM #CreamFinance #Crypto #BinanceSquare
Zoom out and the story changes fast. The daily and weekly trends are still pointing down, with price trading far below its longer moving averages — think of those as gravity wells. The 4-hour chart, though, just flipped bullish: shorter-term momentum is curling up, and buyers stepped in hard after that violent dip to the low 1.20s.
That’s the tension. A bounce inside a bigger downtrend often runs out of fuel near the first serious shelf of overhead supply. For $CREAM, that shelf sits around the 2.28 zone — a natural magnet if the bounce has legs. The line in the sand is near 1.99. Lose that on a 4-hour close and the bounce narrative quietly dies.
My read: the 4-hour momentum is real but fragile, and the reward-to-risk leans cautious until price proves it can hold above the 2.00 area. Tap $CREAM to pull up the chart and see whether that 84% candle is building a floor or just filling a gap.
Follow for the level-by-level breakdown when this bounce either confirms or fades — I’ll map it as it happens. What’s the one level you’re watching on CREAM right now 👇
⚠️ Not financial advice. DYOR.
#CREAM #CreamFinance #Crypto #BinanceSquare