

#wavetheory
wavetheory
6,265 ຄັ້ງທີ່ເບິ່ງ
25 ກຳລັງສົນທະນາ
ມາແຮງ
ຫຼ້າສຸດ

📉 $XRP CRACKED KEY SUPPORT BEFORE THE HEADLINES EVEN BROKE ⚡
Entry: 1.10 ⚡
Stop Loss: 0.98 ⚠️
📌 The chart structure was flashing exhaustion long before external catalysts surfaced. $XRP had been leaning into its lower boundary repeatedly since late October, draining buy-side bids and setting up a textbook Wave 2 correction. 🌊
💡 Smart money understands that negative headlines rarely birth the trend; they merely accelerate an order block already primed to fold. The immediate battleground rests at 1.10 support, with structural invalidation sitting cleanly below 0.98. 📊 💬 Are you positioning for a defensive reclaim at 1.10 or waiting for one final liquidity sweep below 0.98? 👇
⚠️ Not financial advice. Always manage your risk. 🛡️
🏷️ #XRP #CryptoAnalysis #TechnicalAnalysis #WaveTheory
🎯 🦈
1
11

·
--
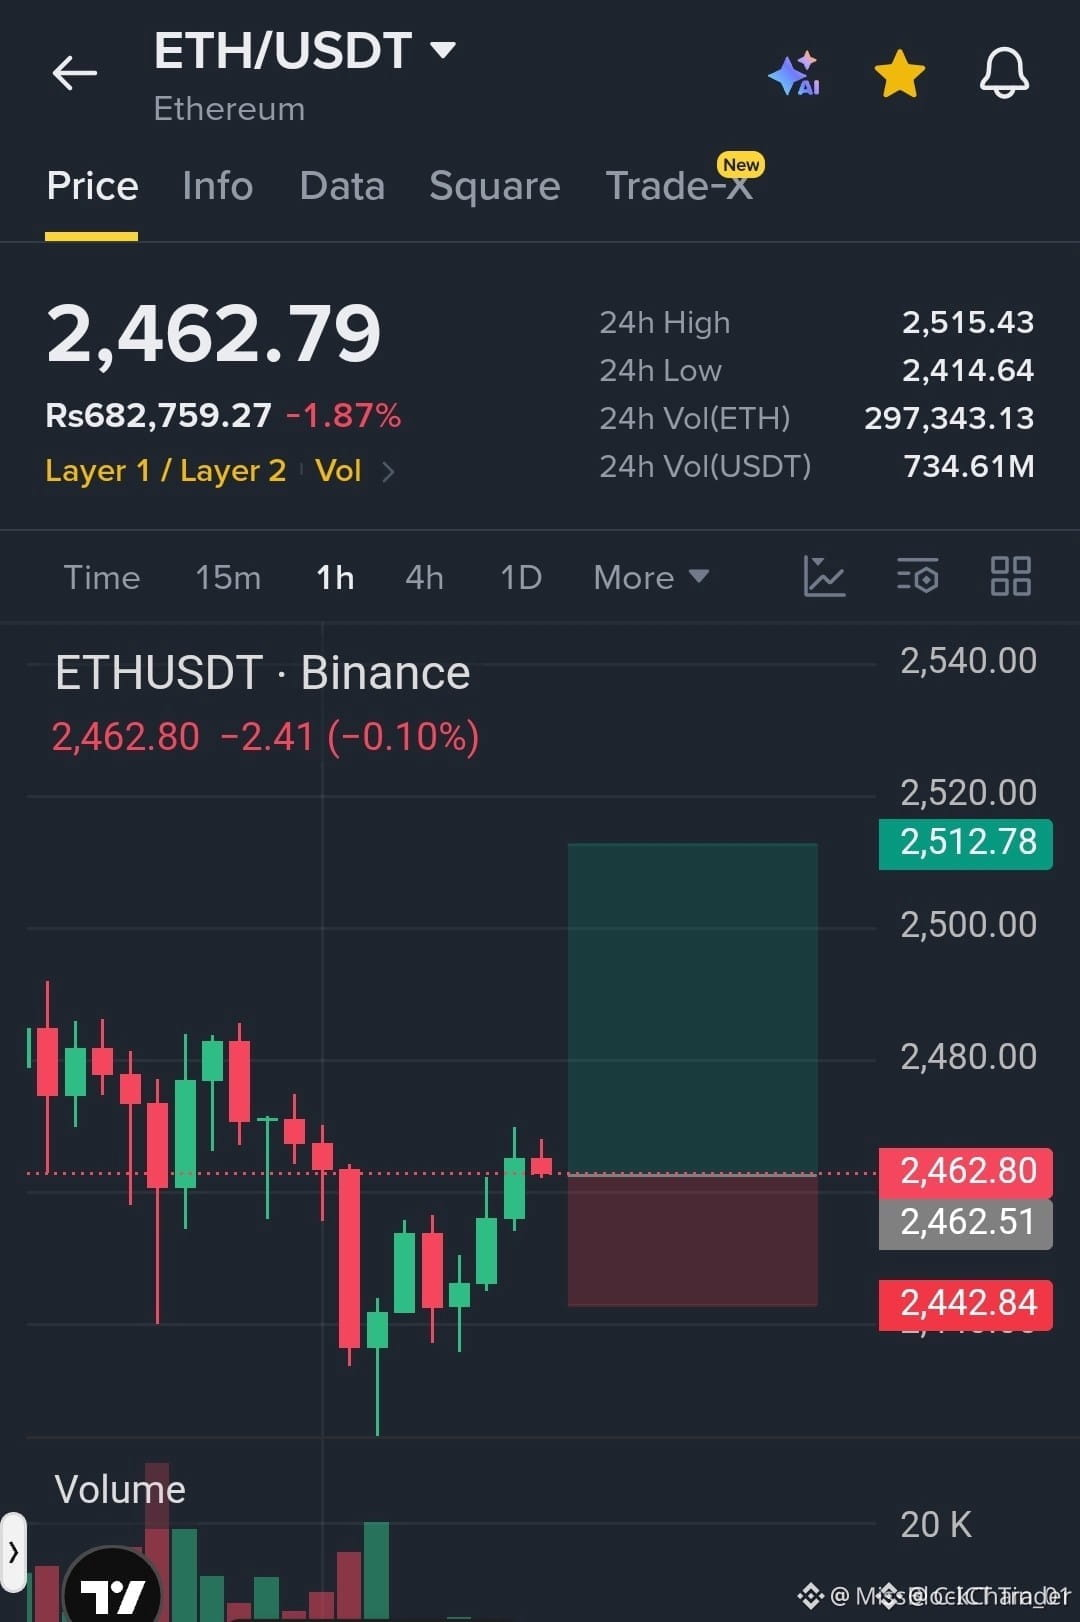
🚨 $ETH WAVE 4 RETEST OFFERS HIGH-CONVICTION LIQUIDITY RECLAIM BEFORE WAVE 5 EXPANSION 🎯
Entry: 2,450 – 2,480 ⚡
Target: 2,520 – 2,600 🚀
Stop Loss: 2,400 ⚠️
$ETH has cleanly defended the $2,400 structural demand pool, signaling institutional absorption after a textbook Wave 3 impulse. Smart money is defending this key discount zone, laying the foundation for a potential Wave 5 expansion phase. 📊
As long as price consolidates above the $2,450 demand block, structural flow points toward inefficiency fills up to $2,600. A clean hourly close below $2,400 invalidates the bullish setup entirely. 💡
Are you accumulating inside this Wave 4 order block, or waiting for a clean break above $2,520 to confirm velocity? 👇
⚠️ Not financial advice. Always manage your risk. 🛡️
🏷️ #ETH #Ethereum #TradeSetup #Crypto #WaveTheory
🎯 🦈
1
39

$BTC 'S FINAL MAJOR DROP? ANALYST POINTS TO $43K BOTTOM 📉
Liquid Capital founder Li Huayi identifies Bitcoin's third wave of decline since 1011, calling it possibly the final major drop based on wave theory and cyclical patterns. Projections from a $126K peak suggest a 60% drop to $51K or 66% drop to $43K.
The analyst notes July and August as the best window to buy the dip, citing U.S. stock risk and missing black swan events. This is the most worthwhile opportunity in three years if the bottom holds. Are you positioning for a Q3 bottom or waiting for confirmation?
Not financial advice. Always manage your risk.
#BTC #CryptoAnalysis #MarketCycle #BuyTheDip #WaveTheory
💎
33


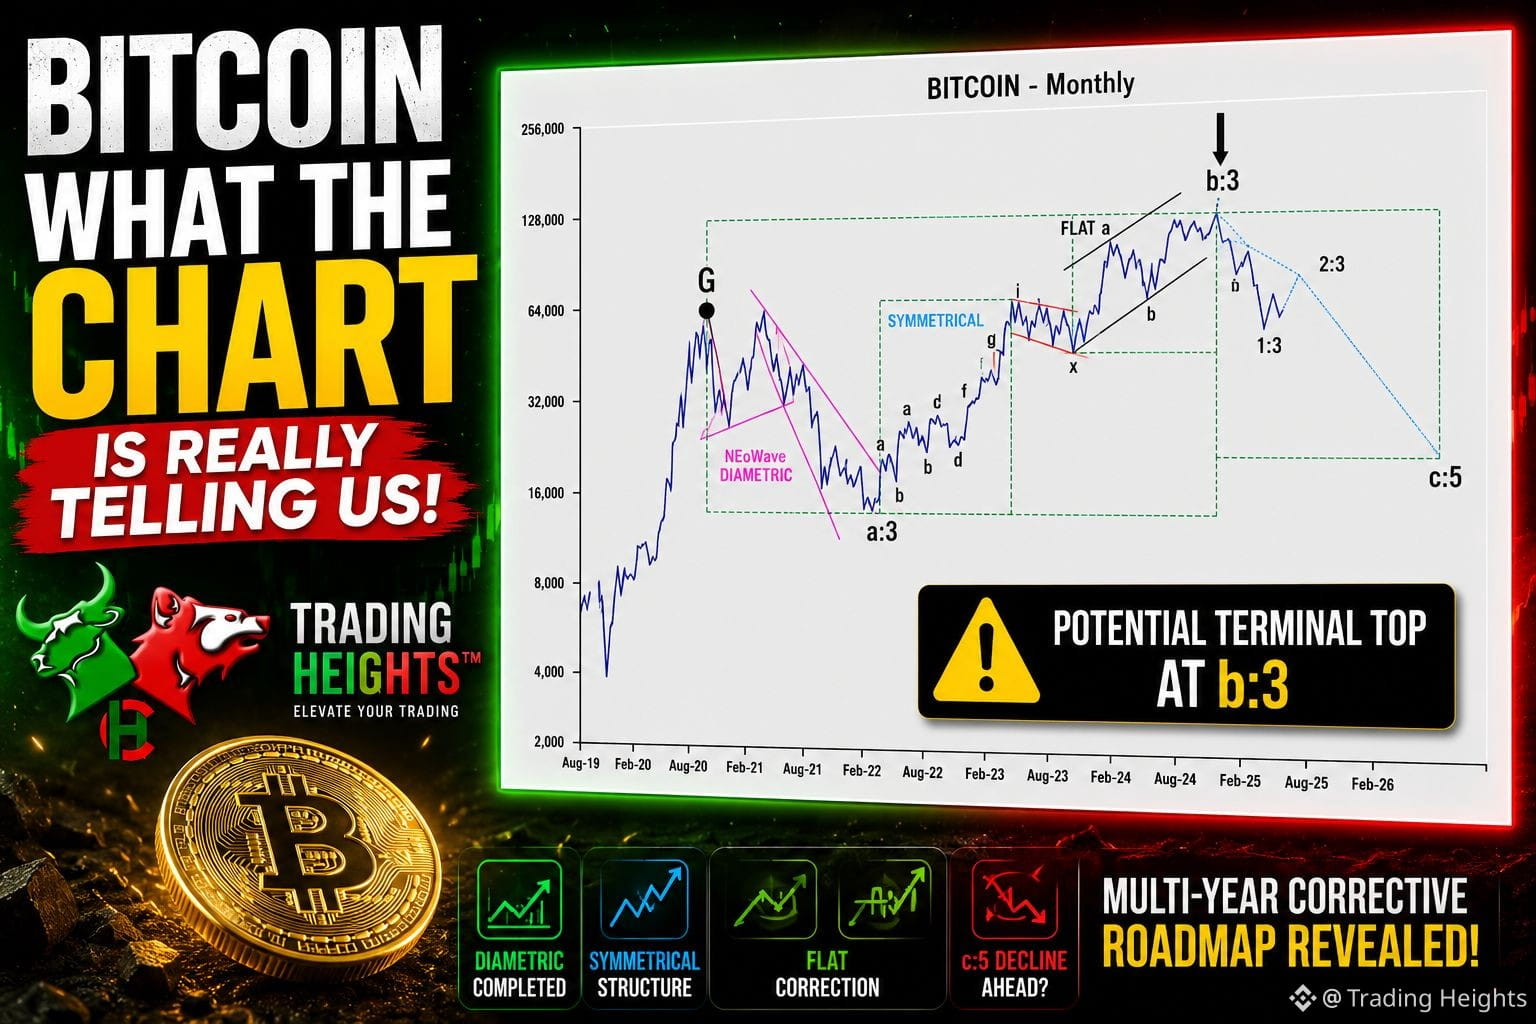
𝐁𝐈𝐓𝐂𝐎𝐈𝐍’𝐒 𝐌𝐀𝐂𝐑𝐎 𝐑𝐎𝐀𝐃𝐌𝐀𝐏 — 𝐖𝐇𝐀𝐓 𝐓𝐇𝐈𝐒 𝐂𝐇𝐀𝐑𝐓 𝐈𝐒 𝐒𝐇𝐎𝐖𝐈𝐍𝐆 📊
This monthly Bitcoin chart presents a long-term corrective structure based on advanced Wave Theory concepts.
According to this interpretation, the 2021 top near $69K completed a major “G” phase, after which Bitcoin entered a large corrective environment instead of a fresh impulsive supercycle.
🔶 The structure is divided into:
▫️ Diametric phase
▫️ Symmetrical continuation
▫️ Flat correction
▫️ Terminal setup near “b:3”
The black arrow near the “b:3” region is the most important part of the chart.
That zone is being treated as:
➡️ a potential terminal top
➡️ a late-stage corrective expansion
➡️ a possible exhaustion area before a larger decline
𝐖𝐇𝐀𝐓 𝐃𝐎𝐄𝐒 “𝐂:𝟓” 𝐌𝐄𝐀𝐍? ⚠️
The blue dotted projection toward the downside represents the expected “c:5” phase.
That scenario suggests:
🔶 Bitcoin could eventually lose major support levels
🔶 wave-1 lows may become vulnerable
🔶 a multi-year corrective decline may develop later
However, this chart is NOT predicting an immediate collapse.
Wave structures often evolve through: ▫️ overlapping price action
▫️ time complexity
▫️ emotional extremes
▫️ continuation traps
That means terminal environments can continue expanding longer than most traders expect.
𝐓𝐑𝐀𝐃𝐈𝐍𝐆 𝐇𝐄𝐈𝐆𝐇𝐓𝐒™ 𝐕𝐄𝐑𝐃𝐈𝐂𝐓 🚨
The real message behind this chart is simple:
👉 Bitcoin may still be bullish locally, but structurally the market could still be developing inside a giant corrective formation before the next major macro move.
$BTC #Bitcoin #WaveTheory
1
1
252

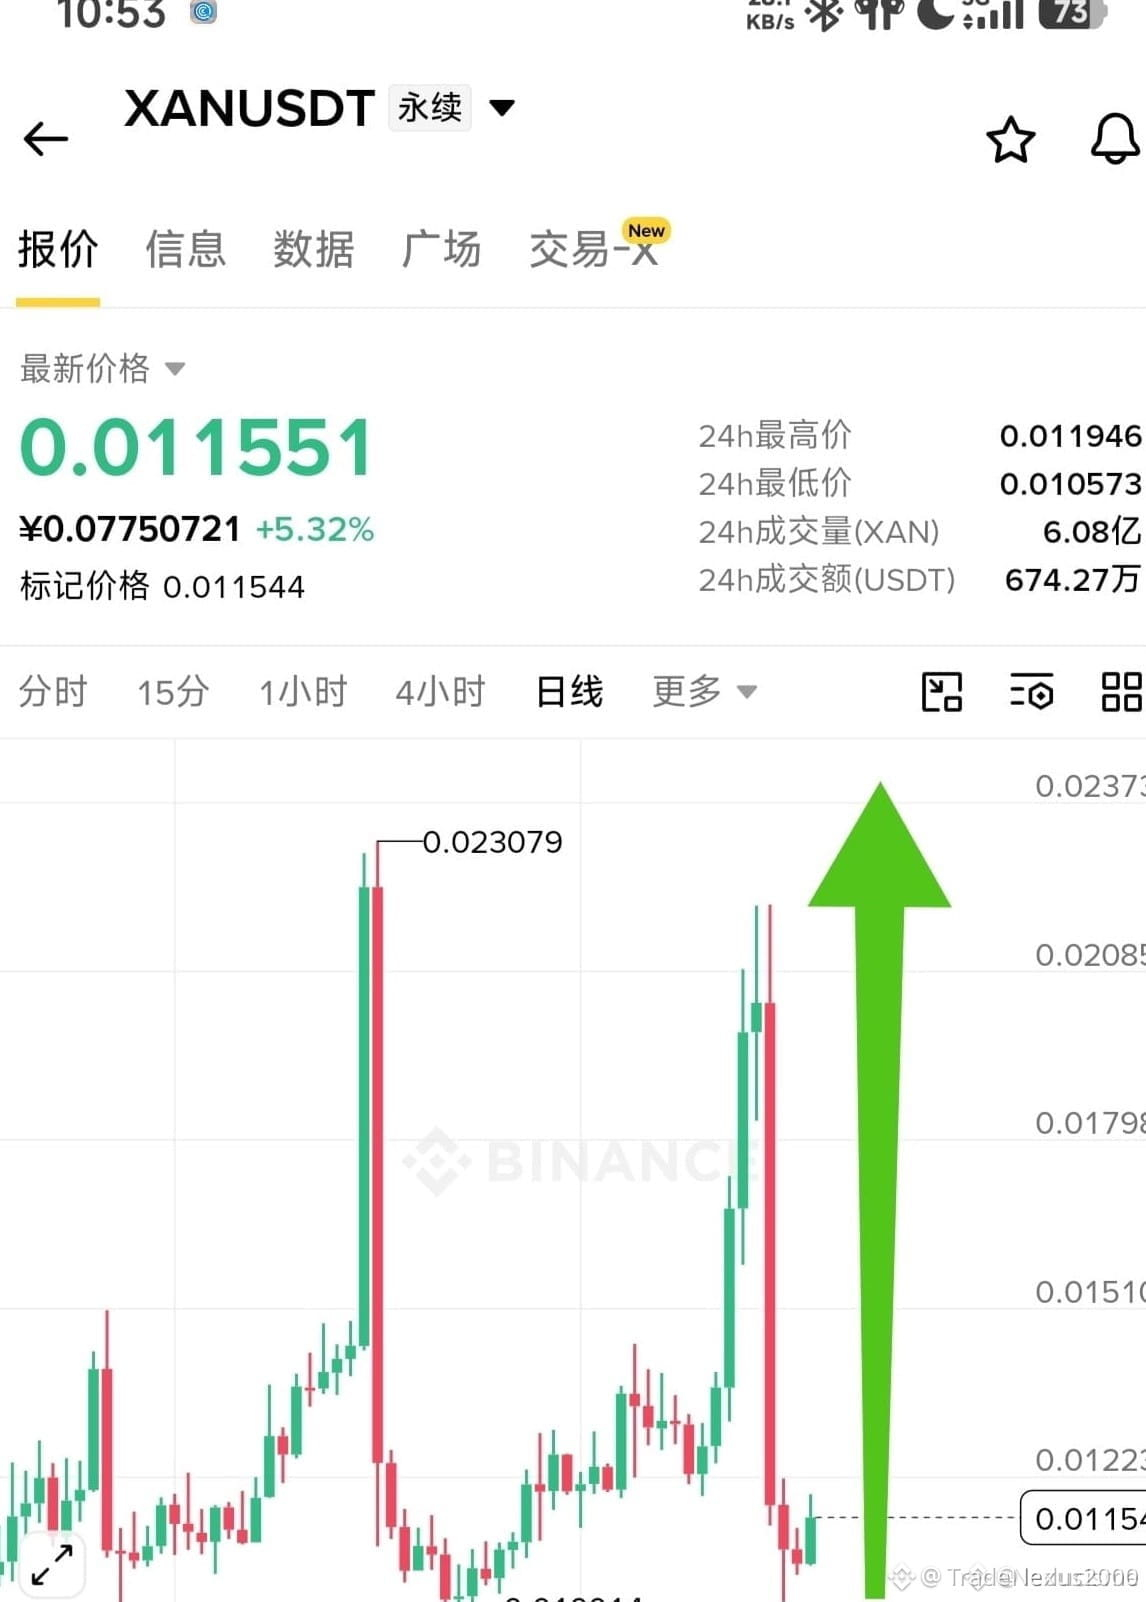
🚨 $XAN SHOWING WAVE 3 EXPANSION SIGNALS OFF MAJOR LIQUIDITY RECLAIM! 🟢
Entry: Current Price ⚡
Stop Loss: 0.01 ⚠️
$XAN has successfully defended its structural demand base, printing a sharp rejection tail that signals institutional absorption. The immediate sweep of sell-side liquidity has cleared the path for a high-velocity Wave 3 impulse phase. 📊
Previous expansion legs off this exact structure delivered rapid repricing cycles once order flow flipped bullish. 🔍 With buyers re-establishing control on lower timeframes, the risk profile favors systematic position building ahead of momentum continuation. 💡
💬 Are you capitalizing on this structural reclaim or waiting for higher timeframe confirmation? 👇
⚠️ Not financial advice. Always manage your risk. 🛡️
🏷️ #XAN #Crypto #TechnicalAnalysis #MarketStructure #WaveTheory
🎯 🦈
85
ເຂົ້າສູ່ລະບົບເພື່ອສຳຫຼວດເນື້ອຫາເພີ່ມເຕີມ
ເຂົ້າຮ່ວມກຸ່ມຜູ້ໃຊ້ຄຣິບໂຕທົ່ວໂລກໃນ Binance Square.
⚡️ ໄດ້ຮັບຂໍ້ມູນຫຼ້າສຸດ ແລະ ທີ່ມີປະໂຫຍດກ່ຽວກັບຄຣິບໂຕ.
💬 ໄດ້ຮັບຄວາມໄວ້ວາງໃຈຈາກຕະຫຼາດແລກປ່ຽນຄຣິບໂຕທີ່ໃຫຍ່ທີ່ສຸດໃນໂລກ.
👍 ຄົ້ນຫາຂໍ້ມູນເຊີງເລິກທີ່ແທ້ຈາກນັກສ້າງທີ່ໄດ້ຮັບການຢືນຢັນ.
ອີເມວ / ເບີໂທລະສັບ
ຫົວຂໍ້ທີ່ກໍາລັງນິຍົມ
1
#BinanceSAFUFundTransferCompleted7499BTC
8,689 ຄັ້ງທີ່ເບິ່ງ
325 ກຳລັງສົນທະນາ
2
#BinanceRecovery90% of stolen assets
47,334 ຄັ້ງທີ່ເບິ່ງ
107 ກຳລັງສົນທະນາ
3
#YiHe:ProofOfReserves:10TokensAt100%Backing
80,634 ຄັ້ງທີ່ເບິ່ງ
476 ກຳລັງສົນທະນາ
4
#BackedNotBroken:RichardTengSaysUsersBearNoLoss
8,960 ຄັ້ງທີ່ເບິ່ງ
293 ກຳລັງສົນທະນາ
5
#CZSaysCompensationIsinPlaceUsersAreProtected
84,064 ຄັ້ງທີ່ເບິ່ງ
1,149 ກຳລັງສົນທະນາ
6
#IntelHasItsWorstDaySince1974
25,137 ຄັ້ງທີ່ເບິ່ງ
552 ກຳລັງສົນທະນາ
7
#TRMCambodianCasinosReceived$1.07BInCrypto
6,098 ຄັ້ງທີ່ເບິ່ງ
61 ກຳລັງສົນທະນາ
8
#USDCCirculationFallsAbout800MInSevenDays
46,957 ຄັ້ງທີ່ເບິ່ງ
642 ກຳລັງສົນທະນາ
9
#SuspectedNorthKoreaAttacksAccountForNearly89%OfCryptoHackLosses
11,791 ຄັ້ງທີ່ເບິ່ງ
87 ກຳລັງສົນທະນາ
10
#OpenAICutsFundraisingTargetBy$10B
2,700 ຄັ້ງທີ່ເບິ່ງ
68 ກຳລັງສົນທະນາ