
#liquidationmap
liquidationmap
396,382 views
732 ກຳລັງສົນທະນາ
ມາແຮງ
ຫຼ້າສຸດ

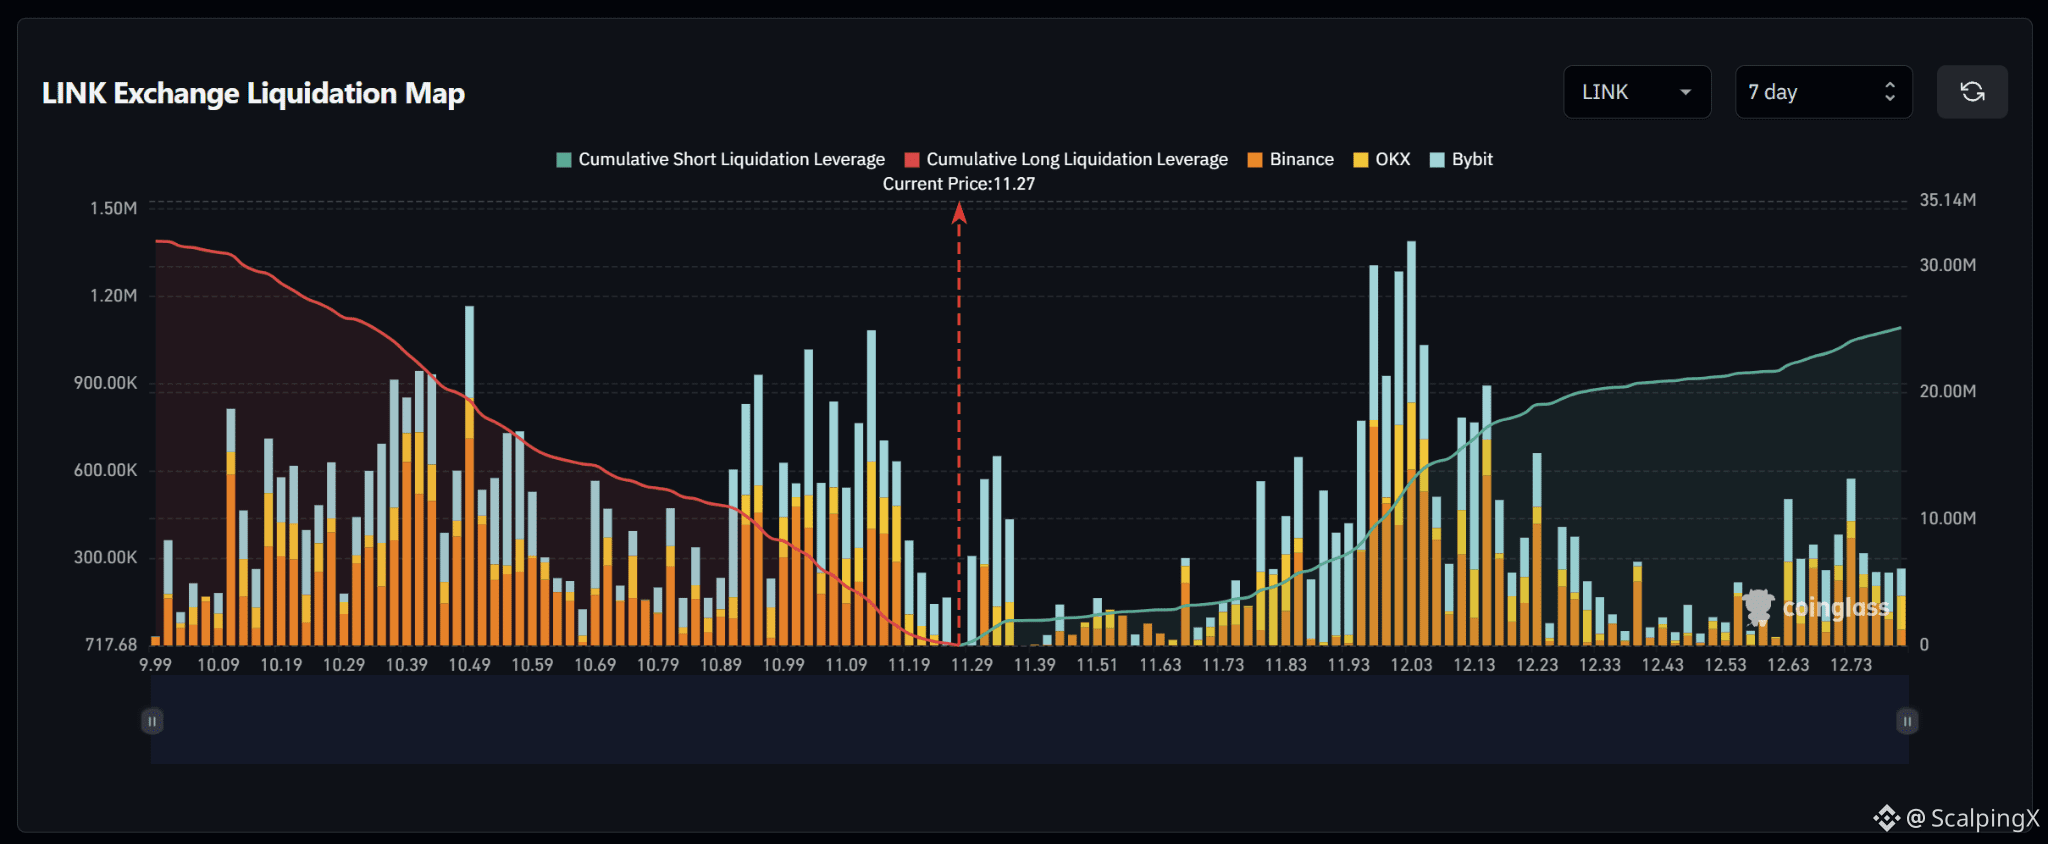
$LINK – Liquidation Map (7 Days) – Current Price 11.27
🔎 The 7-day liquidation map shows roughly $32–33 million in long liquidations below the current price, exceeding approximately $25 million in short liquidations above. The overall structure therefore modestly favors the downside, although a major short-liquidation cluster remains around 11.9–12.1.
📉 Below the market, nearby long-liquidation liquidity is concentrated around 11.19–11.09 before increasing across 10.99–10.89. Larger clusters sit deeper around 10.49–10.39. Losing 11.19 would increase the probability of a sweep toward 11.09–10.99.
📈 Above the market, short-liquidation liquidity begins building around 11.39–11.51 and becomes denser across 11.73–11.83. The strongest concentration sits around 11.93–12.13, particularly near 12.00–12.03 where the largest upside liquidation bars appear. A break above 11.39 would bring 11.73–11.83 into focus first.
🧭 The broader setup modestly favors the downside because long-liquidation exposure below is roughly 1.3 times larger. Losing 11.19 would strengthen the probability of a sweep toward 11.09–10.99, while breaking above 11.39 would shift attention toward a short-liquidation sweep toward 11.73–12.03.
#LiquidationMap
🔎 The 7-day liquidation map shows roughly $32–33 million in long liquidations below the current price, exceeding approximately $25 million in short liquidations above. The overall structure therefore modestly favors the downside, although a major short-liquidation cluster remains around 11.9–12.1.
📉 Below the market, nearby long-liquidation liquidity is concentrated around 11.19–11.09 before increasing across 10.99–10.89. Larger clusters sit deeper around 10.49–10.39. Losing 11.19 would increase the probability of a sweep toward 11.09–10.99.
📈 Above the market, short-liquidation liquidity begins building around 11.39–11.51 and becomes denser across 11.73–11.83. The strongest concentration sits around 11.93–12.13, particularly near 12.00–12.03 where the largest upside liquidation bars appear. A break above 11.39 would bring 11.73–11.83 into focus first.
🧭 The broader setup modestly favors the downside because long-liquidation exposure below is roughly 1.3 times larger. Losing 11.19 would strengthen the probability of a sweep toward 11.09–10.99, while breaking above 11.39 would shift attention toward a short-liquidation sweep toward 11.73–12.03.
#LiquidationMap

Everyone thinks a clean chart means the hardest move is over, but actually the market often goes hunting where the stops are.
If you are long $ETH and ignore those liquidity pockets, you can get shaken out right before the move you wanted. That is how traders end up buying FOMO, then watching price reverse like a bus that stops one block before the station.
1. Below the market, the first nearby long-liquidation zone is 4,574,4,539. If that breaks, the odds increase for a sweep into 4,503,4,467.
2. The strongest nearby cluster sits around 4,503, which makes it a natural magnet when price starts searching for liquidity. There is also meaningful liquidity at 4,431,4,396, so a weak break of 4,574 can snowball faster than many expect.
3. The mistake is treating support like a wall instead of a target. Smart traders watch where the liquidity is stacked, because $ETH , $BTC , and $BNB often move through crowded levels before they move away from them.
Where do you think price goes first?
#ETH #CryptoTrading #LiquidationMap
If you are long $ETH and ignore those liquidity pockets, you can get shaken out right before the move you wanted. That is how traders end up buying FOMO, then watching price reverse like a bus that stops one block before the station.
1. Below the market, the first nearby long-liquidation zone is 4,574,4,539. If that breaks, the odds increase for a sweep into 4,503,4,467.
2. The strongest nearby cluster sits around 4,503, which makes it a natural magnet when price starts searching for liquidity. There is also meaningful liquidity at 4,431,4,396, so a weak break of 4,574 can snowball faster than many expect.
3. The mistake is treating support like a wall instead of a target. Smart traders watch where the liquidity is stacked, because $ETH , $BTC , and $BNB often move through crowded levels before they move away from them.
Where do you think price goes first?
#ETH #CryptoTrading #LiquidationMap

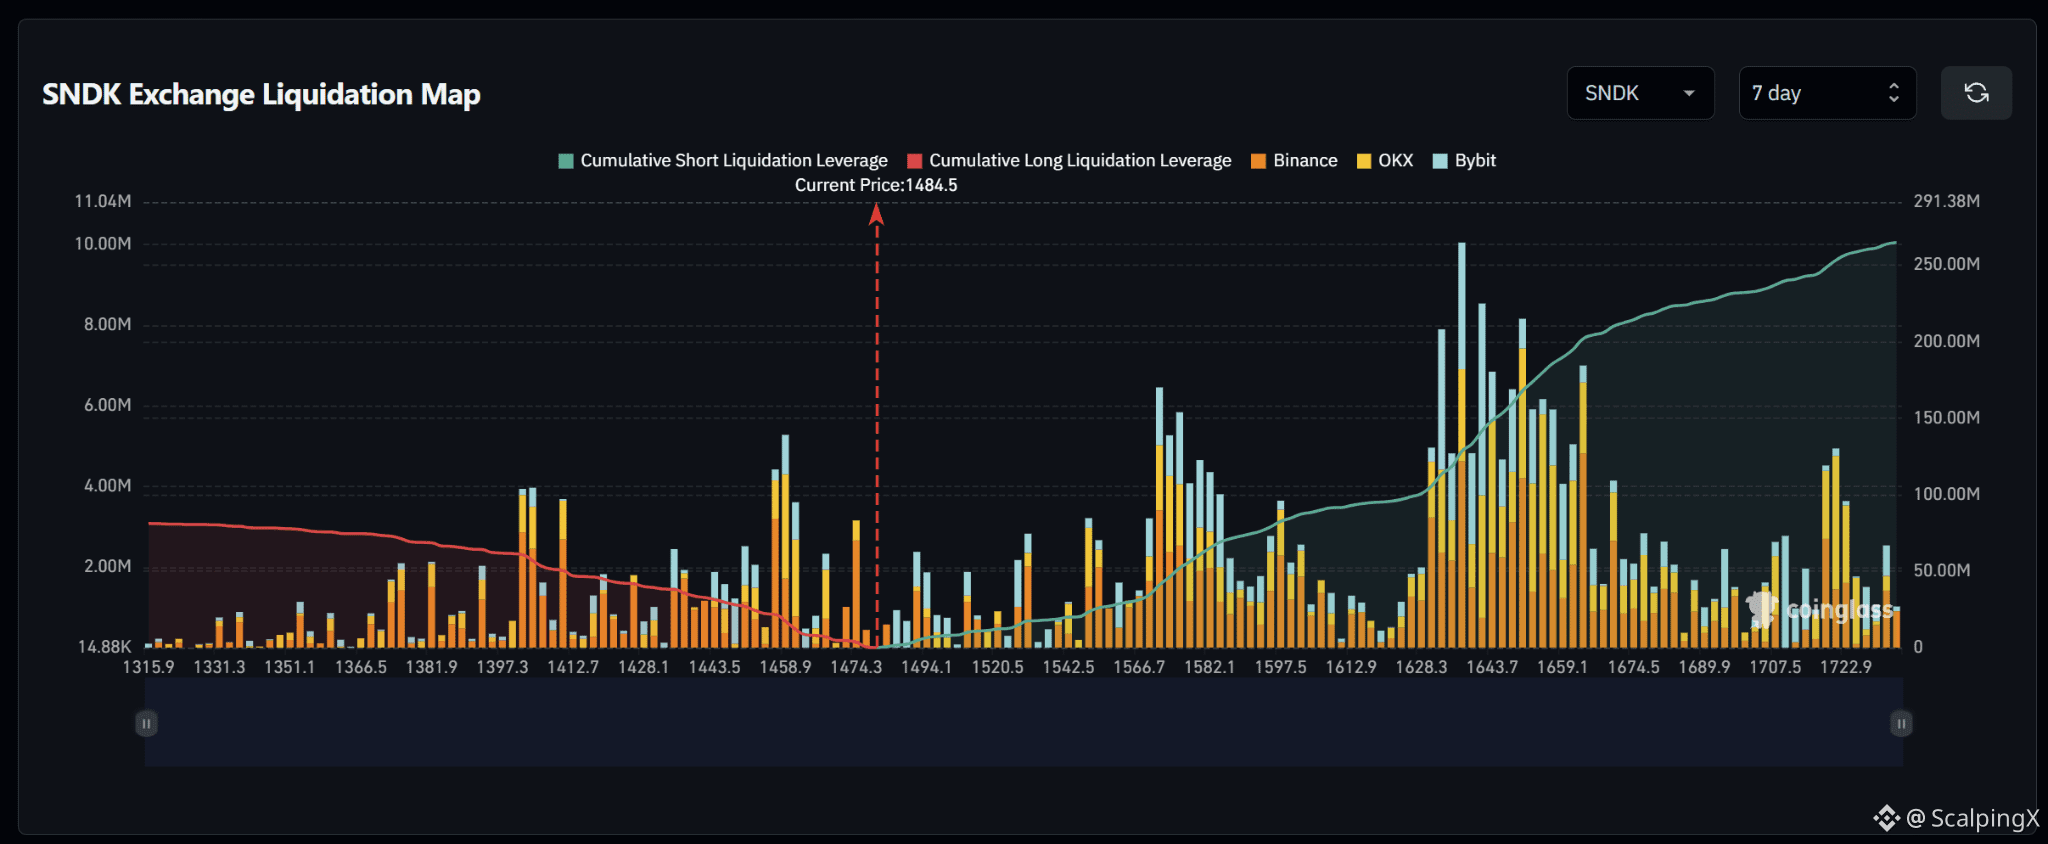
$SNDKB – Liquidation Map (7 Days) – Current Price 1,484.5
🔎 The 7-day liquidation map shows roughly $250 million in short liquidations above the current price, far exceeding approximately $75–80 million in long liquidations below. The liquidity structure therefore leans strongly to the upside, with most major liquidity concentrated at higher price levels.
📉 Below the market, nearby long-liquidation liquidity is concentrated around 1,474–1,459 before becoming denser across 1,444–1,413. The strongest nearby cluster sits around 1,459, while meaningful liquidity also remains deeper around 1,397–1,413. Losing 1,474 would increase the probability of a sweep toward 1,459–1,444.
📈 Above the market, short-liquidation liquidity begins building around 1,494–1,521 and strengthens across 1,543–1,598. The largest concentration sits further out around 1,628–1,660, particularly near 1,635–1,645 where the biggest liquidation bars on the map appear. A break above 1,494 would bring 1,521–1,543 into focus.
🧭 The broader setup strongly favors the upside because short-liquidation exposure above is roughly three times larger. Breaking 1,494 would increase the probability of a sweep toward 1,521–1,543, while losing 1,474 would shift attention toward 1,459–1,444.
#LiquidationMap
🔎 The 7-day liquidation map shows roughly $250 million in short liquidations above the current price, far exceeding approximately $75–80 million in long liquidations below. The liquidity structure therefore leans strongly to the upside, with most major liquidity concentrated at higher price levels.
📉 Below the market, nearby long-liquidation liquidity is concentrated around 1,474–1,459 before becoming denser across 1,444–1,413. The strongest nearby cluster sits around 1,459, while meaningful liquidity also remains deeper around 1,397–1,413. Losing 1,474 would increase the probability of a sweep toward 1,459–1,444.
📈 Above the market, short-liquidation liquidity begins building around 1,494–1,521 and strengthens across 1,543–1,598. The largest concentration sits further out around 1,628–1,660, particularly near 1,635–1,645 where the biggest liquidation bars on the map appear. A break above 1,494 would bring 1,521–1,543 into focus.
🧭 The broader setup strongly favors the upside because short-liquidation exposure above is roughly three times larger. Breaking 1,494 would increase the probability of a sweep toward 1,521–1,543, while losing 1,474 would shift attention toward 1,459–1,444.
#LiquidationMap
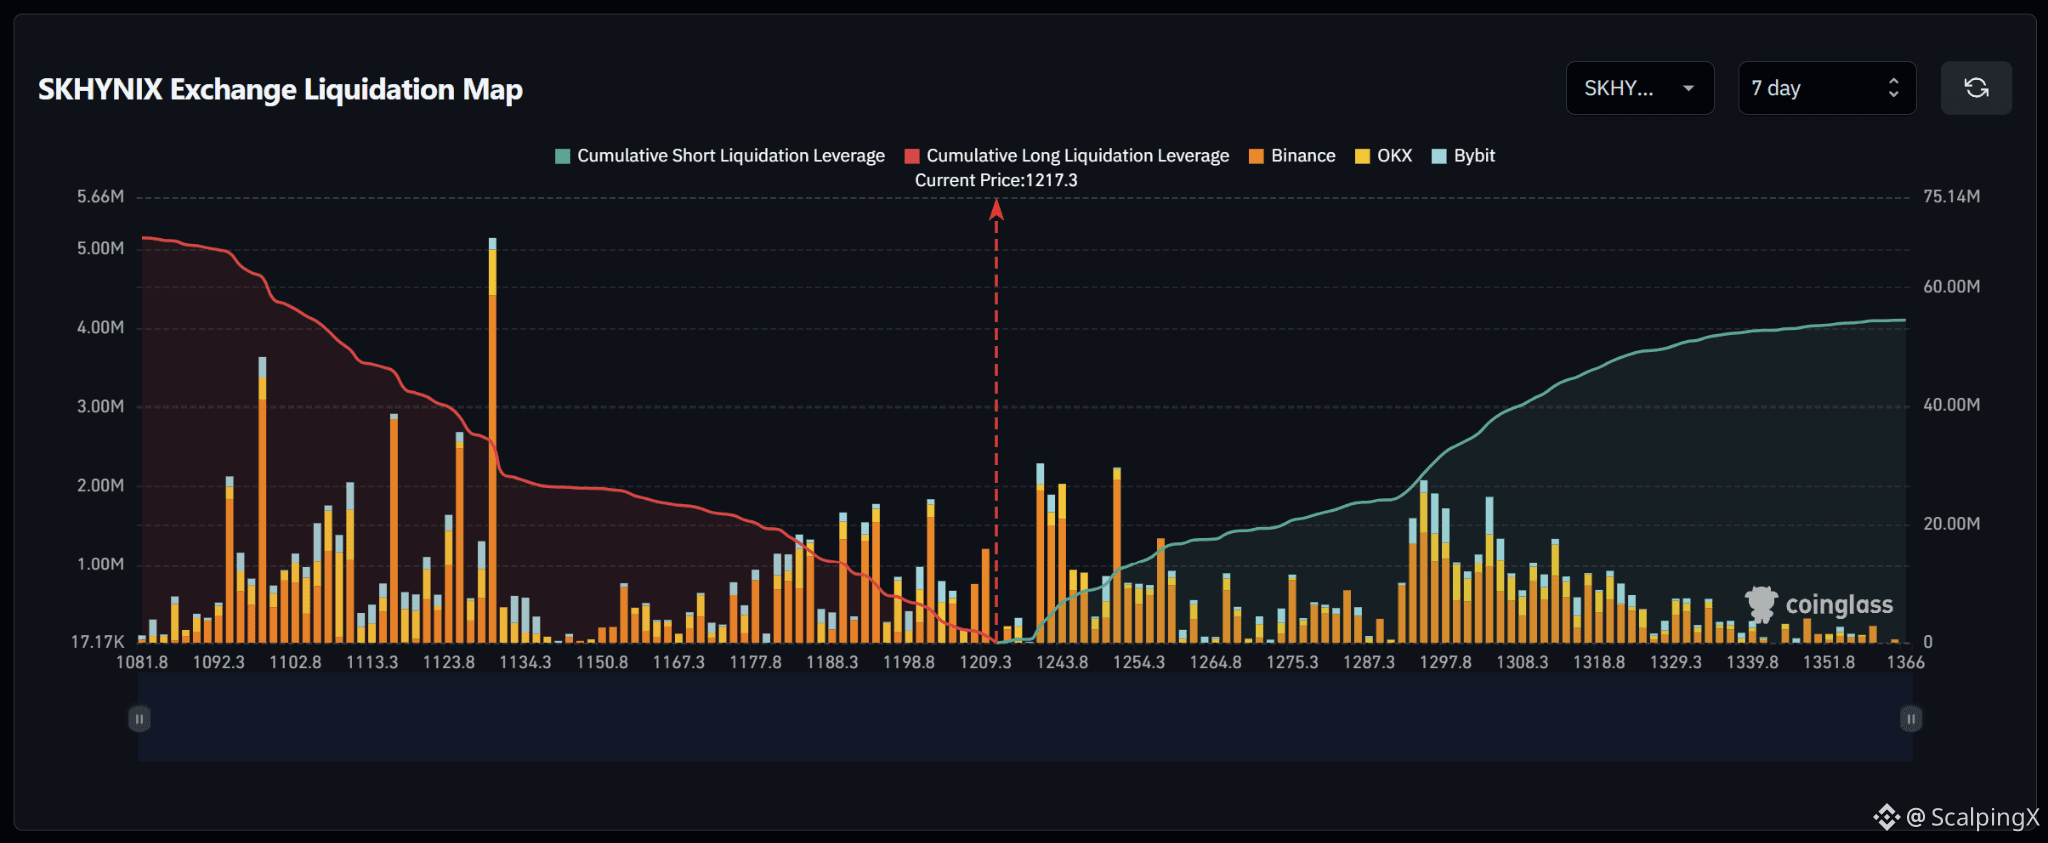
$SKHYNIX – Liquidation Map (7 Days) – Current Price 1,217.3
🔎 The 7-day liquidation map shows roughly $60–65 million in long liquidations below the current price, slightly exceeding approximately $50–55 million in short liquidations above. The overall structure is therefore relatively balanced but modestly tilted to the downside, while liquidity immediately around the current price remains comparatively light.
📉 Below the market, nearby long-liquidation liquidity is concentrated around 1,209–1,199 before increasing across 1,188–1,178. Larger clusters sit deeper around 1,150–1,124, with the 1,124–1,134 area standing out. Losing 1,209 would increase the probability of a sweep toward 1,199–1,188.
📈 Above the market, short-liquidation liquidity begins building sharply around 1,234–1,244, with notable clusters near 1,244 and 1,254. Further out, liquidity becomes much denser across 1,288–1,319, particularly around 1,298–1,308. A break above 1,234 would bring 1,244–1,254 into focus.
🧭 The near-term setup is relatively balanced but modestly favors the downside because total long-liquidation exposure below is slightly larger. Losing 1,209 would strengthen the probability of a sweep toward 1,199–1,188, while breaking above 1,234 would shift attention toward a short-liquidation sweep across 1,244–1,254.
#LiquidationMap
🔎 The 7-day liquidation map shows roughly $60–65 million in long liquidations below the current price, slightly exceeding approximately $50–55 million in short liquidations above. The overall structure is therefore relatively balanced but modestly tilted to the downside, while liquidity immediately around the current price remains comparatively light.
📉 Below the market, nearby long-liquidation liquidity is concentrated around 1,209–1,199 before increasing across 1,188–1,178. Larger clusters sit deeper around 1,150–1,124, with the 1,124–1,134 area standing out. Losing 1,209 would increase the probability of a sweep toward 1,199–1,188.
📈 Above the market, short-liquidation liquidity begins building sharply around 1,234–1,244, with notable clusters near 1,244 and 1,254. Further out, liquidity becomes much denser across 1,288–1,319, particularly around 1,298–1,308. A break above 1,234 would bring 1,244–1,254 into focus.
🧭 The near-term setup is relatively balanced but modestly favors the downside because total long-liquidation exposure below is slightly larger. Losing 1,209 would strengthen the probability of a sweep toward 1,199–1,188, while breaking above 1,234 would shift attention toward a short-liquidation sweep across 1,244–1,254.
#LiquidationMap
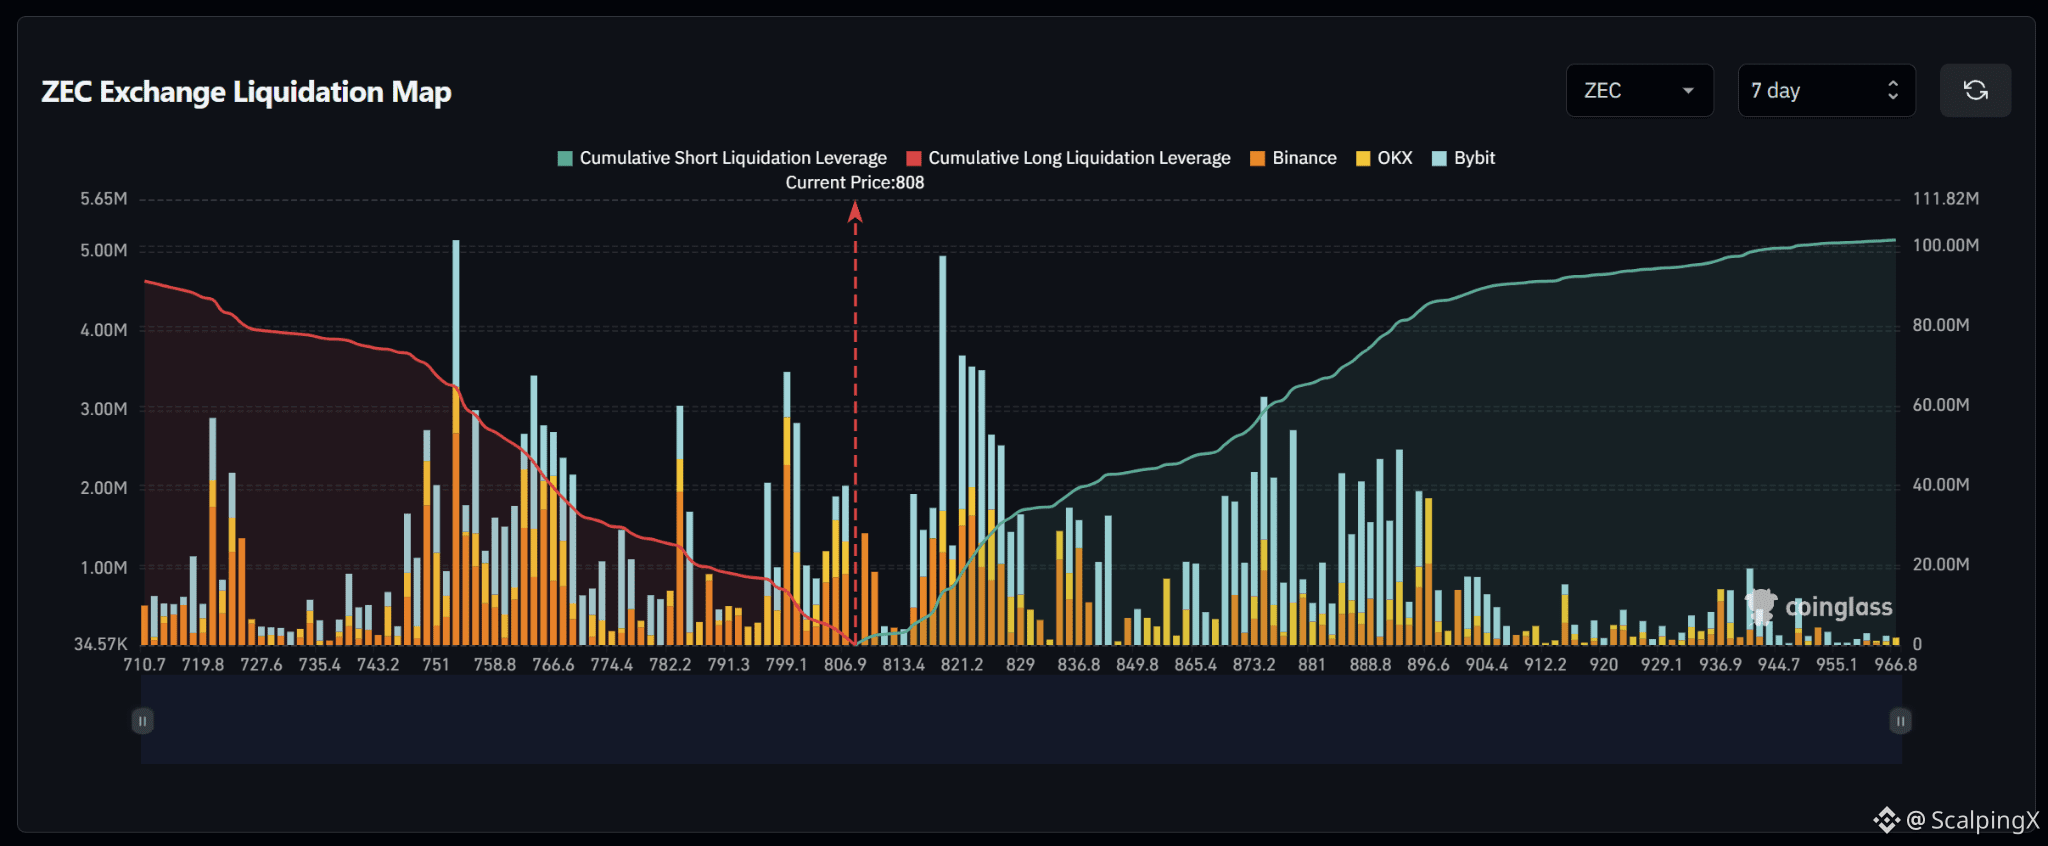
$ZEC – Liquidation Map (7 Days) – Current Price 808
🔎 The 7-day liquidation map shows roughly $100 million in short liquidations above the current price, slightly exceeding approximately $90 million in long liquidations below. The overall structure is therefore relatively balanced but modestly tilted to the upside, with a major short-liquidation cluster sitting fairly close above the market.
📉 Below the market, nearby long-liquidation liquidity is concentrated around 806.9–799.1, with 799.1 standing out as the strongest nearby cluster. Further downside liquidity remains dense across 782.2–766.6, while the largest lower cluster sits around 751–758.8. Losing 799.1 would increase the probability of a sweep toward 791.3–782.2.
📈 Above the market, short-liquidation liquidity rises from 813.4 and becomes particularly dense across 821.2–829, with the strongest nearby spike around 821.2. Additional clusters appear around 873.2–881 and 888.8–896.6. A break above 813.4 would bring 821.2–829 into focus.
🧭 The near-term setup is relatively balanced but modestly favors the upside because total short-liquidation exposure above is larger. Breaking 813.4 would increase the probability of a sweep toward 821.2–829, while losing 799.1 would shift attention toward 791.3–782.2.
#LiquidationMap
🔎 The 7-day liquidation map shows roughly $100 million in short liquidations above the current price, slightly exceeding approximately $90 million in long liquidations below. The overall structure is therefore relatively balanced but modestly tilted to the upside, with a major short-liquidation cluster sitting fairly close above the market.
📉 Below the market, nearby long-liquidation liquidity is concentrated around 806.9–799.1, with 799.1 standing out as the strongest nearby cluster. Further downside liquidity remains dense across 782.2–766.6, while the largest lower cluster sits around 751–758.8. Losing 799.1 would increase the probability of a sweep toward 791.3–782.2.
📈 Above the market, short-liquidation liquidity rises from 813.4 and becomes particularly dense across 821.2–829, with the strongest nearby spike around 821.2. Additional clusters appear around 873.2–881 and 888.8–896.6. A break above 813.4 would bring 821.2–829 into focus.
🧭 The near-term setup is relatively balanced but modestly favors the upside because total short-liquidation exposure above is larger. Breaking 813.4 would increase the probability of a sweep toward 821.2–829, while losing 799.1 would shift attention toward 791.3–782.2.
#LiquidationMap
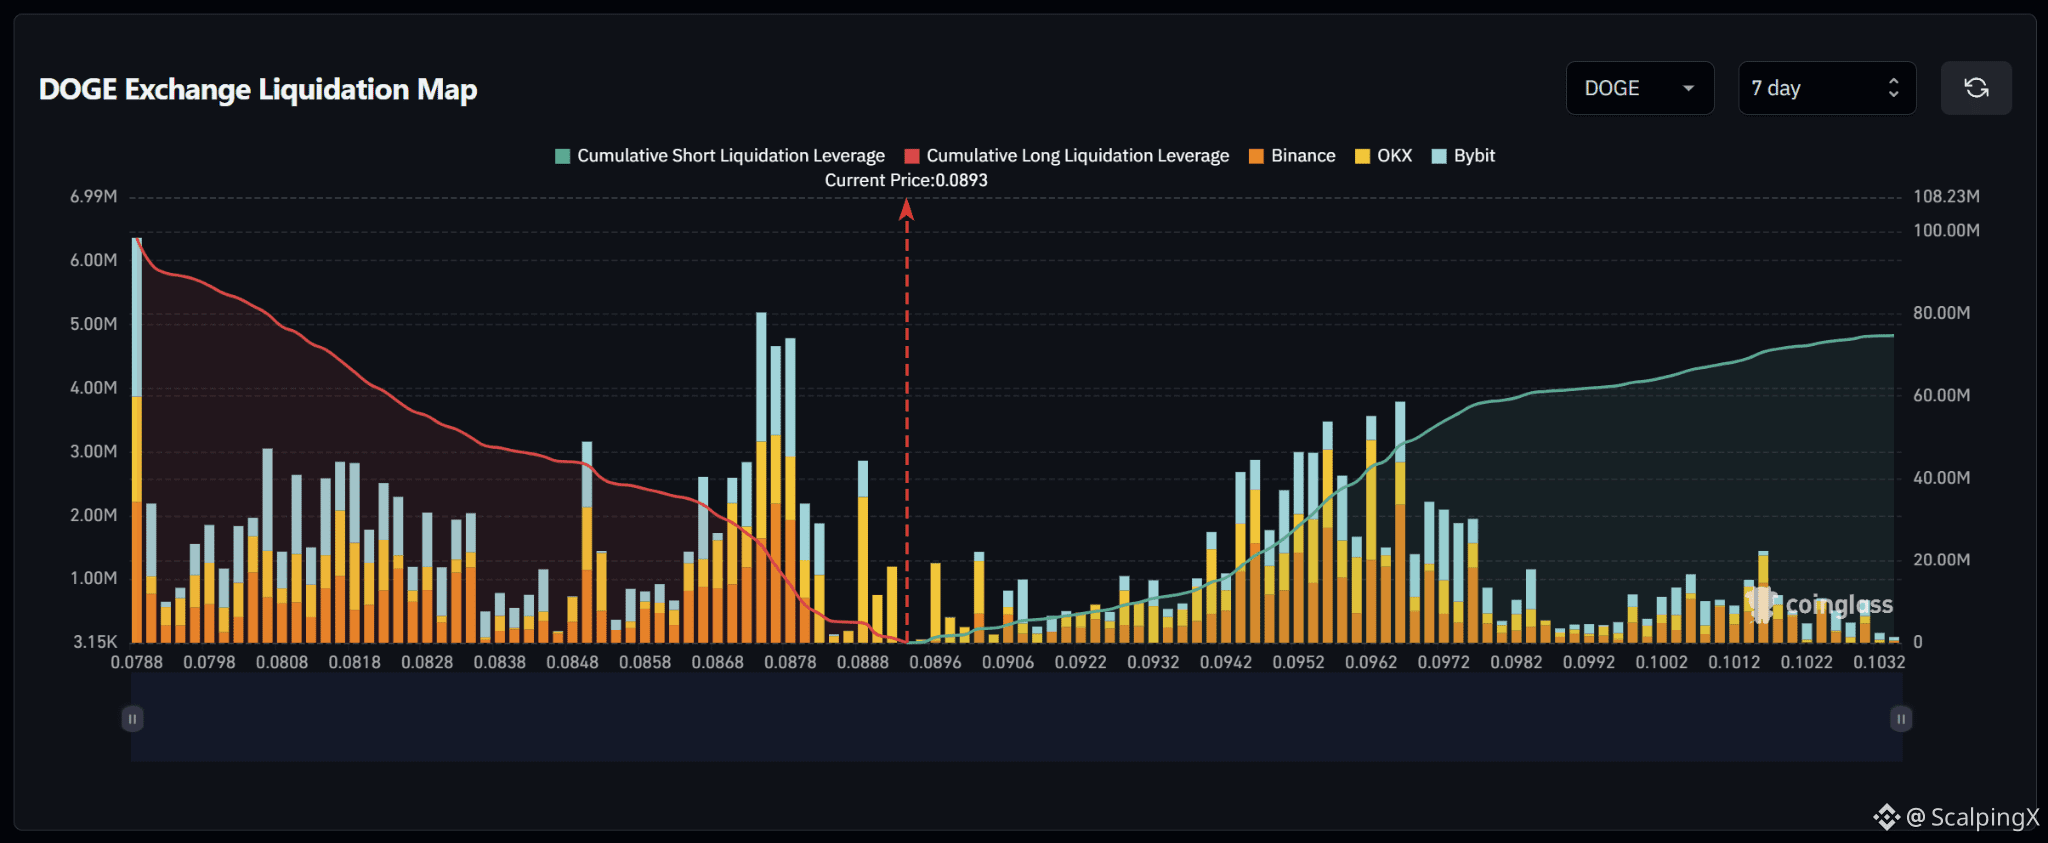
$DOGE – Liquidation Map (7 Days) – Current Price 0.0893
🔎 The 7-day liquidation map shows roughly $95–100 million in long liquidations below the current price, exceeding approximately $70–75 million in short liquidations above. The overall structure therefore leans to the downside, although the imbalance is moderate and several meaningful short-liquidation clusters remain above the market.
📉 Below the market, nearby long-liquidation liquidity is concentrated around 0.0888–0.0868, with 0.0873–0.0878 standing out as the strongest nearby cluster. Further downside liquidity remains dense across 0.0848–0.0808, while a major cluster sits deeper near 0.0788. Losing 0.0888 would increase the probability of a sweep toward 0.0878–0.0868.
📈 Above the market, short-liquidation liquidity begins building around 0.0906–0.0932 and becomes much denser across 0.0942–0.0972. The strongest clusters sit around 0.0952–0.0967, while liquidity gradually thins toward 0.0982–0.1002. A break above 0.0932 would bring 0.0942–0.0962 into focus.
🧭 The broader setup modestly favors the downside because long-liquidation exposure below is roughly 1.3 times larger. Losing 0.0888 would strengthen the probability of a sweep toward 0.0878–0.0868, while breaking above 0.0932 would shift attention toward a short-liquidation sweep across 0.0942–0.0962.
#LiquidationMap
🔎 The 7-day liquidation map shows roughly $95–100 million in long liquidations below the current price, exceeding approximately $70–75 million in short liquidations above. The overall structure therefore leans to the downside, although the imbalance is moderate and several meaningful short-liquidation clusters remain above the market.
📉 Below the market, nearby long-liquidation liquidity is concentrated around 0.0888–0.0868, with 0.0873–0.0878 standing out as the strongest nearby cluster. Further downside liquidity remains dense across 0.0848–0.0808, while a major cluster sits deeper near 0.0788. Losing 0.0888 would increase the probability of a sweep toward 0.0878–0.0868.
📈 Above the market, short-liquidation liquidity begins building around 0.0906–0.0932 and becomes much denser across 0.0942–0.0972. The strongest clusters sit around 0.0952–0.0967, while liquidity gradually thins toward 0.0982–0.1002. A break above 0.0932 would bring 0.0942–0.0962 into focus.
🧭 The broader setup modestly favors the downside because long-liquidation exposure below is roughly 1.3 times larger. Losing 0.0888 would strengthen the probability of a sweep toward 0.0878–0.0868, while breaking above 0.0932 would shift attention toward a short-liquidation sweep across 0.0942–0.0962.
#LiquidationMap
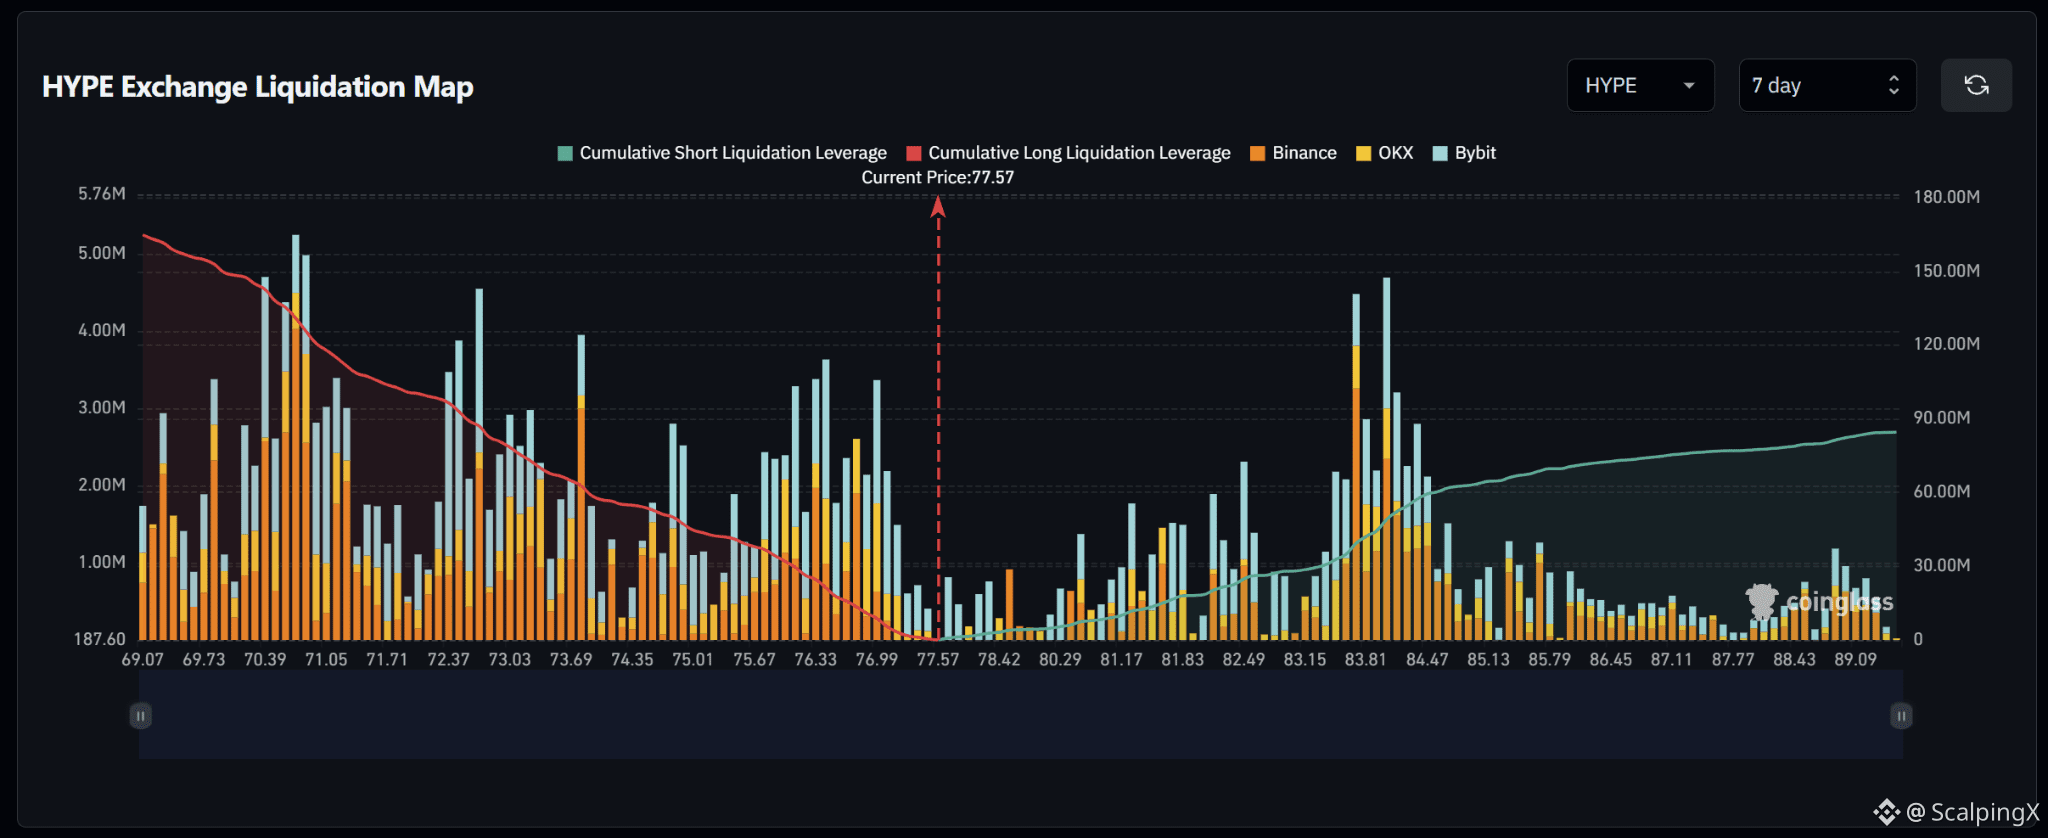
$HYPE – Liquidation Map (7 Days) – Current Price 77.57
🔎 The 7-day liquidation map shows roughly $160–165 million in long liquidations below the current price, significantly exceeding approximately $80–85 million in short liquidations above. The liquidity structure therefore leans to the downside, although a major short-liquidation cluster remains around the 83–84 area.
📉 Below the market, nearby long-liquidation liquidity is concentrated around 76.99–76.33 and remains elevated across 75.67–75.01. Larger clusters sit deeper around 73.69–72.37, while 71.05–70.39 stands out as the strongest downside liquidity zone. Losing 76.99 would increase the probability of a sweep toward 76.33–75.67.
📈 Above the market, short-liquidation liquidity begins building around 78.42 and increases through 80.29–82.49. The strongest upside cluster sits around 83.81–84.47, where the largest liquidation bars above the current price are concentrated. A break above 82.49 would bring 83.81–84.47 into focus.
🧭 The broader setup favors the downside because long-liquidation exposure below is roughly twice as large. Losing 76.99 would strengthen the probability of a sweep toward 76.33–75.67, while breaking above 82.49 would shift attention toward a stronger short-liquidation sweep across 83.81–84.47.
#LiquidationMap
🔎 The 7-day liquidation map shows roughly $160–165 million in long liquidations below the current price, significantly exceeding approximately $80–85 million in short liquidations above. The liquidity structure therefore leans to the downside, although a major short-liquidation cluster remains around the 83–84 area.
📉 Below the market, nearby long-liquidation liquidity is concentrated around 76.99–76.33 and remains elevated across 75.67–75.01. Larger clusters sit deeper around 73.69–72.37, while 71.05–70.39 stands out as the strongest downside liquidity zone. Losing 76.99 would increase the probability of a sweep toward 76.33–75.67.
📈 Above the market, short-liquidation liquidity begins building around 78.42 and increases through 80.29–82.49. The strongest upside cluster sits around 83.81–84.47, where the largest liquidation bars above the current price are concentrated. A break above 82.49 would bring 83.81–84.47 into focus.
🧭 The broader setup favors the downside because long-liquidation exposure below is roughly twice as large. Losing 76.99 would strengthen the probability of a sweep toward 76.33–75.67, while breaking above 82.49 would shift attention toward a stronger short-liquidation sweep across 83.81–84.47.
#LiquidationMap
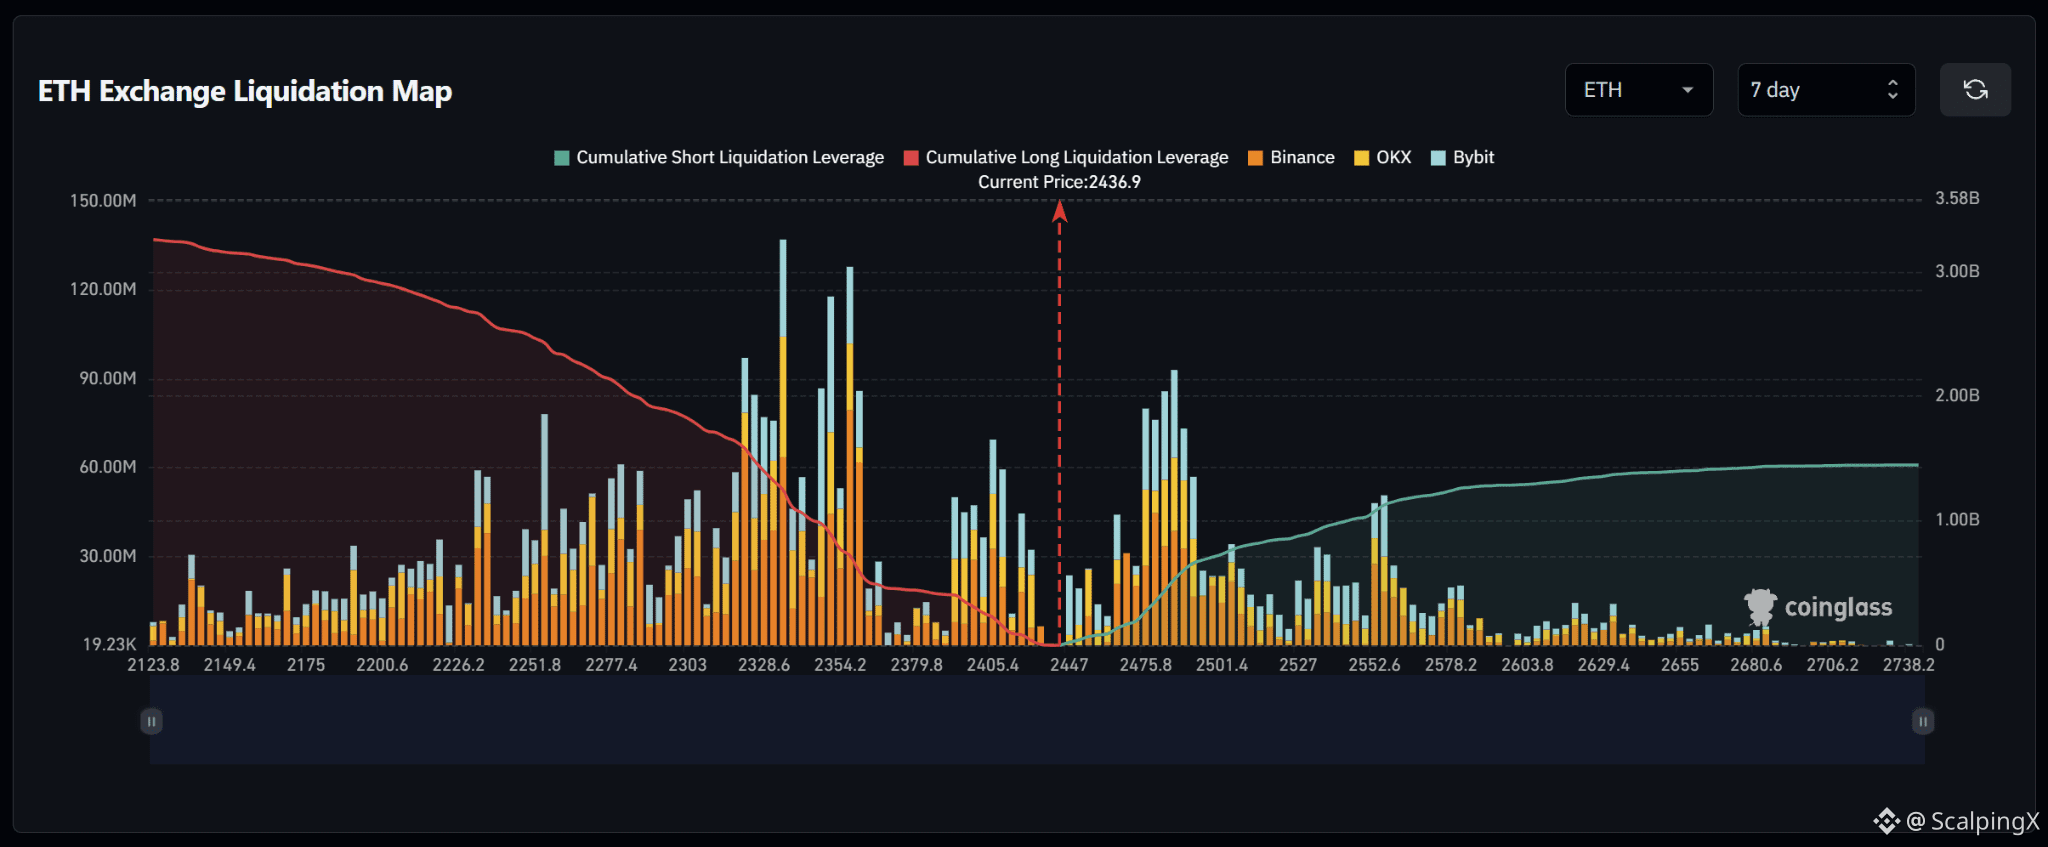
$ETH – Liquidation Map (7 Days) – Current Price 2,436.9
🔎 The 7-day liquidation map shows roughly $3.2 billion in long liquidations below the current price, significantly exceeding approximately $1.5 billion in short liquidations above. The liquidity structure therefore leans to the downside, although a large short-liquidation cluster remains relatively close above the market.
📉 Below the market, nearby long-liquidation liquidity is concentrated around 2,405–2,380 before increasing sharply across 2,354–2,329. The strongest nearby clusters sit around 2,329 and 2,354, with several large liquidation bars grouped together. Losing 2,405 would increase the probability of a sweep toward 2,380–2,354.
📈 Above the market, short-liquidation liquidity begins building around 2,447 and becomes much denser across 2,476–2,501. The strongest nearby concentration sits around 2,476–2,490, while meaningful liquidity continues toward 2,527–2,553. A break above 2,447 would bring 2,476–2,501 into focus.
🧭 The near-term setup favors the downside because total long-liquidation exposure below is roughly twice as large. Losing 2,405 would strengthen the probability of a sweep toward 2,380–2,354, while breaking above 2,447 would shift attention toward a short-liquidation sweep across 2,476–2,501.
#LiquidationMap
🔎 The 7-day liquidation map shows roughly $3.2 billion in long liquidations below the current price, significantly exceeding approximately $1.5 billion in short liquidations above. The liquidity structure therefore leans to the downside, although a large short-liquidation cluster remains relatively close above the market.
📉 Below the market, nearby long-liquidation liquidity is concentrated around 2,405–2,380 before increasing sharply across 2,354–2,329. The strongest nearby clusters sit around 2,329 and 2,354, with several large liquidation bars grouped together. Losing 2,405 would increase the probability of a sweep toward 2,380–2,354.
📈 Above the market, short-liquidation liquidity begins building around 2,447 and becomes much denser across 2,476–2,501. The strongest nearby concentration sits around 2,476–2,490, while meaningful liquidity continues toward 2,527–2,553. A break above 2,447 would bring 2,476–2,501 into focus.
🧭 The near-term setup favors the downside because total long-liquidation exposure below is roughly twice as large. Losing 2,405 would strengthen the probability of a sweep toward 2,380–2,354, while breaking above 2,447 would shift attention toward a short-liquidation sweep across 2,476–2,501.
#LiquidationMap
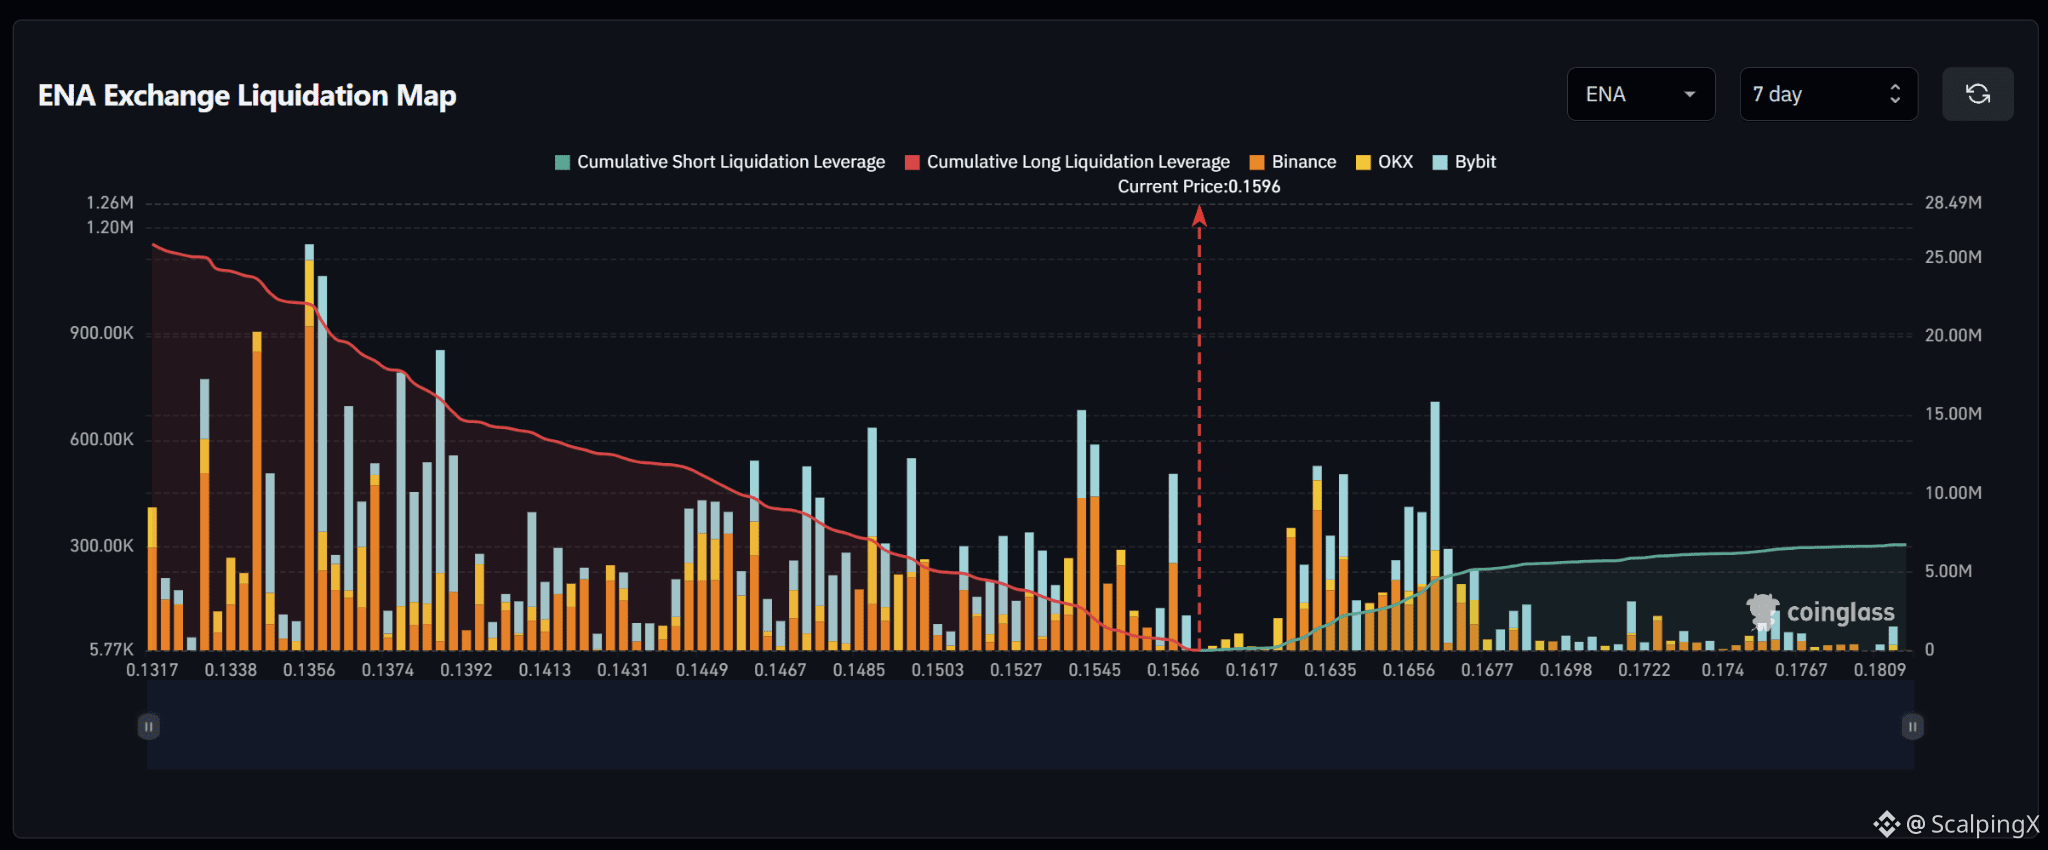
$ENA – Liquidation Map (7 Days) – Current Price 0.1596
🔎 The 7-day liquidation map shows roughly $25–26 million in long liquidations below the current price, far exceeding approximately $5–6 million in short liquidations above. The liquidity structure therefore leans strongly to the downside, with most meaningful exposure still concentrated at lower price levels.
📉 Below the market, nearby long-liquidation liquidity is concentrated around 0.1566–0.1545 and remains elevated across 0.1527–0.1485. Larger clusters sit deeper around 0.1467–0.1449, while 0.1392–0.1356 contains several of the largest liquidation bars on the map. Losing 0.1566 would increase the probability of a sweep toward 0.1545–0.1527.
📈 Above the market, short-liquidation liquidity begins building around 0.1617 and becomes denser across 0.1635–0.1677. The strongest nearby cluster sits around 0.1666–0.1670, while liquidity density drops considerably beyond 0.1698. A break above 0.1617 would bring 0.1635–0.1666 into focus.
🧭 The near-term setup strongly favors the downside because total long-liquidation exposure below is roughly four to five times larger. Losing 0.1566 would strengthen the probability of a sweep toward 0.1545–0.1527, while holding current levels and breaking 0.1617 would shift attention toward a short-liquidation sweep across 0.1635–0.1666.
#LiquidationMap
🔎 The 7-day liquidation map shows roughly $25–26 million in long liquidations below the current price, far exceeding approximately $5–6 million in short liquidations above. The liquidity structure therefore leans strongly to the downside, with most meaningful exposure still concentrated at lower price levels.
📉 Below the market, nearby long-liquidation liquidity is concentrated around 0.1566–0.1545 and remains elevated across 0.1527–0.1485. Larger clusters sit deeper around 0.1467–0.1449, while 0.1392–0.1356 contains several of the largest liquidation bars on the map. Losing 0.1566 would increase the probability of a sweep toward 0.1545–0.1527.
📈 Above the market, short-liquidation liquidity begins building around 0.1617 and becomes denser across 0.1635–0.1677. The strongest nearby cluster sits around 0.1666–0.1670, while liquidity density drops considerably beyond 0.1698. A break above 0.1617 would bring 0.1635–0.1666 into focus.
🧭 The near-term setup strongly favors the downside because total long-liquidation exposure below is roughly four to five times larger. Losing 0.1566 would strengthen the probability of a sweep toward 0.1545–0.1527, while holding current levels and breaking 0.1617 would shift attention toward a short-liquidation sweep across 0.1635–0.1666.
#LiquidationMap
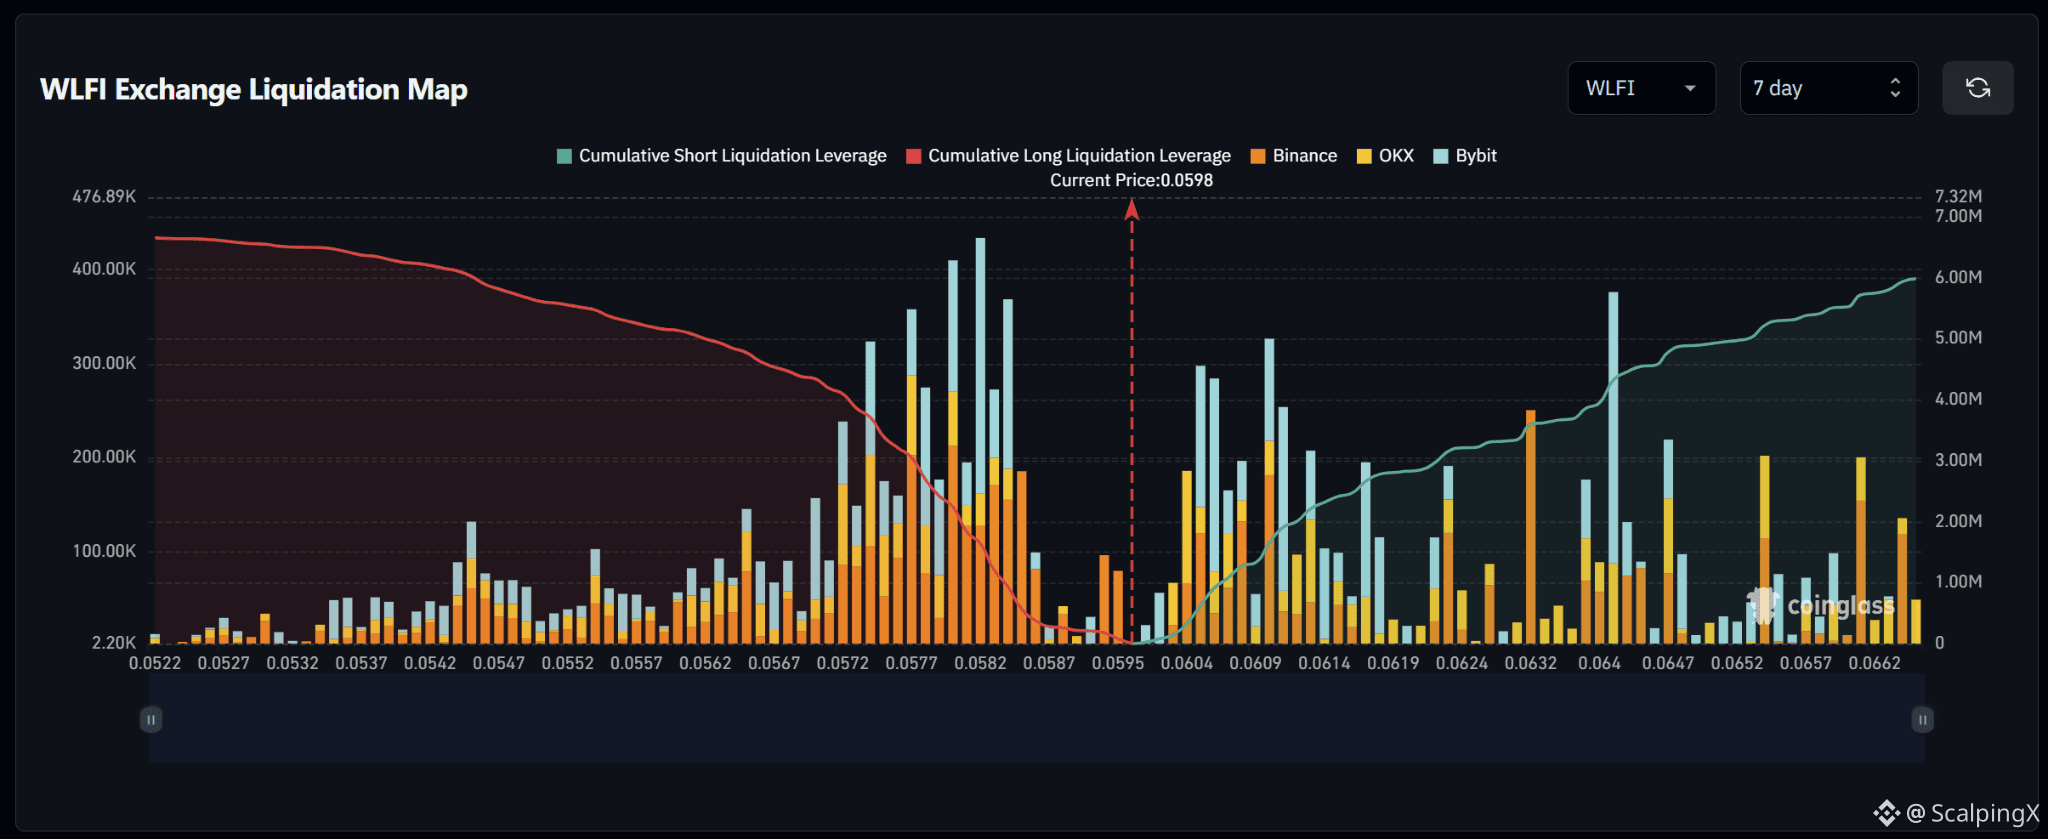
$WLFI – Liquidation Map (7 Days) – Current Price 0.0598
🔎 The 7-day liquidation map shows roughly $6.5–7 million in long liquidations below the current price, slightly exceeding approximately $6 million in short liquidations above. The overall structure is therefore relatively balanced but modestly tilted to the downside, with sizable liquidity clusters on both sides.
📉 Below the market, nearby long-liquidation liquidity is concentrated around 0.0587–0.0572, with the strongest clusters near 0.0582 and 0.0577. Additional liquidity remains meaningful around 0.0567–0.0562. Losing 0.0587 would increase the probability of a sweep toward 0.0582–0.0577.
📈 Above the market, short-liquidation liquidity begins building sharply from 0.0604 and remains dense across 0.0604–0.0614. Further out, a major cluster stands out near 0.0640, while 0.0632 and 0.0647 also carry notable liquidity. A break above 0.0604 would bring 0.0609–0.0614 into focus.
🧭 The near-term setup is relatively balanced but modestly favors the downside because total long-liquidation exposure below is larger. Losing 0.0587 would strengthen the probability of a sweep toward 0.0582–0.0577, while breaking above 0.0604 would shift attention toward a short-liquidation sweep across 0.0609–0.0614.
#LiquidationMap
🔎 The 7-day liquidation map shows roughly $6.5–7 million in long liquidations below the current price, slightly exceeding approximately $6 million in short liquidations above. The overall structure is therefore relatively balanced but modestly tilted to the downside, with sizable liquidity clusters on both sides.
📉 Below the market, nearby long-liquidation liquidity is concentrated around 0.0587–0.0572, with the strongest clusters near 0.0582 and 0.0577. Additional liquidity remains meaningful around 0.0567–0.0562. Losing 0.0587 would increase the probability of a sweep toward 0.0582–0.0577.
📈 Above the market, short-liquidation liquidity begins building sharply from 0.0604 and remains dense across 0.0604–0.0614. Further out, a major cluster stands out near 0.0640, while 0.0632 and 0.0647 also carry notable liquidity. A break above 0.0604 would bring 0.0609–0.0614 into focus.
🧭 The near-term setup is relatively balanced but modestly favors the downside because total long-liquidation exposure below is larger. Losing 0.0587 would strengthen the probability of a sweep toward 0.0582–0.0577, while breaking above 0.0604 would shift attention toward a short-liquidation sweep across 0.0609–0.0614.
#LiquidationMap
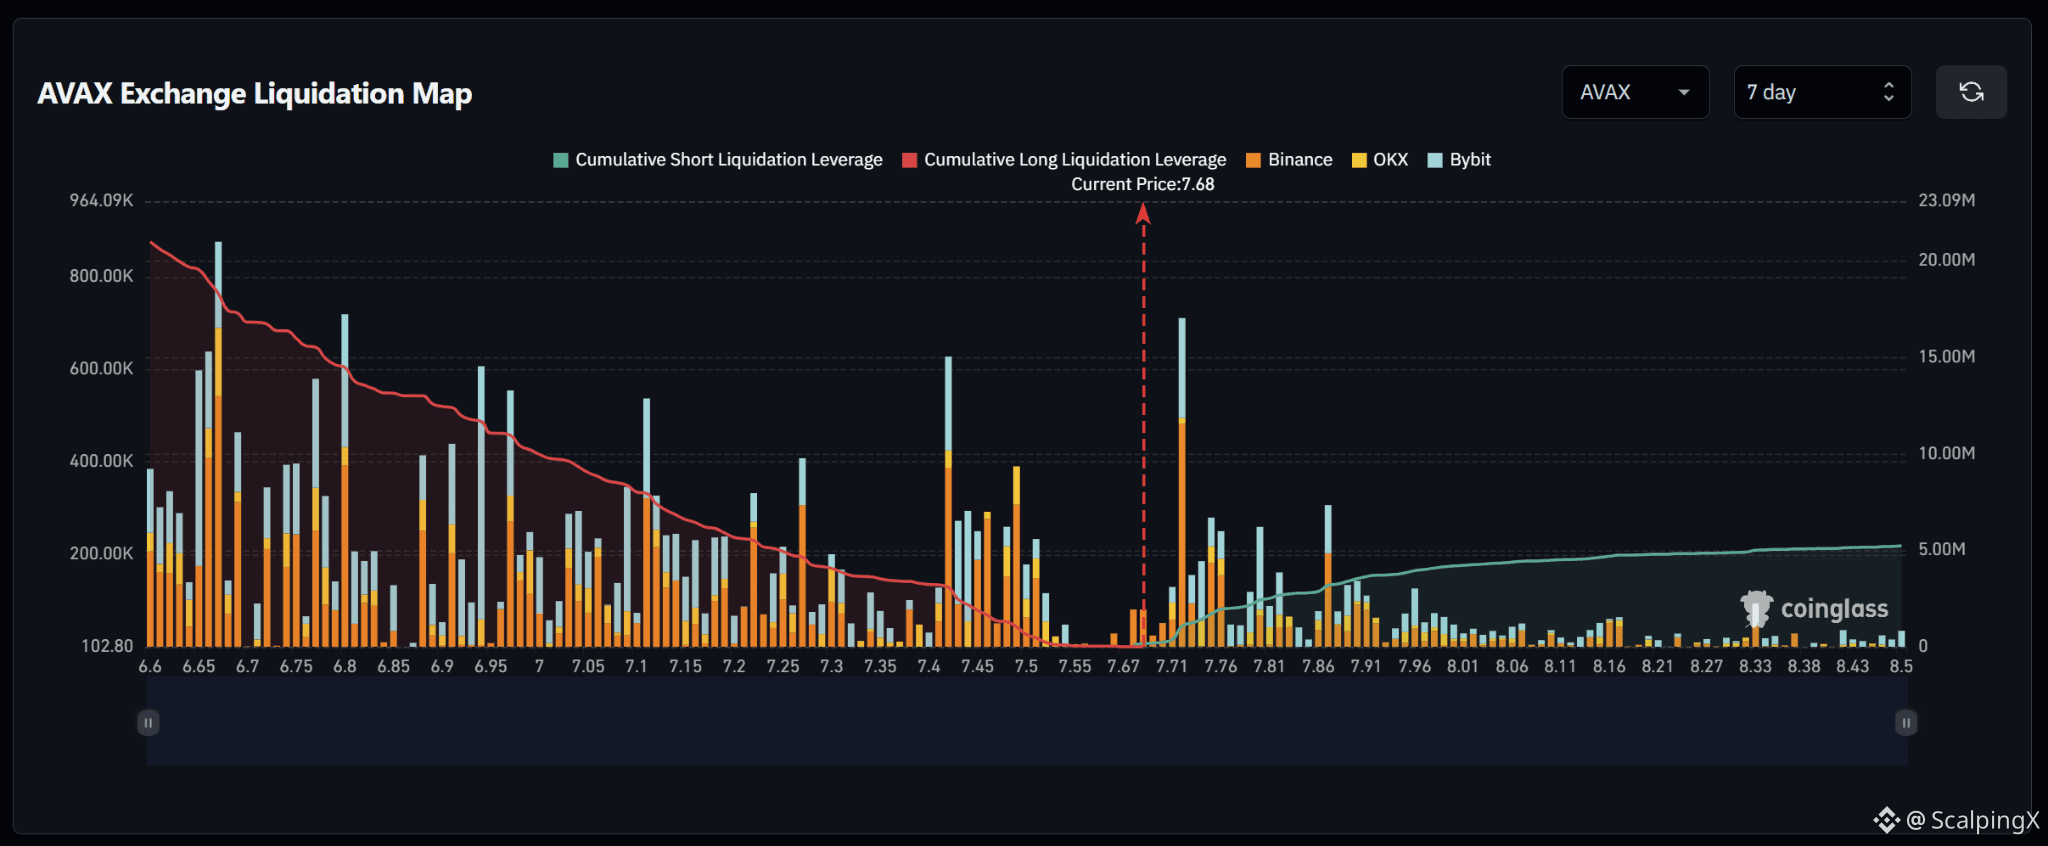
$AVAX – Liquidation Map (7 Days) – Current Price 7.68
🔎 The 7-day liquidation map shows roughly $20–21 million in long liquidations below the current price, far exceeding approximately $5 million in short liquidations above. The broader liquidity structure therefore leans strongly to the downside, although the largest nearby individual liquidation cluster sits immediately above the market.
📉 Below the market, nearby long-liquidation liquidity remains relatively light across 7.55–7.67 before increasing significantly around 7.50–7.40. The nearest notable cluster sits around 7.40–7.45, while deeper liquidity remains dense across 7.25–7.10 and 6.95–6.80. Losing 7.55 would increase the probability of a sweep toward 7.50–7.40.
📈 Above the market, short-liquidation liquidity spikes sharply around 7.71–7.72, forming the strongest cluster near the current price. Additional liquidity remains notable across 7.76–7.81 and around 7.86–7.91. A break above 7.71 could bring 7.72–7.76 into focus first.
🧭 The broader setup still favors the downside because long-liquidation exposure below is roughly four times larger, but in the very near term the 7.71–7.72 cluster creates a clear upside liquidity magnet. Breaking 7.71 could trigger a sweep toward 7.76–7.81, while losing 7.55 would increase the probability of a move toward 7.50–7.40.
#LiquidationMap
🔎 The 7-day liquidation map shows roughly $20–21 million in long liquidations below the current price, far exceeding approximately $5 million in short liquidations above. The broader liquidity structure therefore leans strongly to the downside, although the largest nearby individual liquidation cluster sits immediately above the market.
📉 Below the market, nearby long-liquidation liquidity remains relatively light across 7.55–7.67 before increasing significantly around 7.50–7.40. The nearest notable cluster sits around 7.40–7.45, while deeper liquidity remains dense across 7.25–7.10 and 6.95–6.80. Losing 7.55 would increase the probability of a sweep toward 7.50–7.40.
📈 Above the market, short-liquidation liquidity spikes sharply around 7.71–7.72, forming the strongest cluster near the current price. Additional liquidity remains notable across 7.76–7.81 and around 7.86–7.91. A break above 7.71 could bring 7.72–7.76 into focus first.
🧭 The broader setup still favors the downside because long-liquidation exposure below is roughly four times larger, but in the very near term the 7.71–7.72 cluster creates a clear upside liquidity magnet. Breaking 7.71 could trigger a sweep toward 7.76–7.81, while losing 7.55 would increase the probability of a move toward 7.50–7.40.
#LiquidationMap
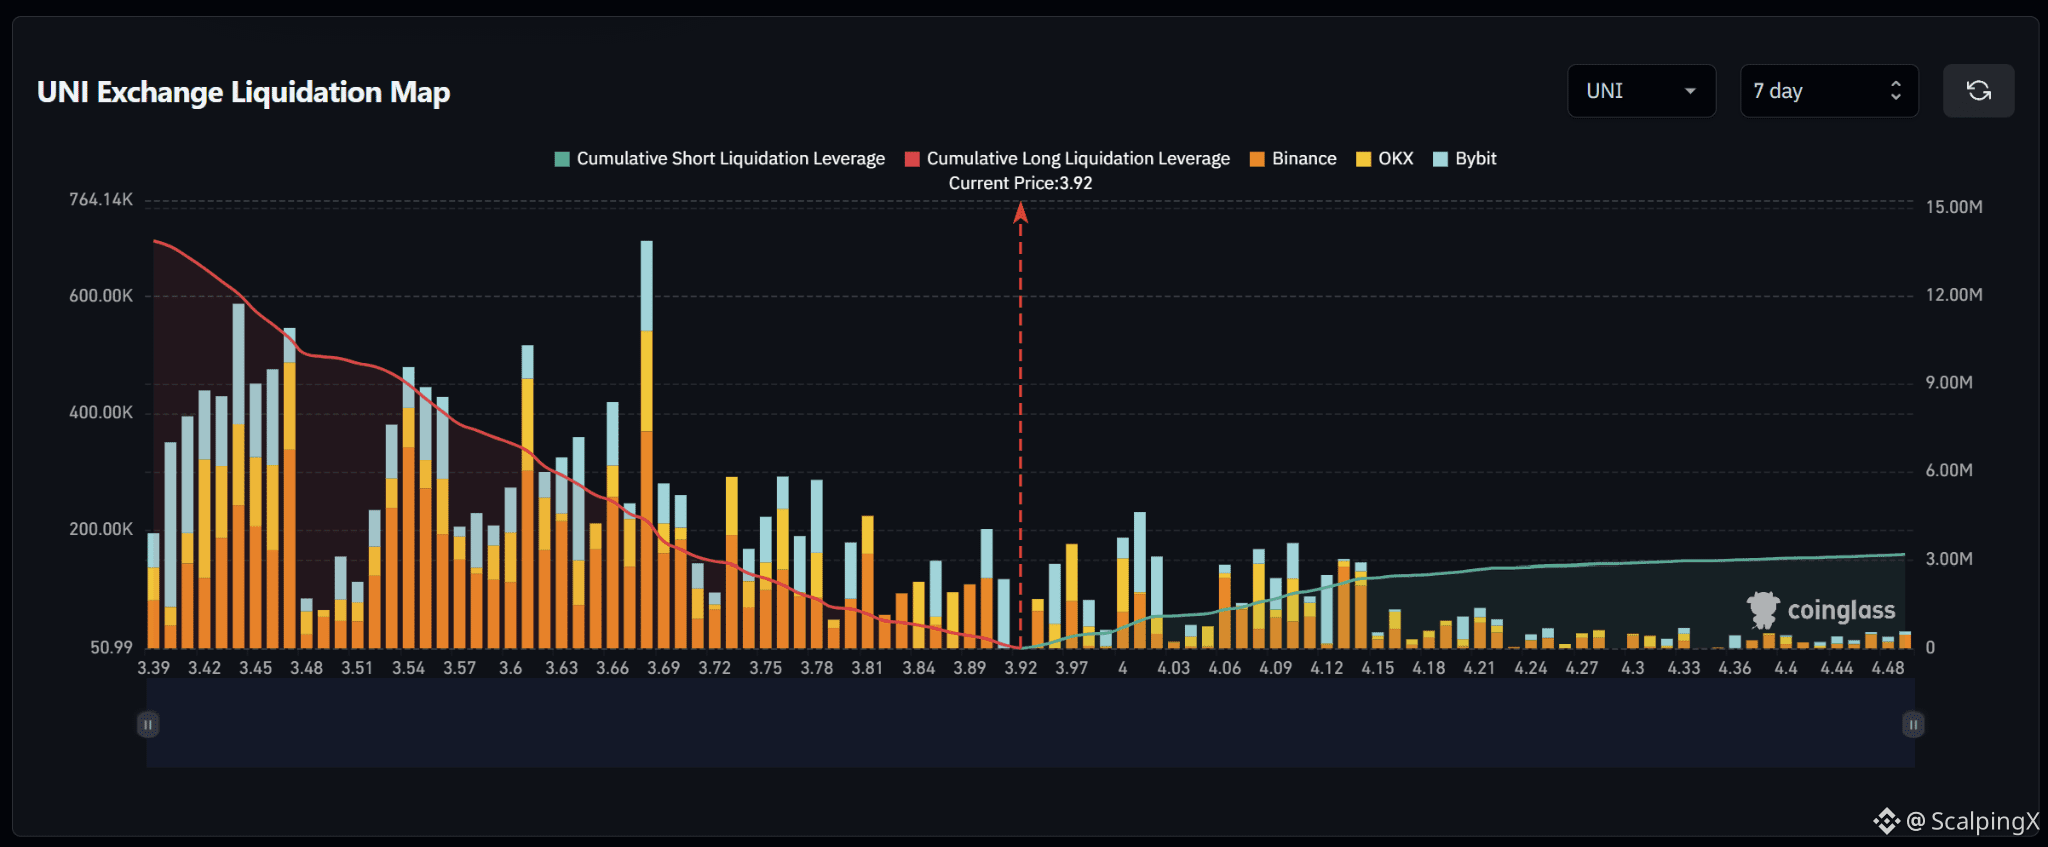
$UNI – Liquidation Map (7 Days) – Current Price 3.92
🔎 The 7-day liquidation map shows roughly $13–14 million in long liquidations below the current price, far exceeding only around $3 million in short liquidations above. The liquidity structure therefore leans strongly to the downside, with most of the major liquidation clusters still positioned at lower price levels.
📉 Below the market, nearby long-liquidation liquidity is concentrated around 3.89–3.81 before increasing across 3.78–3.66. Larger clusters sit deeper around 3.60–3.54 and especially near 3.48–3.42. Losing 3.89 would increase the probability of a sweep toward 3.84–3.78.
📈 Above the market, short-liquidation liquidity begins building around 3.97–4.00 and becomes more concentrated across 4.03–4.15. Notable clusters sit around 4.09–4.15, while liquidity density drops significantly beyond 4.18. A break above 4.00 would bring 4.06–4.15 into focus.
🧭 The near-term setup strongly favors the downside because total long-liquidation exposure below is roughly four times larger. Losing 3.89 would strengthen the probability of a sweep toward 3.84–3.78, while holding current levels and breaking 4.00 would shift attention toward a short-liquidation sweep across 4.06–4.15.
#LiquidationMap
🔎 The 7-day liquidation map shows roughly $13–14 million in long liquidations below the current price, far exceeding only around $3 million in short liquidations above. The liquidity structure therefore leans strongly to the downside, with most of the major liquidation clusters still positioned at lower price levels.
📉 Below the market, nearby long-liquidation liquidity is concentrated around 3.89–3.81 before increasing across 3.78–3.66. Larger clusters sit deeper around 3.60–3.54 and especially near 3.48–3.42. Losing 3.89 would increase the probability of a sweep toward 3.84–3.78.
📈 Above the market, short-liquidation liquidity begins building around 3.97–4.00 and becomes more concentrated across 4.03–4.15. Notable clusters sit around 4.09–4.15, while liquidity density drops significantly beyond 4.18. A break above 4.00 would bring 4.06–4.15 into focus.
🧭 The near-term setup strongly favors the downside because total long-liquidation exposure below is roughly four times larger. Losing 3.89 would strengthen the probability of a sweep toward 3.84–3.78, while holding current levels and breaking 4.00 would shift attention toward a short-liquidation sweep across 4.06–4.15.
#LiquidationMap
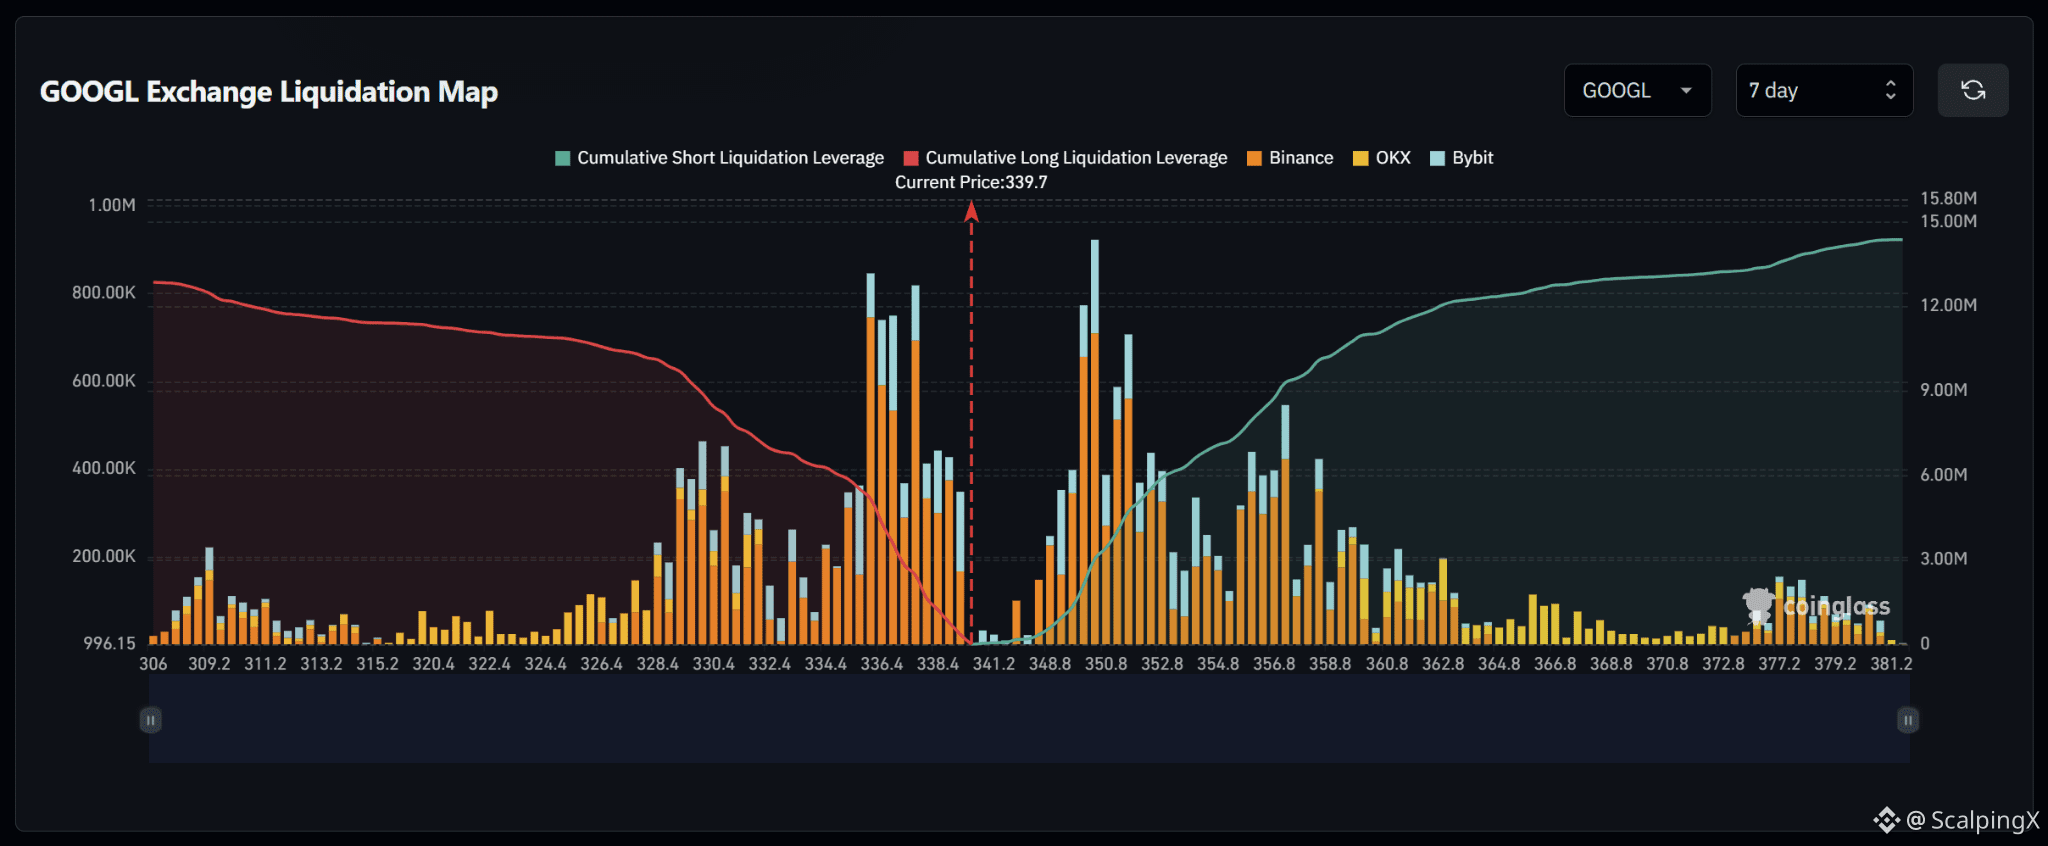
$GOOGL – Liquidation Map (7 Days) – Current Price 339.7
🔎 The 7-day liquidation map shows roughly $14–15 million in short liquidations above the current price, slightly exceeding approximately $13 million in long liquidations below. The overall structure is therefore relatively balanced but modestly tilted to the upside, with several large short-liquidation clusters positioned fairly close to the market.
📈 Above the market, short-liquidation liquidity begins building around 348.8 and becomes much denser across 349.8–352.8. The strongest nearby cluster sits around 350.8, with additional liquidity remaining elevated through 354.8–358.8. A break above 348.8 would increase the probability of a sweep toward 350.8–352.8.
📉 Below the market, long-liquidation liquidity is concentrated around 338.4–336.4, where several large liquidation bars are grouped together. Further downside liquidity remains dense across 332.4–328.4. Losing 338.4 would increase the probability of a sweep toward 336.4–334.4.
🧭 The near-term setup is relatively balanced but modestly favors the upside because total short-liquidation exposure above is larger. A break above 348.8 would bring 350.8–352.8 into focus, while losing 338.4 would strengthen the downside long-sweep scenario toward 336.4–334.4.
#LiquidationMap
🔎 The 7-day liquidation map shows roughly $14–15 million in short liquidations above the current price, slightly exceeding approximately $13 million in long liquidations below. The overall structure is therefore relatively balanced but modestly tilted to the upside, with several large short-liquidation clusters positioned fairly close to the market.
📈 Above the market, short-liquidation liquidity begins building around 348.8 and becomes much denser across 349.8–352.8. The strongest nearby cluster sits around 350.8, with additional liquidity remaining elevated through 354.8–358.8. A break above 348.8 would increase the probability of a sweep toward 350.8–352.8.
📉 Below the market, long-liquidation liquidity is concentrated around 338.4–336.4, where several large liquidation bars are grouped together. Further downside liquidity remains dense across 332.4–328.4. Losing 338.4 would increase the probability of a sweep toward 336.4–334.4.
🧭 The near-term setup is relatively balanced but modestly favors the upside because total short-liquidation exposure above is larger. A break above 348.8 would bring 350.8–352.8 into focus, while losing 338.4 would strengthen the downside long-sweep scenario toward 336.4–334.4.
#LiquidationMap
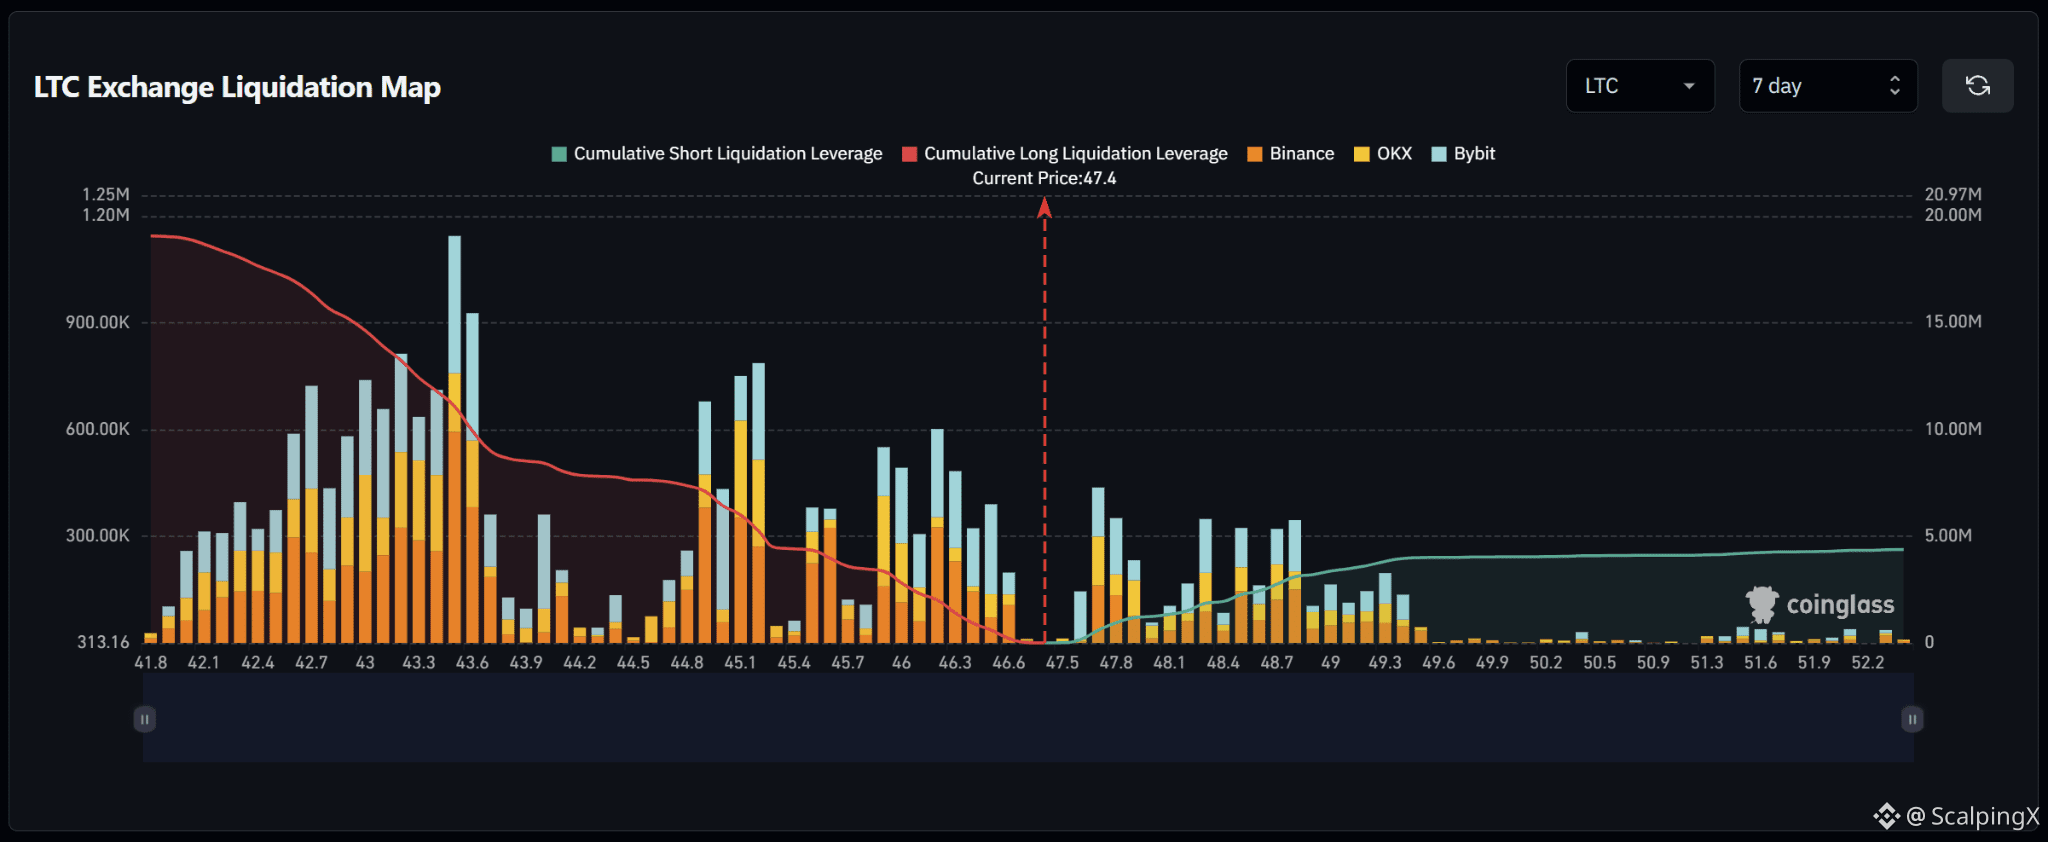
$LTC – Liquidation Map (7 Days) – Current Price 47.4
🔎 The 7-day liquidation map shows roughly $19–20 million in long liquidations below the current price, far exceeding only around $4–5 million in short liquidations above. The liquidity structure therefore leans strongly to the downside, with most meaningful exposure still concentrated at lower price levels.
📉 Below the market, nearby long-liquidation liquidity is concentrated around 46.6–46.0 and remains elevated across 45.7–45.1. Larger clusters sit deeper around 43.6–43.0, with 43.3–43.6 standing out as the strongest zone on the map. Losing 46.6 would increase the probability of a sweep toward 46.3–46.0.
📈 Above the market, short-liquidation liquidity begins building around 47.8 and continues across 48.4–49.3. Notable clusters sit near 48.4–48.7 and 49.0–49.3. Liquidity density drops sharply beyond 49.6. A break above 47.8 would bring 48.4–48.7 into focus.
🧭 The near-term setup strongly favors the downside because total long-liquidation exposure below is roughly four times larger. Losing 46.6 would strengthen the probability of a sweep toward 46.3–46.0, while holding current levels and breaking 47.8 would shift attention toward a short-liquidation sweep across 48.4–49.3.
#LiquidationMap
🔎 The 7-day liquidation map shows roughly $19–20 million in long liquidations below the current price, far exceeding only around $4–5 million in short liquidations above. The liquidity structure therefore leans strongly to the downside, with most meaningful exposure still concentrated at lower price levels.
📉 Below the market, nearby long-liquidation liquidity is concentrated around 46.6–46.0 and remains elevated across 45.7–45.1. Larger clusters sit deeper around 43.6–43.0, with 43.3–43.6 standing out as the strongest zone on the map. Losing 46.6 would increase the probability of a sweep toward 46.3–46.0.
📈 Above the market, short-liquidation liquidity begins building around 47.8 and continues across 48.4–49.3. Notable clusters sit near 48.4–48.7 and 49.0–49.3. Liquidity density drops sharply beyond 49.6. A break above 47.8 would bring 48.4–48.7 into focus.
🧭 The near-term setup strongly favors the downside because total long-liquidation exposure below is roughly four times larger. Losing 46.6 would strengthen the probability of a sweep toward 46.3–46.0, while holding current levels and breaking 47.8 would shift attention toward a short-liquidation sweep across 48.4–49.3.
#LiquidationMap
Jamie Kim:
mình xin biên của TAO ạh
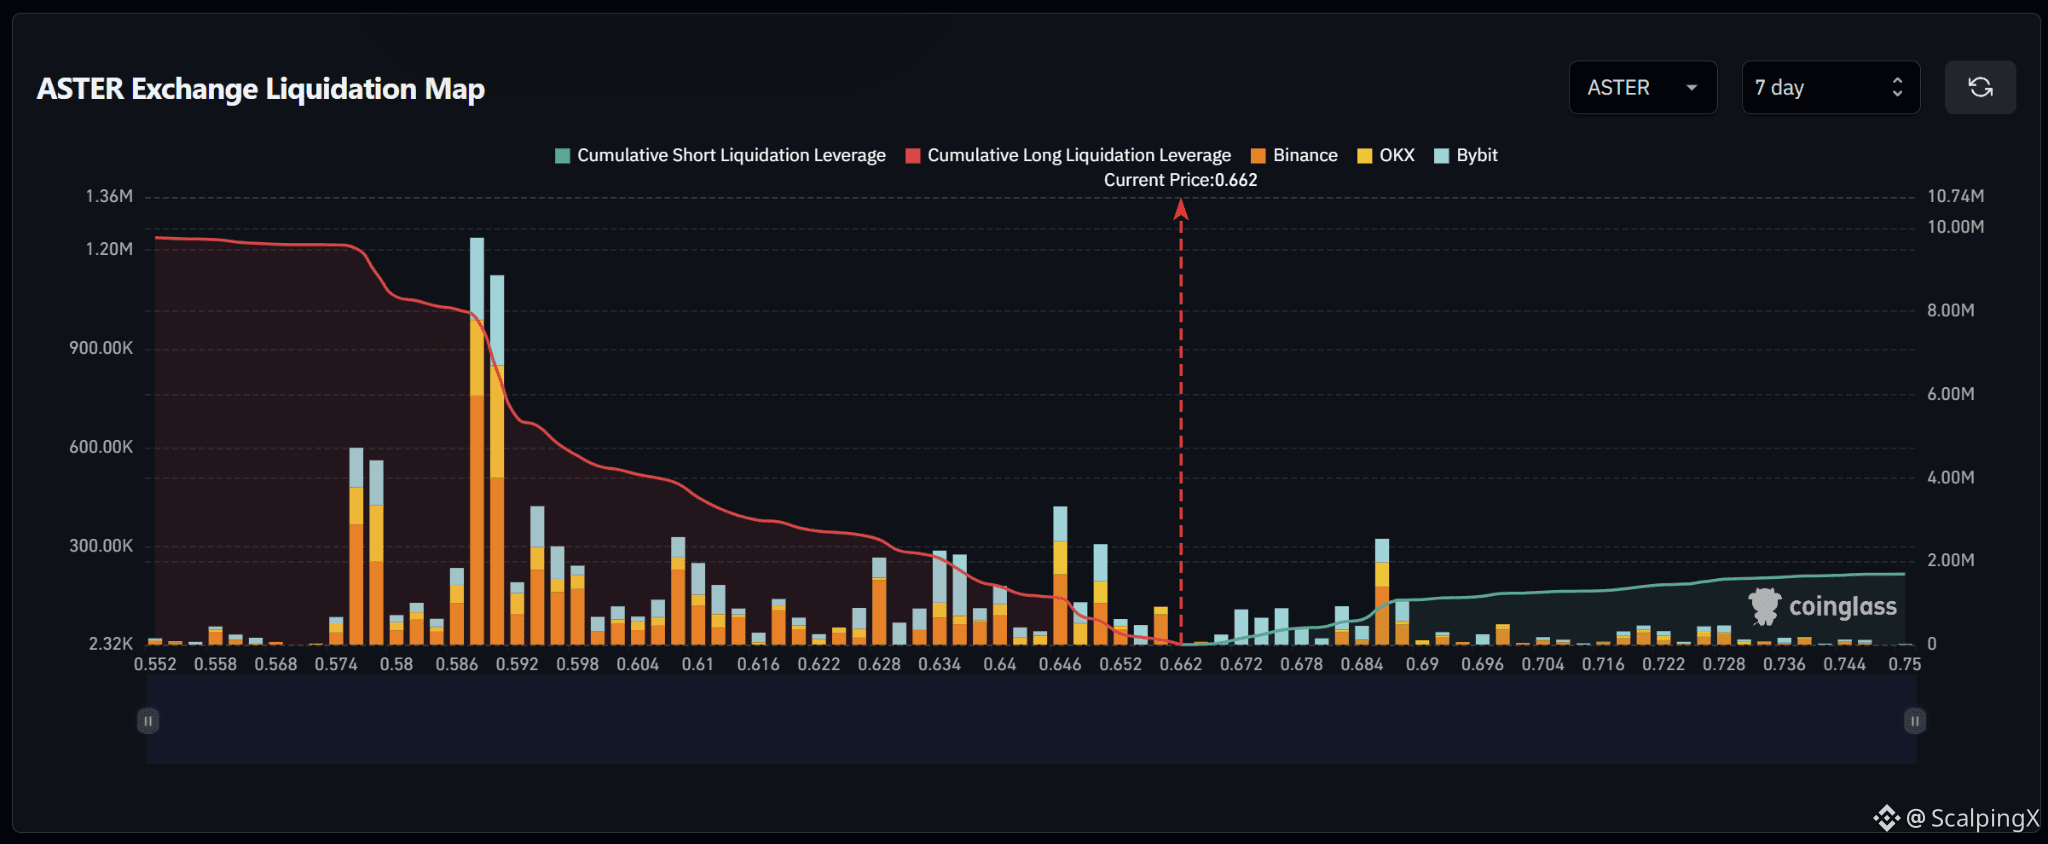
$ASTER – Liquidation Map (7 Days) – Current Price 0.662
🔎 The 7-day liquidation map shows nearly $10 million in long liquidations below the current price, far exceeding only around $1.5 million in short liquidations above. The liquidity structure therefore leans strongly to the downside, with most meaningful exposure concentrated at lower price levels.
📉 Below the market, nearby long-liquidation liquidity is concentrated around 0.652–0.640 and remains elevated across 0.634–0.628. The largest clusters sit much lower around 0.592–0.586, particularly near 0.586–0.590 where the strongest liquidation bars on the map appear. Losing 0.652 would increase the probability of a sweep toward 0.646–0.640.
📈 Above the market, short-liquidation liquidity remains relatively light around 0.672–0.678 and only becomes more significant across 0.684–0.690. The strongest nearby cluster sits around 0.684–0.686, while liquidity density drops considerably beyond 0.696. A break above 0.678 would bring 0.684–0.690 into focus.
🧭 The near-term setup strongly favors the downside because total long-liquidation exposure below is several times larger. Losing 0.652 would strengthen the probability of a sweep toward 0.646–0.640, while holding current levels and breaking 0.678 would shift attention toward a short-liquidation sweep across 0.684–0.690.
#LiquidationMap
🔎 The 7-day liquidation map shows nearly $10 million in long liquidations below the current price, far exceeding only around $1.5 million in short liquidations above. The liquidity structure therefore leans strongly to the downside, with most meaningful exposure concentrated at lower price levels.
📉 Below the market, nearby long-liquidation liquidity is concentrated around 0.652–0.640 and remains elevated across 0.634–0.628. The largest clusters sit much lower around 0.592–0.586, particularly near 0.586–0.590 where the strongest liquidation bars on the map appear. Losing 0.652 would increase the probability of a sweep toward 0.646–0.640.
📈 Above the market, short-liquidation liquidity remains relatively light around 0.672–0.678 and only becomes more significant across 0.684–0.690. The strongest nearby cluster sits around 0.684–0.686, while liquidity density drops considerably beyond 0.696. A break above 0.678 would bring 0.684–0.690 into focus.
🧭 The near-term setup strongly favors the downside because total long-liquidation exposure below is several times larger. Losing 0.652 would strengthen the probability of a sweep toward 0.646–0.640, while holding current levels and breaking 0.678 would shift attention toward a short-liquidation sweep across 0.684–0.690.
#LiquidationMap
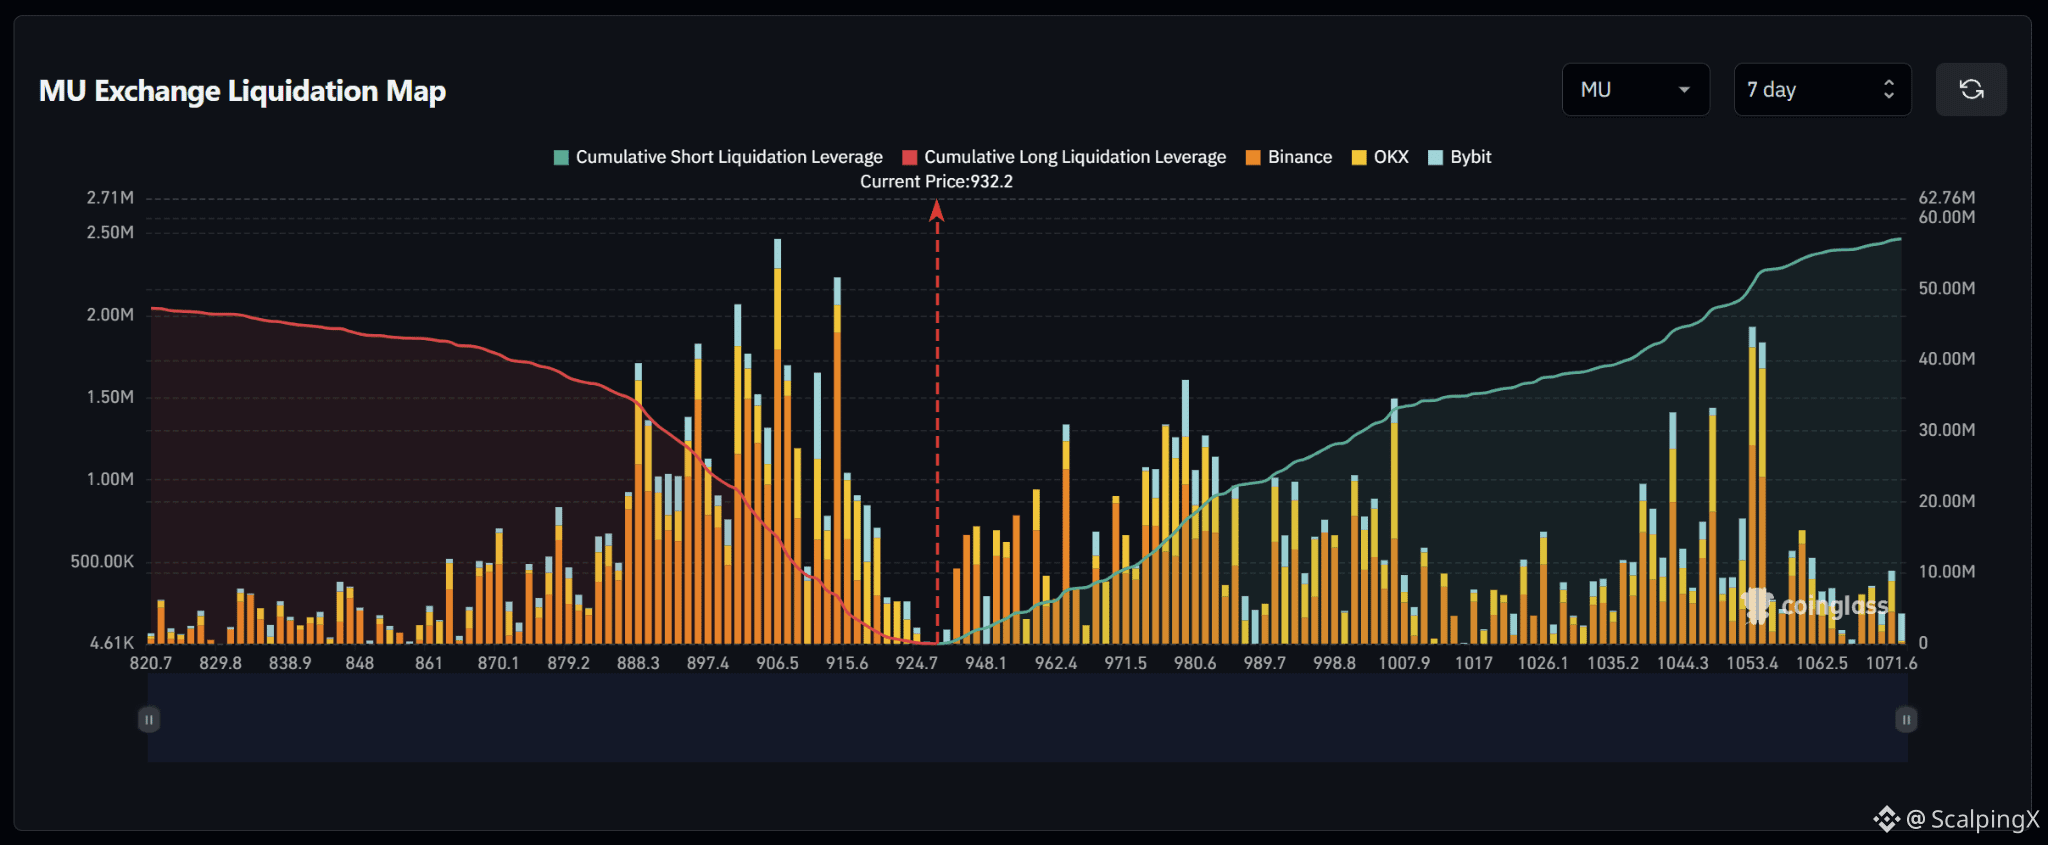
$MU – Liquidation Map (7 Days) – Current Price 932.2
🔎 The 7-day liquidation map shows roughly $58–60 million in short liquidations above the current price, exceeding approximately $46–48 million in long liquidations below. The liquidity structure therefore leans to the upside, although several major long-liquidation clusters remain relatively close below the market.
📈 Above the market, short-liquidation liquidity begins building around 948.1–962.4 and becomes denser across 971.5–989.7, with a notable concentration near 980.6. Further liquidity accumulates around 998.8–1,007.9 and strengthens again near 1,044.3–1,053.4. A break above 948.1 would bring 962.4–980.6 into focus.
📉 Below the market, long-liquidation liquidity is heavily concentrated around 924.7–897.4, with the strongest clusters near 915.6 and especially around 906.5. Liquidity remains elevated toward 897.4–888.3. Losing 924.7 would increase the probability of a sweep toward 915.6–906.5.
🧭 The near-term setup modestly favors the upside because total short-liquidation exposure above is larger. A break above 948.1 would shift focus toward 962.4–980.6, while losing 924.7 would strengthen the downside long-sweep scenario toward 915.6–906.5.
#LiquidationMap
🔎 The 7-day liquidation map shows roughly $58–60 million in short liquidations above the current price, exceeding approximately $46–48 million in long liquidations below. The liquidity structure therefore leans to the upside, although several major long-liquidation clusters remain relatively close below the market.
📈 Above the market, short-liquidation liquidity begins building around 948.1–962.4 and becomes denser across 971.5–989.7, with a notable concentration near 980.6. Further liquidity accumulates around 998.8–1,007.9 and strengthens again near 1,044.3–1,053.4. A break above 948.1 would bring 962.4–980.6 into focus.
📉 Below the market, long-liquidation liquidity is heavily concentrated around 924.7–897.4, with the strongest clusters near 915.6 and especially around 906.5. Liquidity remains elevated toward 897.4–888.3. Losing 924.7 would increase the probability of a sweep toward 915.6–906.5.
🧭 The near-term setup modestly favors the upside because total short-liquidation exposure above is larger. A break above 948.1 would shift focus toward 962.4–980.6, while losing 924.7 would strengthen the downside long-sweep scenario toward 915.6–906.5.
#LiquidationMap
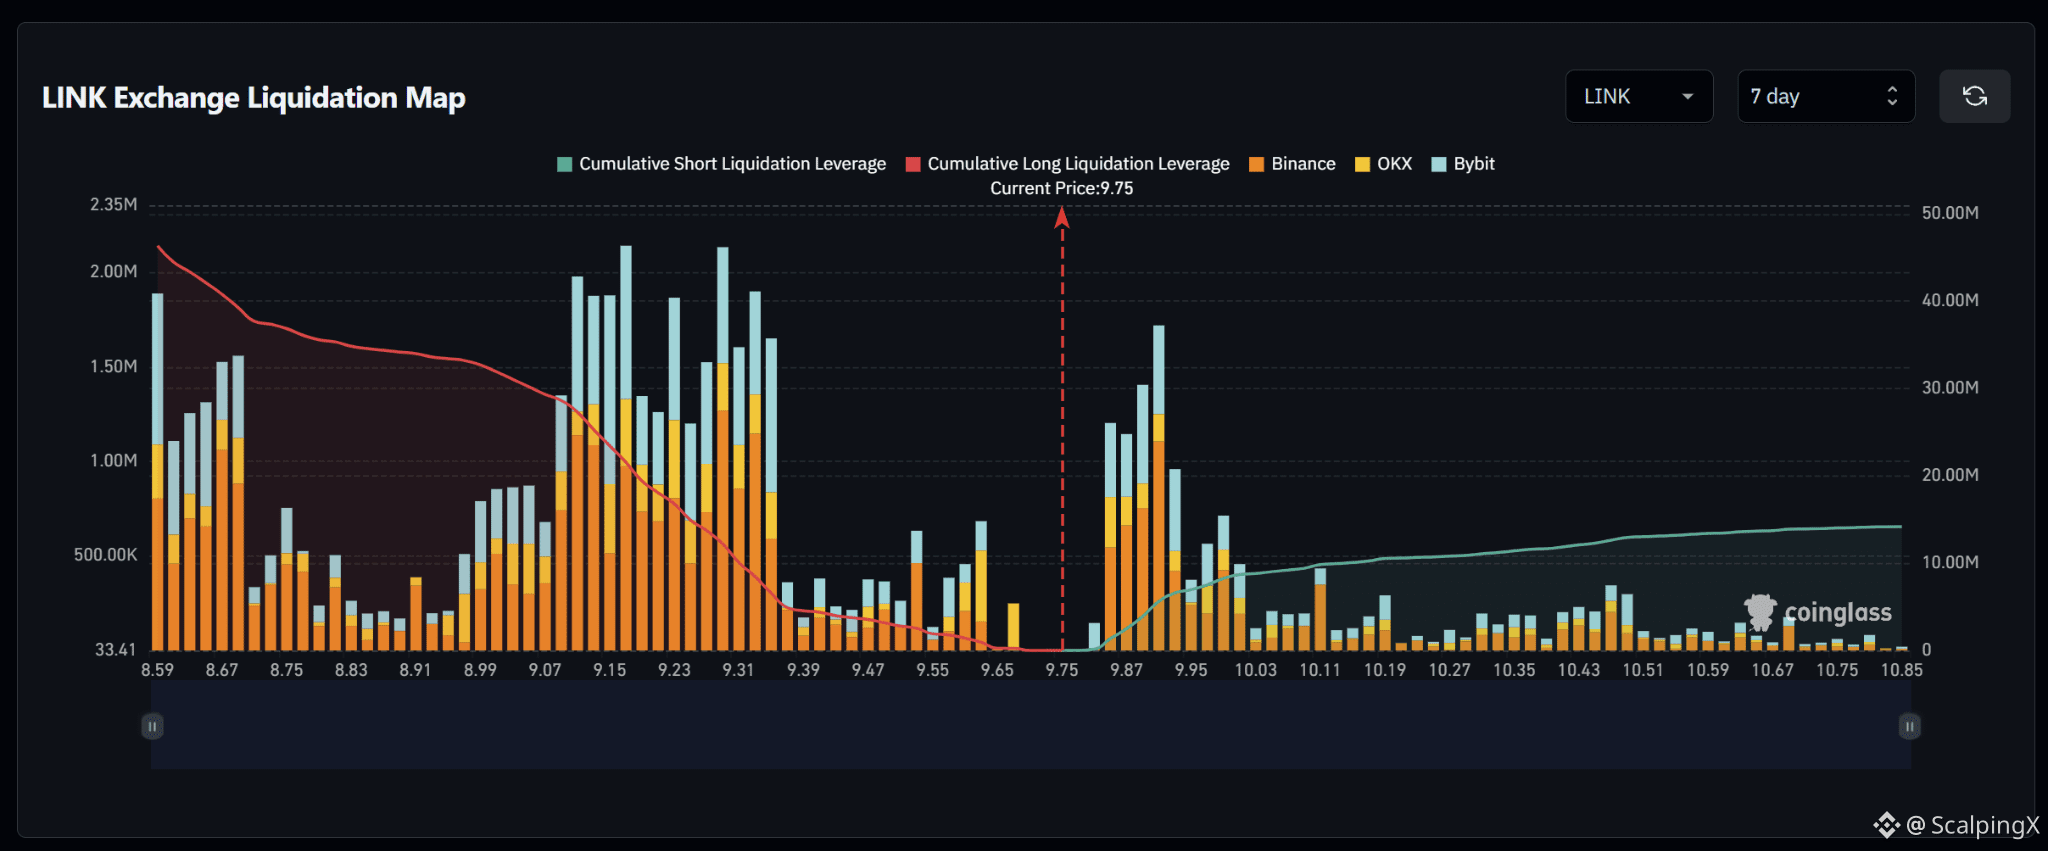
$LINK – Liquidation Map (7 Days) – Current Price 9.75
🔎 The 7-day liquidation map shows roughly $45 million in long liquidations below the current price, far exceeding approximately $12–13 million in short liquidations above. The liquidity structure therefore leans strongly to the downside, although a meaningful short-liquidation cluster still sits relatively close above the market.
📉 Below the market, nearby long-liquidation liquidity is concentrated around 9.65–9.55 before increasing sharply across 9.39–9.15. The strongest clusters sit near 9.31 and 9.15, while deeper liquidity remains elevated around 9.07–8.99. Losing 9.65 would increase the probability of a sweep toward 9.55–9.39.
📈 Above the market, short-liquidation liquidity begins building around 9.87 and is heavily concentrated across 9.87–9.95, with the strongest cluster near 9.91. Liquidity density drops significantly beyond 10.03, leaving only smaller clusters around 10.11 and 10.19. A break above 9.87 would bring 9.91–9.95 into focus.
🧭 The near-term setup favors the downside because total long-liquidation exposure below is roughly three to four times larger. Losing 9.65 would strengthen the probability of a sweep toward 9.55–9.39, while holding current levels and breaking 9.87 would shift attention toward a short-liquidation sweep across 9.91–9.95.
#LiquidationMap
🔎 The 7-day liquidation map shows roughly $45 million in long liquidations below the current price, far exceeding approximately $12–13 million in short liquidations above. The liquidity structure therefore leans strongly to the downside, although a meaningful short-liquidation cluster still sits relatively close above the market.
📉 Below the market, nearby long-liquidation liquidity is concentrated around 9.65–9.55 before increasing sharply across 9.39–9.15. The strongest clusters sit near 9.31 and 9.15, while deeper liquidity remains elevated around 9.07–8.99. Losing 9.65 would increase the probability of a sweep toward 9.55–9.39.
📈 Above the market, short-liquidation liquidity begins building around 9.87 and is heavily concentrated across 9.87–9.95, with the strongest cluster near 9.91. Liquidity density drops significantly beyond 10.03, leaving only smaller clusters around 10.11 and 10.19. A break above 9.87 would bring 9.91–9.95 into focus.
🧭 The near-term setup favors the downside because total long-liquidation exposure below is roughly three to four times larger. Losing 9.65 would strengthen the probability of a sweep toward 9.55–9.39, while holding current levels and breaking 9.87 would shift attention toward a short-liquidation sweep across 9.91–9.95.
#LiquidationMap
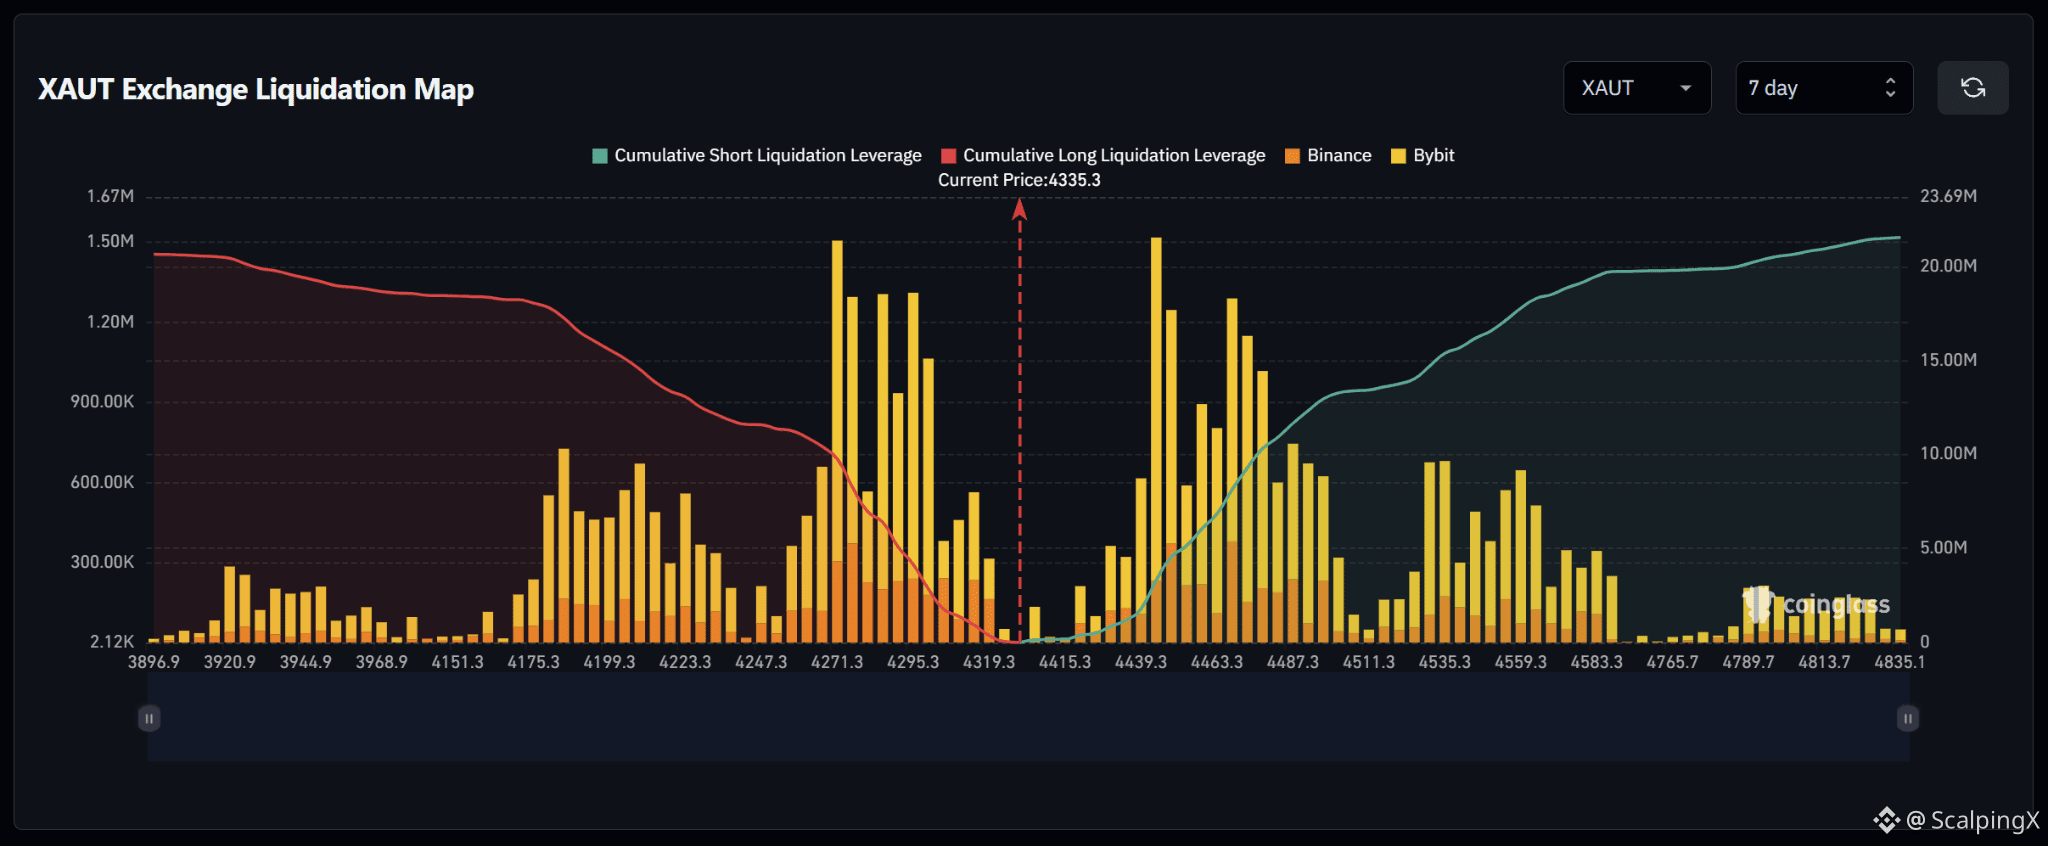
$XAUT – Liquidation Map (7 Days) – Current Price 4,335.3
🔎 The 7-day liquidation map shows relatively balanced short-liquidation exposure above and long-liquidation exposure below, both around $20–21 million, with upside liquidity slightly larger. The overall structure therefore remains fairly balanced, although sizable clusters sit on both sides of the current price.
📈 Above the market, short-liquidation liquidity begins building around 4,415.3–4,439.3 and becomes much denser across 4,439.3–4,487.3. The strongest nearby cluster sits around 4,439.3–4,463.3, with additional liquidity extending toward 4,487.3–4,511.3. A break above 4,415.3 would increase the probability of a sweep toward 4,439.3–4,463.3.
📉 Below the market, long-liquidation liquidity is heavily concentrated around 4,319.3–4,271.3, with the largest cluster near 4,271.3 and several notable concentrations around 4,295.3. Further downside liquidity remains elevated across 4,247.3–4,199.3. Losing 4,319.3 would increase the probability of a sweep toward 4,295.3–4,271.3.
🧭 The near-term setup is relatively balanced but modestly favors the upside because total short-liquidation exposure is slightly larger. A break above 4,415.3 would bring 4,439.3–4,487.3 into focus, while losing 4,319.3 would strengthen the downside long-sweep scenario toward 4,295.3–4,271.3.
#LiquidationMap
🔎 The 7-day liquidation map shows relatively balanced short-liquidation exposure above and long-liquidation exposure below, both around $20–21 million, with upside liquidity slightly larger. The overall structure therefore remains fairly balanced, although sizable clusters sit on both sides of the current price.
📈 Above the market, short-liquidation liquidity begins building around 4,415.3–4,439.3 and becomes much denser across 4,439.3–4,487.3. The strongest nearby cluster sits around 4,439.3–4,463.3, with additional liquidity extending toward 4,487.3–4,511.3. A break above 4,415.3 would increase the probability of a sweep toward 4,439.3–4,463.3.
📉 Below the market, long-liquidation liquidity is heavily concentrated around 4,319.3–4,271.3, with the largest cluster near 4,271.3 and several notable concentrations around 4,295.3. Further downside liquidity remains elevated across 4,247.3–4,199.3. Losing 4,319.3 would increase the probability of a sweep toward 4,295.3–4,271.3.
🧭 The near-term setup is relatively balanced but modestly favors the upside because total short-liquidation exposure is slightly larger. A break above 4,415.3 would bring 4,439.3–4,487.3 into focus, while losing 4,319.3 would strengthen the downside long-sweep scenario toward 4,295.3–4,271.3.
#LiquidationMap
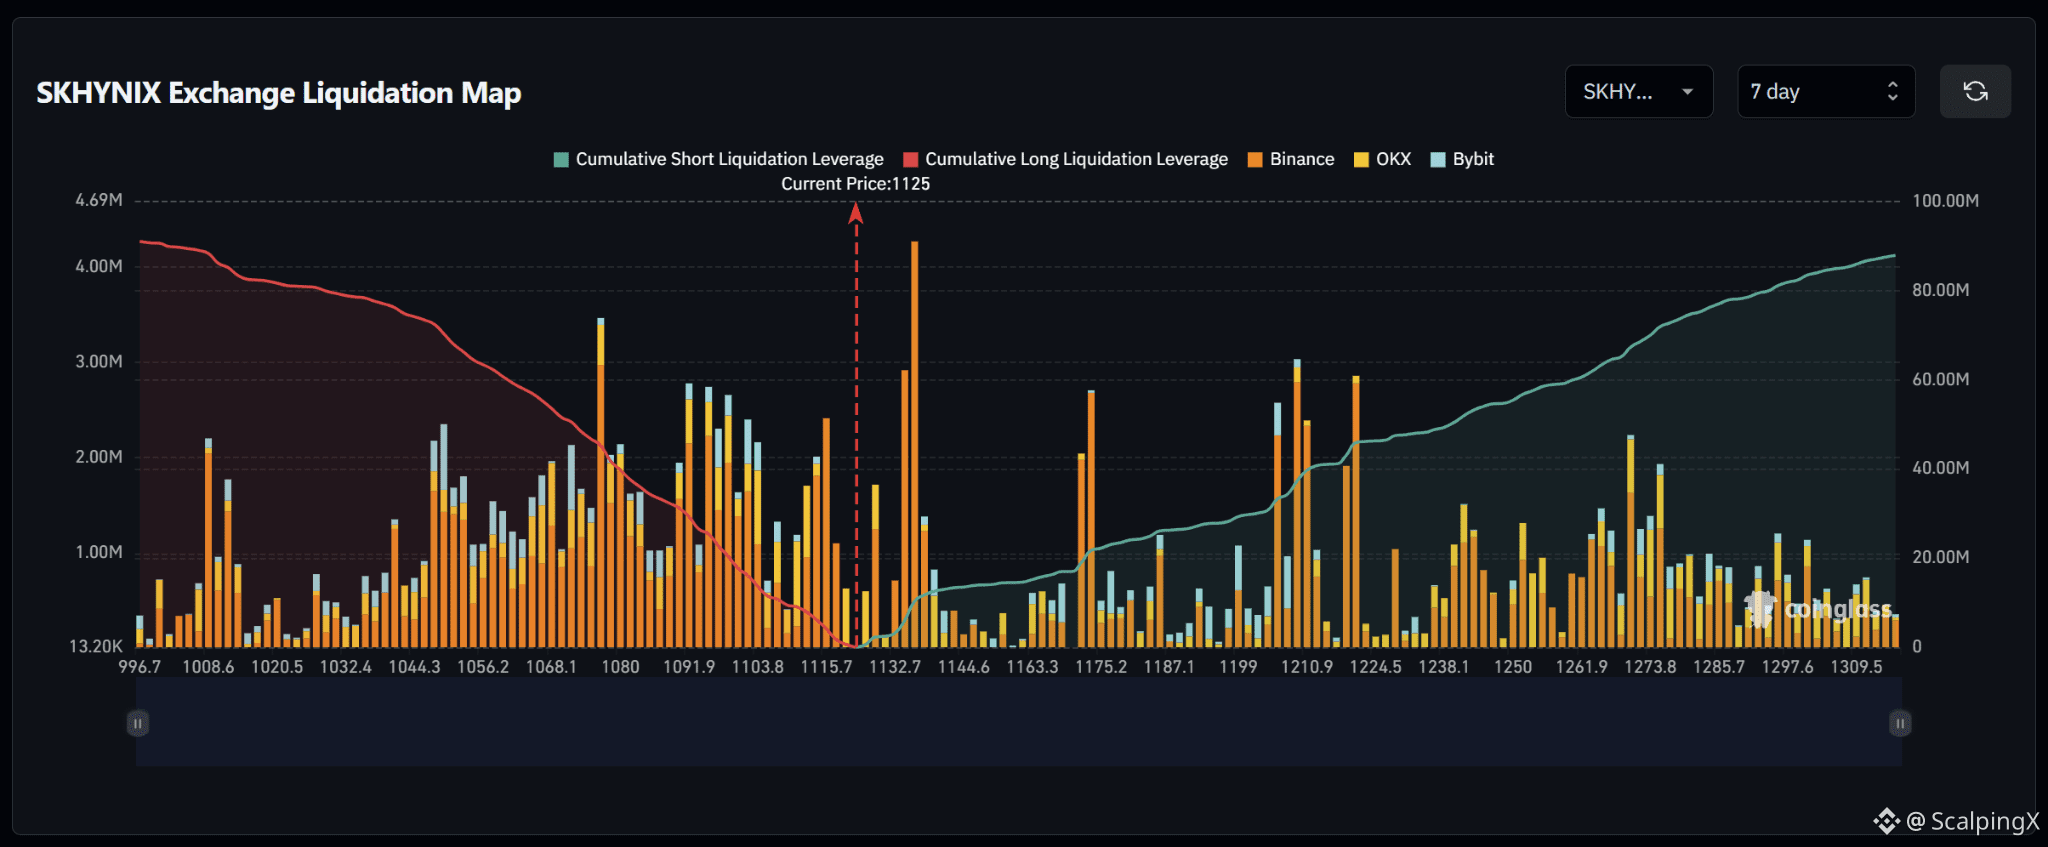
$SKHYNIX – Liquidation Map (7 Days) – Current Price 1,125
🔎 The 7-day liquidation map shows relatively balanced long-liquidation exposure below and short-liquidation exposure above, both around $85–90 million, with downside liquidity slightly larger. However, the largest nearby individual liquidation cluster sits immediately above the current price, creating potential upside attraction if current levels hold.
📉 Below the market, nearby long-liquidation liquidity is concentrated around 1,115.7–1,103.8 before becoming denser across 1,091.9–1,080. Further clusters appear around 1,068.1–1,044.3. Losing 1,115.7 would increase the probability of a sweep toward 1,103.8–1,091.9.
📈 Above the market, a major short-liquidation cluster stands out near 1,132.7, representing one of the largest individual bars on the map. Additional liquidity builds around 1,163.3–1,175.2 and especially across 1,199–1,224.5. A break above 1,132.7 would bring 1,163.3–1,175.2 into focus.
🧭 The near-term setup is relatively balanced. Holding above 1,125 and breaking 1,132.7 would tilt the setup toward a short-liquidation sweep into 1,163.3–1,175.2, while losing 1,115.7 would increase downside risk toward 1,103.8–1,091.9.
#LiquidationMap
🔎 The 7-day liquidation map shows relatively balanced long-liquidation exposure below and short-liquidation exposure above, both around $85–90 million, with downside liquidity slightly larger. However, the largest nearby individual liquidation cluster sits immediately above the current price, creating potential upside attraction if current levels hold.
📉 Below the market, nearby long-liquidation liquidity is concentrated around 1,115.7–1,103.8 before becoming denser across 1,091.9–1,080. Further clusters appear around 1,068.1–1,044.3. Losing 1,115.7 would increase the probability of a sweep toward 1,103.8–1,091.9.
📈 Above the market, a major short-liquidation cluster stands out near 1,132.7, representing one of the largest individual bars on the map. Additional liquidity builds around 1,163.3–1,175.2 and especially across 1,199–1,224.5. A break above 1,132.7 would bring 1,163.3–1,175.2 into focus.
🧭 The near-term setup is relatively balanced. Holding above 1,125 and breaking 1,132.7 would tilt the setup toward a short-liquidation sweep into 1,163.3–1,175.2, while losing 1,115.7 would increase downside risk toward 1,103.8–1,091.9.
#LiquidationMap
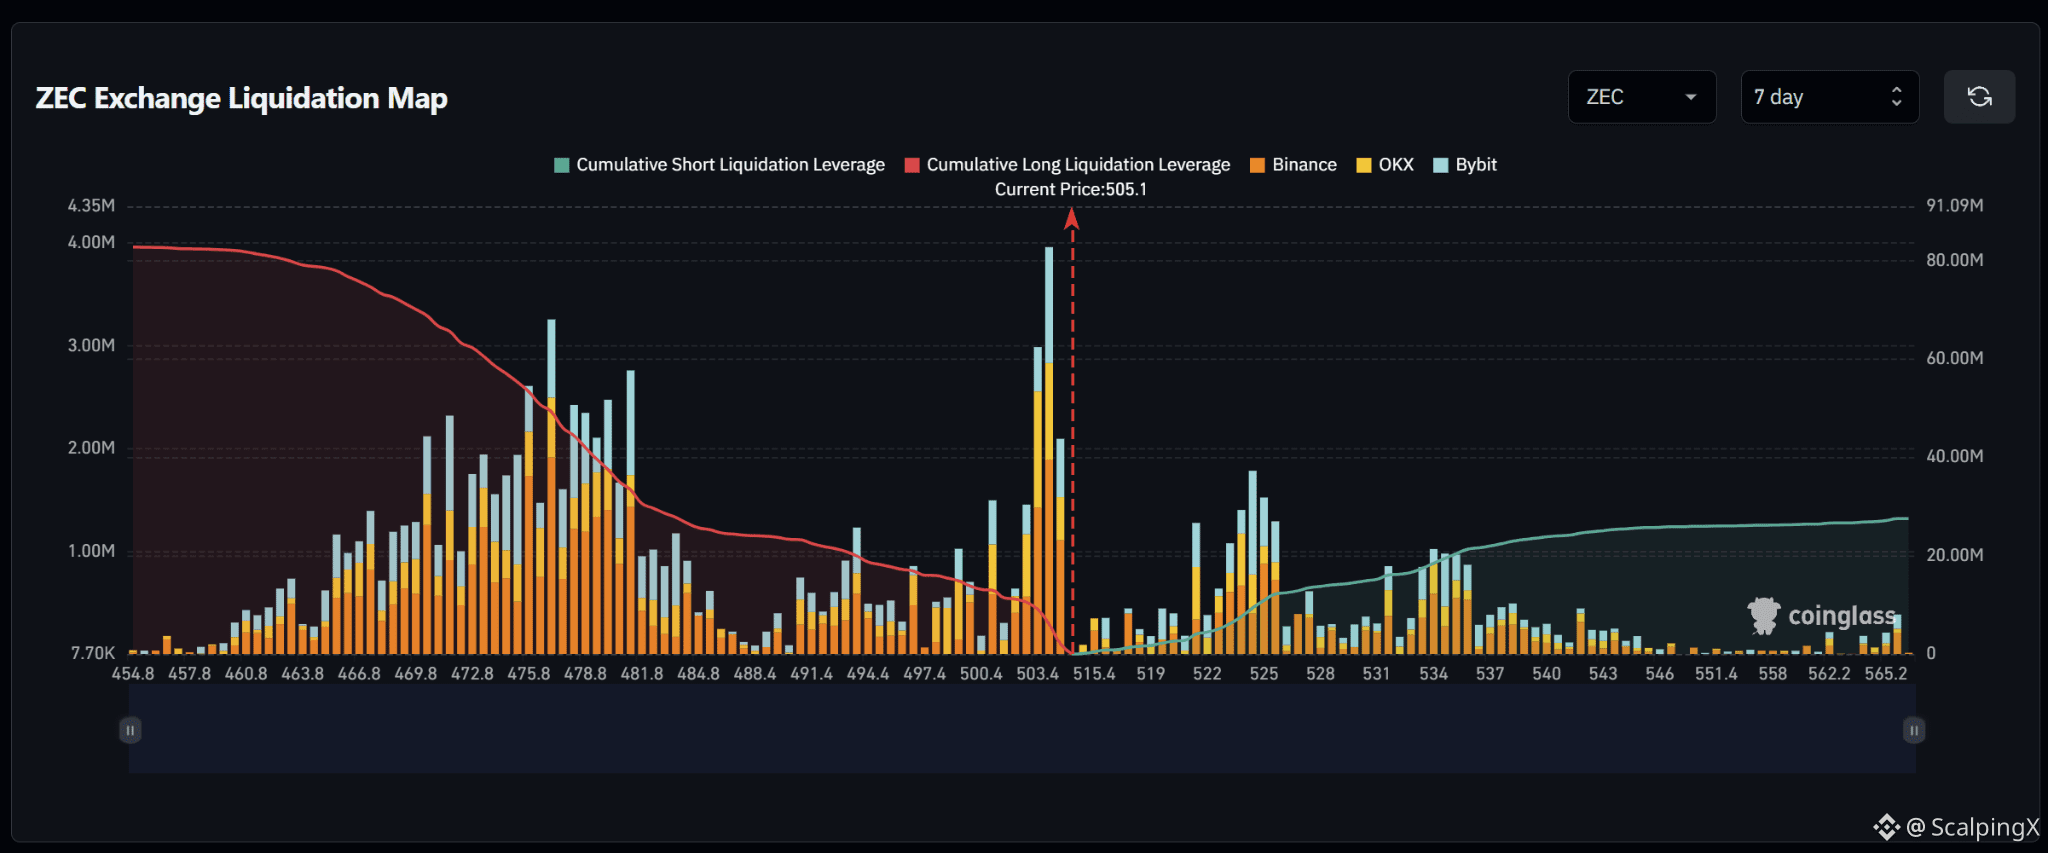
$ZEC – Liquidation Map (7 Days) – Current Price 505.1
🔎 The 7-day liquidation map shows roughly $80 million in long liquidations below the current price, far exceeding approximately $25 million in short liquidations above. The liquidity structure therefore leans strongly to the downside, while the largest long-liquidation cluster also sits immediately below the market.
📉 Below the market, long-liquidation liquidity is heavily concentrated around 503.4–500.4, with the cluster near 503.4 standing out as one of the largest on the entire map. Additional downside liquidity remains dense across 497.4–491.4 and especially around 481.8–475.8. Losing 503.4 would increase the probability of a sweep toward 500.4–497.4.
📈 Above the market, nearby short-liquidation liquidity remains relatively light across 515.4–519 before increasing significantly around 522–525. Another major cluster sits around 531–534. A break above 519 would bring 522–525 into focus, followed by 531–534.
🧭 The near-term setup favors the downside because total long-liquidation exposure below is roughly three times larger and the 503.4 cluster sits very close. Losing 503.4 would strengthen the probability of a move toward 500.4–497.4, while holding current levels and breaking 519 would shift attention toward short liquidations across 522–525.
#LiquidationMap
🔎 The 7-day liquidation map shows roughly $80 million in long liquidations below the current price, far exceeding approximately $25 million in short liquidations above. The liquidity structure therefore leans strongly to the downside, while the largest long-liquidation cluster also sits immediately below the market.
📉 Below the market, long-liquidation liquidity is heavily concentrated around 503.4–500.4, with the cluster near 503.4 standing out as one of the largest on the entire map. Additional downside liquidity remains dense across 497.4–491.4 and especially around 481.8–475.8. Losing 503.4 would increase the probability of a sweep toward 500.4–497.4.
📈 Above the market, nearby short-liquidation liquidity remains relatively light across 515.4–519 before increasing significantly around 522–525. Another major cluster sits around 531–534. A break above 519 would bring 522–525 into focus, followed by 531–534.
🧭 The near-term setup favors the downside because total long-liquidation exposure below is roughly three times larger and the 503.4 cluster sits very close. Losing 503.4 would strengthen the probability of a move toward 500.4–497.4, while holding current levels and breaking 519 would shift attention toward short liquidations across 522–525.
#LiquidationMap
ເຂົ້າສູ່ລະບົບເພື່ອສຳຫຼວດເນື້ອຫາເພີ່ມເຕີມ