
#ema
ema
362,123 ຄັ້ງທີ່ເບິ່ງ
904 ກຳລັງສົນທະນາ
ມາແຮງ
ຫຼ້າສຸດ

·
--
The EMA200 bounce. Every chart guy draws it. Does it actually work? 🤔
I checked touches of the 200 EMA from above on 4h charts.
The touch by itself: roughly nothing. Sometimes it bounces, sometimes it slices right through.
Add two conditions and it changes:
• the EMA itself rose 1.66%+ over the last 4 days
• the overall market is bullish
769 cases. Average after 24h: +2.27%. Take profit hit before stop in 63% of cases. On fresh data it got weaker (+1.56%) but stayed positive.
So the line isn't magic. The context is. A pullback in an uptrend ≠ a touch in a downtrend.
#trading #EMA #crypto
The EMA200 bounce. Every chart guy draws it. Does it actually work? 🤔
I checked touches of the 200 EMA from above on 4h charts.
The touch by itself: roughly nothing. Sometimes it bounces, sometimes it slices right through.
Add two conditions and it changes:
• the EMA itself rose 1.66%+ over the last 4 days
• the overall market is bullish
769 cases. Average after 24h: +2.27%. Take profit hit before stop in 63% of cases. On fresh data it got weaker (+1.56%) but stayed positive.
So the line isn't magic. The context is. A pullback in an uptrend ≠ a touch in a downtrend.
#trading #EMA #crypto
I checked touches of the 200 EMA from above on 4h charts.
The touch by itself: roughly nothing. Sometimes it bounces, sometimes it slices right through.
Add two conditions and it changes:
• the EMA itself rose 1.66%+ over the last 4 days
• the overall market is bullish
769 cases. Average after 24h: +2.27%. Take profit hit before stop in 63% of cases. On fresh data it got weaker (+1.56%) but stayed positive.
So the line isn't magic. The context is. A pullback in an uptrend ≠ a touch in a downtrend.
#trading #EMA #crypto
5

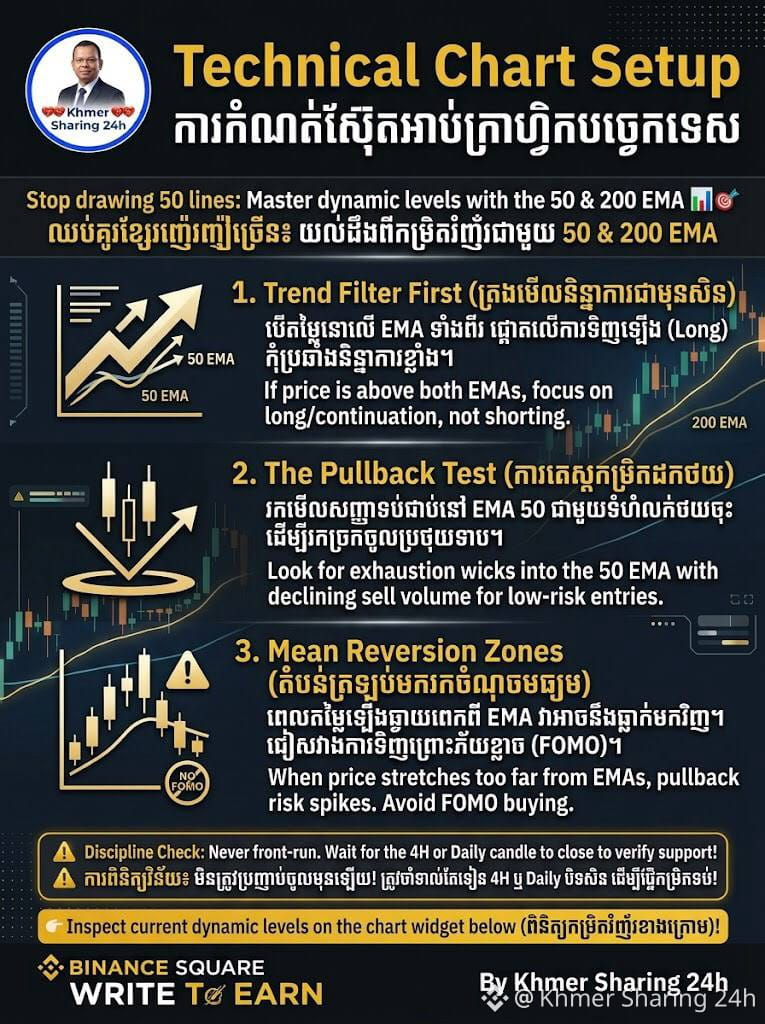
Technical Chart Setup (Dynamic Support & Resistance Confluence)
Stop drawing 50 lines: Master dynamic levels with the 50 & 200 EMA 📊🎯
A cluttered chart leads to analysis paralysis. When evaluating higher timeframe setups (4H or Daily), dynamic moving averages often provide far clearer trend validation than dozens of arbitrary horizontal trendlines.
Here is how to read price interaction around key dynamic EMAs:
Trend Filter First: If price is consistently printing candles above both the 50 EMA and 200 EMA, look primarily for long/continuation structures rather than shorting strong momentum.
The Pullback Test: In a healthy trend, the 50 EMA acts as a dynamic trampoline. Look for exhaustion wicks into the 50 EMA combined with declining sell volume to spot low-risk continuation entries.
Mean Reversion Zones: When price stretches too far above both moving averages without a retest, the risk of a sharp mean-reversion pullback spikes.
Avoid FOMO buying at extended distances from dynamic support.
⚠️ Discipline Check: Never front-run an entry. Always wait for the daily or 4H candle to close to verify whether dynamic support held or broke down.
👇 Inspect current dynamic levels on the chart widget below:
(Insert BTC orETH Coin Widget here)
Which indicator setup is non-negotiable on your daily chart layout? Drop your favorite combination! 💬
@Binance_Square_Official @BinanceKhmer
#TechnicalAnalysis #ema #priceaction #Write2Earn
Technical Chart Setup (Dynamic Support & Resistance Confluence)
Stop drawing 50 lines: Master dynamic levels with the 50 & 200 EMA 📊🎯
A cluttered chart leads to analysis paralysis. When evaluating higher timeframe setups (4H or Daily), dynamic moving averages often provide far clearer trend validation than dozens of arbitrary horizontal trendlines.
Here is how to read price interaction around key dynamic EMAs:
Trend Filter First: If price is consistently printing candles above both the 50 EMA and 200 EMA, look primarily for long/continuation structures rather than shorting strong momentum.
The Pullback Test: In a healthy trend, the 50 EMA acts as a dynamic trampoline. Look for exhaustion wicks into the 50 EMA combined with declining sell volume to spot low-risk continuation entries.
Mean Reversion Zones: When price stretches too far above both moving averages without a retest, the risk of a sharp mean-reversion pullback spikes.
Avoid FOMO buying at extended distances from dynamic support.
⚠️ Discipline Check: Never front-run an entry. Always wait for the daily or 4H candle to close to verify whether dynamic support held or broke down.
👇 Inspect current dynamic levels on the chart widget below:
(Insert BTC orETH Coin Widget here)
Which indicator setup is non-negotiable on your daily chart layout? Drop your favorite combination! 💬
@Binance Square Official @Binance Khmer
#TechnicalAnalysis #ema #priceaction #Write2Earn
Stop drawing 50 lines: Master dynamic levels with the 50 & 200 EMA 📊🎯
A cluttered chart leads to analysis paralysis. When evaluating higher timeframe setups (4H or Daily), dynamic moving averages often provide far clearer trend validation than dozens of arbitrary horizontal trendlines.
Here is how to read price interaction around key dynamic EMAs:
Trend Filter First: If price is consistently printing candles above both the 50 EMA and 200 EMA, look primarily for long/continuation structures rather than shorting strong momentum.
The Pullback Test: In a healthy trend, the 50 EMA acts as a dynamic trampoline. Look for exhaustion wicks into the 50 EMA combined with declining sell volume to spot low-risk continuation entries.
Mean Reversion Zones: When price stretches too far above both moving averages without a retest, the risk of a sharp mean-reversion pullback spikes.
Avoid FOMO buying at extended distances from dynamic support.
⚠️ Discipline Check: Never front-run an entry. Always wait for the daily or 4H candle to close to verify whether dynamic support held or broke down.
👇 Inspect current dynamic levels on the chart widget below:
(Insert BTC orETH Coin Widget here)
Which indicator setup is non-negotiable on your daily chart layout? Drop your favorite combination! 💬
@Binance Square Official @Binance Khmer
#TechnicalAnalysis #ema #priceaction #Write2Earn
Vandy_Crypto_6BTC66:
Good post
1
1
2
117

EMA: Why Price Below Moving Averages Matters
Exponential Moving Averages give more weight to recent prices than simple moving averages.
When price trades below key EMAs, it is commonly interpreted as a sign of short-term weakness.
The 10 November technical report described SHELL as trading below several moving averages. This supports a cautious trend assessment, although EMAs are lagging indicators and cannot predict the next move.
#EMA #MovingAverages #SHELL
EMA: Why Price Below Moving Averages Matters
Exponential Moving Averages give more weight to recent prices than simple moving averages.
When price trades below key EMAs, it is commonly interpreted as a sign of short-term weakness.
The 10 November technical report described SHELL as trading below several moving averages. This supports a cautious trend assessment, although EMAs are lagging indicators and cannot predict the next move.
#EMA #MovingAverages #SHELL
Exponential Moving Averages give more weight to recent prices than simple moving averages.
When price trades below key EMAs, it is commonly interpreted as a sign of short-term weakness.
The 10 November technical report described SHELL as trading below several moving averages. This supports a cautious trend assessment, although EMAs are lagging indicators and cannot predict the next move.
#EMA #MovingAverages #SHELL
1

·
--
🧠 ¿Por qué todos hablan de la "EMA 200"? Porque es la frontera más vigilada entre tendencia alcista y bajista.
📘 Qué es: la media móvil exponencial de los últimos 200 cierres diarios. Da más peso a los precios recientes y resume la tendencia de largo plazo.
• Precio encima → sesgo alcista de fondo
• Precio debajo → sesgo bajista de fondo
📊 Así está hoy (cierre diario vs. EMA 200, Binance):
• $BTC: 74.824 $ vs. 74.895 $ → justo sobre la línea (−0,1 %)
• $ETH: 2.126 $ vs. 2.240 $ → debajo (−5,1 %)
• $BNB: 685,5 $ vs. 679,6 $ → apenas encima (+0,9 %)
• PEPE: +33 % por encima → la más fuerte del grupo
❌ Error común: tomar un solo toque o una mecha como cambio de tendencia. Lo que cuenta es el cierre diario y que se sostenga. Ejemplo real: ETH estaba "apenas debajo" el domingo por la mañana y el cierre lo confirmó con fuerza (−5,1 %).
💡 Úsala mejor así: como zona, no como línea exacta, y combinada con volumen y RSI.
📝 En 1 línea: la EMA 200 no predice, pero te dice de qué lado del mercado estás.
¿Miras la EMA 200 antes de operar? SÍ / NO 👇
#EMA #AnalisisTecnico #AprendeCripto #Binance #Tra100d
⚠️ Contenido solo informativo y educativo, no es asesoría financiera. Las criptomonedas son volátiles: investiga y opera con precaución.
🧠 ¿Por qué todos hablan de la "EMA 200"? Porque es la frontera más vigilada entre tendencia alcista y bajista.
📘 Qué es: la media móvil exponencial de los últimos 200 cierres diarios. Da más peso a los precios recientes y resume la tendencia de largo plazo.
• Precio encima → sesgo alcista de fondo
• Precio debajo → sesgo bajista de fondo
📊 Así está hoy (cierre diario vs. EMA 200, Binance):
• $BTC: 74.824 $ vs. 74.895 $ → justo sobre la línea (−0,1 %)
• $ETH: 2.126 $ vs. 2.240 $ → debajo (−5,1 %)
• $BNB: 685,5 $ vs. 679,6 $ → apenas encima (+0,9 %)
• PEPE: +33 % por encima → la más fuerte del grupo
❌ Error común: tomar un solo toque o una mecha como cambio de tendencia. Lo que cuenta es el cierre diario y que se sostenga. Ejemplo real: ETH estaba "apenas debajo" el domingo por la mañana y el cierre lo confirmó con fuerza (−5,1 %).
💡 Úsala mejor así: como zona, no como línea exacta, y combinada con volumen y RSI.
📝 En 1 línea: la EMA 200 no predice, pero te dice de qué lado del mercado estás.
¿Miras la EMA 200 antes de operar? SÍ / NO 👇
#EMA #AnalisisTecnico #AprendeCripto #Binance #Tra100d
⚠️ Contenido solo informativo y educativo, no es asesoría financiera. Las criptomonedas son volátiles: investiga y opera con precaución.
📘 Qué es: la media móvil exponencial de los últimos 200 cierres diarios. Da más peso a los precios recientes y resume la tendencia de largo plazo.
• Precio encima → sesgo alcista de fondo
• Precio debajo → sesgo bajista de fondo
📊 Así está hoy (cierre diario vs. EMA 200, Binance):
• $BTC: 74.824 $ vs. 74.895 $ → justo sobre la línea (−0,1 %)
• $ETH: 2.126 $ vs. 2.240 $ → debajo (−5,1 %)
• $BNB: 685,5 $ vs. 679,6 $ → apenas encima (+0,9 %)
• PEPE: +33 % por encima → la más fuerte del grupo
❌ Error común: tomar un solo toque o una mecha como cambio de tendencia. Lo que cuenta es el cierre diario y que se sostenga. Ejemplo real: ETH estaba "apenas debajo" el domingo por la mañana y el cierre lo confirmó con fuerza (−5,1 %).
💡 Úsala mejor así: como zona, no como línea exacta, y combinada con volumen y RSI.
📝 En 1 línea: la EMA 200 no predice, pero te dice de qué lado del mercado estás.
¿Miras la EMA 200 antes de operar? SÍ / NO 👇
#EMA #AnalisisTecnico #AprendeCripto #Binance #Tra100d
⚠️ Contenido solo informativo y educativo, no es asesoría financiera. Las criptomonedas son volátiles: investiga y opera con precaución.
62

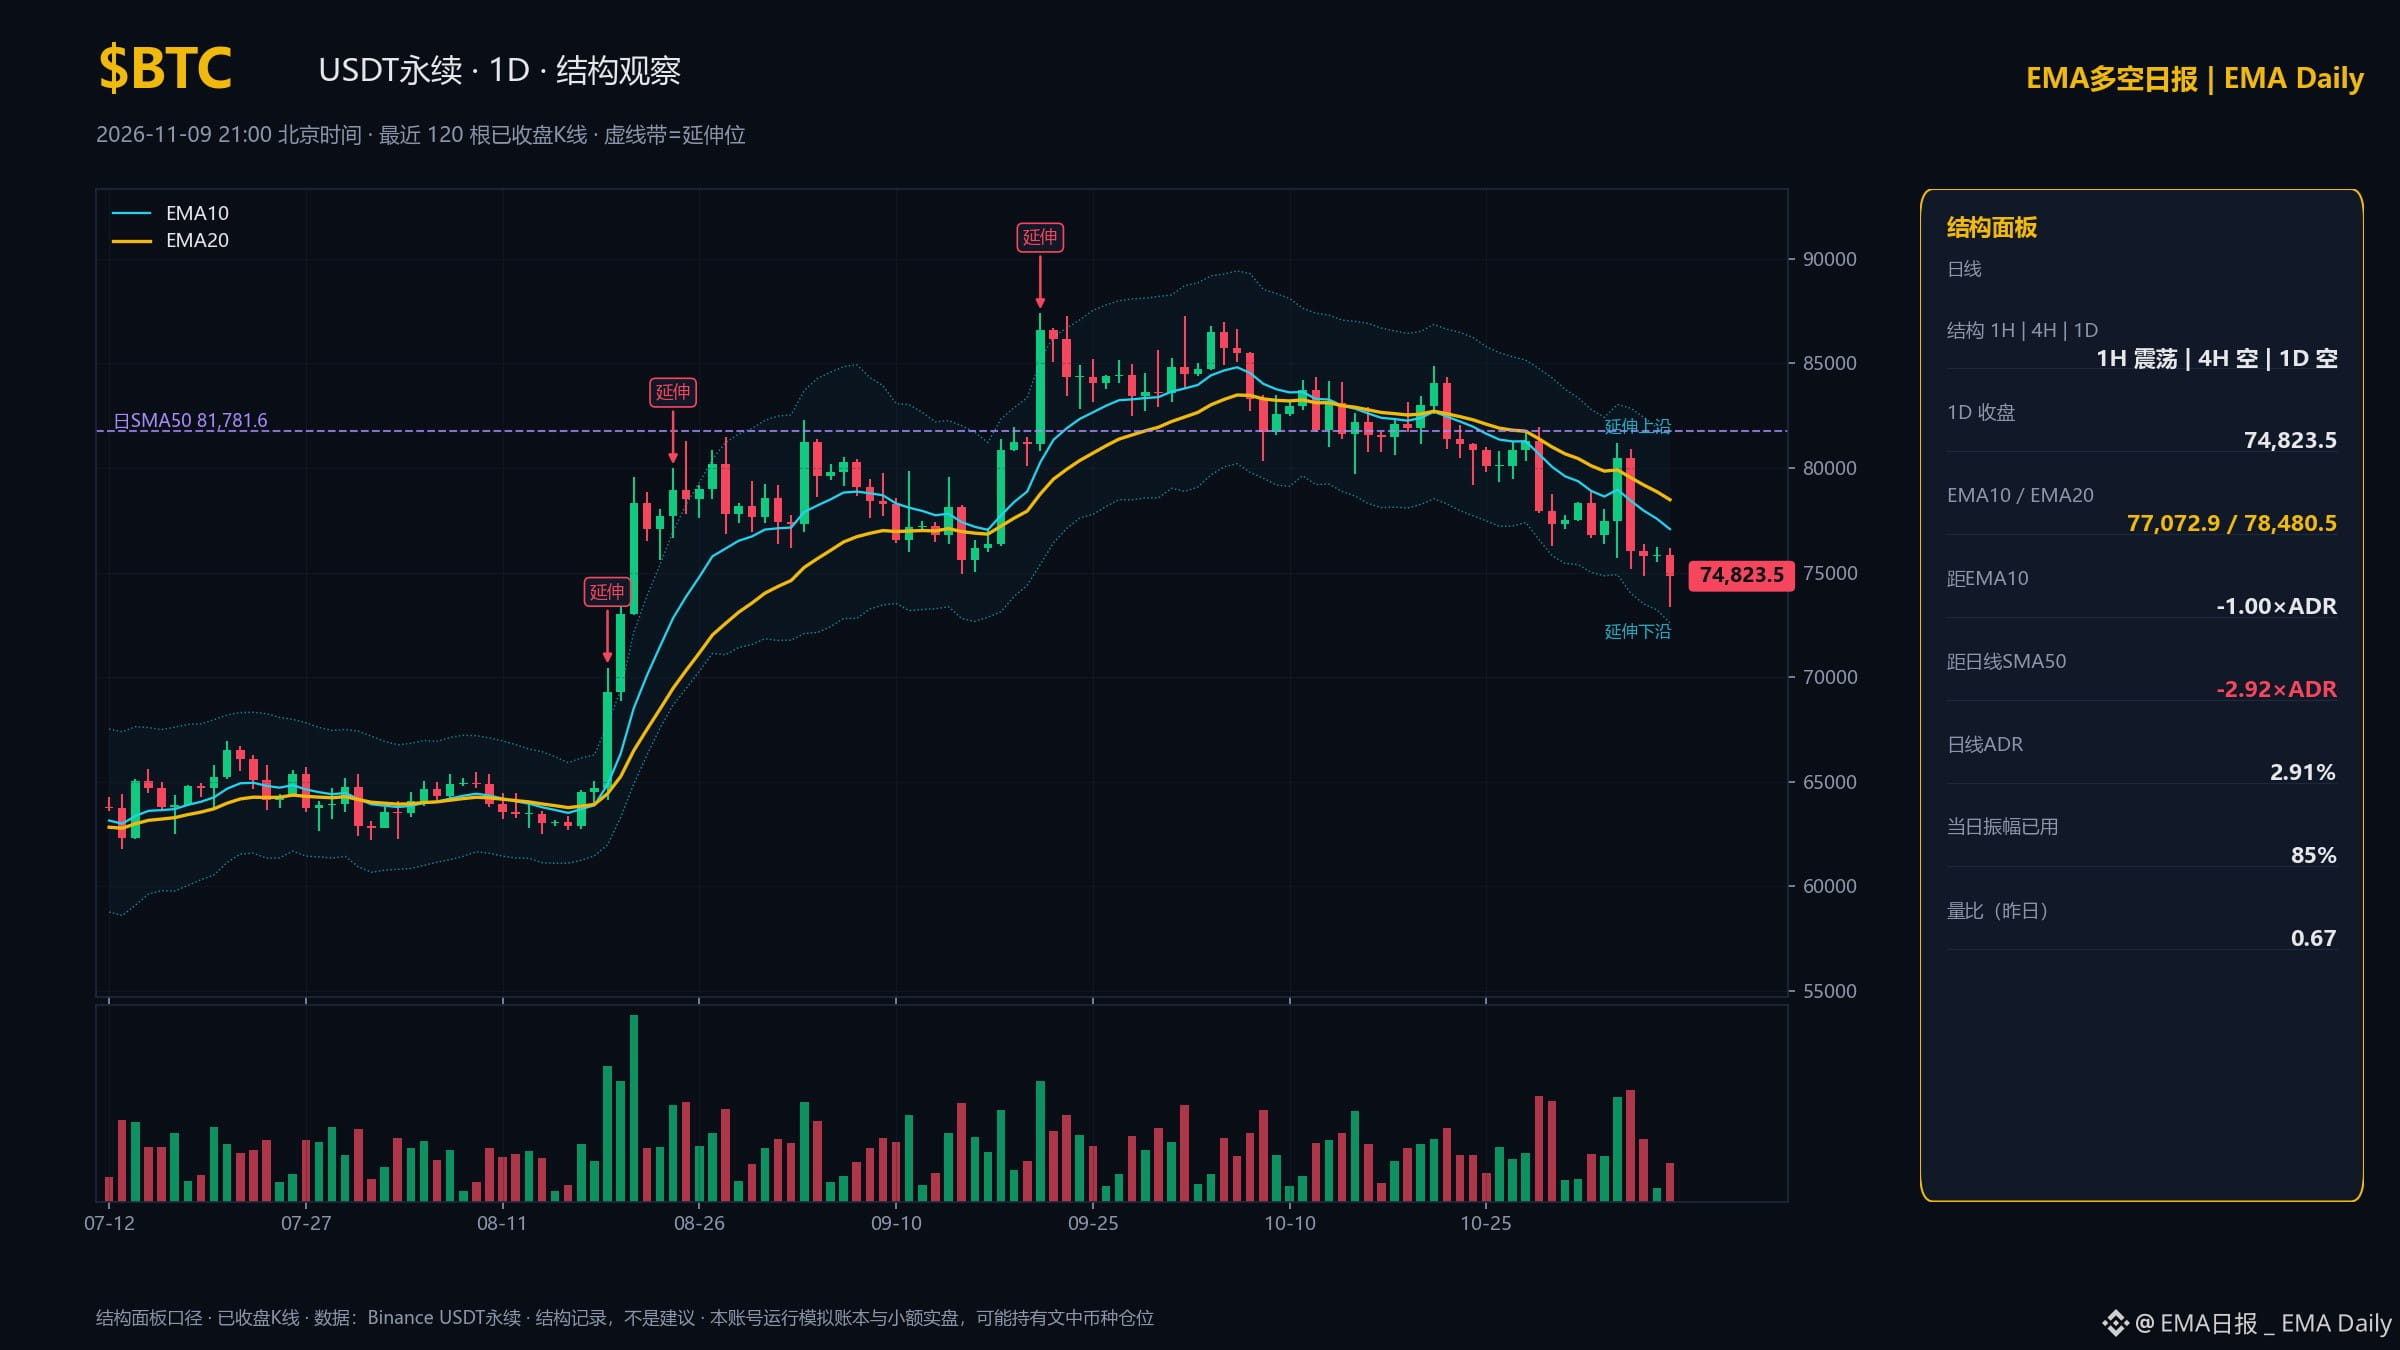
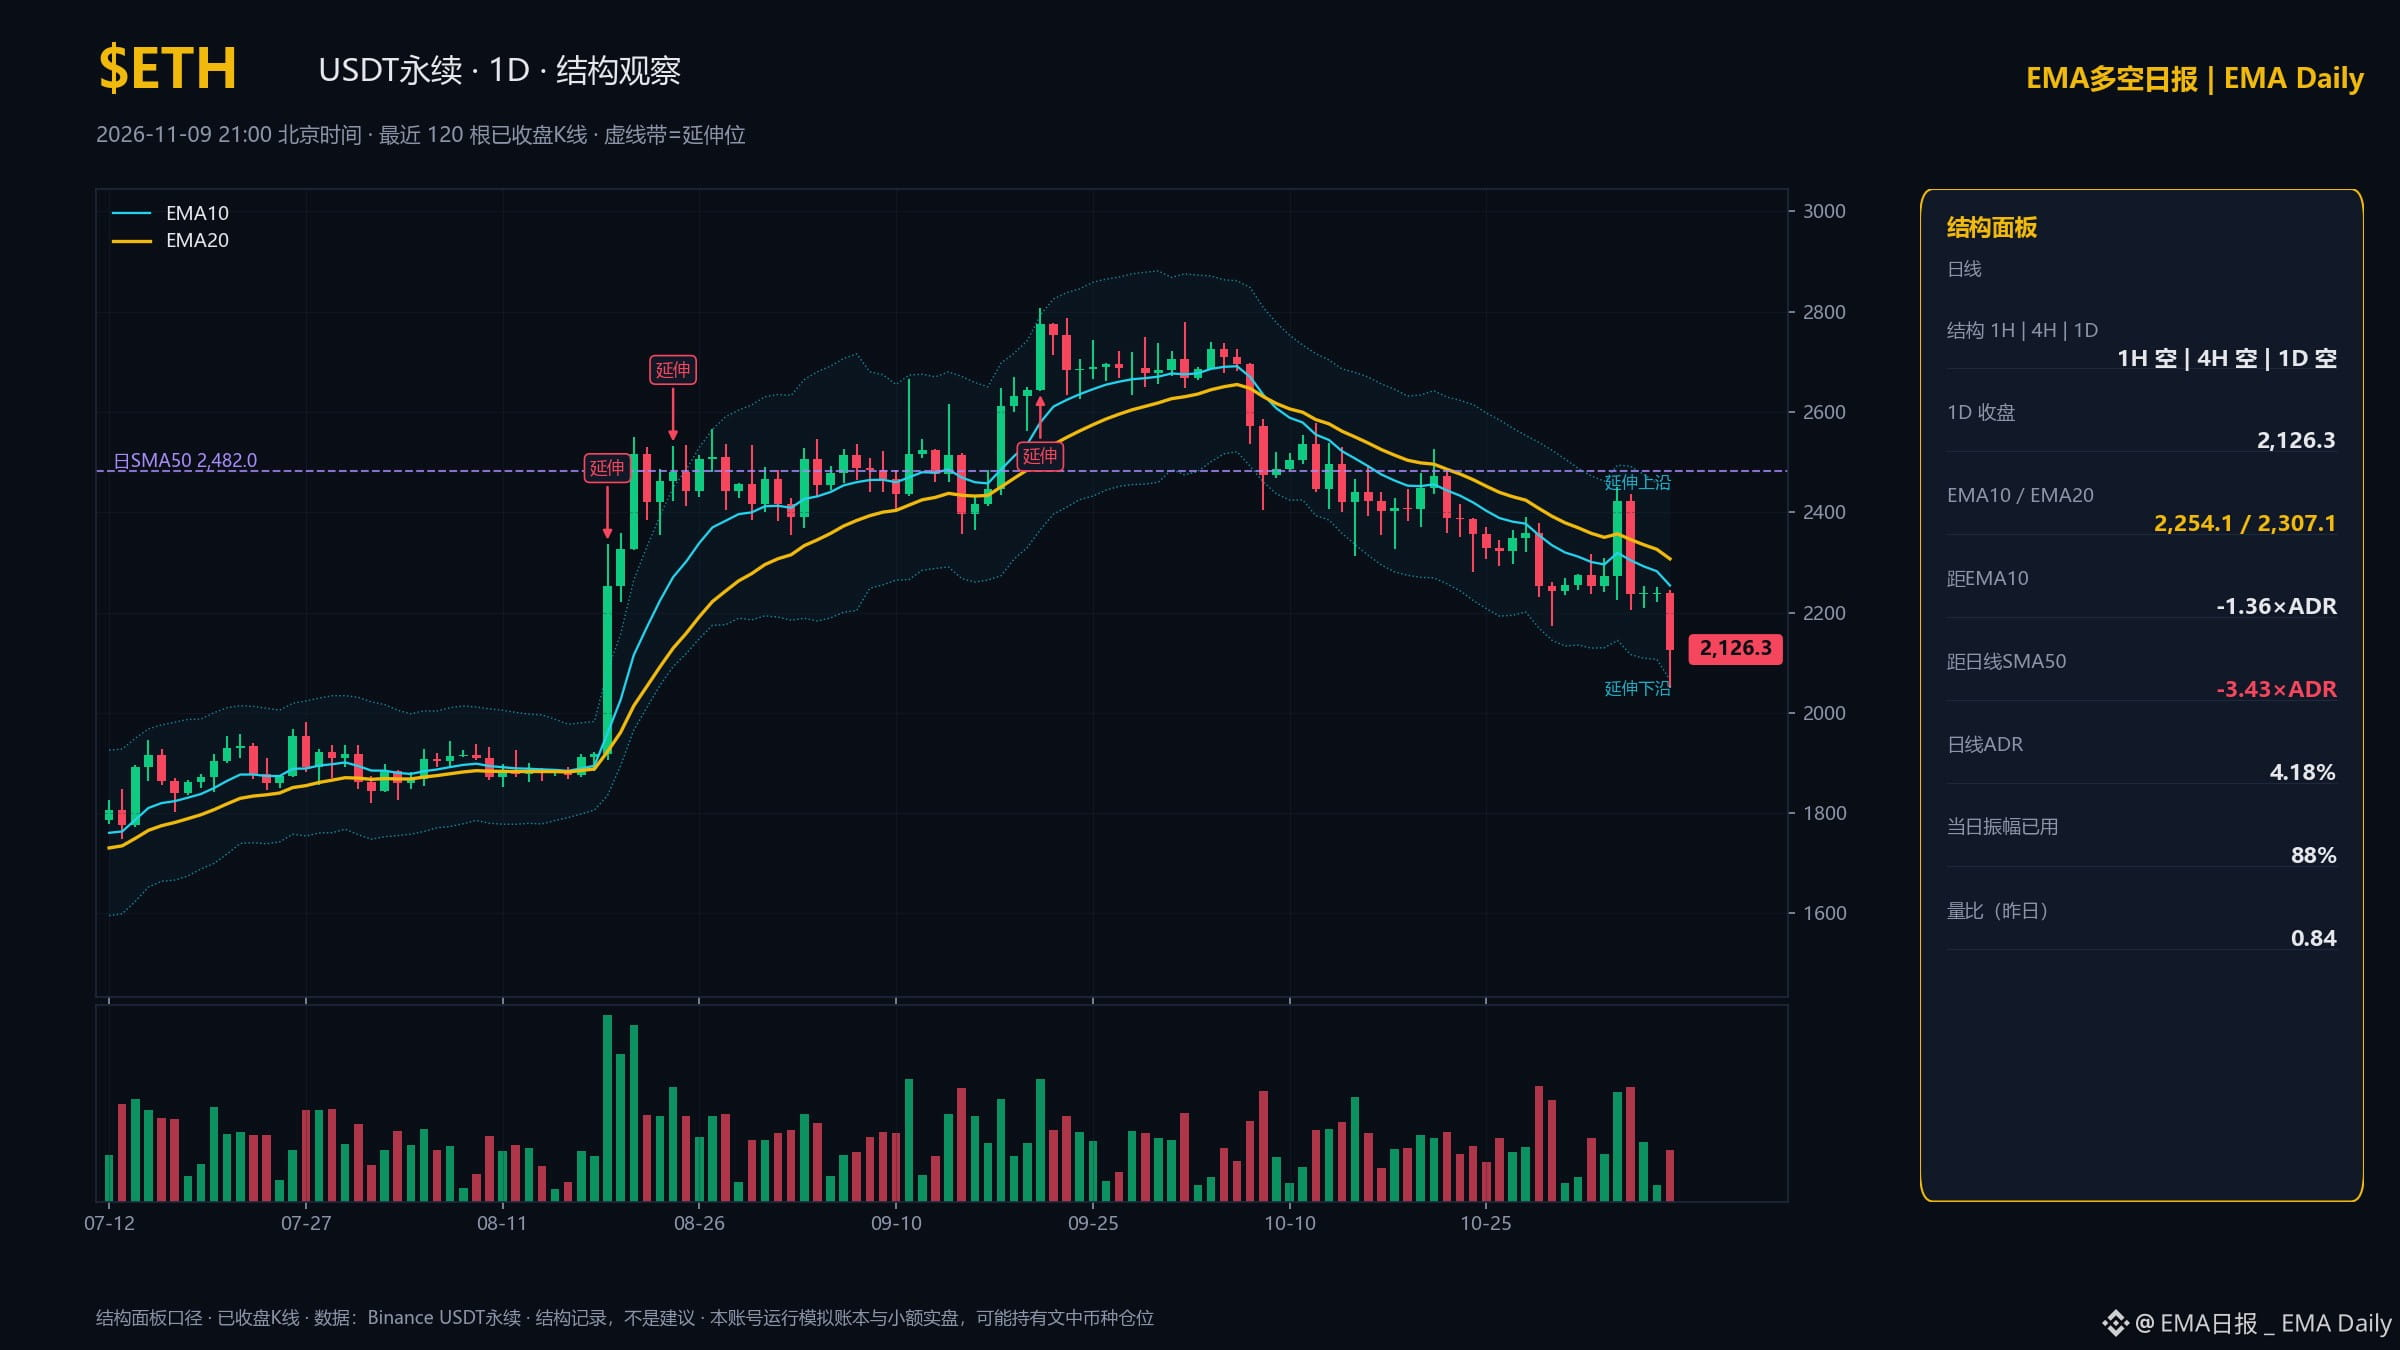
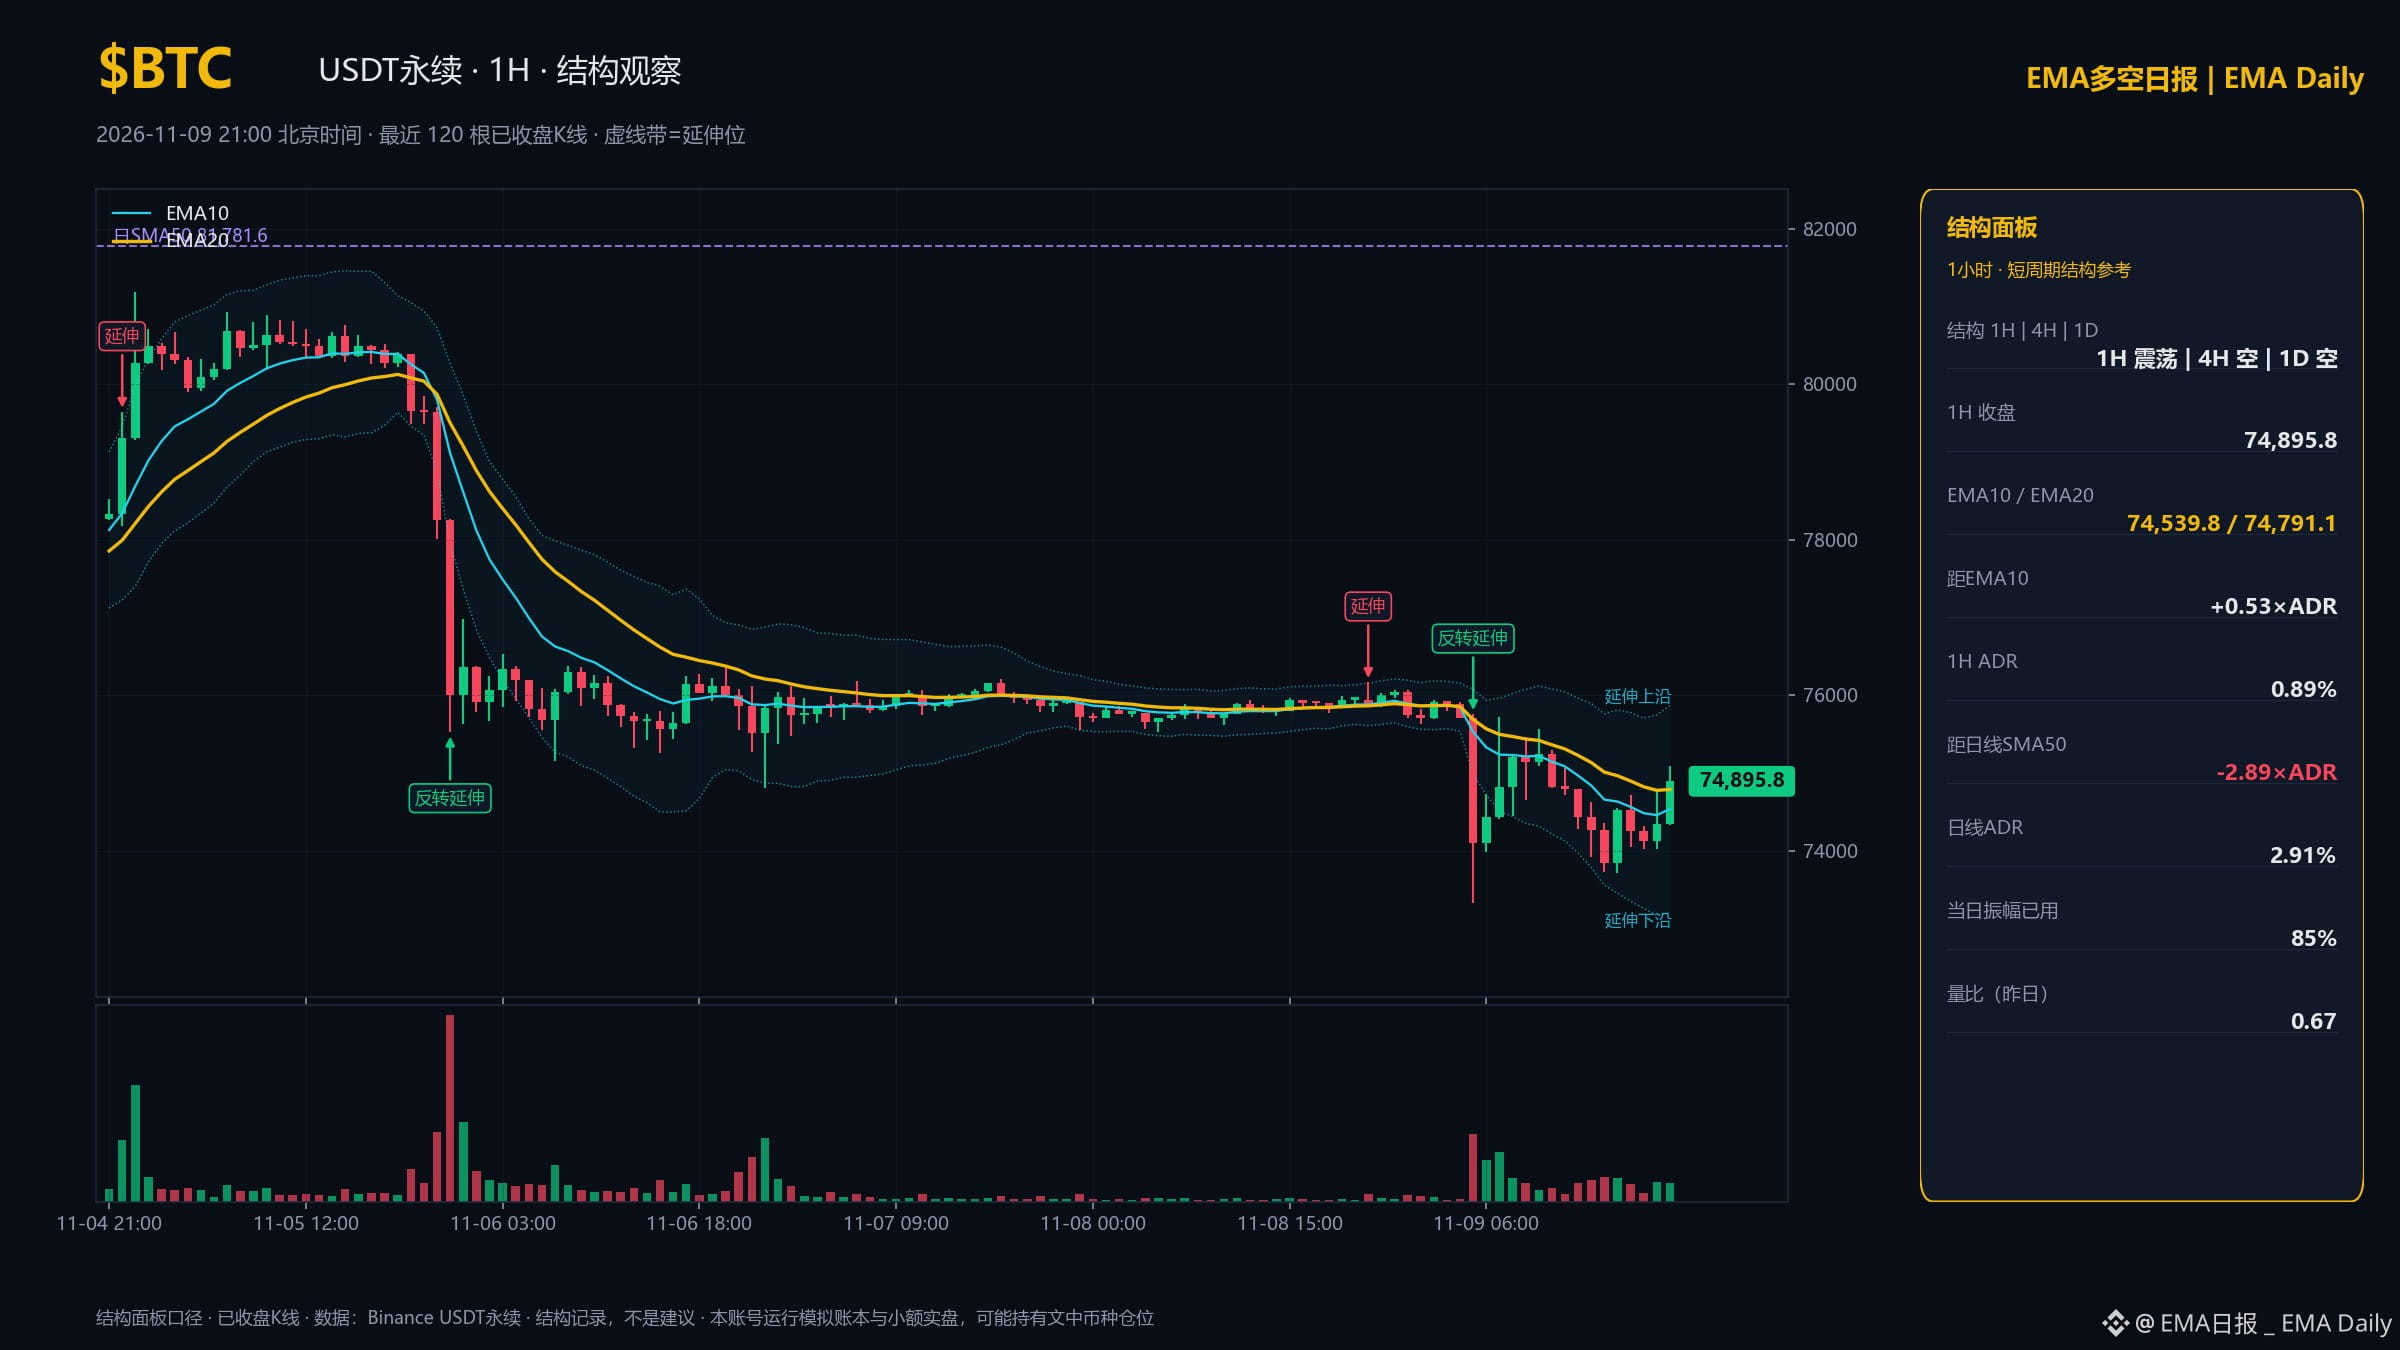
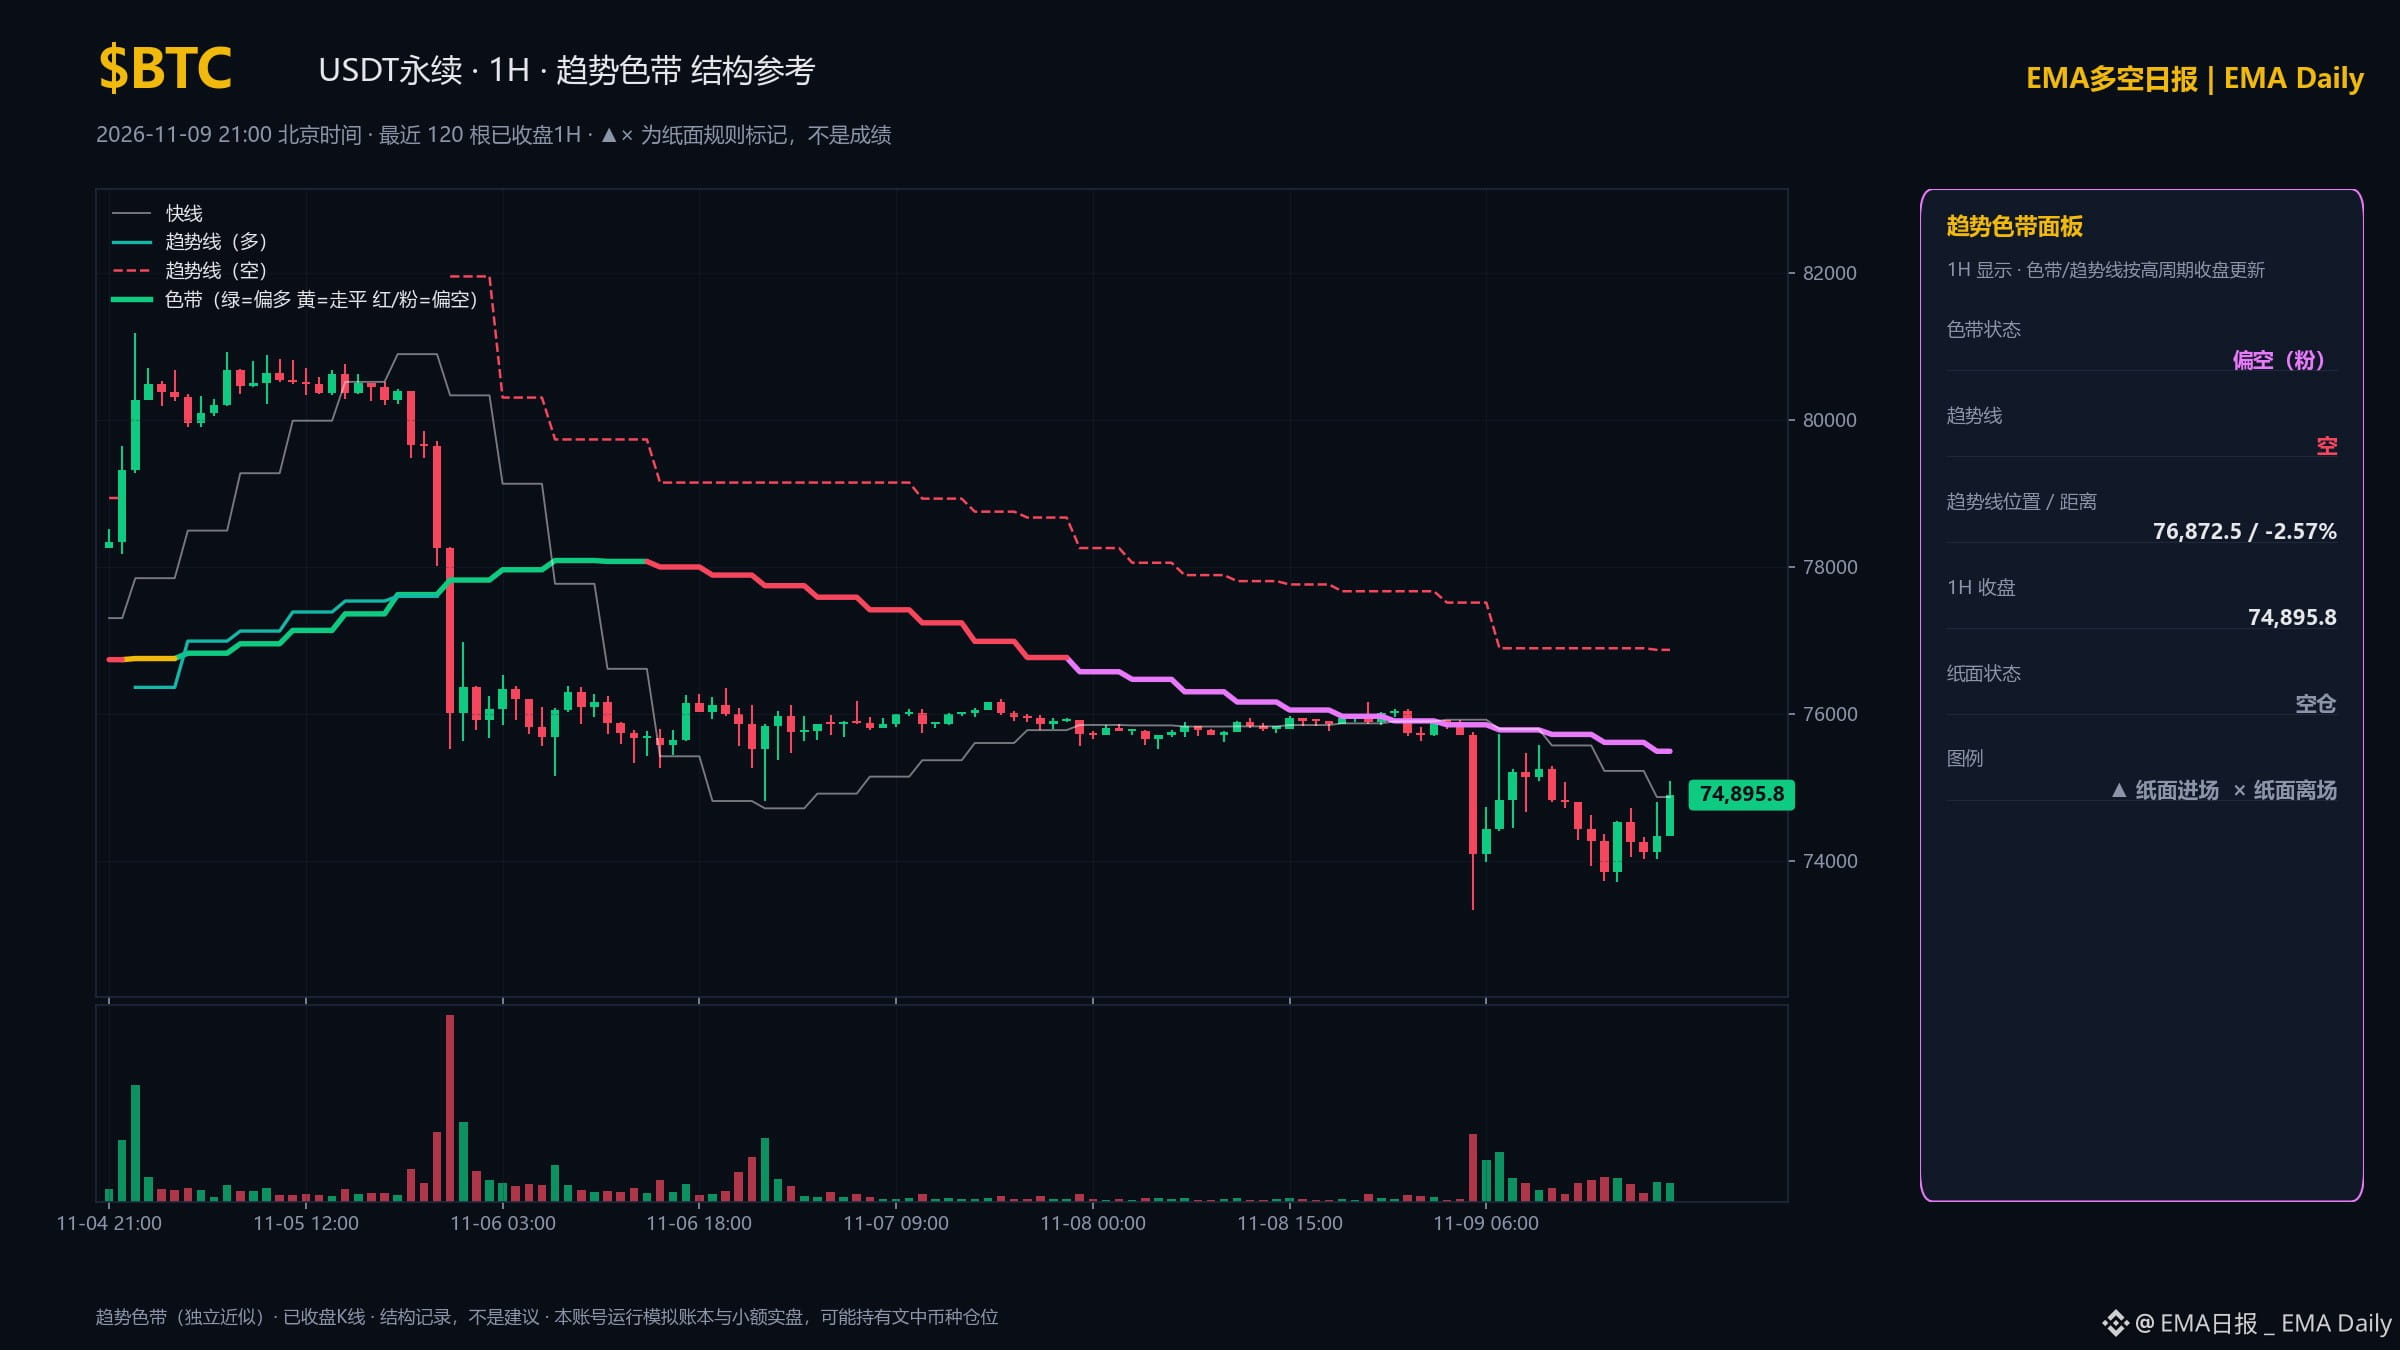
今日一句话:4个币日线都在空头结构里;1H也都偏空,短线和大方向一致。今天波动正常(各币当日振幅为平时的 78%–81%)。
EMA结构日报|2026-11-09 21:00 北京时间
Binance USDT永续|基于结构面板公式
只观察结构,不是完整引擎开仓信号。
$BTC|1H空|4H空|日线空
1H收盘 74895.8;4H EMA20 75689.2
日线ADR 2.91%|量比 0.68
日线距SMA50 -2.92×ADR;上延伸参考 81557.3
当日振幅/前20日均振幅:81.0%
$ETH|1H空|4H空|日线空
1H收盘 2121.5;4H EMA20 2207.7
日线ADR 4.18%|量比 0.84
日线距SMA50 -3.43×ADR;上延伸参考 2442.5
当日振幅/前20日均振幅:80.8%
日线位于SMA50/200下方
$SOL|1H空|4H空|日线空
1H收盘 86.58;4H EMA20 89.06
日线ADR 4.50%|量比 0.94
日线距SMA50 -4.30×ADR;上延伸参考 100.48
当日振幅/前20日均振幅:77.7%
日线位于SMA50/200下方
BNB|1H空|4H空|日线空
1H收盘 687.44;4H EMA20 693.38
日线ADR 3.36%|量比 0.65
日线距SMA50 -2.34×ADR;上延伸参考 749.5
当日振幅/前20日均振幅:77.8%
已收盘数据截至(北京时间):1H 11-09 21:00;4H 11-09 20:00;日线 11-09 08:00
口径:EMA10>EMA20为多,否则按原面板归为空;不等于开仓许可。日线ADR为近期振幅均值,包含最后一根已收盘日线;日线量比同样是已收盘日数据。
当日振幅只累计已收盘1H,UTC日从北京时间08:00起算。振幅比可超过100%,不代表剩余空间。延伸参考位不等于已触发衰竭事件,均线也不是保证有效的支撑压力。
配图:BTC/ETH 日线结构图;BTC 1H 结构图与 1H 趋势色带图。虚线带为延伸位,面板为已收盘口径。
BTC 1H/4H/日线全空,离日线 SMA50(81781.6)还有一段。你觉得这周先站回 74791.1(1H EMA20)的概率有多大?
#EMA #行情观察
不构成投资建议。
今日一句话:4个币日线都在空头结构里;1H也都偏空,短线和大方向一致。今天波动正常(各币当日振幅为平时的 78%–81%)。
EMA结构日报|2026-11-09 21:00 北京时间
Binance USDT永续|基于结构面板公式
只观察结构,不是完整引擎开仓信号。
$BTC |1H空|4H空|日线空
1H收盘 74895.8;4H EMA20 75689.2
日线ADR 2.91%|量比 0.68
日线距SMA50 -2.92×ADR;上延伸参考 81557.3
当日振幅/前20日均振幅:81.0%
$ETH |1H空|4H空|日线空
1H收盘 2121.5;4H EMA20 2207.7
日线ADR 4.18%|量比 0.84
日线距SMA50 -3.43×ADR;上延伸参考 2442.5
当日振幅/前20日均振幅:80.8%
日线位于SMA50/200下方
$SOL |1H空|4H空|日线空
1H收盘 86.58;4H EMA20 89.06
日线ADR 4.50%|量比 0.94
日线距SMA50 -4.30×ADR;上延伸参考 100.48
当日振幅/前20日均振幅:77.7%
日线位于SMA50/200下方
BNB|1H空|4H空|日线空
1H收盘 687.44;4H EMA20 693.38
日线ADR 3.36%|量比 0.65
日线距SMA50 -2.34×ADR;上延伸参考 749.5
当日振幅/前20日均振幅:77.8%
已收盘数据截至(北京时间):1H 11-09 21:00;4H 11-09 20:00;日线 11-09 08:00
口径:EMA10>EMA20为多,否则按原面板归为空;不等于开仓许可。日线ADR为近期振幅均值,包含最后一根已收盘日线;日线量比同样是已收盘日数据。
当日振幅只累计已收盘1H,UTC日从北京时间08:00起算。振幅比可超过100%,不代表剩余空间。延伸参考位不等于已触发衰竭事件,均线也不是保证有效的支撑压力。
配图:BTC/ETH 日线结构图;BTC 1H 结构图与 1H 趋势色带图。虚线带为延伸位,面板为已收盘口径。
BTC 1H/4H/日线全空,离日线 SMA50(81781.6)还有一段。你觉得这周先站回 74791.1(1H EMA20)的概率有多大?
#EMA #行情观察
不构成投资建议。
EMA结构日报|2026-11-09 21:00 北京时间
Binance USDT永续|基于结构面板公式
只观察结构,不是完整引擎开仓信号。
$BTC |1H空|4H空|日线空
1H收盘 74895.8;4H EMA20 75689.2
日线ADR 2.91%|量比 0.68
日线距SMA50 -2.92×ADR;上延伸参考 81557.3
当日振幅/前20日均振幅:81.0%
$ETH |1H空|4H空|日线空
1H收盘 2121.5;4H EMA20 2207.7
日线ADR 4.18%|量比 0.84
日线距SMA50 -3.43×ADR;上延伸参考 2442.5
当日振幅/前20日均振幅:80.8%
日线位于SMA50/200下方
$SOL |1H空|4H空|日线空
1H收盘 86.58;4H EMA20 89.06
日线ADR 4.50%|量比 0.94
日线距SMA50 -4.30×ADR;上延伸参考 100.48
当日振幅/前20日均振幅:77.7%
日线位于SMA50/200下方
BNB|1H空|4H空|日线空
1H收盘 687.44;4H EMA20 693.38
日线ADR 3.36%|量比 0.65
日线距SMA50 -2.34×ADR;上延伸参考 749.5
当日振幅/前20日均振幅:77.8%
已收盘数据截至(北京时间):1H 11-09 21:00;4H 11-09 20:00;日线 11-09 08:00
口径:EMA10>EMA20为多,否则按原面板归为空;不等于开仓许可。日线ADR为近期振幅均值,包含最后一根已收盘日线;日线量比同样是已收盘日数据。
当日振幅只累计已收盘1H,UTC日从北京时间08:00起算。振幅比可超过100%,不代表剩余空间。延伸参考位不等于已触发衰竭事件,均线也不是保证有效的支撑压力。
配图:BTC/ETH 日线结构图;BTC 1H 结构图与 1H 趋势色带图。虚线带为延伸位,面板为已收盘口径。
BTC 1H/4H/日线全空,离日线 SMA50(81781.6)还有一段。你觉得这周先站回 74791.1(1H EMA20)的概率有多大?
#EMA #行情观察
不构成投资建议。
1
530
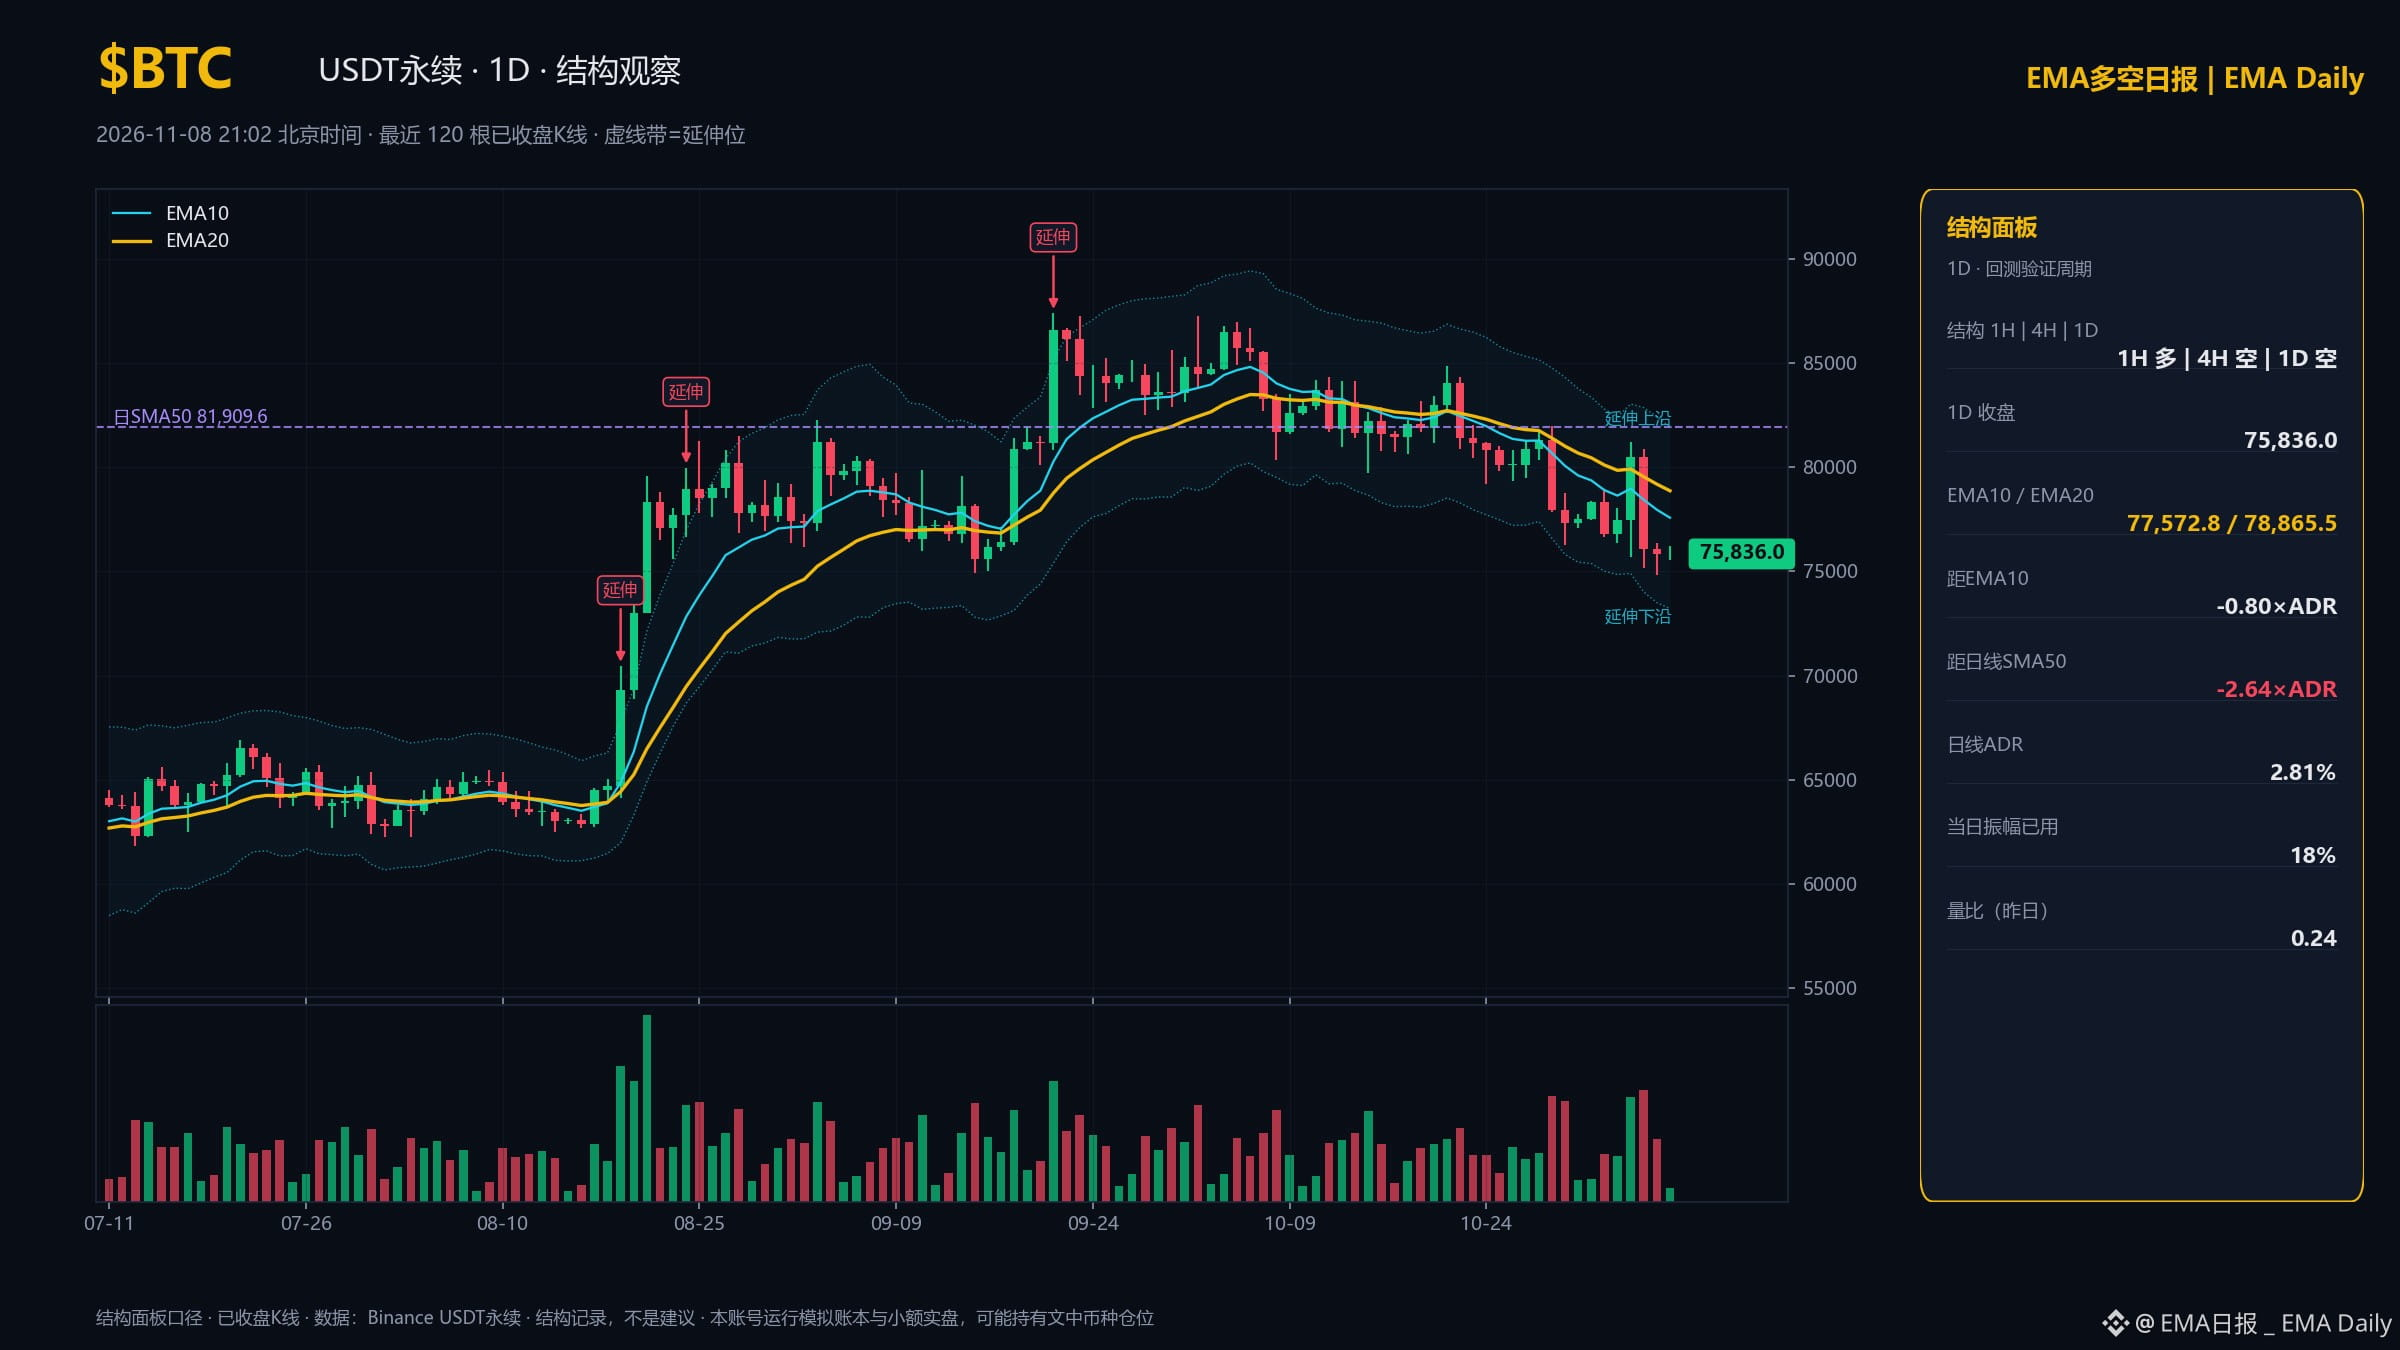
EMA结构日报|2026-11-08 21:01 北京时间
Binance USDT永续|基于结构面板公式
只观察结构,不是完整引擎开仓信号。
$BTC|1H多|4H空|日线空
1H收盘 75944.9;4H EMA20 76385.8
日线ADR 2.81%|量比 0.24
日线距SMA50 -2.64×ADR;上延伸参考 81930.3
当日振幅/前20日均振幅:17.0%
$ETH|1H空|4H空|日线空
1H收盘 2238.4;4H EMA20 2256.2
日线ADR 3.85%|量比 0.27
日线距SMA50 -2.64×ADR;上延伸参考 2458.2
当日振幅/前20日均振幅:15.6%
$SOL|1H空|4H空|日线空
1H收盘 89.51;4H EMA20 90.57
日线ADR 4.32%|量比 0.37
日线距SMA50 -3.86×ADR;上延伸参考 101.52
当日振幅/前20日均振幅:25.4%
BNB|1H多|4H空|日线空
1H收盘 699.59;4H EMA20 698.31
日线ADR 3.26%|量比 0.28
日线距SMA50 -2.01×ADR;上延伸参考 752.17
当日振幅/前20日均振幅:34.0%
已收盘数据截至(北京时间):1H 11-08 21:00;4H 11-08 20:00;日线 11-08 08:00
口径:EMA10>EMA20为多,否则按原面板归为空;不等于开仓许可。日线ADR为近期振幅均值,包含最后一根已收盘日线;日线量比同样是已收盘日数据。
当日振幅只累计已收盘1H,UTC日从北京时间08:00起算。振幅比可超过100%,不代表剩余空间。延伸参考位不等于已触发衰竭事件,均线也不是保证有效的支撑压力。
#EMA #行情观察
不构成投资建议。
EMA结构日报|2026-11-08 21:01 北京时间
Binance USDT永续|基于结构面板公式
只观察结构,不是完整引擎开仓信号。
$BTC |1H多|4H空|日线空
1H收盘 75944.9;4H EMA20 76385.8
日线ADR 2.81%|量比 0.24
日线距SMA50 -2.64×ADR;上延伸参考 81930.3
当日振幅/前20日均振幅:17.0%
$ETH |1H空|4H空|日线空
1H收盘 2238.4;4H EMA20 2256.2
日线ADR 3.85%|量比 0.27
日线距SMA50 -2.64×ADR;上延伸参考 2458.2
当日振幅/前20日均振幅:15.6%
$SOL |1H空|4H空|日线空
1H收盘 89.51;4H EMA20 90.57
日线ADR 4.32%|量比 0.37
日线距SMA50 -3.86×ADR;上延伸参考 101.52
当日振幅/前20日均振幅:25.4%
BNB|1H多|4H空|日线空
1H收盘 699.59;4H EMA20 698.31
日线ADR 3.26%|量比 0.28
日线距SMA50 -2.01×ADR;上延伸参考 752.17
当日振幅/前20日均振幅:34.0%
已收盘数据截至(北京时间):1H 11-08 21:00;4H 11-08 20:00;日线 11-08 08:00
口径:EMA10>EMA20为多,否则按原面板归为空;不等于开仓许可。日线ADR为近期振幅均值,包含最后一根已收盘日线;日线量比同样是已收盘日数据。
当日振幅只累计已收盘1H,UTC日从北京时间08:00起算。振幅比可超过100%,不代表剩余空间。延伸参考位不等于已触发衰竭事件,均线也不是保证有效的支撑压力。
#EMA #行情观察
不构成投资建议。
Binance USDT永续|基于结构面板公式
只观察结构,不是完整引擎开仓信号。
$BTC |1H多|4H空|日线空
1H收盘 75944.9;4H EMA20 76385.8
日线ADR 2.81%|量比 0.24
日线距SMA50 -2.64×ADR;上延伸参考 81930.3
当日振幅/前20日均振幅:17.0%
$ETH |1H空|4H空|日线空
1H收盘 2238.4;4H EMA20 2256.2
日线ADR 3.85%|量比 0.27
日线距SMA50 -2.64×ADR;上延伸参考 2458.2
当日振幅/前20日均振幅:15.6%
$SOL |1H空|4H空|日线空
1H收盘 89.51;4H EMA20 90.57
日线ADR 4.32%|量比 0.37
日线距SMA50 -3.86×ADR;上延伸参考 101.52
当日振幅/前20日均振幅:25.4%
BNB|1H多|4H空|日线空
1H收盘 699.59;4H EMA20 698.31
日线ADR 3.26%|量比 0.28
日线距SMA50 -2.01×ADR;上延伸参考 752.17
当日振幅/前20日均振幅:34.0%
已收盘数据截至(北京时间):1H 11-08 21:00;4H 11-08 20:00;日线 11-08 08:00
口径:EMA10>EMA20为多,否则按原面板归为空;不等于开仓许可。日线ADR为近期振幅均值,包含最后一根已收盘日线;日线量比同样是已收盘日数据。
当日振幅只累计已收盘1H,UTC日从北京时间08:00起算。振幅比可超过100%,不代表剩余空间。延伸参考位不等于已触发衰竭事件,均线也不是保证有效的支撑压力。
#EMA #行情观察
不构成投资建议。
478
$BNB|结构观察 11-08 17:15 北京时间
1H多|4H空|日线空
1H收盘 699.38;4H EMA20 698.17;日线SMA50 745.59
日线ADR 3.26%|当日振幅已用 34%|量比 0.28
我的看法:1H反弹但4H仍空,EMA20 698.17 附近是压力观察位;4H收盘站上才算转多,之前都当反弹。
验证:周三(11-11)回看,收盘在4H EMA20下方算结构维持空,否则结构失效,我会发结果。
基于OKCPA v38.6基础面板口径;结构观察,不是开仓信号。
#EMA #行情观察
不构成投资建议。
$BNB |结构观察 11-08 17:15 北京时间
1H多|4H空|日线空
1H收盘 699.38;4H EMA20 698.17;日线SMA50 745.59
日线ADR 3.26%|当日振幅已用 34%|量比 0.28
我的看法:1H反弹但4H仍空,EMA20 698.17 附近是压力观察位;4H收盘站上才算转多,之前都当反弹。
验证:周三(11-11)回看,收盘在4H EMA20下方算结构维持空,否则结构失效,我会发结果。
基于OKCPA v38.6基础面板口径;结构观察,不是开仓信号。
#EMA #行情观察
不构成投资建议。
1H多|4H空|日线空
1H收盘 699.38;4H EMA20 698.17;日线SMA50 745.59
日线ADR 3.26%|当日振幅已用 34%|量比 0.28
我的看法:1H反弹但4H仍空,EMA20 698.17 附近是压力观察位;4H收盘站上才算转多,之前都当反弹。
验证:周三(11-11)回看,收盘在4H EMA20下方算结构维持空,否则结构失效,我会发结果。
基于OKCPA v38.6基础面板口径;结构观察,不是开仓信号。
#EMA #行情观察
不构成投资建议。
59
EMA多空日报|EMA Daily:发布连接与币种标签测试。后续计划于北京时间21:00更新EMA结构观察,实盘与模拟分开记录。本帖不含交易信号。$BTC $ETH #EMA
EMA多空日报|EMA Daily:发布连接与币种标签测试。后续计划于北京时间21:00更新EMA结构观察,实盘与模拟分开记录。本帖不含交易信号。$BTC $ETH #EMA
271
EMA giúp quan sát xu hướng giá như thế nào?
Exponential Moving Average là đường trung bình động đặt trọng số lớn hơn vào các mức giá gần đây.
Khi giá nằm trên một EMA đang hướng lên, điều đó thường được xem là dấu hiệu sức mạnh trong khung thời gian tương ứng.
Ngược lại, giá nằm dưới EMA đang hướng xuống thường phản ánh động lượng yếu hơn.
Tuy nhiên, EMA có độ trễ và có thể tạo tín hiệu nhiễu khi thị trường đi ngang. Không nên sử dụng một đường EMA riêng lẻ để quyết định giao dịch.
#EMA #SHELL #TechnicalAnalysis
EMA giúp quan sát xu hướng giá như thế nào?
Exponential Moving Average là đường trung bình động đặt trọng số lớn hơn vào các mức giá gần đây.
Khi giá nằm trên một EMA đang hướng lên, điều đó thường được xem là dấu hiệu sức mạnh trong khung thời gian tương ứng.
Ngược lại, giá nằm dưới EMA đang hướng xuống thường phản ánh động lượng yếu hơn.
Tuy nhiên, EMA có độ trễ và có thể tạo tín hiệu nhiễu khi thị trường đi ngang. Không nên sử dụng một đường EMA riêng lẻ để quyết định giao dịch.
#EMA #SHELL #TechnicalAnalysis
Exponential Moving Average là đường trung bình động đặt trọng số lớn hơn vào các mức giá gần đây.
Khi giá nằm trên một EMA đang hướng lên, điều đó thường được xem là dấu hiệu sức mạnh trong khung thời gian tương ứng.
Ngược lại, giá nằm dưới EMA đang hướng xuống thường phản ánh động lượng yếu hơn.
Tuy nhiên, EMA có độ trễ và có thể tạo tín hiệu nhiễu khi thị trường đi ngang. Không nên sử dụng một đường EMA riêng lẻ để quyết định giao dịch.
#EMA #SHELL #TechnicalAnalysis
5
·
--
🧠 Hoy $ETH está exactamente en su EMA 200 de 4 h: precio 2.416 $, EMA 200 en 2.417 $. ¿Por qué tanta gente mira esa línea?
📘 Qué es: la EMA 200 es el promedio del precio de las últimas 200 velas, dando más peso a las recientes. Resume la tendencia de fondo.
• Precio arriba de la EMA 200 → tendencia de fondo alcista
• Precio abajo → tendencia de fondo bajista
• Precio pegado a ella → zona de decisión
📊 Ejemplo con datos de hoy:
• ETH 4 h: ya recuperó la EMA 20 (2.334) y la EMA 50 (2.315), pero choca con la EMA 200 (2.417).
• $BTC 4 h: 80.362 $ frente a su EMA 200 en 80.956 $, a menos de 1 %.
• En el diario, en cambio, ambos están sobre su EMA 200 (ETH 2.230 / BTC 74.436): la tendencia larga sigue sana.
❌ Error común: creer que tocar la EMA 200 es comprar o vender automático. Funciona como zona, no como línea exacta, y pesa más si el cruce viene con volumen (hoy el volumen relativo de ETH en 4 h es solo 0,54).
✅ En 1 línea: la EMA 200 separa tendencia de fondo alcista de bajista; el cruce importa cuando se sostiene y tiene volumen.
¿Usas la EMA 200 en 4 h o en diario? 👇
#EMA #AnalisisTecnico #ETH #Cripto #Tra100d
⚠️ Contenido solo informativo y educativo, no es asesoría financiera. Las criptomonedas son volátiles: investiga y opera con precaución.
🧠 Hoy $ETH está exactamente en su EMA 200 de 4 h: precio 2.416 $, EMA 200 en 2.417 $. ¿Por qué tanta gente mira esa línea?
📘 Qué es: la EMA 200 es el promedio del precio de las últimas 200 velas, dando más peso a las recientes. Resume la tendencia de fondo.
• Precio arriba de la EMA 200 → tendencia de fondo alcista
• Precio abajo → tendencia de fondo bajista
• Precio pegado a ella → zona de decisión
📊 Ejemplo con datos de hoy:
• ETH 4 h: ya recuperó la EMA 20 (2.334) y la EMA 50 (2.315), pero choca con la EMA 200 (2.417).
• $BTC 4 h: 80.362 $ frente a su EMA 200 en 80.956 $, a menos de 1 %.
• En el diario, en cambio, ambos están sobre su EMA 200 (ETH 2.230 / BTC 74.436): la tendencia larga sigue sana.
❌ Error común: creer que tocar la EMA 200 es comprar o vender automático. Funciona como zona, no como línea exacta, y pesa más si el cruce viene con volumen (hoy el volumen relativo de ETH en 4 h es solo 0,54).
✅ En 1 línea: la EMA 200 separa tendencia de fondo alcista de bajista; el cruce importa cuando se sostiene y tiene volumen.
¿Usas la EMA 200 en 4 h o en diario? 👇
#EMA #AnalisisTecnico #ETH #Cripto #Tra100d
⚠️ Contenido solo informativo y educativo, no es asesoría financiera. Las criptomonedas son volátiles: investiga y opera con precaución.
📘 Qué es: la EMA 200 es el promedio del precio de las últimas 200 velas, dando más peso a las recientes. Resume la tendencia de fondo.
• Precio arriba de la EMA 200 → tendencia de fondo alcista
• Precio abajo → tendencia de fondo bajista
• Precio pegado a ella → zona de decisión
📊 Ejemplo con datos de hoy:
• ETH 4 h: ya recuperó la EMA 20 (2.334) y la EMA 50 (2.315), pero choca con la EMA 200 (2.417).
• $BTC 4 h: 80.362 $ frente a su EMA 200 en 80.956 $, a menos de 1 %.
• En el diario, en cambio, ambos están sobre su EMA 200 (ETH 2.230 / BTC 74.436): la tendencia larga sigue sana.
❌ Error común: creer que tocar la EMA 200 es comprar o vender automático. Funciona como zona, no como línea exacta, y pesa más si el cruce viene con volumen (hoy el volumen relativo de ETH en 4 h es solo 0,54).
✅ En 1 línea: la EMA 200 separa tendencia de fondo alcista de bajista; el cruce importa cuando se sostiene y tiene volumen.
¿Usas la EMA 200 en 4 h o en diario? 👇
#EMA #AnalisisTecnico #ETH #Cripto #Tra100d
⚠️ Contenido solo informativo y educativo, no es asesoría financiera. Las criptomonedas son volátiles: investiga y opera con precaución.
78


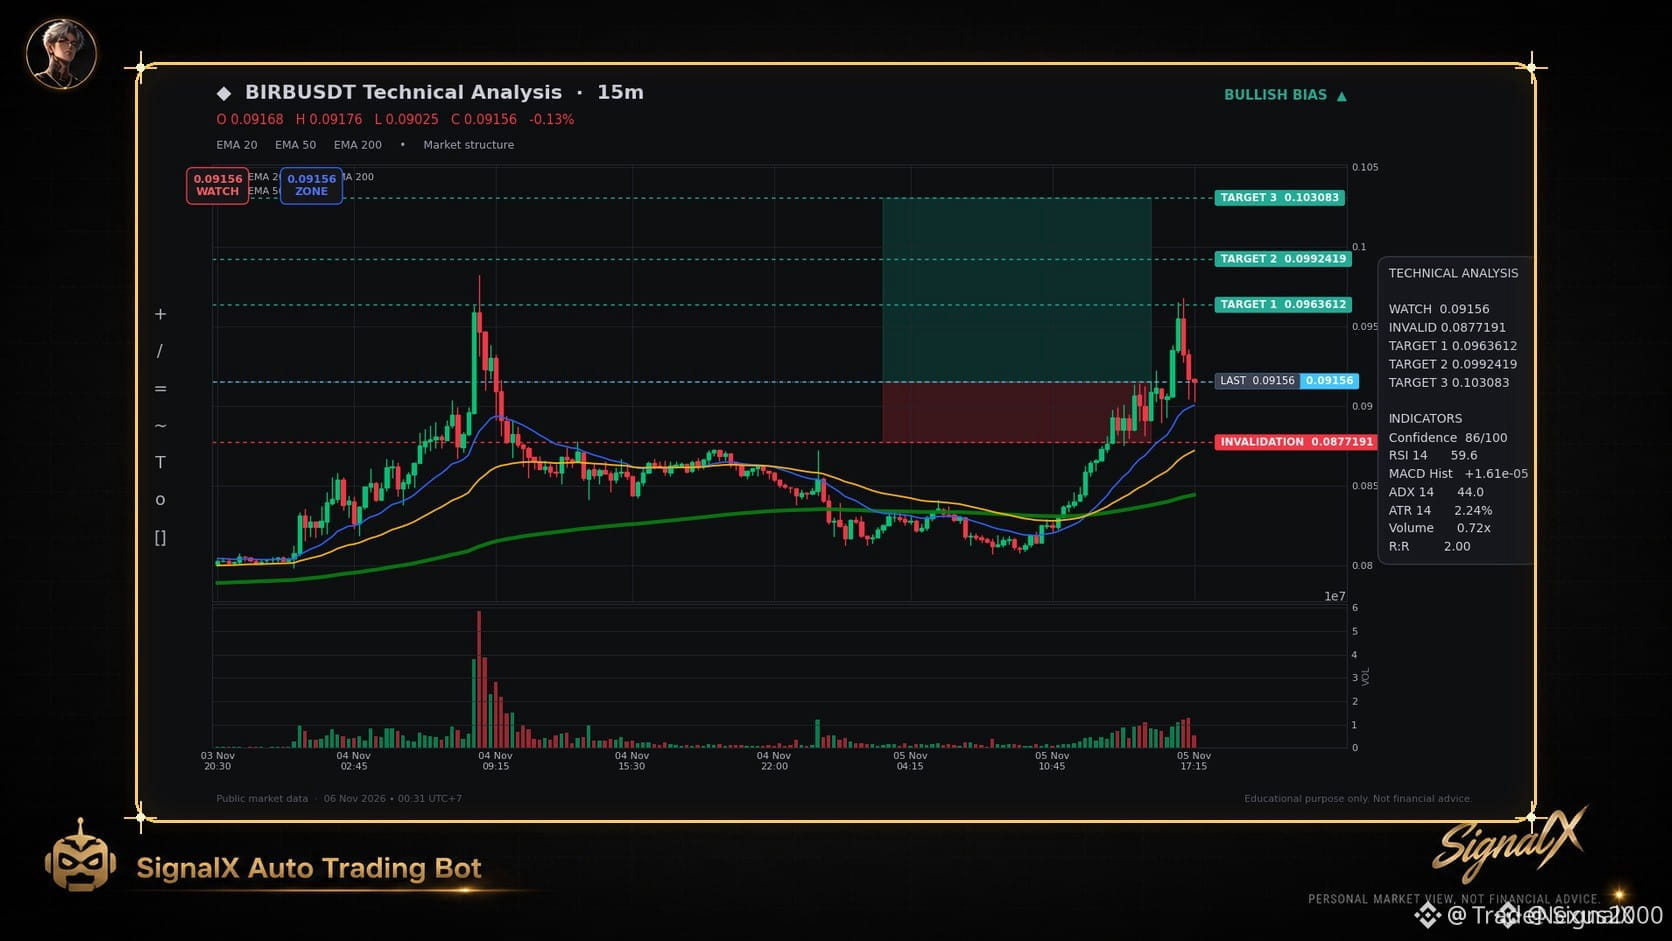
🚨 $BIRB ON THE EDGE OF A 15M PULLBACK SURGE! 🟢
Entry: 0.09156 ⚡
Target: 0.0963612 🚀
Stop Loss: 0.0877191 ⚠️
📊 EMA200 now cradles price, while EMA20/50/200 align in a clean bullish stack. RSI sits at 59.6, MACD histogram stays positive and ADX at 44 signals strong momentum. Volume, though modest at 0.72× the 20‑bar average, is still above baseline, hinting at a controlled pullback before continuation. 🌊 Smart money appears to be consolidating, ready to push higher once the brief dip resolves.
💬 Do you see this as a short‑term continuation play or a deeper accumulation zone? 👇
⚠️ Not financial advice. Always manage your risk. 🛡️
🏷️ #BIRB #LongSetup #EMA #Crypto
🔥 💎
🚨 $BIRB ON THE EDGE OF A 15M PULLBACK SURGE! 🟢
Entry: 0.09156 ⚡
Target: 0.0963612 🚀
Stop Loss: 0.0877191 ⚠️
📊 EMA200 now cradles price, while EMA20/50/200 align in a clean bullish stack. RSI sits at 59.6, MACD histogram stays positive and ADX at 44 signals strong momentum. Volume, though modest at 0.72× the 20‑bar average, is still above baseline, hinting at a controlled pullback before continuation. 🌊 Smart money appears to be consolidating, ready to push higher once the brief dip resolves.
💬 Do you see this as a short‑term continuation play or a deeper accumulation zone? 👇
⚠️ Not financial advice. Always manage your risk. 🛡️
🏷️ #BIRB #LongSetup #EMA #Crypto
🔥 💎
Entry: 0.09156 ⚡
Target: 0.0963612 🚀
Stop Loss: 0.0877191 ⚠️
📊 EMA200 now cradles price, while EMA20/50/200 align in a clean bullish stack. RSI sits at 59.6, MACD histogram stays positive and ADX at 44 signals strong momentum. Volume, though modest at 0.72× the 20‑bar average, is still above baseline, hinting at a controlled pullback before continuation. 🌊 Smart money appears to be consolidating, ready to push higher once the brief dip resolves.
💬 Do you see this as a short‑term continuation play or a deeper accumulation zone? 👇
⚠️ Not financial advice. Always manage your risk. 🛡️
🏷️ #BIRB #LongSetup #EMA #Crypto
🔥 💎
24

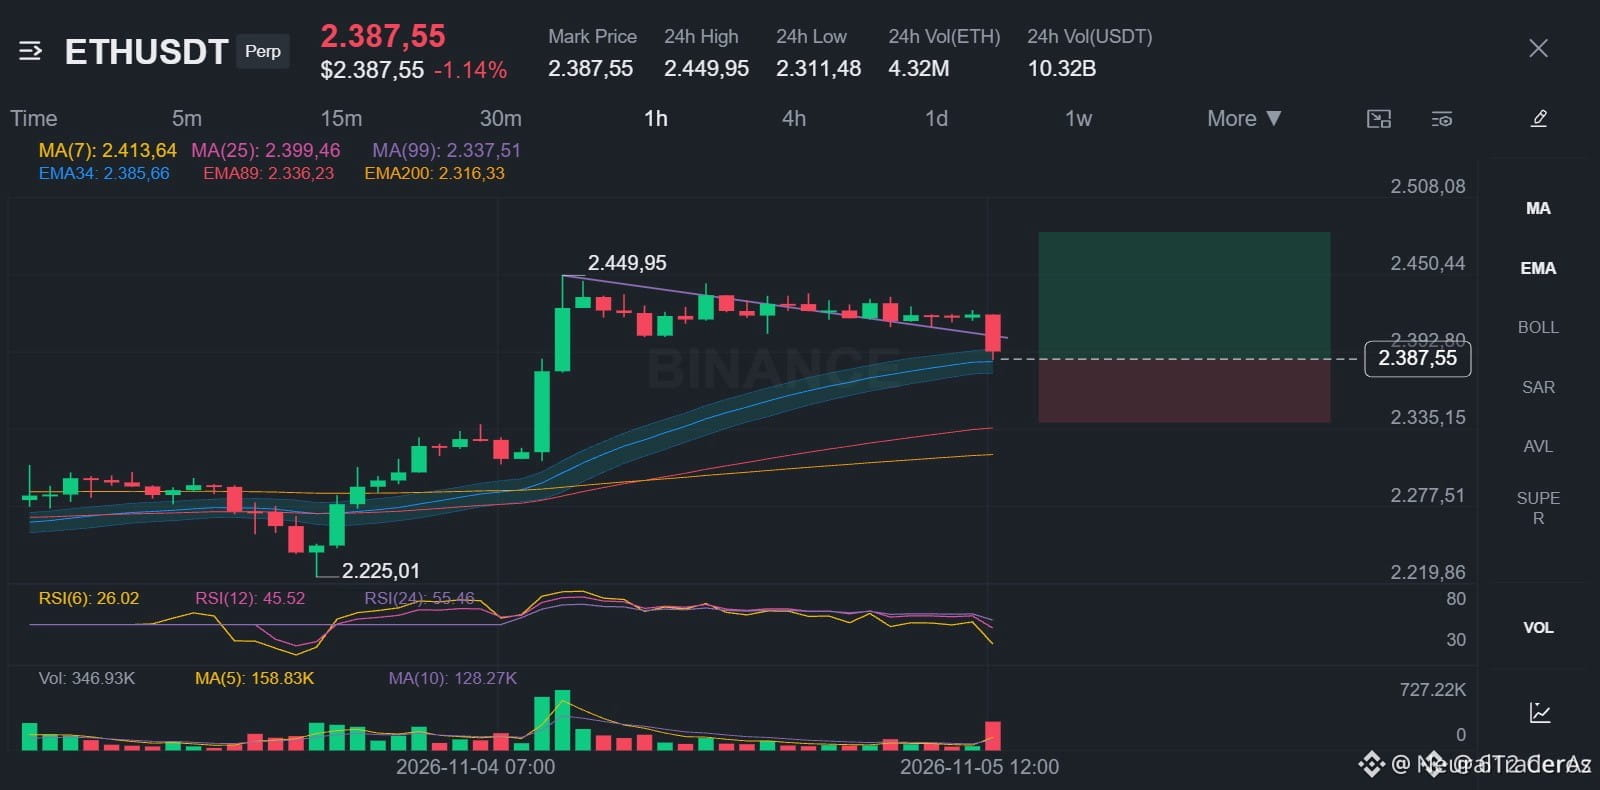
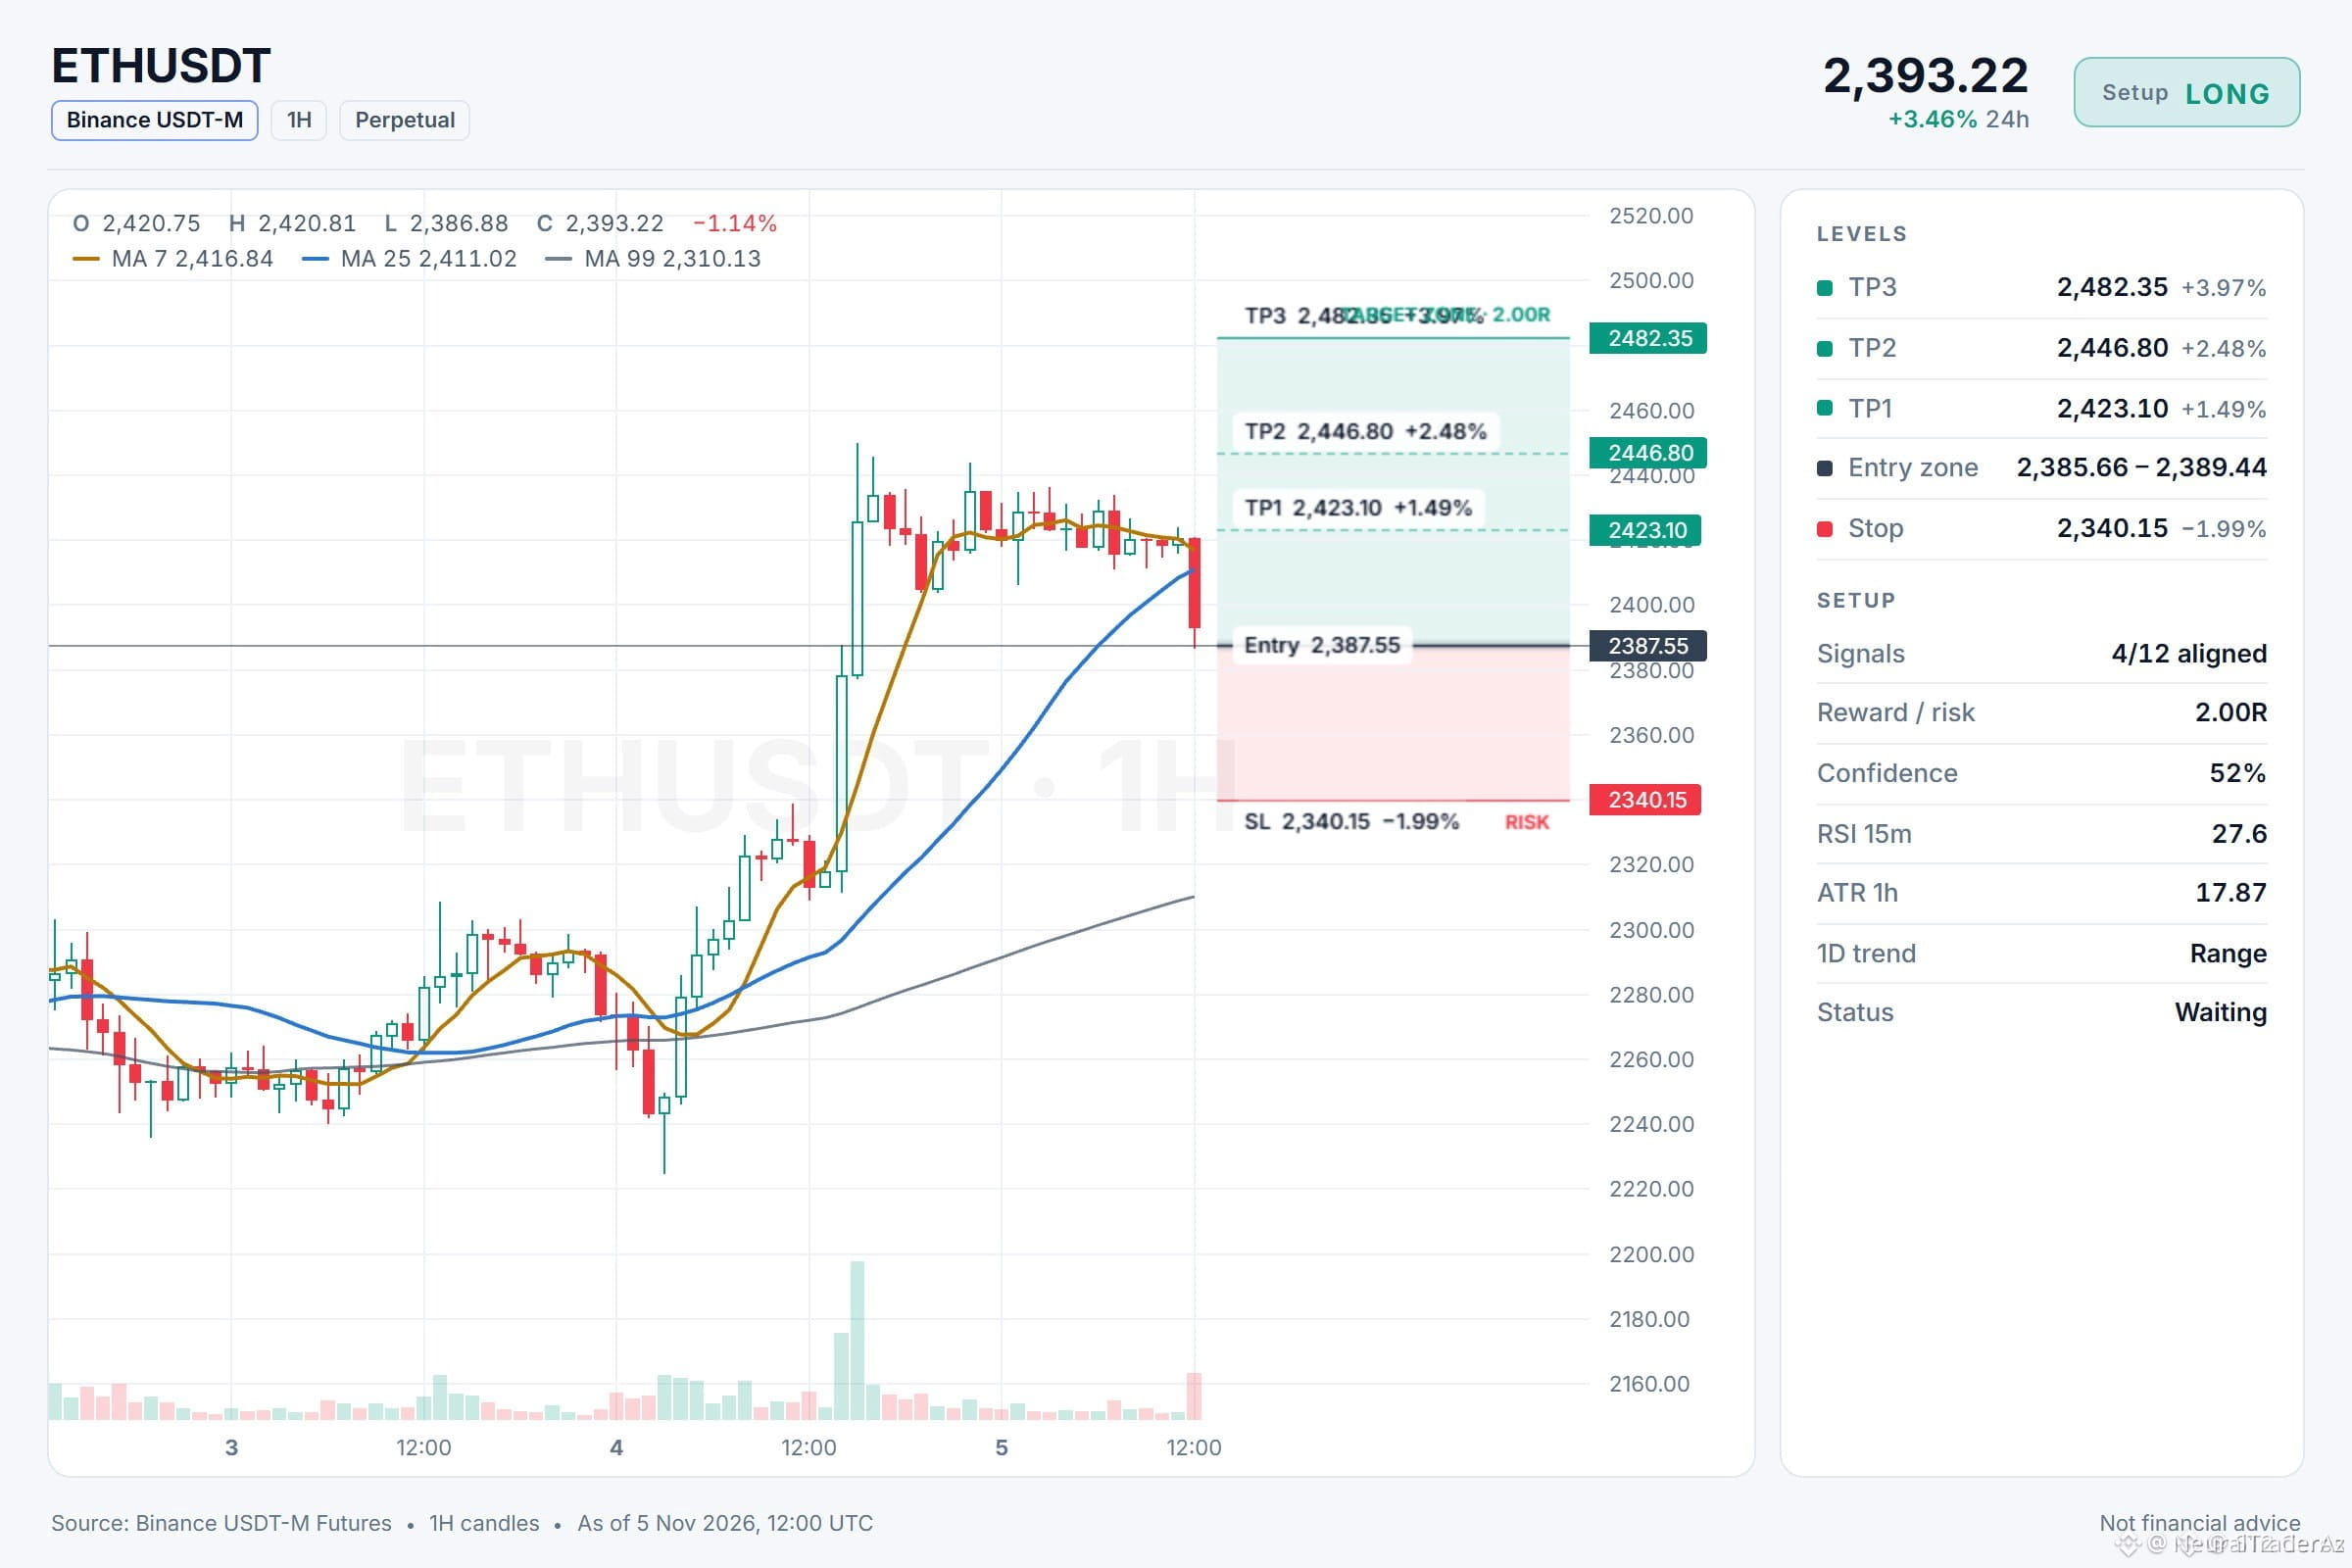
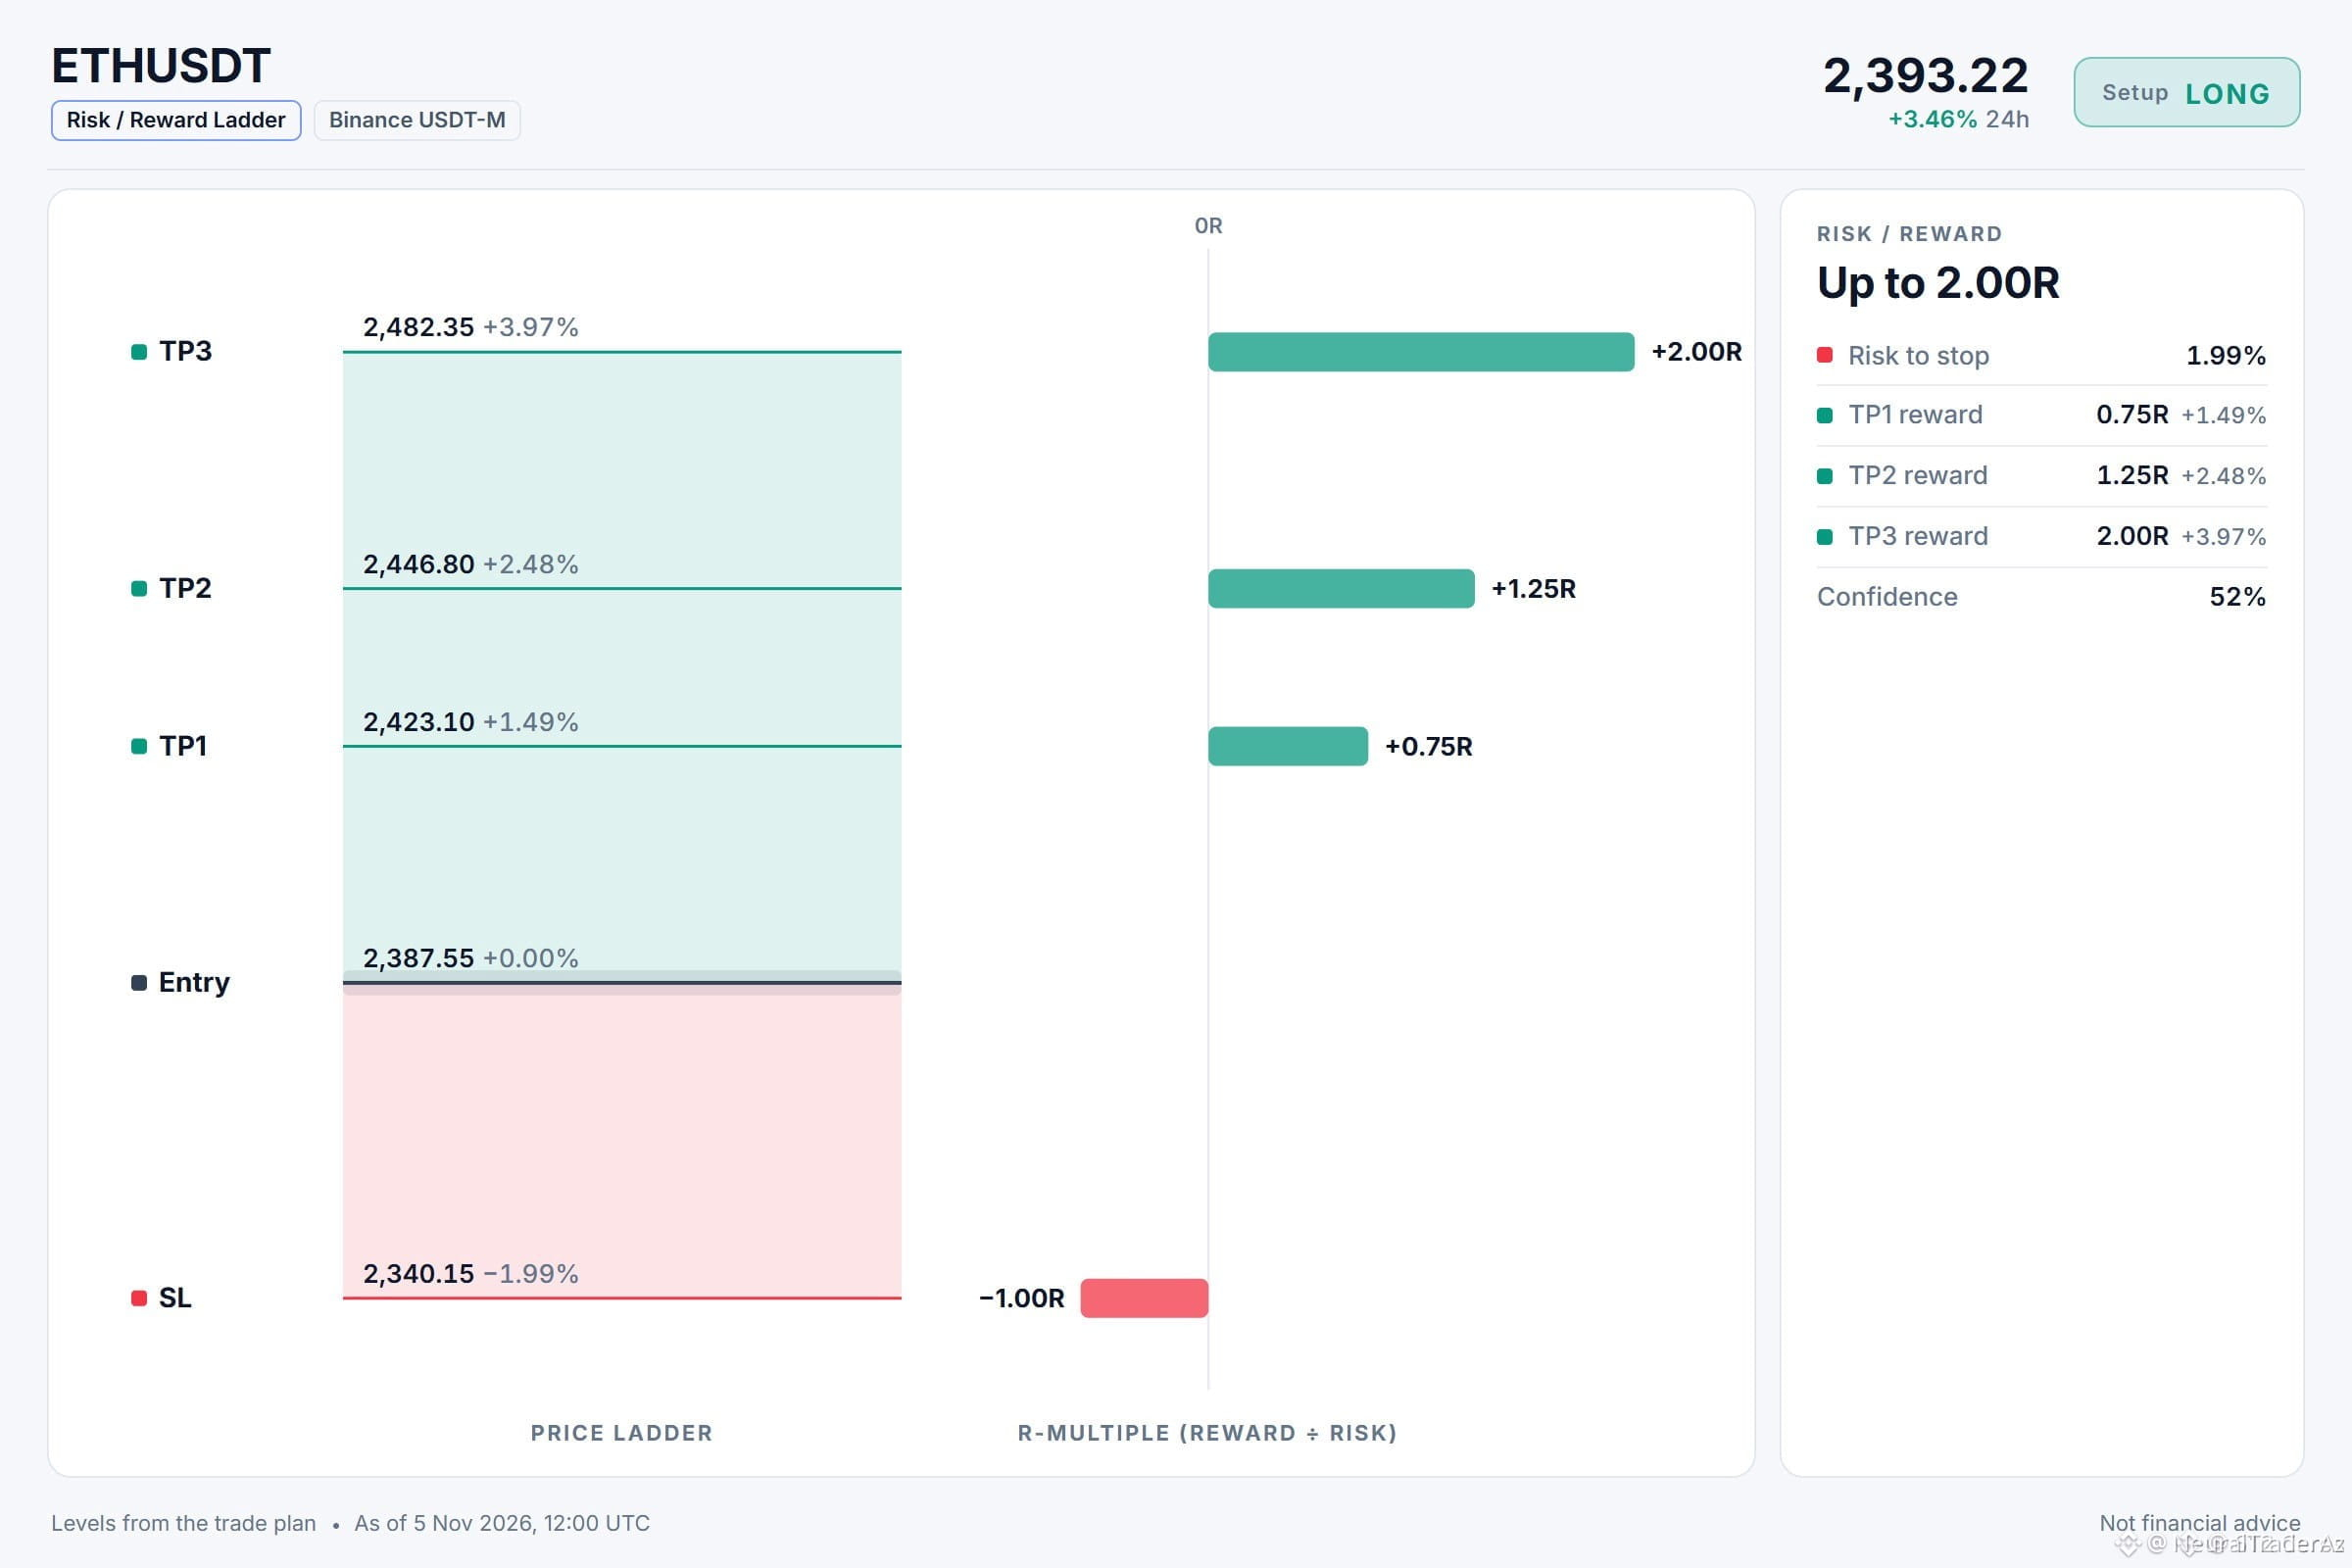
🚀 $ETH EMA50/200 BULL RUN ZONE – LIGHT LONG ENTRY 🟢
Entry: 2385.66-2389.44 ⚡
Target: 2423.10 🚀
Target: 2446.80 🚀
Target: 2482.35 🚀
Stop Loss: 2340.15 ⚠️
The 1H EMA50 and EMA200 sit comfortably above price, cementing a short‑term uptrend ⚡. A modest 15‑min ADX at 21 shows sellers still providing liquidity, a classic smart‑money prelude 🌊.
Entry nests between 2385.66‑2389.44 📌, with a tight stop at 2340.15. Targets cascade to 2423.10, 2446.80 and 2482.35, delivering a staged R‑R up to 1:4. Expanding volume on the 15‑min chart reinforces the liquidity sweep narrative 📊.
💬 Do you anticipate the next liquidity grab to fuel a deeper run? 👇
⚠️ Not financial advice. Always manage your risk. 🛡️
🏷️ #ETH #LongSetup #EMA #Crypto
🔥 💎
🚀 $ETH EMA50/200 BULL RUN ZONE – LIGHT LONG ENTRY 🟢
Entry: 2385.66-2389.44 ⚡
Target: 2423.10 🚀
Target: 2446.80 🚀
Target: 2482.35 🚀
Stop Loss: 2340.15 ⚠️
The 1H EMA50 and EMA200 sit comfortably above price, cementing a short‑term uptrend ⚡. A modest 15‑min ADX at 21 shows sellers still providing liquidity, a classic smart‑money prelude 🌊.
Entry nests between 2385.66‑2389.44 📌, with a tight stop at 2340.15. Targets cascade to 2423.10, 2446.80 and 2482.35, delivering a staged R‑R up to 1:4. Expanding volume on the 15‑min chart reinforces the liquidity sweep narrative 📊.
💬 Do you anticipate the next liquidity grab to fuel a deeper run? 👇
⚠️ Not financial advice. Always manage your risk. 🛡️
🏷️ #ETH #LongSetup #EMA #Crypto
🔥 💎
Entry: 2385.66-2389.44 ⚡
Target: 2423.10 🚀
Target: 2446.80 🚀
Target: 2482.35 🚀
Stop Loss: 2340.15 ⚠️
The 1H EMA50 and EMA200 sit comfortably above price, cementing a short‑term uptrend ⚡. A modest 15‑min ADX at 21 shows sellers still providing liquidity, a classic smart‑money prelude 🌊.
Entry nests between 2385.66‑2389.44 📌, with a tight stop at 2340.15. Targets cascade to 2423.10, 2446.80 and 2482.35, delivering a staged R‑R up to 1:4. Expanding volume on the 15‑min chart reinforces the liquidity sweep narrative 📊.
💬 Do you anticipate the next liquidity grab to fuel a deeper run? 👇
⚠️ Not financial advice. Always manage your risk. 🛡️
🏷️ #ETH #LongSetup #EMA #Crypto
🔥 💎
6

·
--
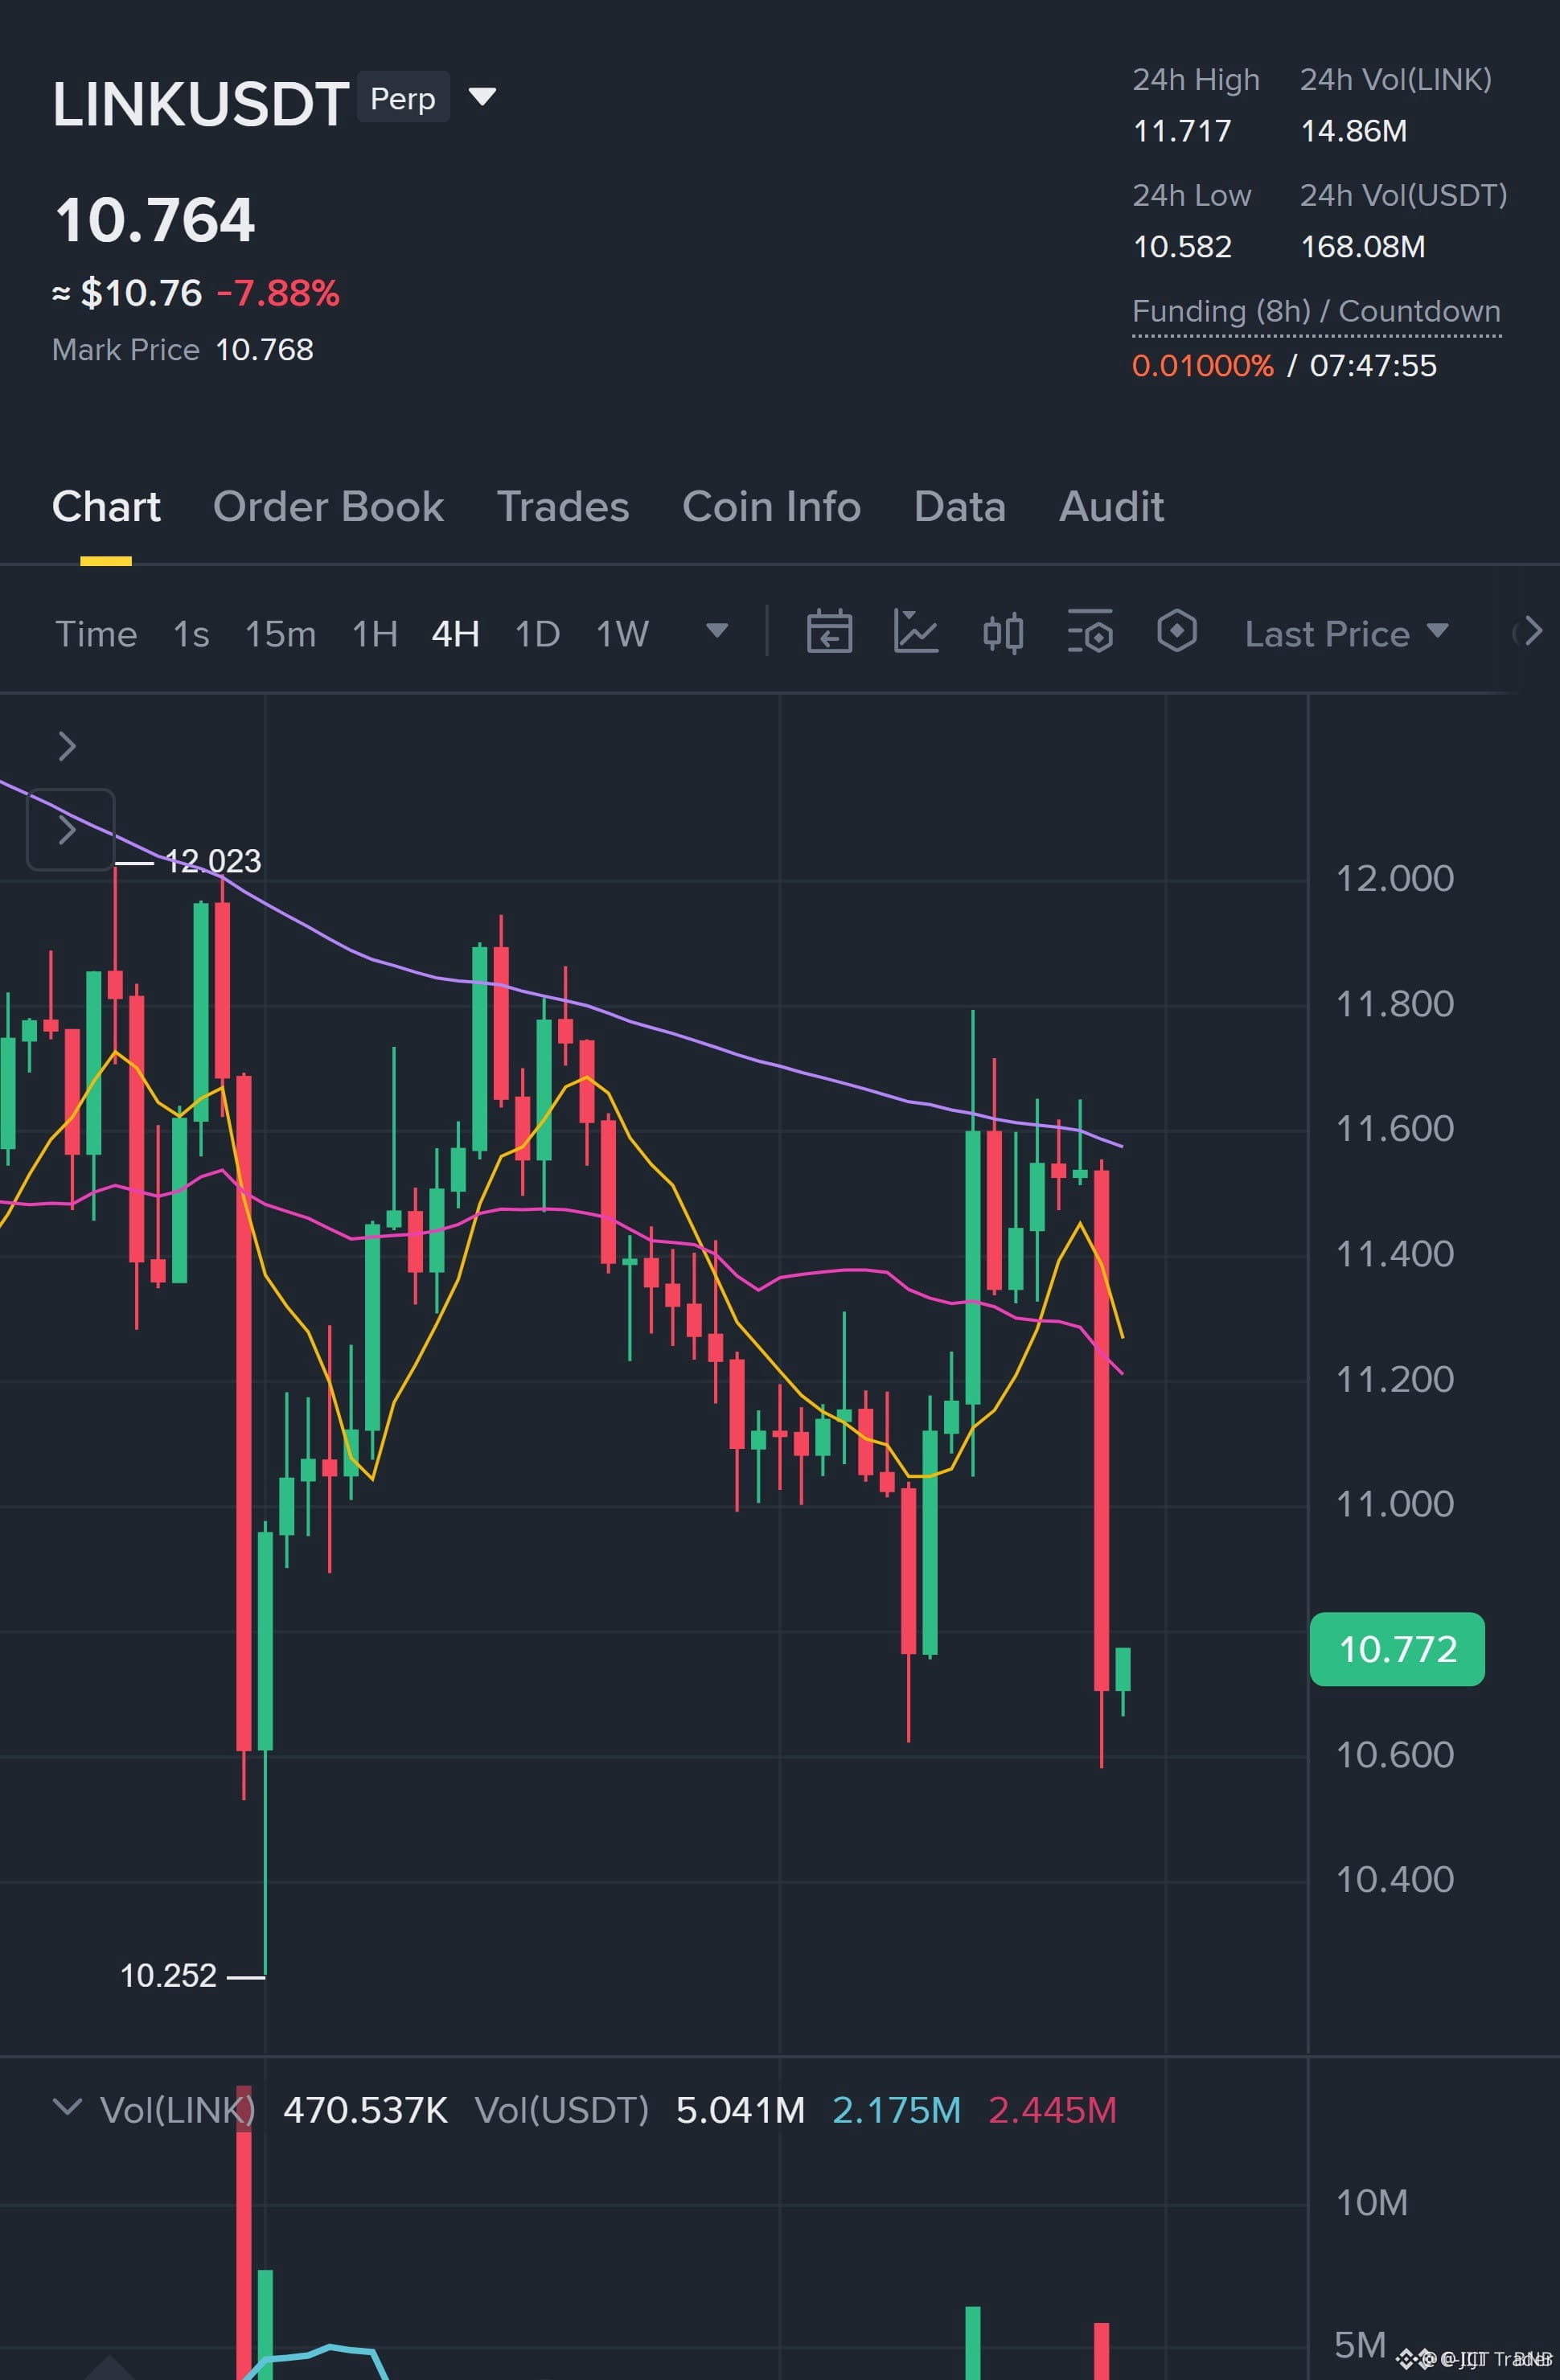
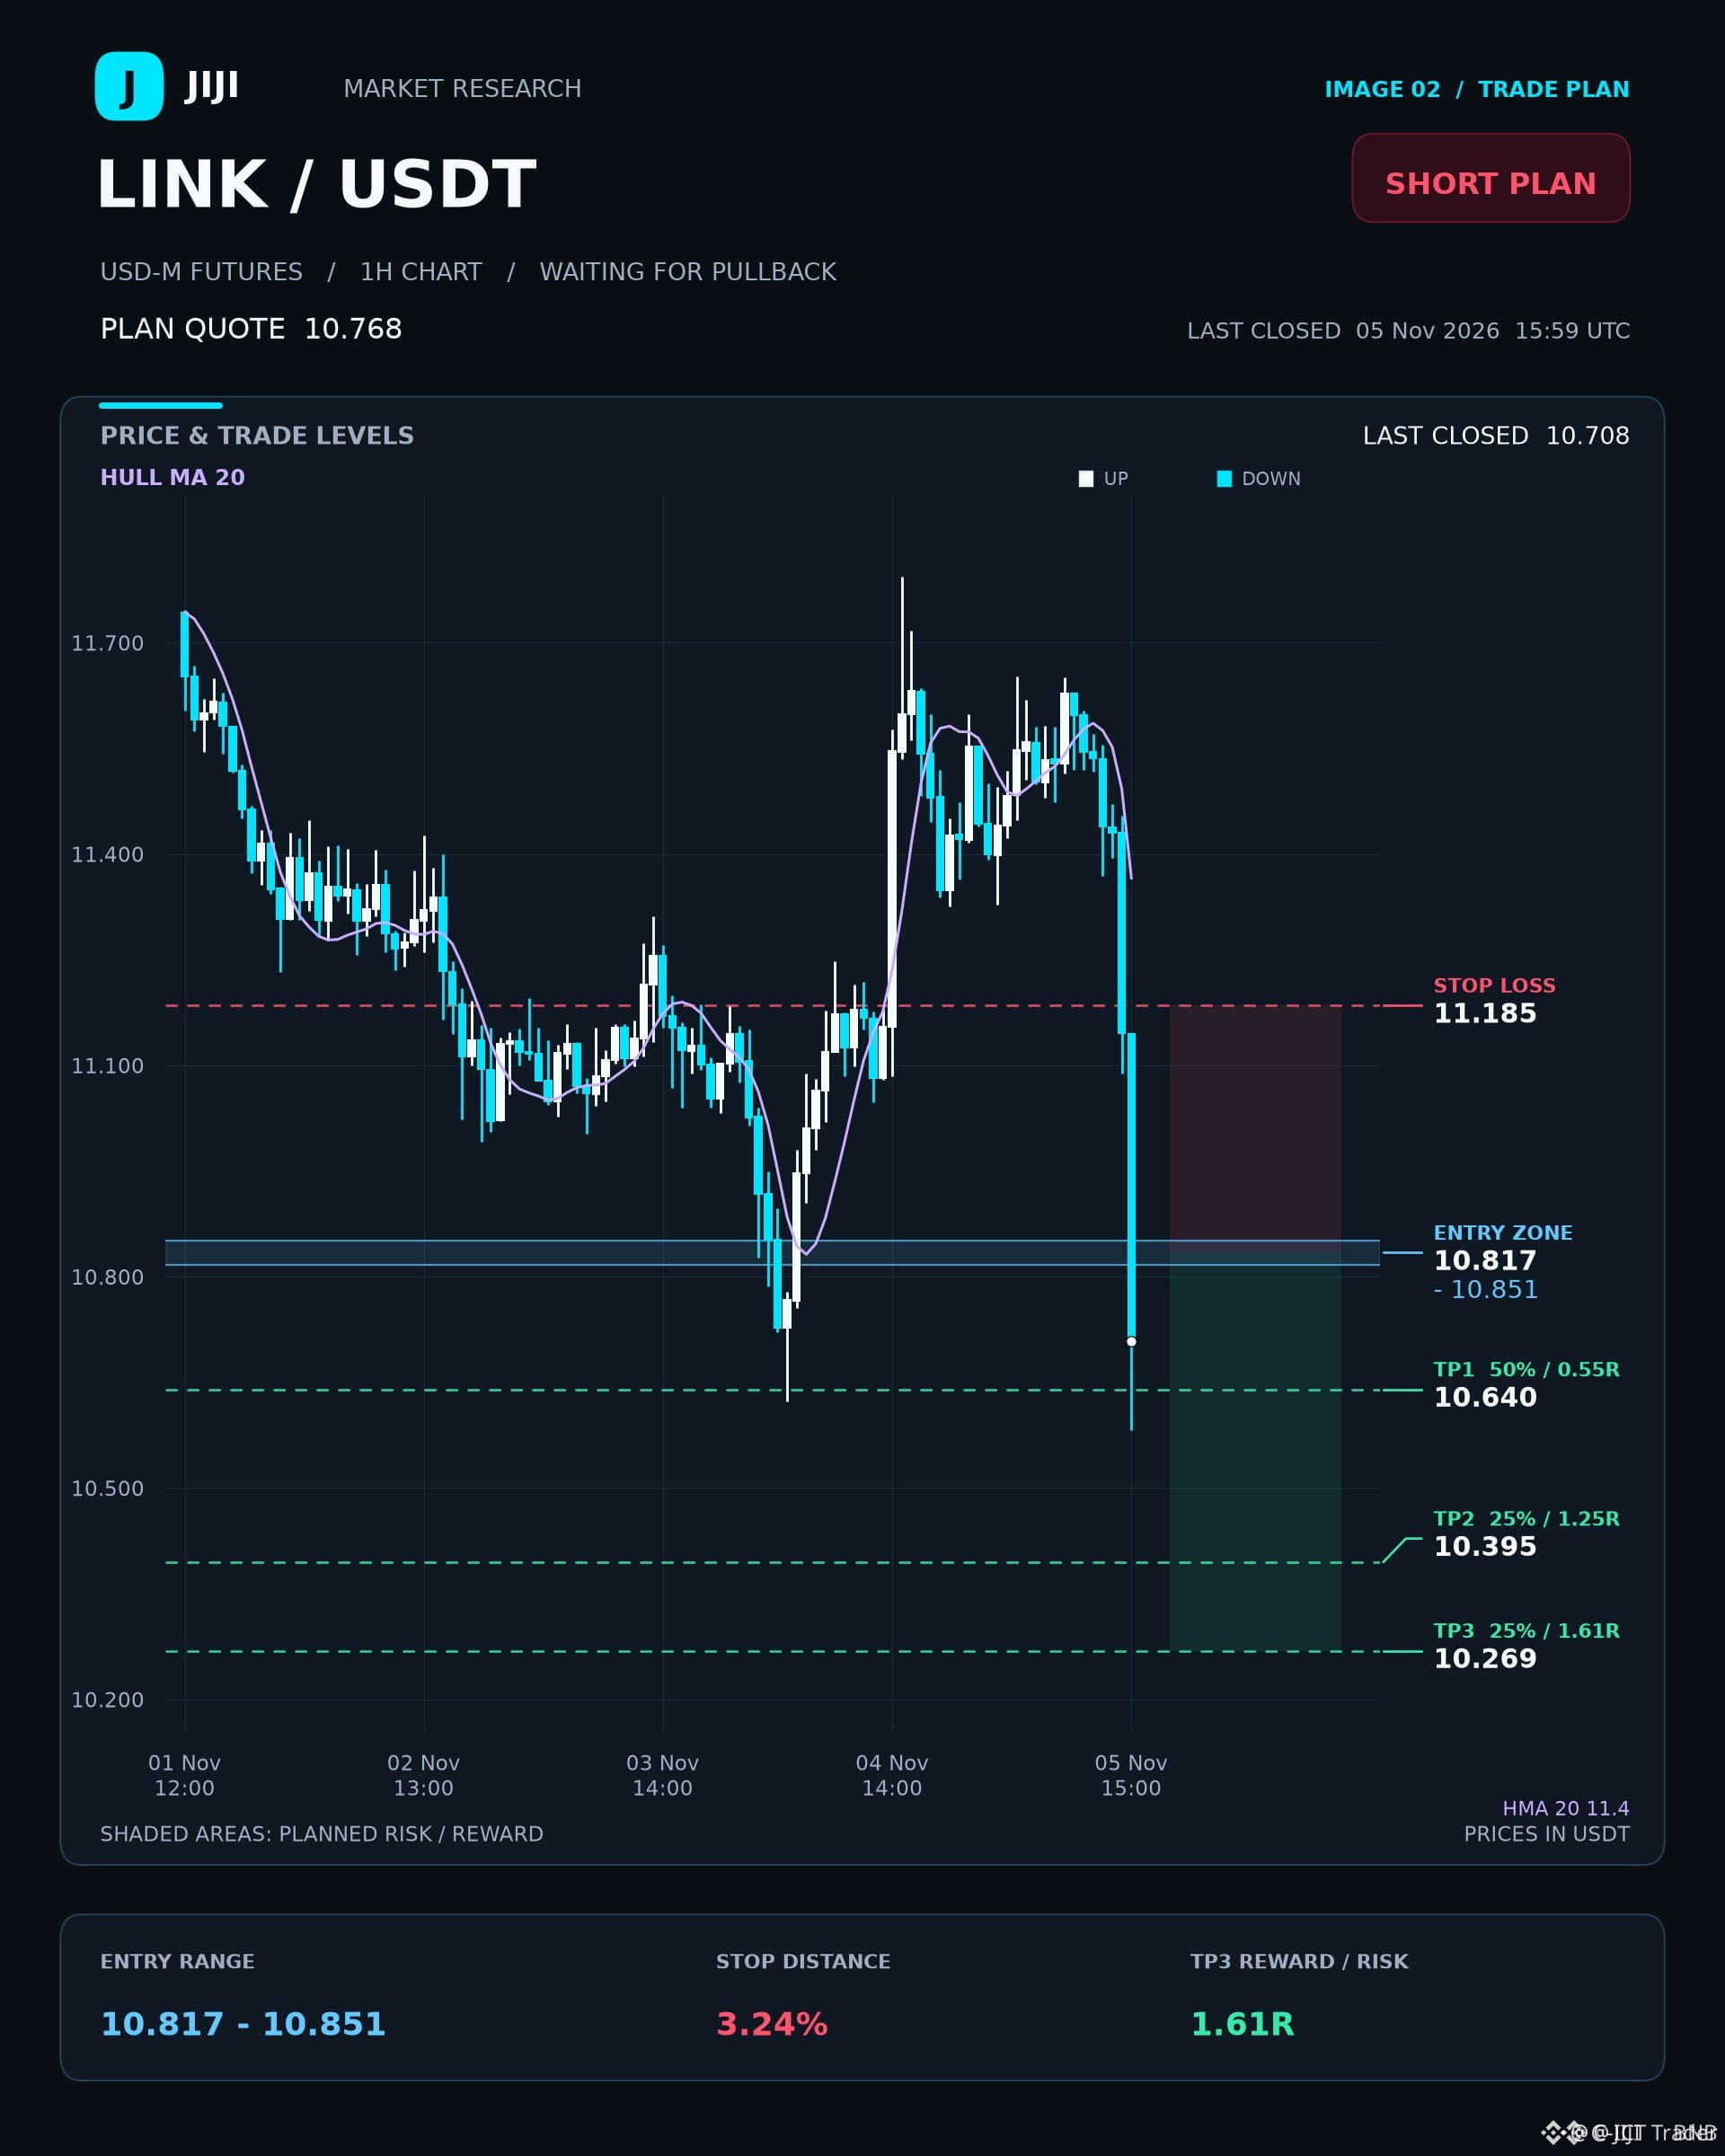
🔴 $LINK SLIDES INTO DEEP BEARISH EMA ZONE! 📉
Entry: 10.817‑10.851 ⚡
Target: 10.64 🚀
Target: 10.395 🚀
Target: 10.269 🚀
Stop Loss: 11.185 ⚠️
The 4‑hour EMA50/200 stack sits in a bearish alignment, reinforced by a 1‑hour EMA tilt and an RSI stuck at 24.4, signaling oversold pressure. 📊 DI+ at 3.7 versus DI‑ 53.0 and an ADX of 41.5 confirm the market’s strength to the downside.
Entry is confined to the 10.817‑10.851 band, a liquidity pocket where smart money is likely to absorb any short‑term bounce. 📌 Watch the 1‑hour support at 10.623; a break there could invalidate the plan. The risk‑reward ladder peaks at 1.61R with three tiered targets. 💬 Do you see the short thrust holding or waiting for a reversal bounce?
⚠️ Not financial advice. Always manage your risk. 🛡️
🏷️ #LINK #ShortSetup #EMA #Crypto
🔥 🦈
🔴 $LINK SLIDES INTO DEEP BEARISH EMA ZONE! 📉
Entry: 10.817‑10.851 ⚡
Target: 10.64 🚀
Target: 10.395 🚀
Target: 10.269 🚀
Stop Loss: 11.185 ⚠️
The 4‑hour EMA50/200 stack sits in a bearish alignment, reinforced by a 1‑hour EMA tilt and an RSI stuck at 24.4, signaling oversold pressure. 📊 DI+ at 3.7 versus DI‑ 53.0 and an ADX of 41.5 confirm the market’s strength to the downside.
Entry is confined to the 10.817‑10.851 band, a liquidity pocket where smart money is likely to absorb any short‑term bounce. 📌 Watch the 1‑hour support at 10.623; a break there could invalidate the plan. The risk‑reward ladder peaks at 1.61R with three tiered targets. 💬 Do you see the short thrust holding or waiting for a reversal bounce?
⚠️ Not financial advice. Always manage your risk. 🛡️
🏷️ #LINK #ShortSetup #EMA #Crypto
🔥 🦈
Entry: 10.817‑10.851 ⚡
Target: 10.64 🚀
Target: 10.395 🚀
Target: 10.269 🚀
Stop Loss: 11.185 ⚠️
The 4‑hour EMA50/200 stack sits in a bearish alignment, reinforced by a 1‑hour EMA tilt and an RSI stuck at 24.4, signaling oversold pressure. 📊 DI+ at 3.7 versus DI‑ 53.0 and an ADX of 41.5 confirm the market’s strength to the downside.
Entry is confined to the 10.817‑10.851 band, a liquidity pocket where smart money is likely to absorb any short‑term bounce. 📌 Watch the 1‑hour support at 10.623; a break there could invalidate the plan. The risk‑reward ladder peaks at 1.61R with three tiered targets. 💬 Do you see the short thrust holding or waiting for a reversal bounce?
⚠️ Not financial advice. Always manage your risk. 🛡️
🏷️ #LINK #ShortSetup #EMA #Crypto
🔥 🦈
10

·
--
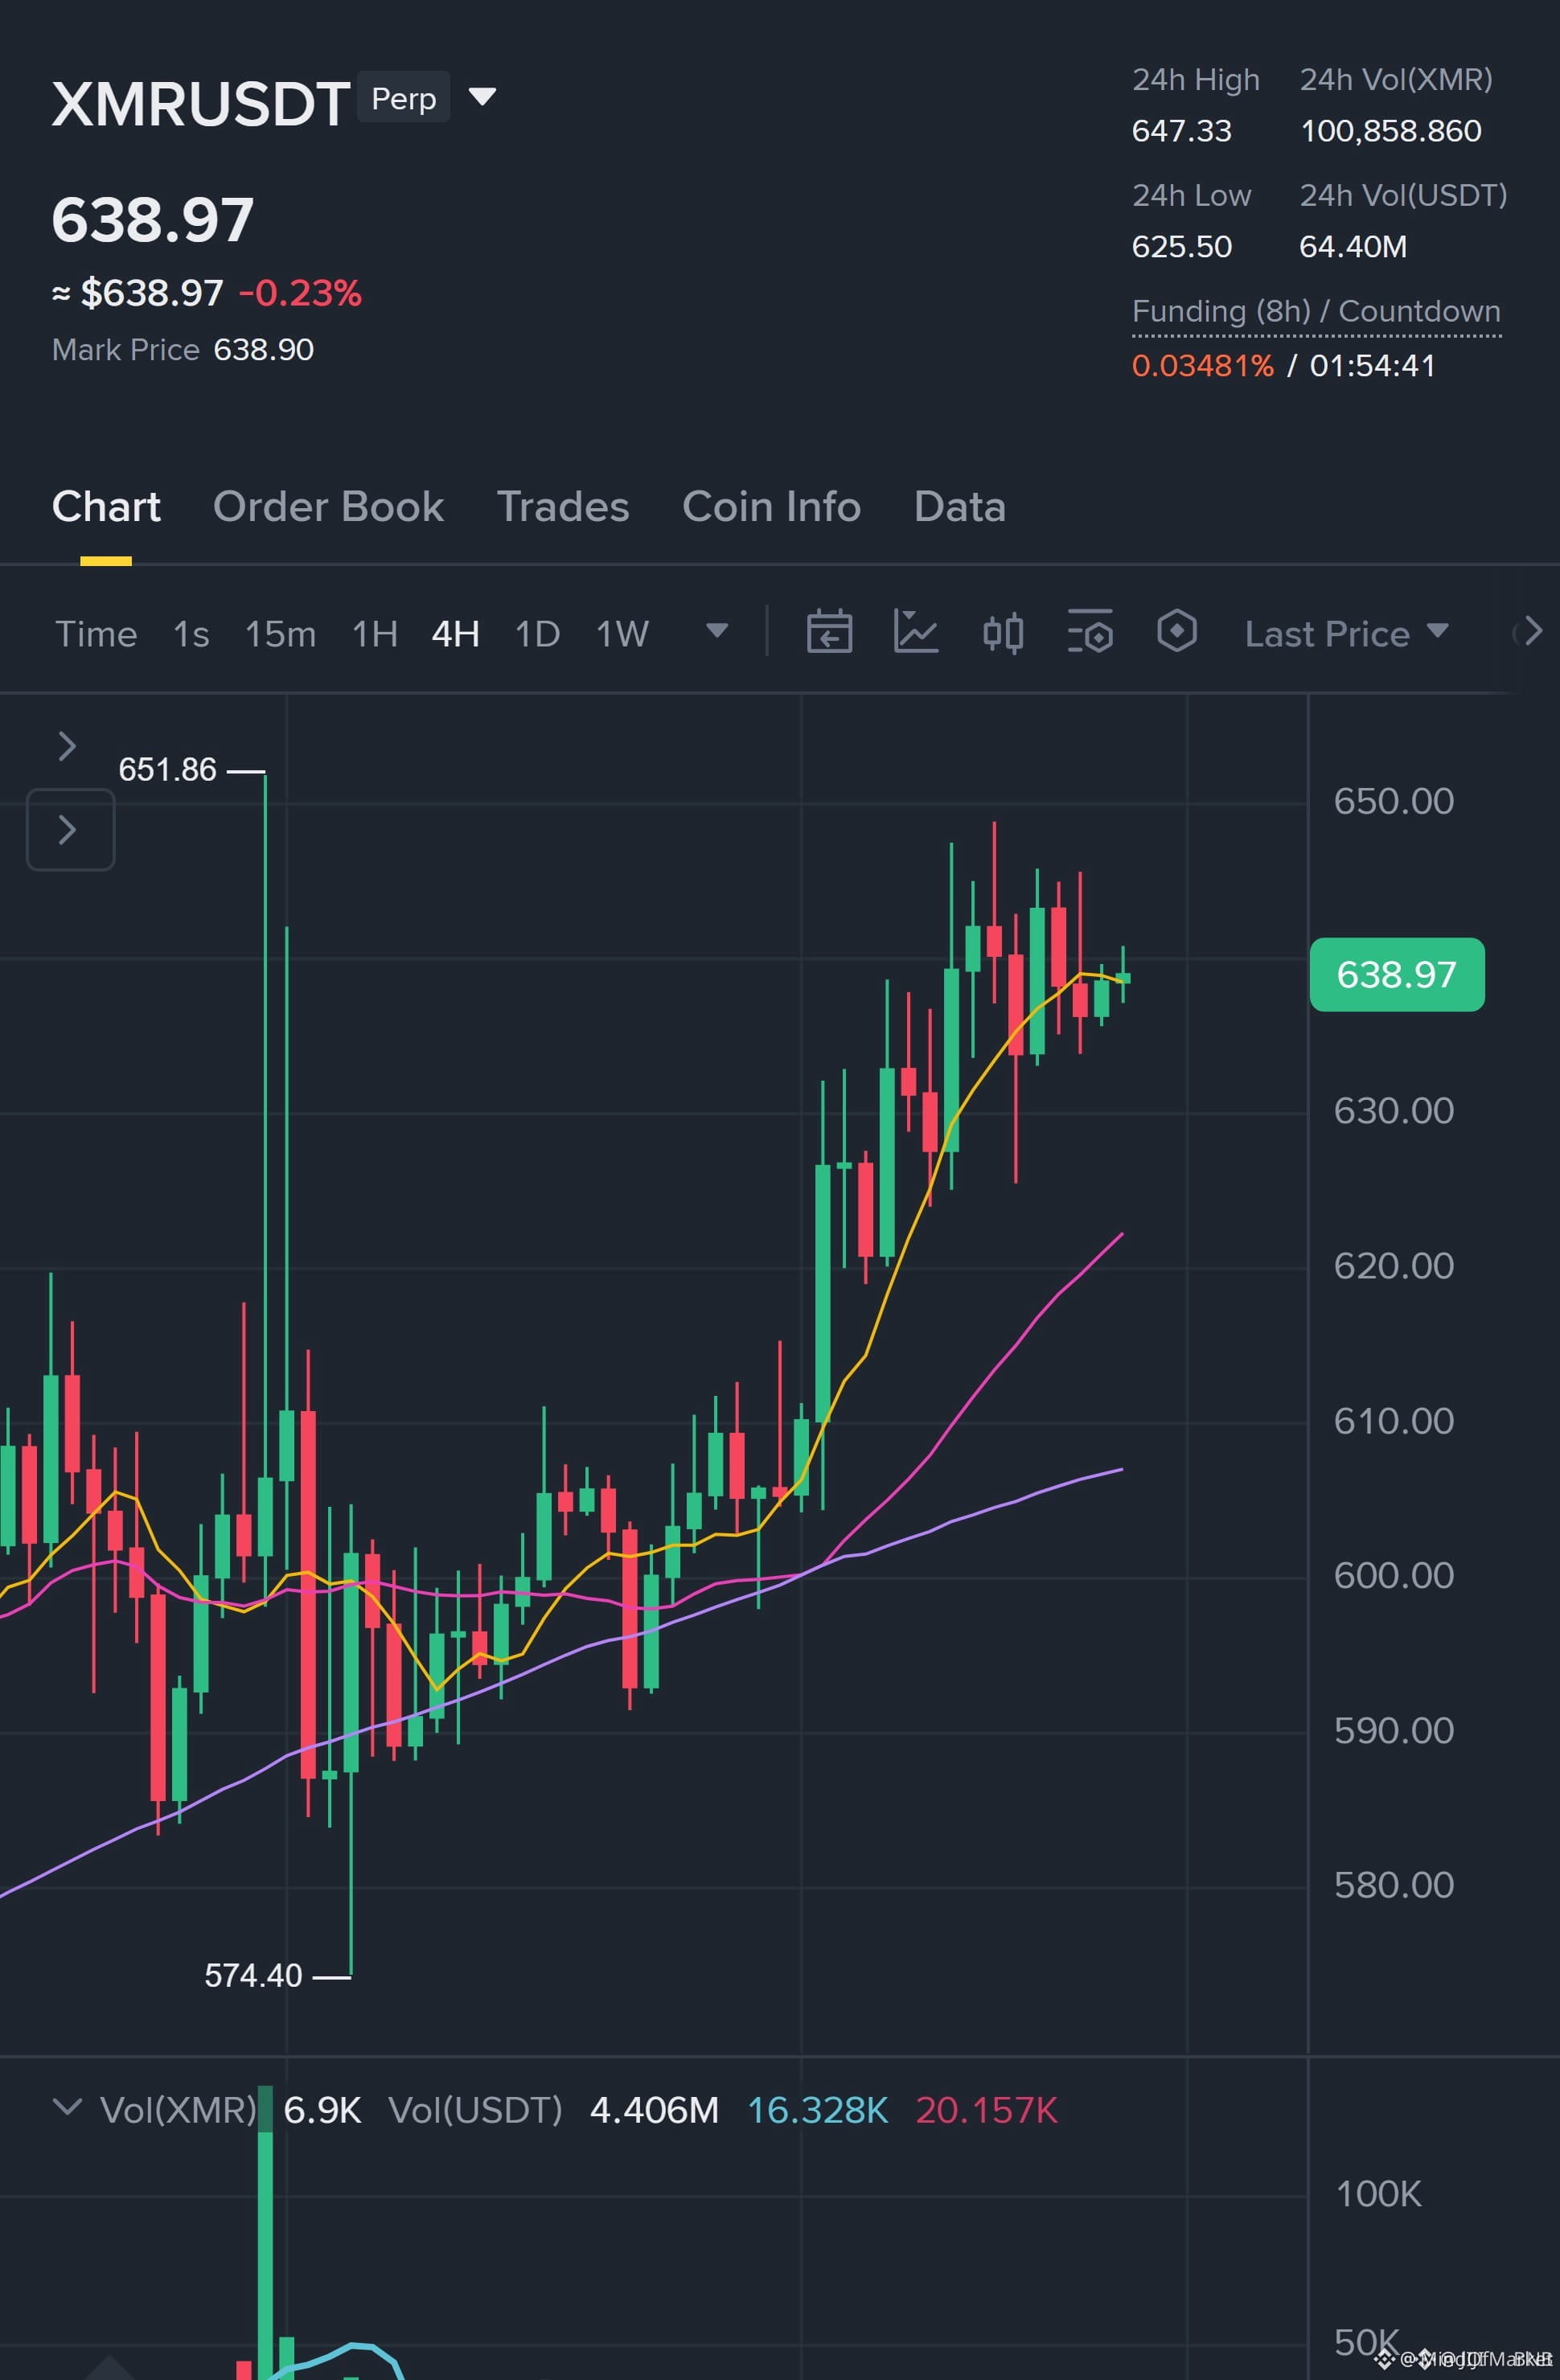
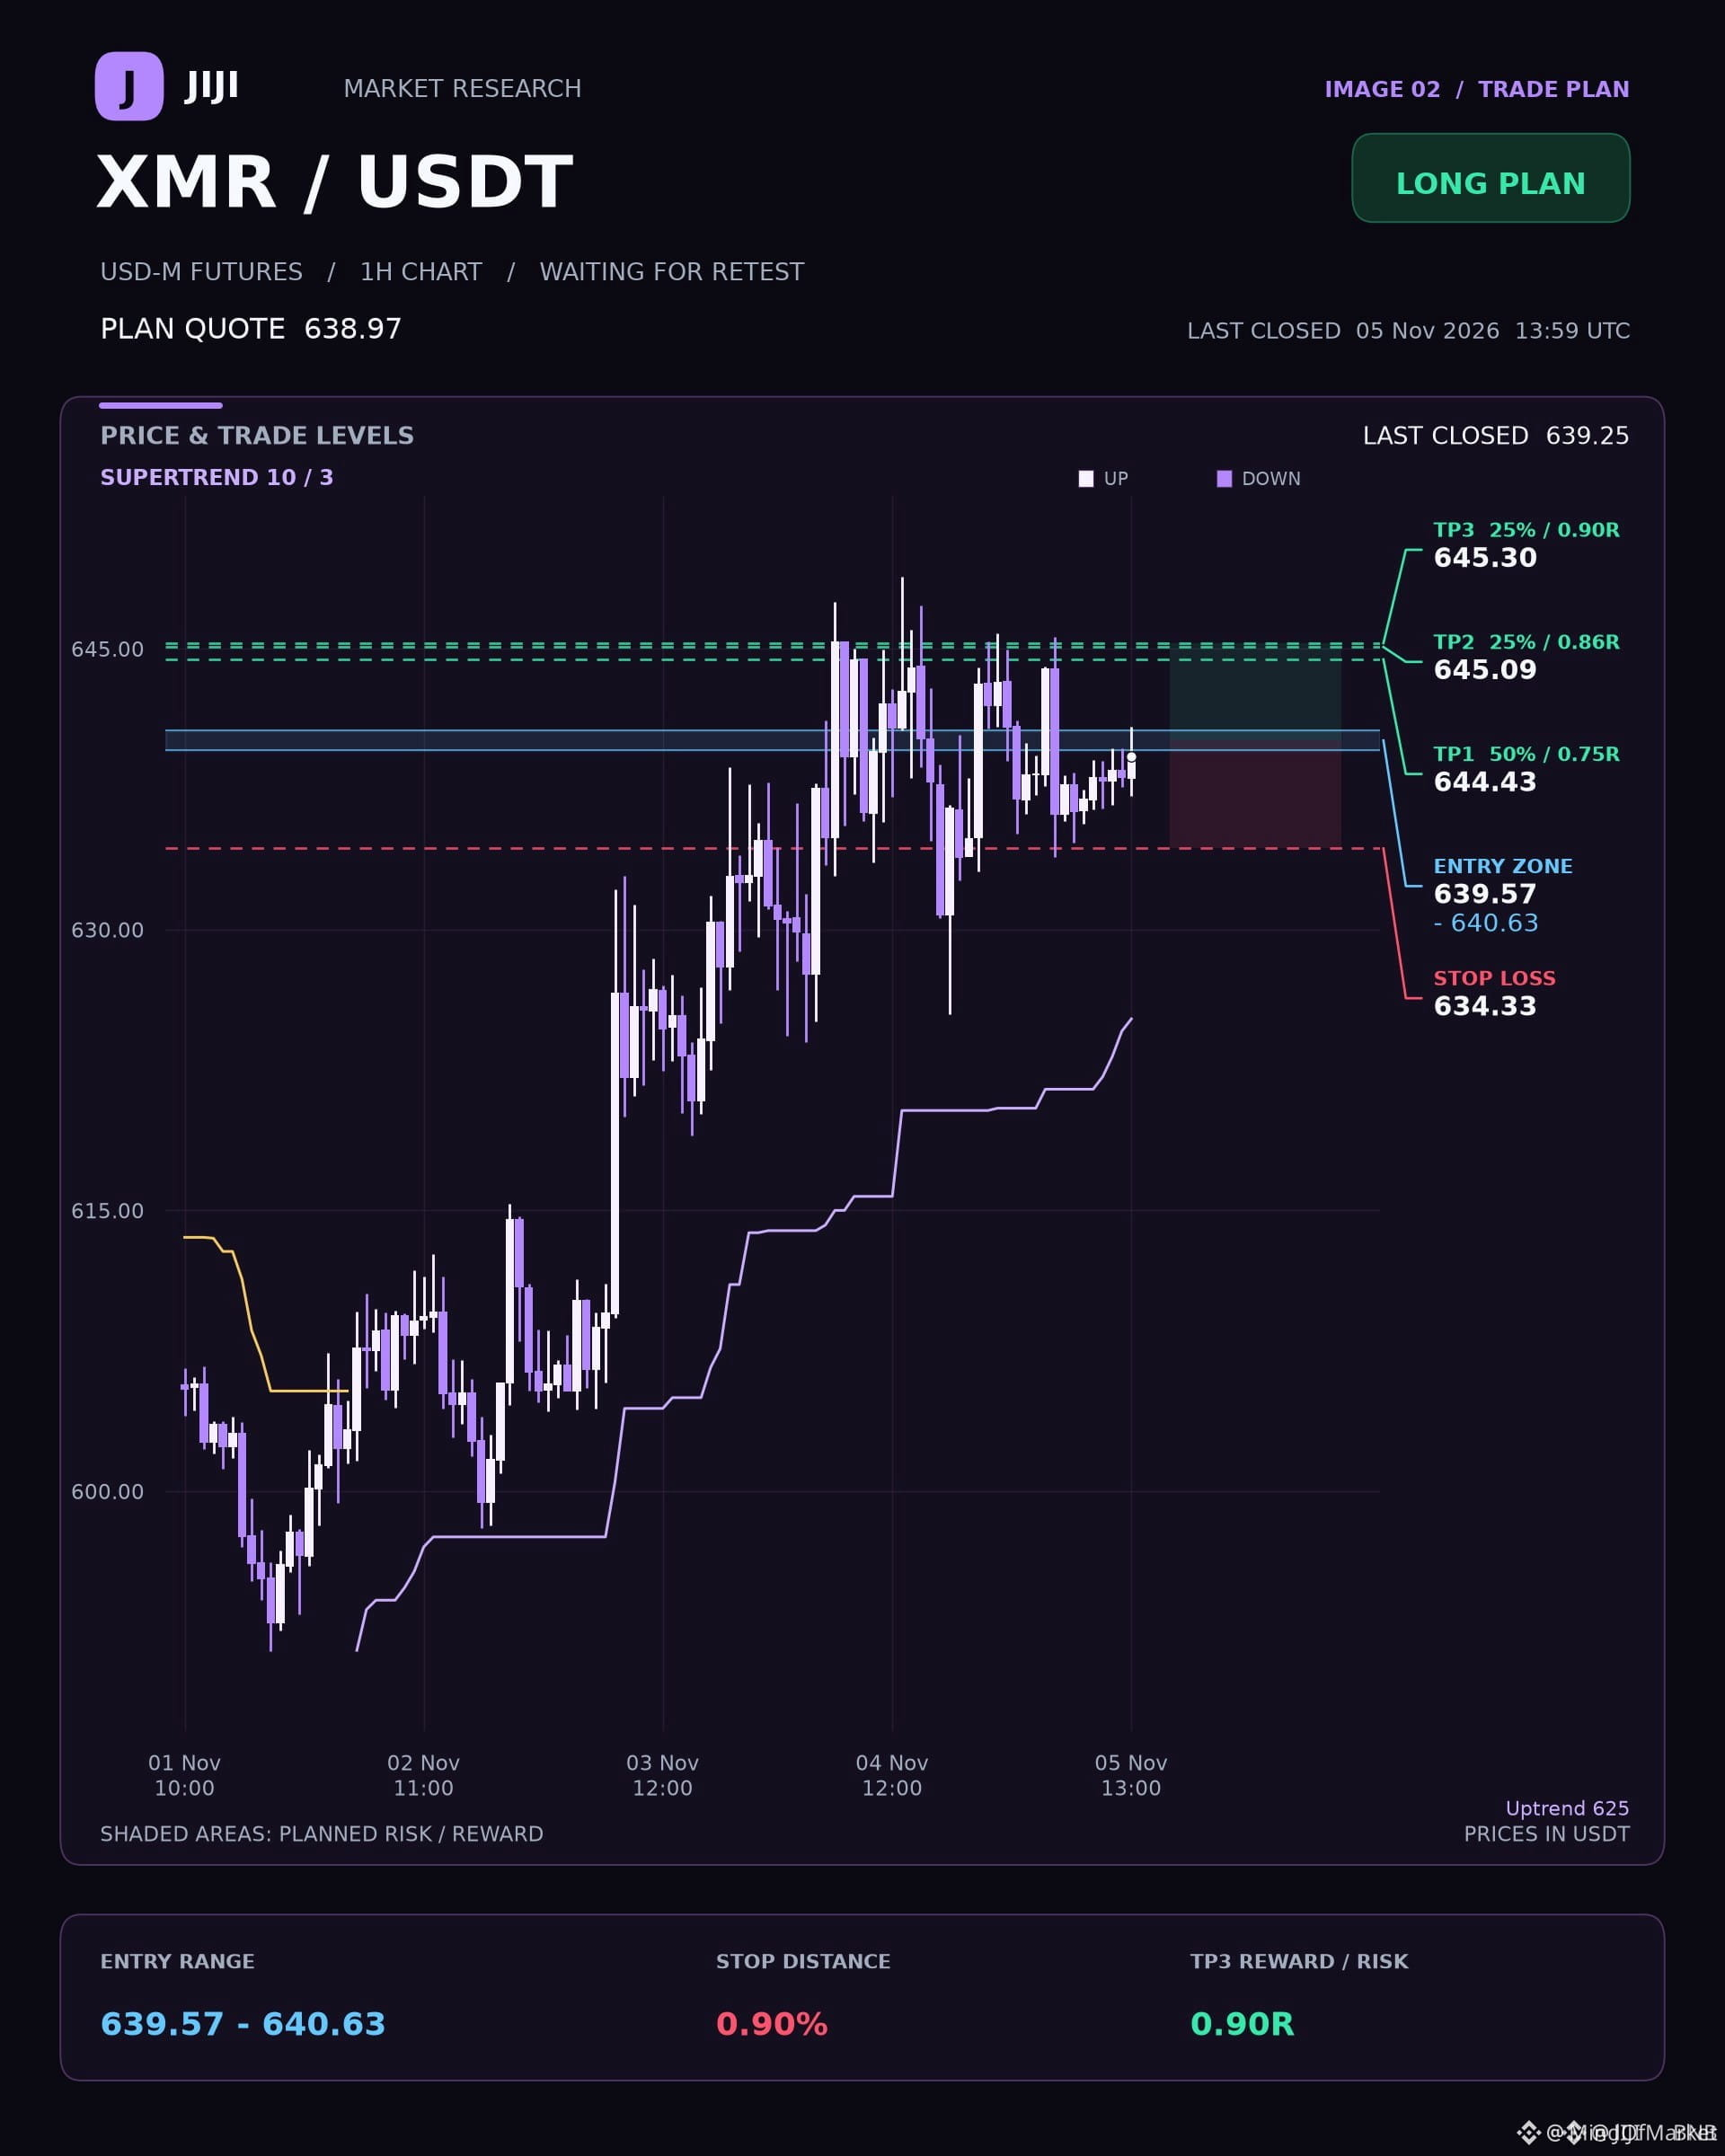
🚨 $XMR PREPARES FOR BREAKOUT ABOVE 640 WITH EMA ALIGNMENT! 📈
Entry: 639.57 ⚡
Target: 644.43 🚀
Stop Loss: 634.33 ⚠️
The 4‑hour EMA50/200 stack is bullish, and the 1‑hour slice stays in green, setting a clear path toward the 645.6 resistance barrier. 📊
DI+ outpaces DI‑ on the 15‑minute chart ⚡, while ADX hovers near 12, indicating nascent strength. A clean retest of the 639‑640 zone would let smart money push the price into the swing‑high corridor.
💬 Do you see the price reclaiming the zone before the 645.6 ceiling? 👇
⚠️ Not financial advice. Always manage your risk. 🛡️
🏷️ #XMR #LongSetup #EMA #Crypto
🔥 💎
🚨 $XMR PREPARES FOR BREAKOUT ABOVE 640 WITH EMA ALIGNMENT! 📈
Entry: 639.57 ⚡
Target: 644.43 🚀
Stop Loss: 634.33 ⚠️
The 4‑hour EMA50/200 stack is bullish, and the 1‑hour slice stays in green, setting a clear path toward the 645.6 resistance barrier. 📊
DI+ outpaces DI‑ on the 15‑minute chart ⚡, while ADX hovers near 12, indicating nascent strength. A clean retest of the 639‑640 zone would let smart money push the price into the swing‑high corridor.
💬 Do you see the price reclaiming the zone before the 645.6 ceiling? 👇
⚠️ Not financial advice. Always manage your risk. 🛡️
🏷️ #XMR #LongSetup #EMA #Crypto
🔥 💎
Entry: 639.57 ⚡
Target: 644.43 🚀
Stop Loss: 634.33 ⚠️
The 4‑hour EMA50/200 stack is bullish, and the 1‑hour slice stays in green, setting a clear path toward the 645.6 resistance barrier. 📊
DI+ outpaces DI‑ on the 15‑minute chart ⚡, while ADX hovers near 12, indicating nascent strength. A clean retest of the 639‑640 zone would let smart money push the price into the swing‑high corridor.
💬 Do you see the price reclaiming the zone before the 645.6 ceiling? 👇
⚠️ Not financial advice. Always manage your risk. 🛡️
🏷️ #XMR #LongSetup #EMA #Crypto
🔥 💎
22

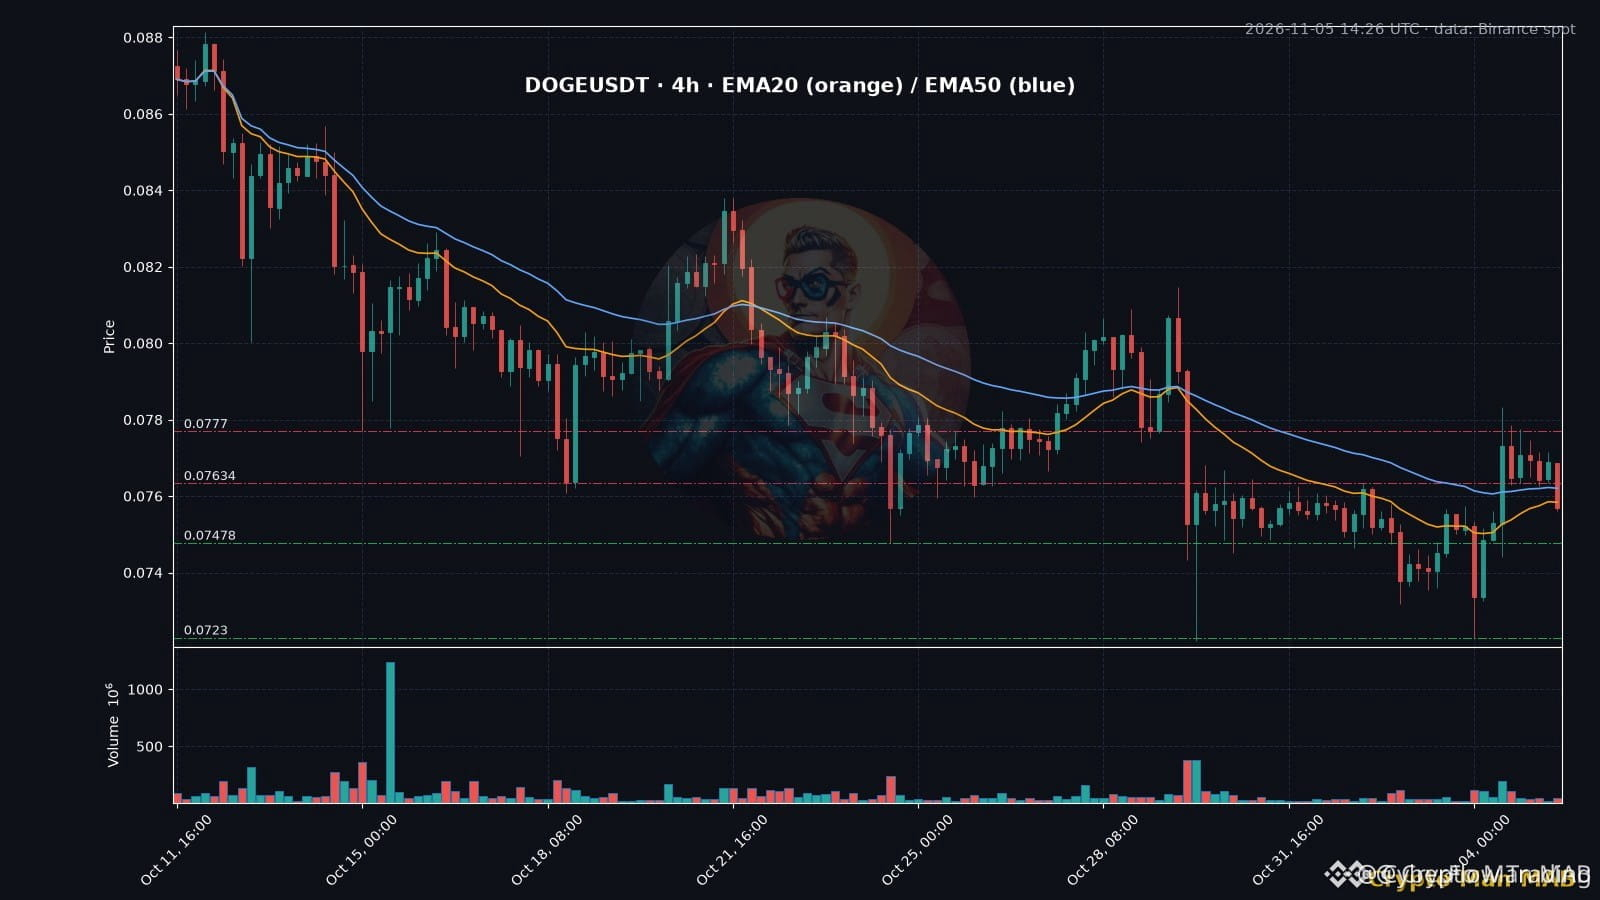
🚀 $DOGE SLIPPED BELOW EMA, LOOKING FOR REBOUND AT 0.0777 🟢
Entry: 0.0748 🟢
Target: 0.0800 🚀
Stop Loss: 0.0723 ⚠️
📊 Yesterday’s 4‑hour surge to 0.0783 lit up the order book, but the surge fizzled and price fell back under the dual EMA wall that’s been guarding the top since October. 🌊 Lower highs from the 0.088 peak are carving a descending channel, and the next 4‑hour close under 0.0748 could hand the floor to a 0.0723 wick.
⚡ The swing only flips if buyers reclaim the 0.0777 threshold and hold, opening a path to the 0.08 ceiling. 💡 Will the whales step in now or let the downtrend run its course? 💬
⚠️ Not financial advice. Always manage your risk. 🛡️
🏷️ #DOGE #ShortSetup #EMA #Crypto
🔥 💎
🚀 $DOGE SLIPPED BELOW EMA, LOOKING FOR REBOUND AT 0.0777 🟢
Entry: 0.0748 🟢
Target: 0.0800 🚀
Stop Loss: 0.0723 ⚠️
📊 Yesterday’s 4‑hour surge to 0.0783 lit up the order book, but the surge fizzled and price fell back under the dual EMA wall that’s been guarding the top since October. 🌊 Lower highs from the 0.088 peak are carving a descending channel, and the next 4‑hour close under 0.0748 could hand the floor to a 0.0723 wick.
⚡ The swing only flips if buyers reclaim the 0.0777 threshold and hold, opening a path to the 0.08 ceiling. 💡 Will the whales step in now or let the downtrend run its course? 💬
⚠️ Not financial advice. Always manage your risk. 🛡️
🏷️ #DOGE #ShortSetup #EMA #Crypto
🔥 💎
Entry: 0.0748 🟢
Target: 0.0800 🚀
Stop Loss: 0.0723 ⚠️
📊 Yesterday’s 4‑hour surge to 0.0783 lit up the order book, but the surge fizzled and price fell back under the dual EMA wall that’s been guarding the top since October. 🌊 Lower highs from the 0.088 peak are carving a descending channel, and the next 4‑hour close under 0.0748 could hand the floor to a 0.0723 wick.
⚡ The swing only flips if buyers reclaim the 0.0777 threshold and hold, opening a path to the 0.08 ceiling. 💡 Will the whales step in now or let the downtrend run its course? 💬
⚠️ Not financial advice. Always manage your risk. 🛡️
🏷️ #DOGE #ShortSetup #EMA #Crypto
🔥 💎
7

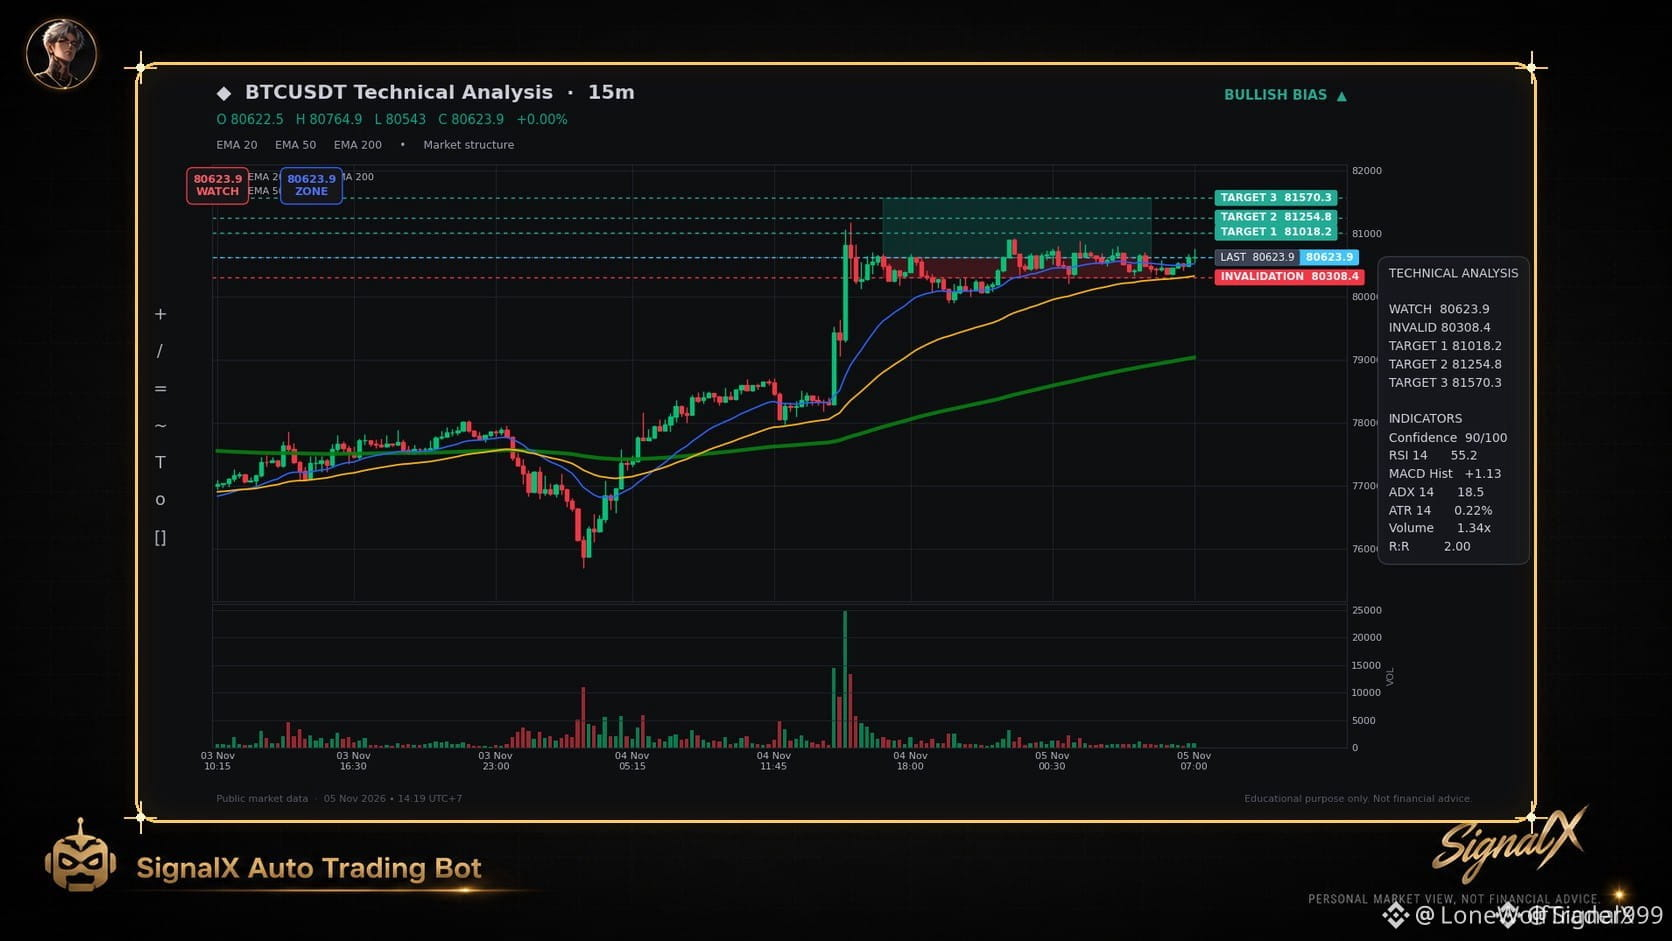
🚀 $BTC SURFING EMA ALIGNMENT, READY TO BREAK 81K? 📈
Entry: 80623.9 ⚡
Target: 81018.2 🚀
Stop Loss: 80308.4 ⚠️
📊 EMA200 now cradles price while EMA20/50/200 march in lockstep, giving the bulls a clean runway. ⚡ RSI sits at 55, MACD histogram stays positive and ADX nudges 18.5, confirming momentum without over‑extension. Volume spikes 1.34× the 20‑bar average, a clear liquidity sweep signal that smart money is loading positions. 🦈 The pullback looks like a continuation trap—hold the line and let the upside roar.
💬 Are you stacking bids at the 80.6k zone or waiting for a deeper dip? 👇
⚠️ Not financial advice. Always manage your risk. 🛡️
🏷️ #BTC #LongSetup #EMA #Crypto
🔥 💎
🚀 $BTC SURFING EMA ALIGNMENT, READY TO BREAK 81K? 📈
Entry: 80623.9 ⚡
Target: 81018.2 🚀
Stop Loss: 80308.4 ⚠️
📊 EMA200 now cradles price while EMA20/50/200 march in lockstep, giving the bulls a clean runway. ⚡ RSI sits at 55, MACD histogram stays positive and ADX nudges 18.5, confirming momentum without over‑extension. Volume spikes 1.34× the 20‑bar average, a clear liquidity sweep signal that smart money is loading positions. 🦈 The pullback looks like a continuation trap—hold the line and let the upside roar.
💬 Are you stacking bids at the 80.6k zone or waiting for a deeper dip? 👇
⚠️ Not financial advice. Always manage your risk. 🛡️
🏷️ #BTC #LongSetup #EMA #Crypto
🔥 💎
Entry: 80623.9 ⚡
Target: 81018.2 🚀
Stop Loss: 80308.4 ⚠️
📊 EMA200 now cradles price while EMA20/50/200 march in lockstep, giving the bulls a clean runway. ⚡ RSI sits at 55, MACD histogram stays positive and ADX nudges 18.5, confirming momentum without over‑extension. Volume spikes 1.34× the 20‑bar average, a clear liquidity sweep signal that smart money is loading positions. 🦈 The pullback looks like a continuation trap—hold the line and let the upside roar.
💬 Are you stacking bids at the 80.6k zone or waiting for a deeper dip? 👇
⚠️ Not financial advice. Always manage your risk. 🛡️
🏷️ #BTC #LongSetup #EMA #Crypto
🔥 💎

$EMA.US is catching attention with potential for a fresh market move! 📈 Strong momentum and increasing trading volume could support a bullish breakout. Watch key resistance levels for the next opportunity! 🔥#EMAsUnderstanding #ema
{stock_us}(EMA.US)
$EMA.US is catching attention with potential for a fresh market move! 📈 Strong momentum and increasing trading volume could support a bullish breakout. Watch key resistance levels for the next opportunity! 🔥#EMAsUnderstanding #ema
EMAUS+0,01%
49
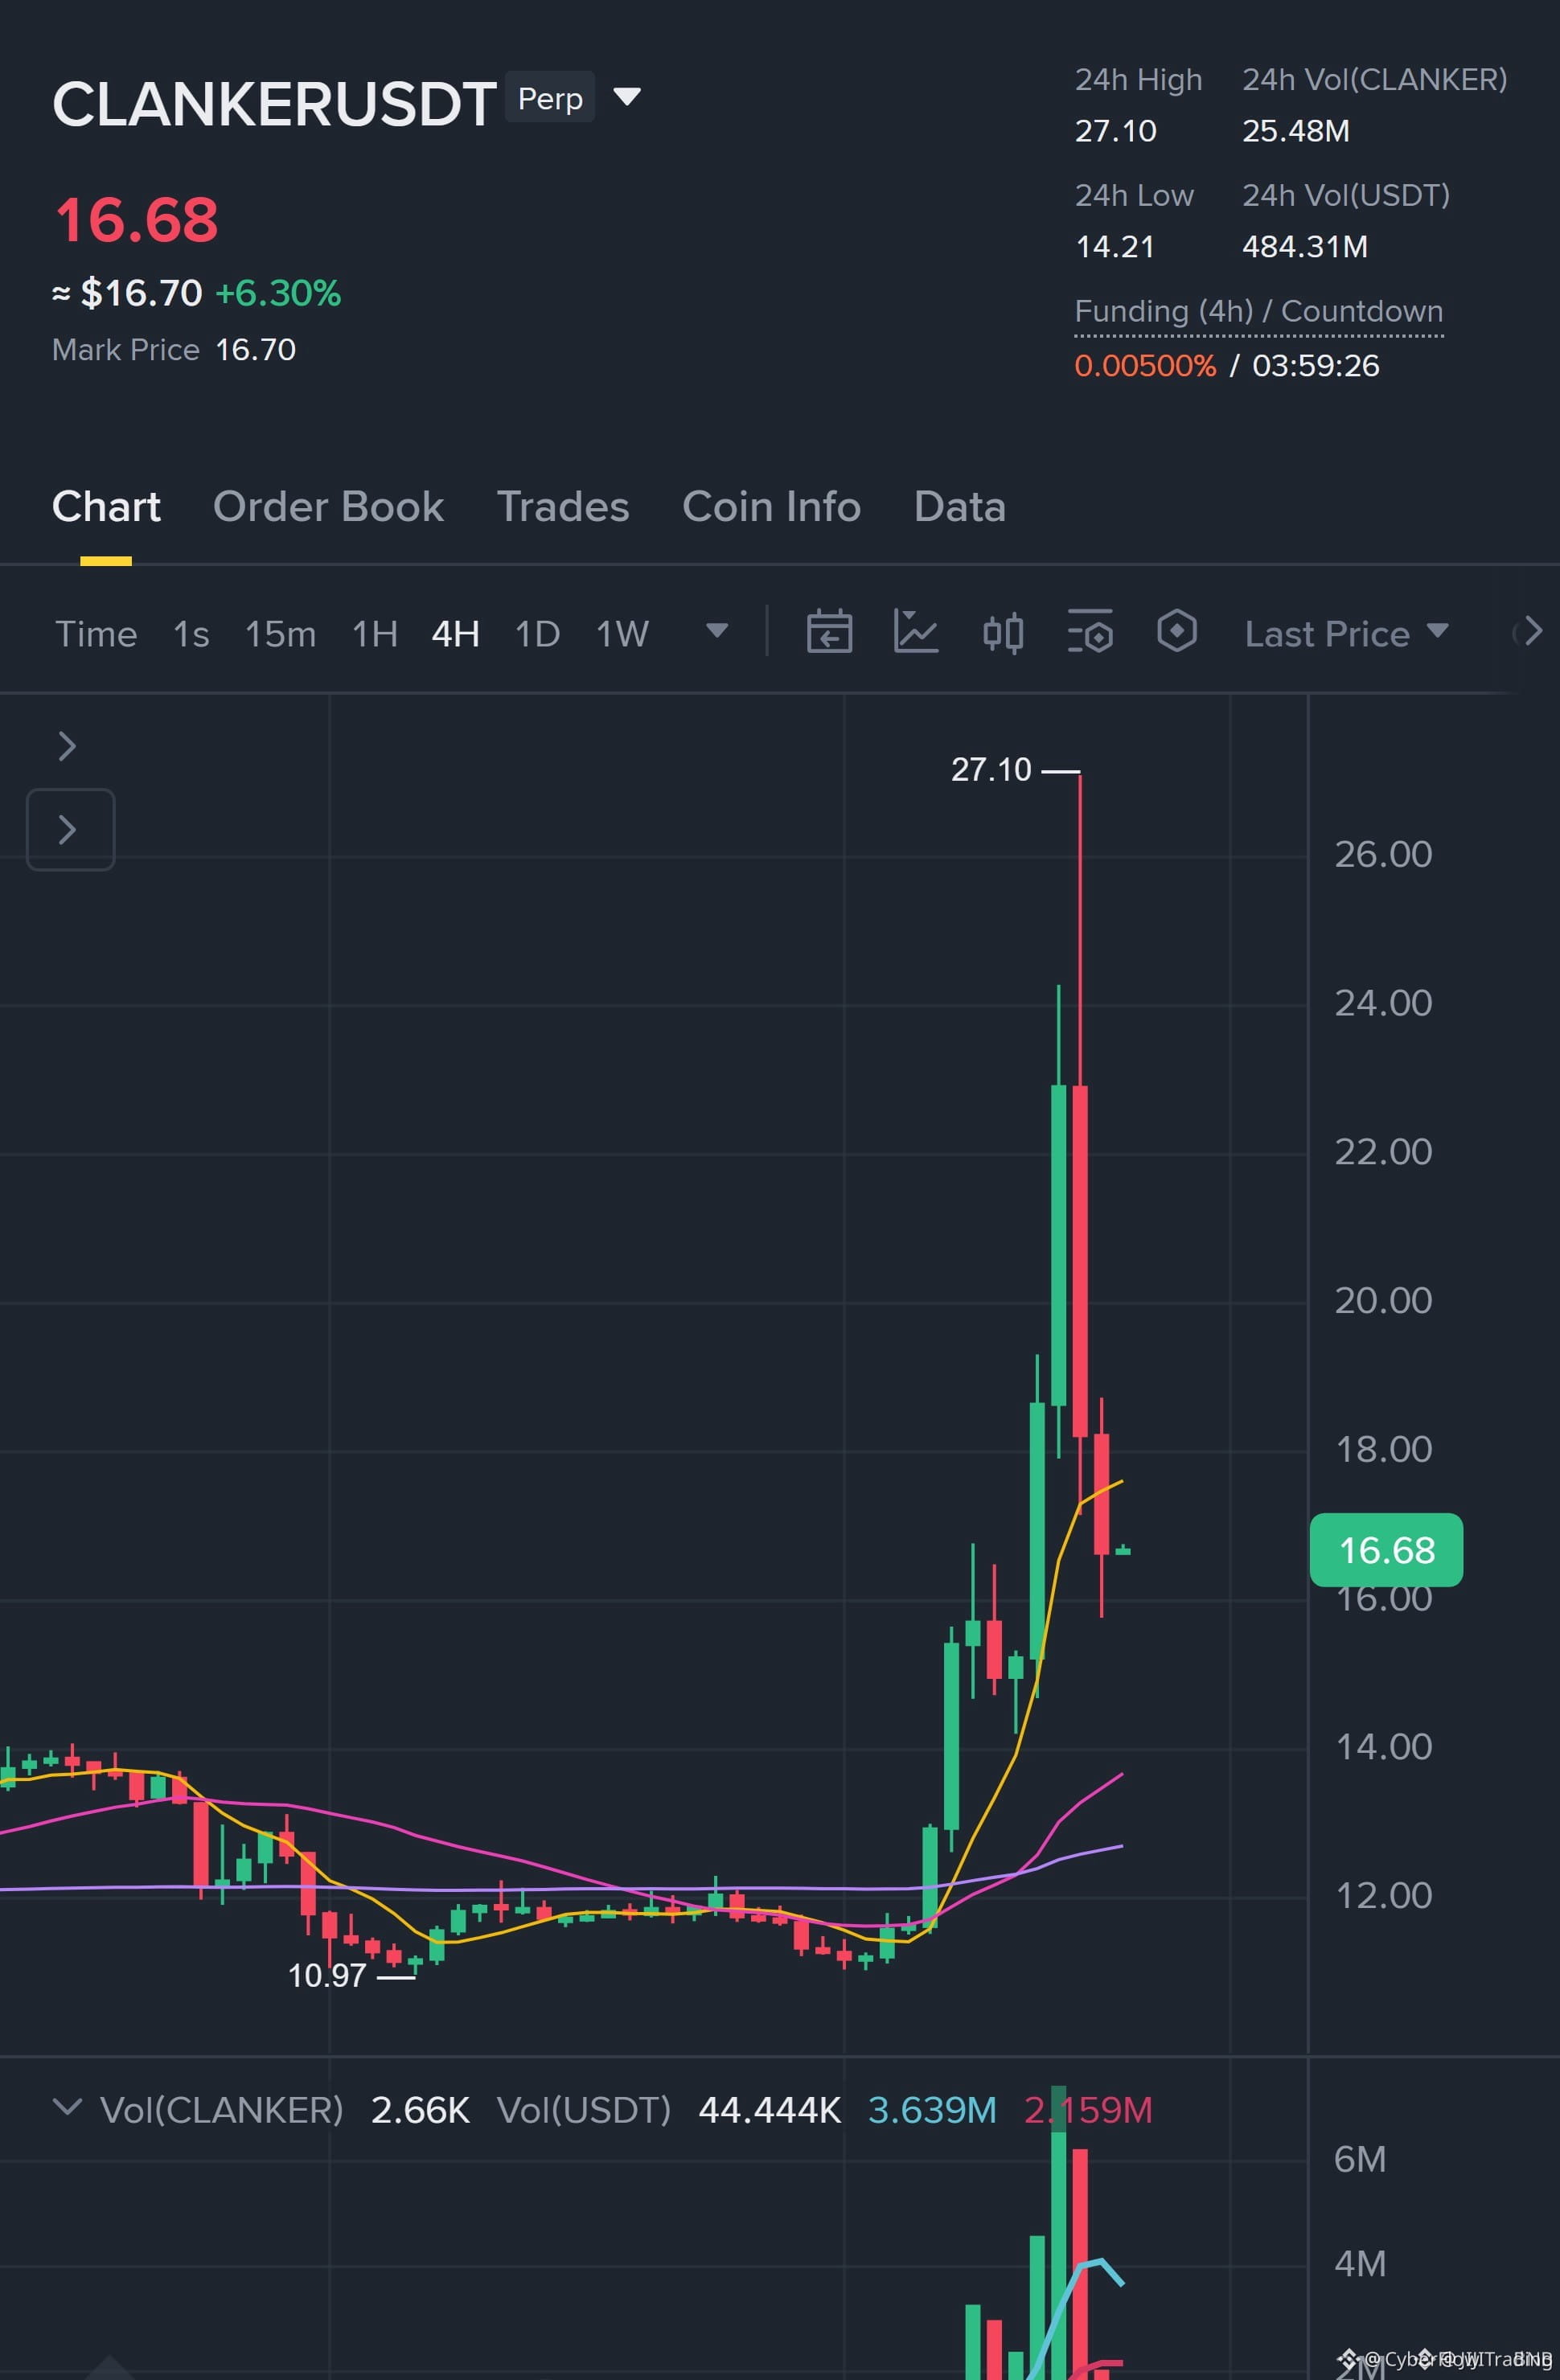
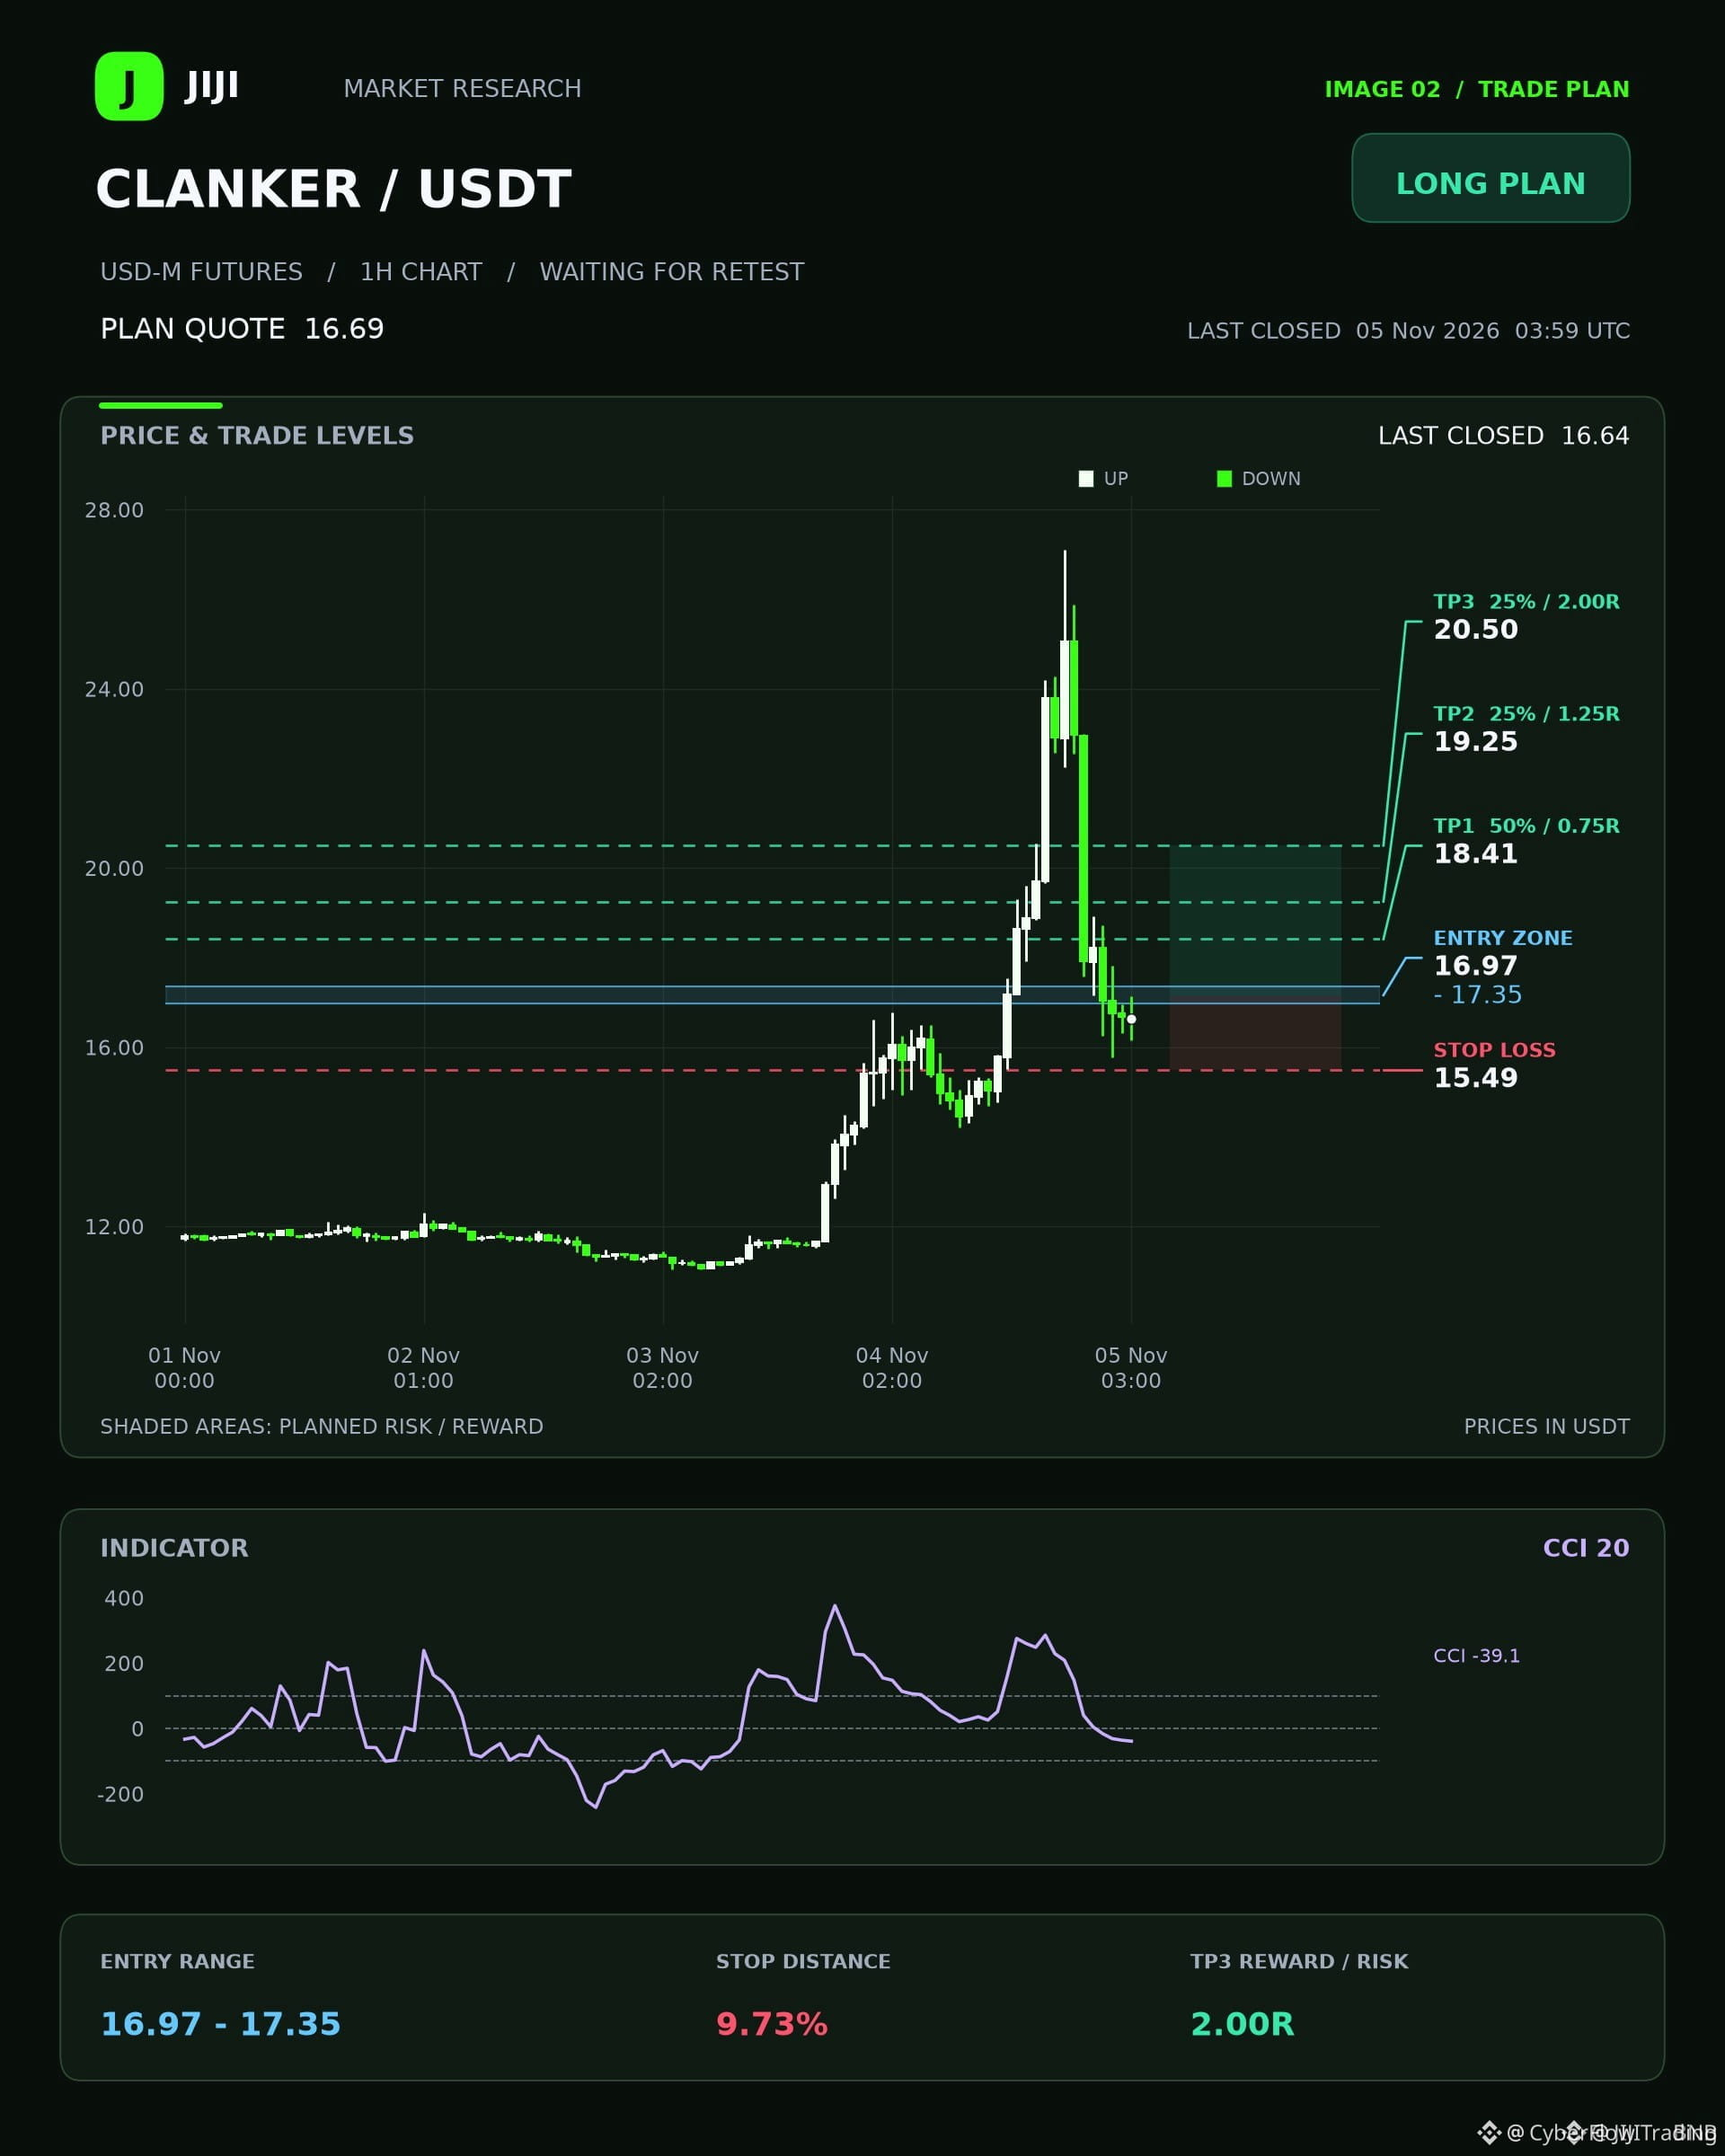
🚀 $CLANKER RIDE THE 4H EMA CLIMB, RECLAIM ZONE READY 📈
Entry: 16.97-17.35 ⚡
Target: 18.41 🚀
Target: 19.25 🚀
Target: 20.50 🚀
Stop Loss: 15.49 ⚠️
📊 The 4H trend is humming green while the 15m directional balance teeters, hinting at a short‑term squeeze. Once price snags the reclaimed zone, a closed 15m candle will lock in the bullish EMA alignment across 4H and 1H. 🌊 Smart money is likely loading positions, and the risk‑reward stack tops 2:1 at the upper target. 💡 Keep eyes on that 15m candle—if it flips, the swing could evaporate.
⚠️ Not financial advice. Always manage your risk. 🛡️
🏷️ #CLANKER #LongSetup #EMA #Crypto
🔥 💎
🚀 $CLANKER RIDE THE 4H EMA CLIMB, RECLAIM ZONE READY 📈
Entry: 16.97-17.35 ⚡
Target: 18.41 🚀
Target: 19.25 🚀
Target: 20.50 🚀
Stop Loss: 15.49 ⚠️
📊 The 4H trend is humming green while the 15m directional balance teeters, hinting at a short‑term squeeze. Once price snags the reclaimed zone, a closed 15m candle will lock in the bullish EMA alignment across 4H and 1H. 🌊 Smart money is likely loading positions, and the risk‑reward stack tops 2:1 at the upper target. 💡 Keep eyes on that 15m candle—if it flips, the swing could evaporate.
⚠️ Not financial advice. Always manage your risk. 🛡️
🏷️ #CLANKER #LongSetup #EMA #Crypto
🔥 💎
Entry: 16.97-17.35 ⚡
Target: 18.41 🚀
Target: 19.25 🚀
Target: 20.50 🚀
Stop Loss: 15.49 ⚠️
📊 The 4H trend is humming green while the 15m directional balance teeters, hinting at a short‑term squeeze. Once price snags the reclaimed zone, a closed 15m candle will lock in the bullish EMA alignment across 4H and 1H. 🌊 Smart money is likely loading positions, and the risk‑reward stack tops 2:1 at the upper target. 💡 Keep eyes on that 15m candle—if it flips, the swing could evaporate.
⚠️ Not financial advice. Always manage your risk. 🛡️
🏷️ #CLANKER #LongSetup #EMA #Crypto
🔥 💎
12
ເຂົ້າສູ່ລະບົບເພື່ອສຳຫຼວດເນື້ອຫາເພີ່ມເຕີມ
ເຂົ້າຮ່ວມກຸ່ມຜູ້ໃຊ້ຄຣິບໂຕທົ່ວໂລກໃນ Binance Square.
⚡️ ໄດ້ຮັບຂໍ້ມູນຫຼ້າສຸດ ແລະ ທີ່ມີປະໂຫຍດກ່ຽວກັບຄຣິບໂຕ.
💬 ໄດ້ຮັບຄວາມໄວ້ວາງໃຈຈາກຕະຫຼາດແລກປ່ຽນຄຣິບໂຕທີ່ໃຫຍ່ທີ່ສຸດໃນໂລກ.
👍 ຄົ້ນຫາຂໍ້ມູນເຊີງເລິກທີ່ແທ້ຈາກນັກສ້າງທີ່ໄດ້ຮັບການຢືນຢັນ.
ອີເມວ / ເບີໂທລະສັບ
ຫົວຂໍ້ທີ່ກໍາລັງນິຍົມ
1
#USPPIMissMayEaseBTCPressure
47,223 ຄັ້ງທີ່ເບິ່ງ
778 ກຳລັງສົນທະນາ
2
#BitcoinCoreDisclosesTorTrafficVulnerability
18,890 ຄັ້ງທີ່ເບິ່ງ
415 ກຳລັງສົນທະນາ
3
#WhatWillDriveCryptoandStocks’NextRebound?
161,289 ຄັ້ງທີ່ເບິ່ງ
1,631 ກຳລັງສົນທະນາ
4
#BitcoinBreaksBelow200WeekMovingAverage
54,397 ຄັ້ງທີ່ເບິ່ງ
524 ກຳລັງສົນທະນາ
5
#SpaceXTeslaMergerTalksWouldCombine30220BTC
18,146 ຄັ້ງທີ່ເບິ່ງ
287 ກຳລັງສົນທະນາ
6
#Anthropic’s6xIPODemandSignalsPotentialRecordRaise
55,788 ຄັ້ງທີ່ເບິ່ງ
743 ກຳລັງສົນທະນາ
7
#USCryptoETFsLose$1.48BInFiveDays
2,772 ຄັ້ງທີ່ເບິ່ງ
51 ກຳລັງສົນທະນາ
8
#KoreaDigitalAssetBasicActFinalDraftExpectedEarlyJanuary
3,817 ຄັ້ງທີ່ເບິ່ງ
23 ກຳລັງສົນທະນາ
9
#RippleRLUSDMarketCapSurpassesPayPalPYUSD
11,885 ຄັ້ງທີ່ເບິ່ງ
151 ກຳລັງສົນທະນາ
10
#JaneStreetNearlyOctuplesFidelityBitcoinETFHoldings
25,925 ຄັ້ງທີ່ເບິ່ງ
265 ກຳລັງສົນທະນາ