btcusdtanalysis

476,751 ຄັ້ງທີ່ເບິ່ງ
1,194 ກຳລັງສົນທະນາ
CryptoSignalsCCK
·
--
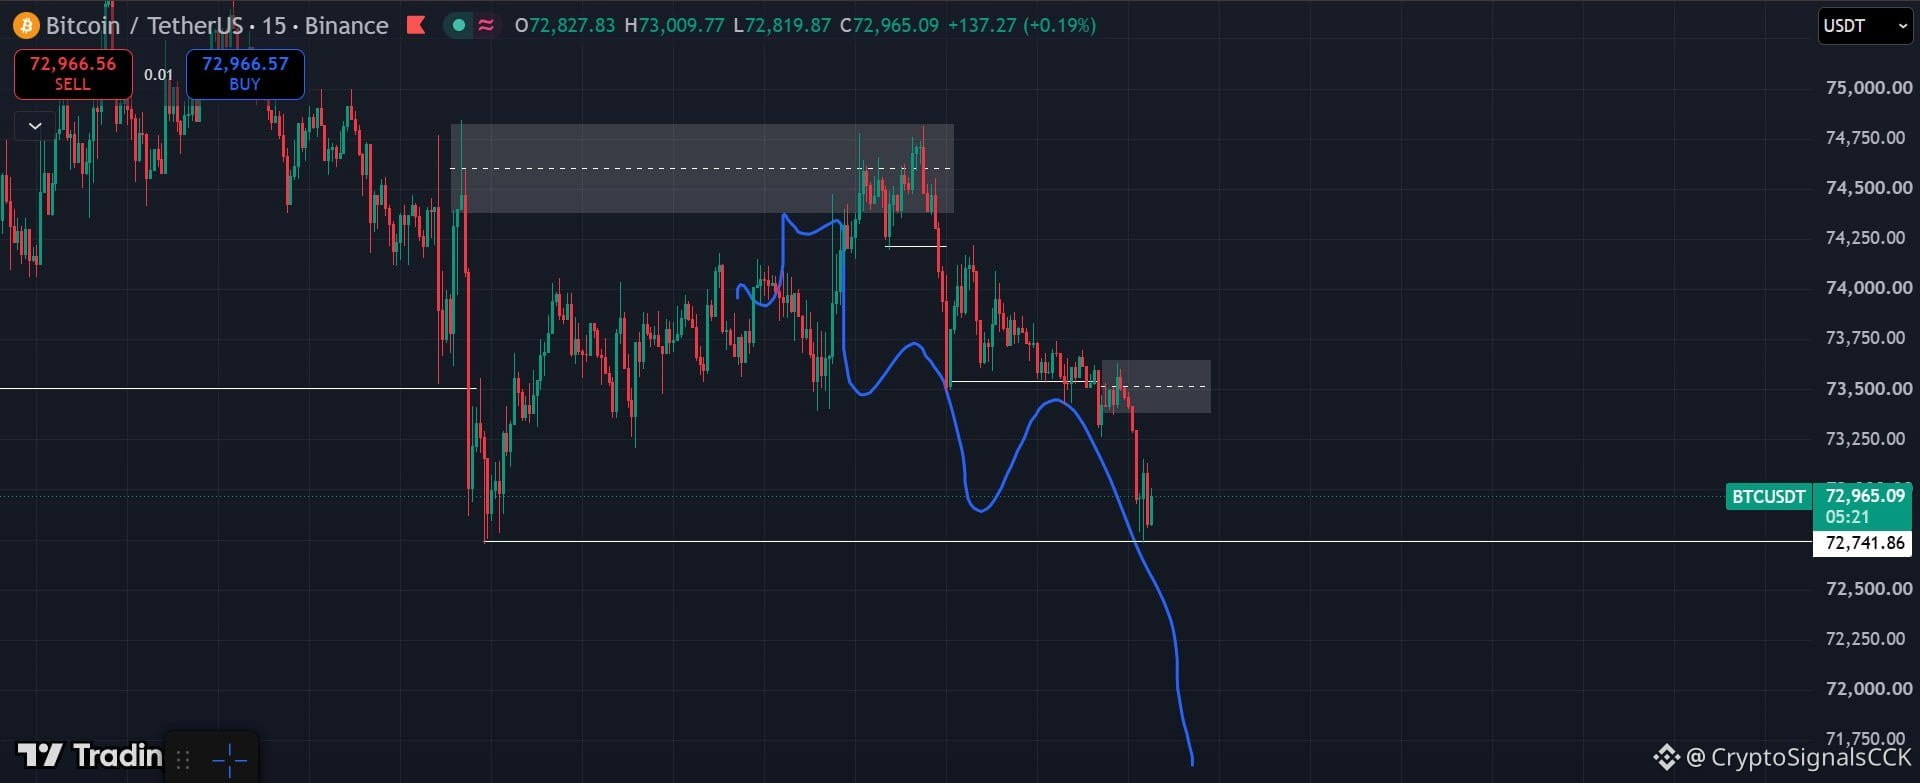
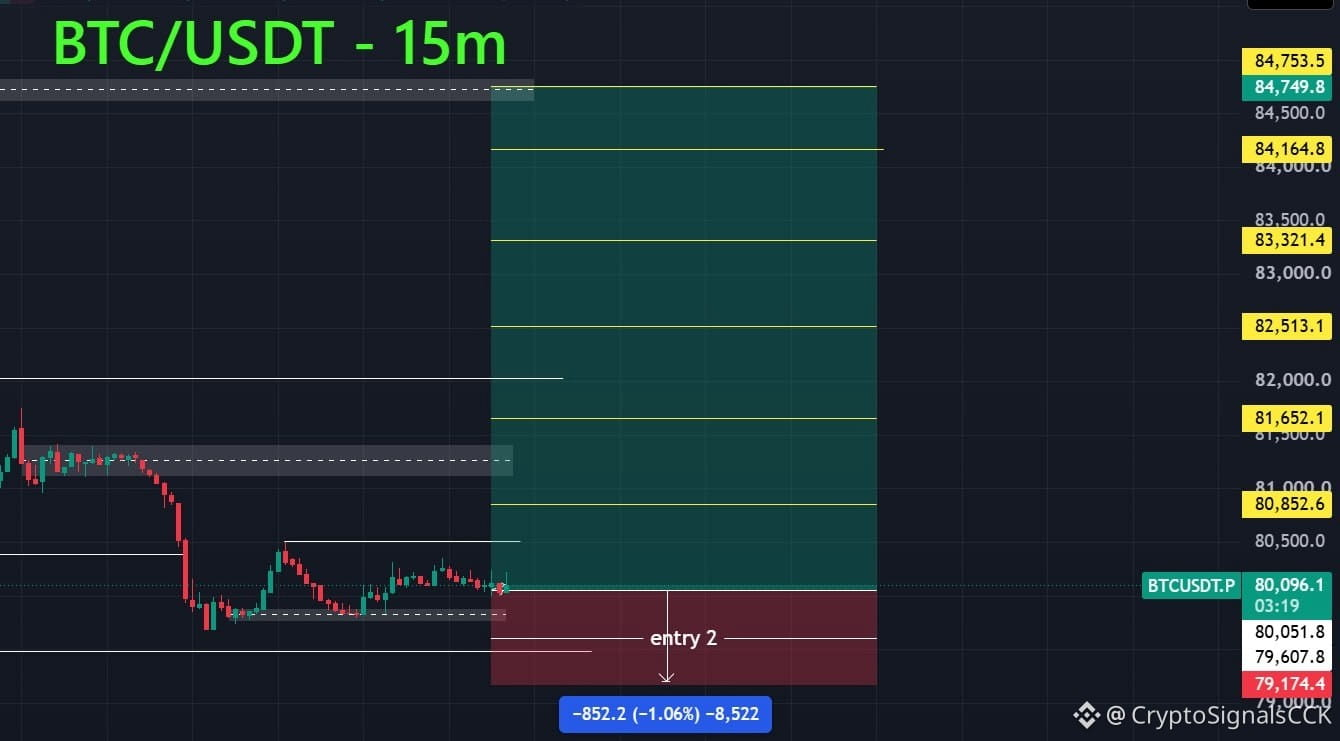
$BTC bears still in control - fresh lows below 72.7K are coming. 🥶👇 Tapped the 74.5k LTF supply, retested it, and got rejected again as mapped. If bitcoin bounces slightly instead of dumping straight under 72.7k, the BTCUSDT 73.5k mini supply is the retest zone before the move to 71k zone. #BTCUSDTAnalysis #btcupdates #CryptoSignalsCCK
$BTC bears still in control - fresh lows below 72.7K are coming. 🥶👇

Tapped the 74.5k LTF supply, retested it, and got rejected again as mapped.

If bitcoin bounces slightly instead of dumping straight under 72.7k, the BTCUSDT 73.5k mini supply is the retest zone before the move to 71k zone.

#BTCUSDTAnalysis #btcupdates #CryptoSignalsCCK
·
--
ບົດຄວາມ
Bitcoin Crashes Below $69,000 - Market in Extreme Fear | Trading News Today - 13 November 2026Bitcoin shook the entire market today. BTC fell more than 6.6% to $68,850, its lowest level since August. In just 48 hours, over $150 billion was wiped out from the crypto market. What Happened Today? Bitcoin broke the key support of $73,000 and crashed straight to a low of $67,555. Ethereum also dropped to $1,912, while XRP fell by up to 6%. More than $1.3 billion in crypto futures were liquidated in 24 hours, out of which Bitcoin alone accounted for $677 million. The Crypto Fear & Greed Index is now at 20, which is in the Extreme Fear zone. This is the lowest level in the last 4 months. 4 Major Reasons Behind The Crash 1. Nvidia Shock: Nvidia CEO Jensen Huang suddenly resigned. After this news, Nvidia shares fell up to 12% and the entire tech market was shaken. 2. ETF Outflows: US Spot Bitcoin ETFs saw outflows of $1.44 billion in 5 consecutive days. BlackRock's IBIT alone saw outflows of more than $2 billion in 9 days. 3. Fear of Fed Rate Hike: October inflation came in hotter than expected. Now the market fears the Fed may hike rates again in December. The 10-Year US Treasury Yield has reached 5.14%. 4. MSCI Removes Strategy: MSCI announced it will remove Strategy (MSTR) from its index on 30 November. This has created fear of $2.8 billion to $8.8 billion in selling. What Is Important For Traders? Bitcoin's RSI is now at 29, which means the market is oversold. A small bounce often comes from this level, but the trend is still down. Important Levels: Support: $68,000 - $67,500 - $65,000 Resistance: $71,000 - $73,000 - $75,600 If Bitcoin does not close back above $71,000, the next target could be $65,000. And if $73,000 is reclaimed, a bounce to $75,600 is possible. Conclusion: Today was a panic day, but smart traders do not trade in panic. Avoid high leverage, always use a Stop Loss, and watch the $68,000 level carefully. This level will decide whether the market bounces from here or goes further down. Disclaimer: This article is for information only, not financial advice. Trading involves risk, do your own research. #btc #NewsAboutCrypto #Binance #BTCUSDTAnalysis

Bitcoin Crashes Below $69,000 - Market in Extreme Fear | Trading News Today - 13 November 2026

Bitcoin shook the entire market today. BTC fell more than 6.6% to $68,850, its lowest level since August. In just 48 hours, over $150 billion was wiped out from the crypto market.
What Happened Today?
Bitcoin broke the key support of $73,000 and crashed straight to a low of $67,555. Ethereum also dropped to $1,912, while XRP fell by up to 6%.
More than $1.3 billion in crypto futures were liquidated in 24 hours, out of which Bitcoin alone accounted for $677 million.
The Crypto Fear & Greed Index is now at 20, which is in the Extreme Fear zone. This is the lowest level in the last 4 months.
4 Major Reasons Behind The Crash
1. Nvidia Shock: Nvidia CEO Jensen Huang suddenly resigned. After this news, Nvidia shares fell up to 12% and the entire tech market was shaken.
2. ETF Outflows: US Spot Bitcoin ETFs saw outflows of $1.44 billion in 5 consecutive days. BlackRock's IBIT alone saw outflows of more than $2 billion in 9 days.
3. Fear of Fed Rate Hike: October inflation came in hotter than expected. Now the market fears the Fed may hike rates again in December. The 10-Year US Treasury Yield has reached 5.14%.
4. MSCI Removes Strategy: MSCI announced it will remove Strategy (MSTR) from its index on 30 November. This has created fear of $2.8 billion to $8.8 billion in selling.
What Is Important For Traders?
Bitcoin's RSI is now at 29, which means the market is oversold. A small bounce often comes from this level, but the trend is still down.
Important Levels:
Support: $68,000 - $67,500 - $65,000
Resistance: $71,000 - $73,000 - $75,600
If Bitcoin does not close back above $71,000, the next target could be $65,000. And if $73,000 is reclaimed, a bounce to $75,600 is possible.
Conclusion:
Today was a panic day, but smart traders do not trade in panic. Avoid high leverage, always use a Stop Loss, and watch the $68,000 level carefully. This level will decide whether the market bounces from here or goes further down.
Disclaimer: This article is for information only, not financial advice. Trading involves risk, do your own research.
#btc #NewsAboutCrypto #Binance #BTCUSDTAnalysis
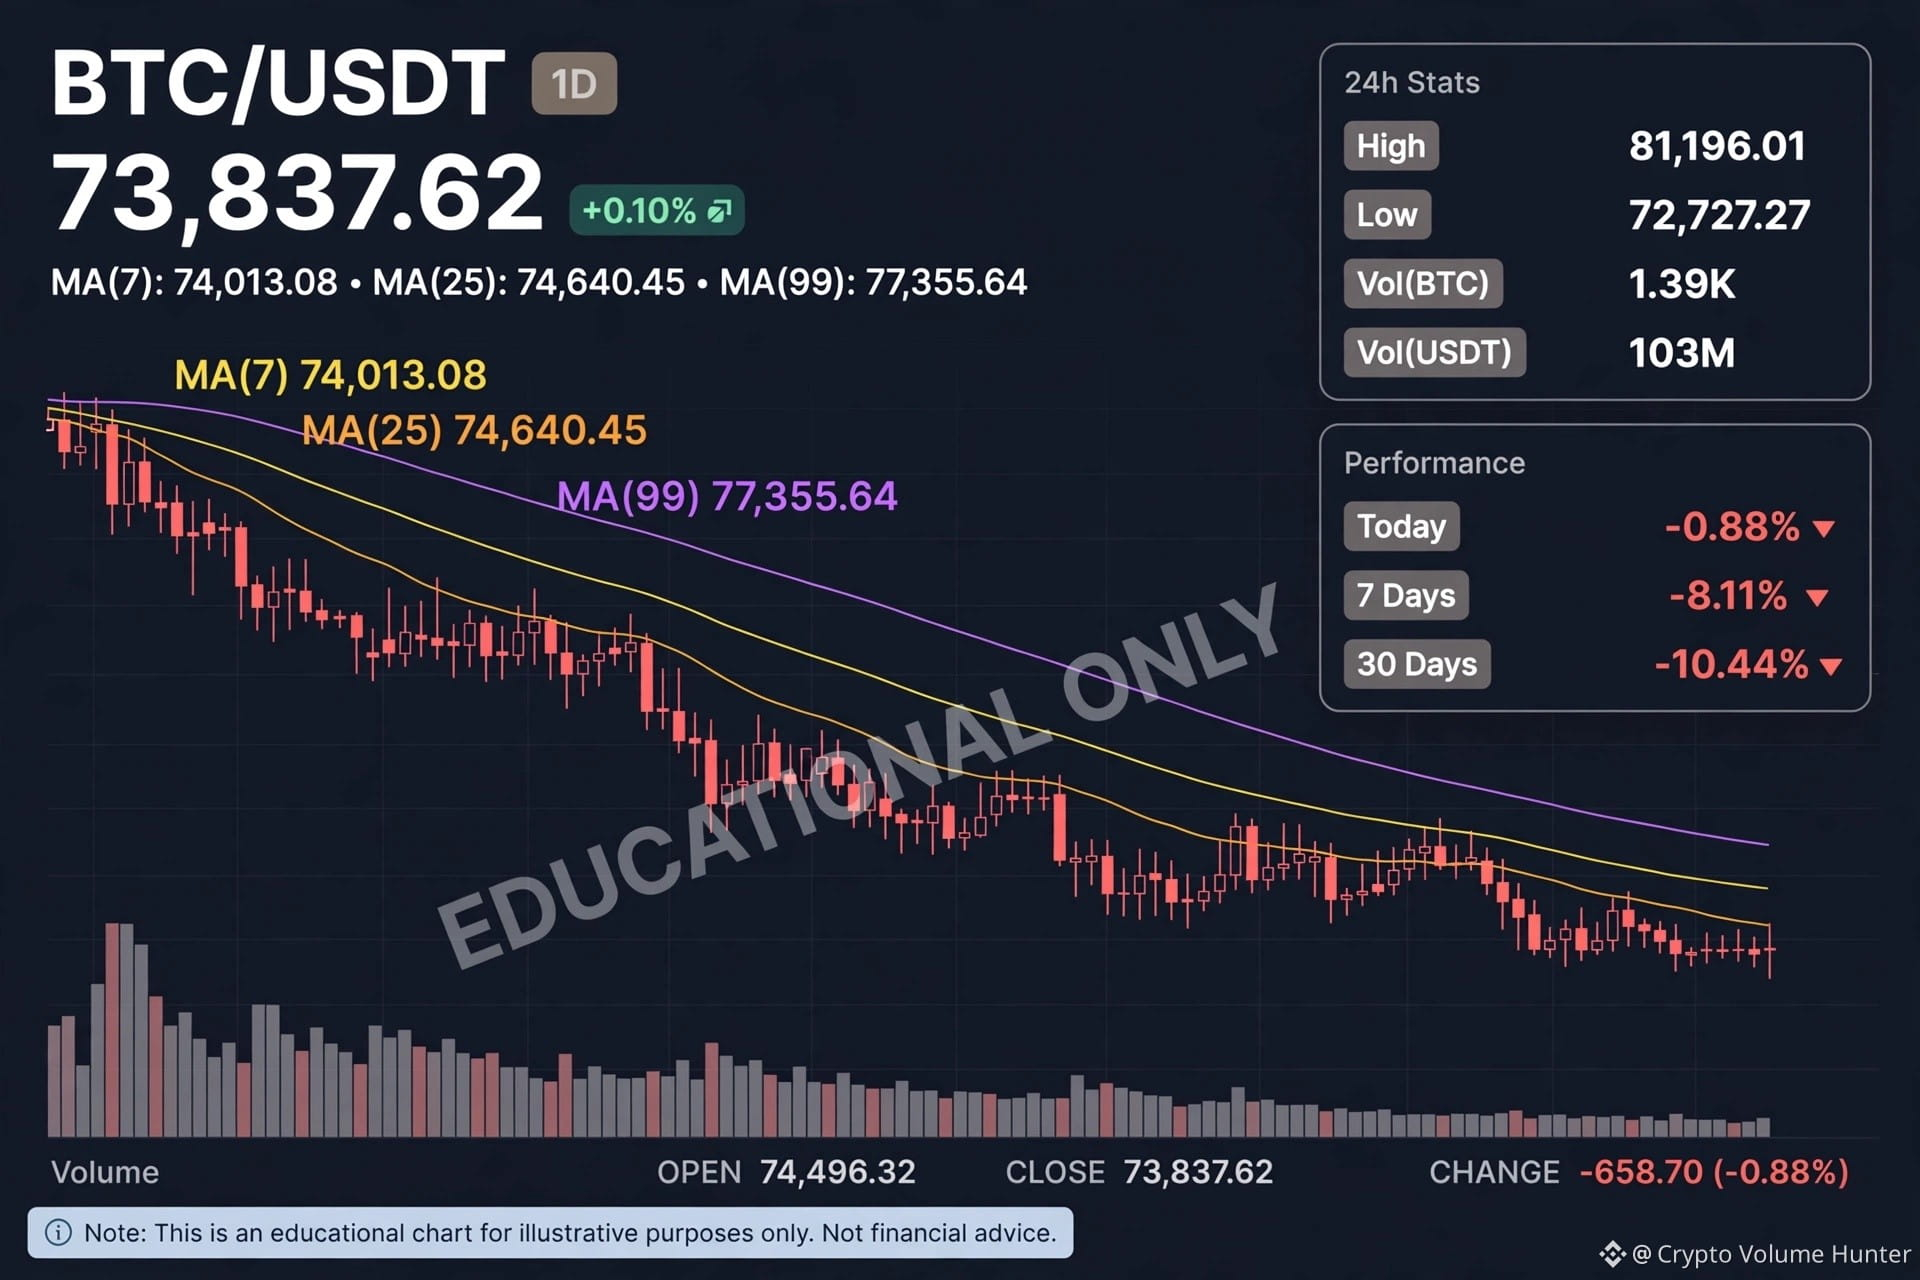
🚨 BTC/USDT 73,837.62 (+0.10%) - Rebound from $72,727 Low! MA7 74,013 / MA25 74,640 / MA99 77,355 - Still Below All MAs! High $81,196 -> Low $72,727 - Sharp Correction! 7 Days -8.11% / 30 Days -10.44% - Bearish Phase? Vol 103M USDT - Low volume bounce? Support $72,727 / $72,303 - Resistance $74,013 / $74,640 Will BTC hold $73K or test $72K? Educational only - If you found it helpful, a Tip ❤️ keeps me posting daily! $BTC #BTCUSDTAnalysis #bitcoin
🚨 BTC/USDT 73,837.62 (+0.10%) - Rebound from $72,727 Low!

MA7 74,013 / MA25 74,640 / MA99 77,355 - Still Below All MAs!
High $81,196 -> Low $72,727 - Sharp Correction!
7 Days -8.11% / 30 Days -10.44% - Bearish Phase?

Vol 103M USDT - Low volume bounce?
Support $72,727 / $72,303 - Resistance $74,013 / $74,640

Will BTC hold $73K or test $72K?

Educational only - If you found it helpful, a Tip ❤️ keeps me posting daily!

$BTC #BTCUSDTAnalysis #bitcoin
🚨 BITCOIN (BTC) — LATEST NEWS & TECHNICAL ANALYSIS ₿ 📅 12 NOVEMBER 2026 Bitcoin is facing strong selling pressure as institutional investors reduce exposure and macroeconomic uncertainty continues to affect the crypto market. 📊 MARKET NEWS 🔴 Nearly $968.5M in US Spot Bitcoin ETF outflows recorded between November 4–9. 🔴 US October CPI increased by 0.4%, above the expected 0.3%. 🔴 Heavy liquidations have increased volatility across the crypto market. ⚠️ November 13 Bitcoin options expiry is another event to watch. 📉 TECHNICAL ANALYSIS Current Market Bias: BEARISH 🔴 Key Levels: • $81,300 — Major resistance • $75,000–$76,000 — Recovery zone • $73,000–$73,200 — Immediate support • $70,000 — Psychological support • $62,000–$63,000 — Major downside zone 📈 BULLISH SCENARIO 🟢 If BTC holds $73K and reclaims $75K–$76K: 🎯 $78,000 🎯 $80,000 🎯 $81,300 A strong breakout above $81,300 could improve market structure. 📉 BEARISH SCENARIO 🔴 If BTC breaks below $73K with strong selling volume: 🎯 $70,000 🎯 $67,000 🎯 $62,000–$63,000 🧠 MY PERSONAL MARKET VIEW I am not rushing into BUY positions at this moment. I want to see: 1. Liquidity Sweep 2. Market Structure Shift (MSS) 3. Fair Value Gap (FVG) 4. Retest and confirmation 5. Entry with proper risk management No confirmation = No Trade. ⚠️ Remember: Protect your capital. Avoid FOMO and excessive leverage. 💬 What’s your prediction? 🚀 BTC recovery toward $80K? 📉 Or another drop toward $70K? #BTC #Bitcoin #BTCUSDTAnalysis #HuangRisksOusterOverReportedAffairWithSubordinate BitcoinNews #Binance #CryptoAnalysis #CryptoTrading #SmartMoneyConcepts #priceaction #TradingTales
🚨 BITCOIN (BTC) — LATEST NEWS & TECHNICAL ANALYSIS ₿

📅 12 NOVEMBER 2026

Bitcoin is facing strong selling pressure as institutional investors reduce exposure and macroeconomic uncertainty continues to affect the crypto market.

📊 MARKET NEWS

🔴 Nearly $968.5M in US Spot Bitcoin ETF outflows recorded between November 4–9.

🔴 US October CPI increased by 0.4%, above the expected 0.3%.

🔴 Heavy liquidations have increased volatility across the crypto market.

⚠️ November 13 Bitcoin options expiry is another event to watch.

📉 TECHNICAL ANALYSIS

Current Market Bias: BEARISH 🔴

Key Levels:

• $81,300 — Major resistance
• $75,000–$76,000 — Recovery zone
• $73,000–$73,200 — Immediate support
• $70,000 — Psychological support
• $62,000–$63,000 — Major downside zone

📈 BULLISH SCENARIO 🟢

If BTC holds $73K and reclaims $75K–$76K:

🎯 $78,000
🎯 $80,000
🎯 $81,300

A strong breakout above $81,300 could improve market structure.

📉 BEARISH SCENARIO 🔴

If BTC breaks below $73K with strong selling volume:

🎯 $70,000
🎯 $67,000
🎯 $62,000–$63,000

🧠 MY PERSONAL MARKET VIEW

I am not rushing into BUY positions at this moment.

I want to see:

1. Liquidity Sweep
2. Market Structure Shift (MSS)
3. Fair Value Gap (FVG)
4. Retest and confirmation
5. Entry with proper risk management

No confirmation = No Trade.

⚠️ Remember: Protect your capital. Avoid FOMO and excessive leverage.

💬 What’s your prediction?

🚀 BTC recovery toward $80K?
📉 Or another drop toward $70K?

#BTC #Bitcoin #BTCUSDTAnalysis #HuangRisksOusterOverReportedAffairWithSubordinate BitcoinNews #Binance #CryptoAnalysis #CryptoTrading #SmartMoneyConcepts #priceaction #TradingTales
ບົດຄວາມ
BTC prediction today current situation🚀 $BTC (BTC) PRICE PREDICTION TODAY – NOVEMBER 11, 2026 Bitcoin (BTC) is showing weakness today as selling pressure continues across the cryptocurrency market. Traders are closely monitoring important support and resistance levels to identify the next major move. 📊 BTC Market Analysis - Current Price: Around $73,660 - 24H Change: -2.14% - Market Trend: Short-Term Bearish - Major Support: $72,700 - Immediate Resistance: $75,300 - Strong Resistance: $76,800 🟢 Bullish Scenario If Bitcoin holds above $72,700 and buyers return with strong trading volume, BTC could recover towards $75,300. A successful breakout above $75,300 may open the door towards $76,800 and potentially $78,000. 🔴 Bearish Scenario If BTC loses the $72,700 support level, selling pressure could increase. Possible downside targets: - $72,000 - $70,000 A strong breakdown could create additional volatility in the market. 🎯 BTC Trading Strategy Watch the $72,700 support zone carefully. A confirmed breakout above $75,300 could provide a bullish signal, while a breakdown below $72,700 could favor sellers. Avoid emotional trading and always use proper stop-loss management. 🔥 Final Prediction My short-term outlook for Bitcoin is cautious bearish. However, BTC could experience a strong recovery if buyers regain control and market volume improves. Bitcoin remains the leading cryptocurrency, but traders should wait for confirmation before taking major positions. Stay Alert | Trade Smart | Manage Your Risk #Bitcoin #BTC #BTCPrediction #BitcoinAnalysis #Binance #BTCUSDTAnalysis DT #CryptoMarket #CryptoTrading #priceprediction

BTC prediction today current situation

🚀 $BTC (BTC) PRICE PREDICTION TODAY – NOVEMBER 11, 2026
Bitcoin (BTC) is showing weakness today as selling pressure continues across the cryptocurrency market. Traders are closely monitoring important support and resistance levels to identify the next major move.
📊 BTC Market Analysis
- Current Price: Around $73,660
- 24H Change: -2.14%
- Market Trend: Short-Term Bearish
- Major Support: $72,700
- Immediate Resistance: $75,300
- Strong Resistance: $76,800
🟢 Bullish Scenario
If Bitcoin holds above $72,700 and buyers return with strong trading volume, BTC could recover towards $75,300.
A successful breakout above $75,300 may open the door towards $76,800 and potentially $78,000.
🔴 Bearish Scenario
If BTC loses the $72,700 support level, selling pressure could increase.
Possible downside targets:
- $72,000
- $70,000
A strong breakdown could create additional volatility in the market.
🎯 BTC Trading Strategy
Watch the $72,700 support zone carefully.
A confirmed breakout above $75,300 could provide a bullish signal, while a breakdown below $72,700 could favor sellers.
Avoid emotional trading and always use proper stop-loss management.
🔥 Final Prediction
My short-term outlook for Bitcoin is cautious bearish.
However, BTC could experience a strong recovery if buyers regain control and market volume improves.
Bitcoin remains the leading cryptocurrency, but traders should wait for confirmation before taking major positions.
Stay Alert | Trade Smart | Manage Your Risk
#Bitcoin #BTC #BTCPrediction #BitcoinAnalysis #Binance #BTCUSDTAnalysis DT #CryptoMarket #CryptoTrading #priceprediction
ບົດຄວາມ
BTC Markeet UpdateBTC: $74,600 #BTCUSDTAnalysis $BTC Bitcoin started the new week under selling pressure. The price dropped below $75,000 and reached a low around $73,500. We are now seeing an attempt to stabilize, but the overall market remains weak. ₿ BITCOIN & CRYPTO The biggest issue remains the lack of strong buying interest. Leveraged positions have also suffered significantly over the past few days. 🟢 Support levels: - $73,500–74,000- $72,000–73,000 - $70,000–71,000 🔴 Resistance levels: - $75,000–76,000 - $77,000–78,000 - $79,000–80,000 A recovery and sustained move above $76,000 would be the first sign of improvement. Losing the $73,500 zone could open the door to a deeper correction. ETFs: US spot Bitcoin ETFs recorded approximately $1.28 billion in outflows last week. This suggests institutional investors remain cautious. ⚠️ BINANCE – TRUST UNDER PRESSURE Following the recent security incident, the market continues to monitor the situation at Binance. Outflows from the exchange suggest that some users are reducing their exposure. Withdrawal stability, asset security and transparency remain key priorities. Remember to diversify and avoid keeping all your capital in one place. 📊 TRADITIONAL MARKETS Wall Street: US stock futures started Monday higher. Investors are trying to rebuild confidence following the recent technology sell-off. Dollar & bonds: The US 10-year Treasury yield remains around 4.86%. Elevated yields may reduce the appeal of risk assets. Gold: Gold is gaining at the start of the week as investors show interest in safer assets. Oil: Brent and WTI prices remain under pressure as markets assess the outlook for global demand. 🇺🇸 MACRO – AN IMPORTANT TEST TOMORROW On Tuesday, November 10, the US CPI inflation report will be released. This is one of the most important events of the week. The data could influence expectations for the Fed's next policy decisions. - Higher inflation – potential pressure on BTC and other risk assets. - Lower inflation – a chance for market sentiment to improve. - The reaction in the dollar and Treasury yields will be particularly important. Bitcoin is in a difficult position. ETF outflows, leveraged liquidations and regulatory uncertainty are adding pressure to the market. What we are watching: - Will BTC defend $73,500? - Can buyers reclaim $76,000? - Will ETF outflows begin to slow? - How will the market react to tomorrow's CPI data? We are not trying to catch the bottom. We watch price action and wait for confirmation. #CPITestsDecemberRateOutlook #NvidiaInvestigatesAfterHuang’sAffairApology #US-IranTalksFuelStrongStockMarketRebound

BTC Markeet Update

BTC: $74,600
#BTCUSDTAnalysis
$BTC
Bitcoin started the new week under selling pressure. The price dropped below $75,000 and reached a low around $73,500. We are now seeing an attempt to stabilize, but the overall market remains weak.
₿ BITCOIN & CRYPTO
The biggest issue remains the lack of strong buying interest. Leveraged positions have also suffered significantly over the past few days.
🟢 Support levels:
- $73,500–74,000- $72,000–73,000
- $70,000–71,000
🔴 Resistance levels:
- $75,000–76,000
- $77,000–78,000
- $79,000–80,000
A recovery and sustained move above $76,000 would be the first sign of improvement. Losing the $73,500 zone could open the door to a deeper correction.
ETFs: US spot Bitcoin ETFs recorded approximately $1.28 billion in outflows last week. This suggests institutional investors remain cautious.
⚠️ BINANCE – TRUST UNDER PRESSURE
Following the recent security incident, the market continues to monitor the situation at Binance. Outflows from the exchange suggest that some users are reducing their exposure.
Withdrawal stability, asset security and transparency remain key priorities. Remember to diversify and avoid keeping all your capital in one place.
📊 TRADITIONAL MARKETS
Wall Street: US stock futures started Monday higher. Investors are trying to rebuild confidence following the recent technology sell-off.
Dollar & bonds: The US 10-year Treasury yield remains around 4.86%. Elevated yields may reduce the appeal of risk assets.
Gold: Gold is gaining at the start of the week as investors show interest in safer assets.
Oil: Brent and WTI prices remain under pressure as markets assess the outlook for global demand.
🇺🇸 MACRO – AN IMPORTANT TEST TOMORROW
On Tuesday, November 10, the US CPI inflation report will be released.
This is one of the most important events of the week. The data could influence expectations for the Fed's next policy decisions.
- Higher inflation – potential pressure on BTC and other risk assets.
- Lower inflation – a chance for market sentiment to improve.
- The reaction in the dollar and Treasury yields will be particularly important.
Bitcoin is in a difficult position. ETF outflows, leveraged liquidations and regulatory uncertainty are adding pressure to the market.
What we are watching:
- Will BTC defend $73,500?
- Can buyers reclaim $76,000?
- Will ETF outflows begin to slow?
- How will the market react to tomorrow's CPI data?
We are not trying to catch the bottom. We watch price action and wait for confirmation.
#CPITestsDecemberRateOutlook
#NvidiaInvestigatesAfterHuang’sAffairApology #US-IranTalksFuelStrongStockMarketRebound
🚀 $BTC (BTC) PRICE PREDICTION – NOVEMBER 9, 2026 🔥 Is Bitcoin Preparing for a Strong Recovery or Another Correction? Bitcoin is currently trading around $74,400, facing significant selling pressure as the broader crypto market experiences volatility. BTC recently dropped toward the $73,700 area, making this an important zone for buyers to defend. 📊 Technical Market Analysis 🟢 Key Support Levels: - $73,700 – Immediate Support - $72,000 – Secondary Support - $70,000 – Major Support 🔴 Key Resistance Levels: - $75,700 – First Resistance - $77,500 – Second Resistance - $80,000 – Major Resistance 🎯 BTC Price Prediction Bullish Scenario 📈 If Bitcoin successfully holds above $73,700 and breaks through $75,700 with strong buying volume, the next targets could be $77,500 and $80,000. Bearish Scenario 📉 If BTC loses the $73,700 support with strong selling pressure, further downside toward $72,000 and potentially $70,000 cannot be ruled out. 💡 My Market Outlook Bitcoin remains a major long-term cryptocurrency, but its short-term trend is currently under pressure. Traders should watch support levels, trading volume, institutional demand, and overall market sentiment before making decisions. ⭐ Final Prediction: BTC is in a critical market zone. A confirmed recovery above $75,700 could improve bullish momentum, while a breakdown below $73,700 may extend the correction. ⚠️ Risk Management: Avoid excessive leverage. Always use stop-loss protection and do your own research before entering any trade. What is your prediction? 🚀 BTC to $80,000 or 📉 BTC to $70,000? #Bitcoin #BTC #BitcoinPrediction #CryptoAnalysis #BinanceSquare #CryptoMarket #BTCUSDTAnalysis
🚀 $BTC (BTC) PRICE PREDICTION – NOVEMBER 9, 2026

🔥 Is Bitcoin Preparing for a Strong Recovery or Another Correction?

Bitcoin is currently trading around $74,400, facing significant selling pressure as the broader crypto market experiences volatility. BTC recently dropped toward the $73,700 area, making this an important zone for buyers to defend.

📊 Technical Market Analysis

🟢 Key Support Levels:

- $73,700 – Immediate Support
- $72,000 – Secondary Support
- $70,000 – Major Support

🔴 Key Resistance Levels:

- $75,700 – First Resistance
- $77,500 – Second Resistance
- $80,000 – Major Resistance

🎯 BTC Price Prediction

Bullish Scenario 📈
If Bitcoin successfully holds above $73,700 and breaks through $75,700 with strong buying volume, the next targets could be $77,500 and $80,000.

Bearish Scenario 📉
If BTC loses the $73,700 support with strong selling pressure, further downside toward $72,000 and potentially $70,000 cannot be ruled out.

💡 My Market Outlook

Bitcoin remains a major long-term cryptocurrency, but its short-term trend is currently under pressure. Traders should watch support levels, trading volume, institutional demand, and overall market sentiment before making decisions.

⭐ Final Prediction:
BTC is in a critical market zone. A confirmed recovery above $75,700 could improve bullish momentum, while a breakdown below $73,700 may extend the correction.

⚠️ Risk Management: Avoid excessive leverage. Always use stop-loss protection and do your own research before entering any trade.

What is your prediction?

🚀 BTC to $80,000 or 📉 BTC to $70,000?

#Bitcoin #BTC #BitcoinPrediction #CryptoAnalysis #BinanceSquare #CryptoMarket #BTCUSDTAnalysis
🚨 BITCOIN AT $75K — CRITICAL MOMENT FOR THE CRYPTO MARKET! The crypto market is facing serious selling pressure, but smart traders know that volatility creates opportunities as well as risks. 📊 BTC Market Analysis Bitcoin has dropped toward the $75,000–$76,000 zone, putting a major support area under pressure. 🔍 Key Levels to Watch: - Support 1: $75,000 - Support 2: $73,200 - Resistance 1: $78,000 - Resistance 2: $80,000 🐂 Bullish Scenario: If BTC holds $75K and reclaims $78K, buyers could regain short-term confidence. 🐻 Bearish Scenario: A confirmed breakdown below $75K could bring further downside pressure. 💡 My Trading Strategy: ✔️ Avoid emotional decisions. ✔️ Watch volume and confirmation. ✔️ Manage leverage carefully. ✔️ Never risk more than you can afford to lose. 🔥 THE BIG QUESTION: Is Bitcoin preparing for a powerful recovery, or is another correction coming? Share your prediction below! 👇 #Bitcoin #BTC #CryptoMarket #BinanceSquare #CryptoTrading #BitcoinAnalysis #Altcoins #CryptoSignals #MarketUpdate #TradingStrategy #BullishOrBearish #Web3 #CryptoCommunity #TechnicalAnalysis #BTCUSDTAnalysis {spot}(BTCUSDT)
🚨 BITCOIN AT $75K — CRITICAL MOMENT FOR THE CRYPTO MARKET!

The crypto market is facing serious selling pressure, but smart traders know that volatility creates opportunities as well as risks.

📊 BTC Market Analysis

Bitcoin has dropped toward the $75,000–$76,000 zone, putting a major support area under pressure.

🔍 Key Levels to Watch:

- Support 1: $75,000
- Support 2: $73,200
- Resistance 1: $78,000
- Resistance 2: $80,000

🐂 Bullish Scenario:
If BTC holds $75K and reclaims $78K, buyers could regain short-term confidence.

🐻 Bearish Scenario:
A confirmed breakdown below $75K could bring further downside pressure.

💡 My Trading Strategy:
✔️ Avoid emotional decisions.
✔️ Watch volume and confirmation.
✔️ Manage leverage carefully.
✔️ Never risk more than you can afford to lose.

🔥 THE BIG QUESTION:
Is Bitcoin preparing for a powerful recovery, or is another correction coming?

Share your prediction below! 👇

#Bitcoin #BTC #CryptoMarket #BinanceSquare #CryptoTrading #BitcoinAnalysis #Altcoins #CryptoSignals #MarketUpdate #TradingStrategy #BullishOrBearish #Web3 #CryptoCommunity #TechnicalAnalysis #BTCUSDTAnalysis
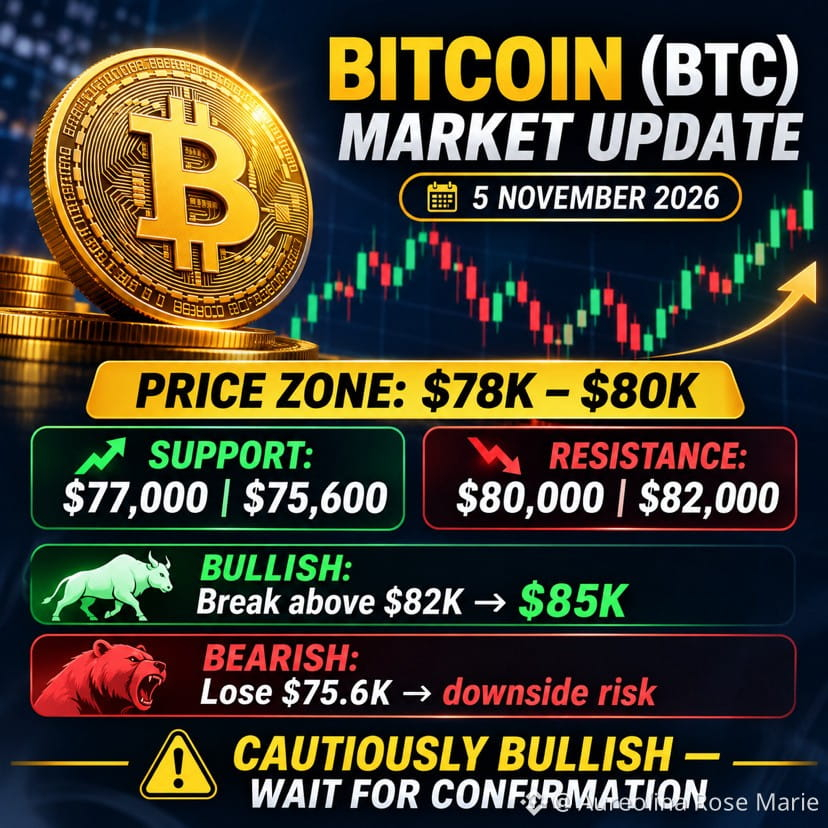
₿ $BTC Bitcoin (BTC) – Latest Market Analysis 5 November 2026 | BTC/USDT Short-term recovery attempt BTC is showing a volatile recovery, but bulls are struggling to maintain momentum above $80,000. * Current price: Around $78,000–$80,000 in the latest reported sessions. * Support: $77,000 / $75,600 * Resistance: $80,000 / $82,000 * Bullish scenario: A strong breakout above $82,000 could open the way toward $85,000. * Bearish scenario: Losing $75,600 could bring further downside pressure. My view: Cautiously bullish only if BTC reclaims $82K with strong volume. Avoid chasing sudden pumps. CoinMarketCap +2 Caption for Binance / Crypto Community: Bitcoin is at a critical decision zone! 🚀 Bulls need to reclaim $82K to confirm stronger upside momentum. Until then, stay patient and manage risk wisely. #BTC #Bitcoin #CryptoAnalysis #Binance #TradingSignals #BTCUSDTAnalysis #ADPUSPrivateEmployersAdd86000JobsInOctober #BinanceReopensWithdrawalsForMoreAssets
₿ $BTC Bitcoin (BTC) – Latest Market Analysis

5 November 2026 | BTC/USDT

Short-term recovery attempt

BTC is showing a volatile recovery, but bulls are struggling to maintain momentum above $80,000.

* Current price: Around $78,000–$80,000 in the latest reported sessions.
* Support: $77,000 / $75,600
* Resistance: $80,000 / $82,000
* Bullish scenario: A strong breakout above $82,000 could open the way toward $85,000.
* Bearish scenario: Losing $75,600 could bring further downside pressure.

My view: Cautiously bullish only if BTC reclaims $82K with strong volume. Avoid chasing sudden pumps. CoinMarketCap +2

Caption for Binance / Crypto Community:

Bitcoin is at a critical decision zone! 🚀 Bulls need to reclaim $82K to confirm stronger upside momentum. Until then, stay patient and manage risk wisely.

#BTC #Bitcoin #CryptoAnalysis #Binance #TradingSignals #BTCUSDTAnalysis #ADPUSPrivateEmployersAdd86000JobsInOctober #BinanceReopensWithdrawalsForMoreAssets
·
--
ສັນຍານໝີ
⛔ ARGENT news BTC sell now ⬇️🤑 $BTC holder are selling btc for any reasons . why????????????? BTC is going to his resistent point and many news come to btc going down so this is right time to print money ⬇️⬇️⬇️🤑🤑 $BTC #BTCUSDTAnalysis #TrumpNewsCrypto {spot}(BTCUSDT)
⛔ ARGENT news BTC sell now ⬇️🤑
$BTC holder are selling btc for any reasons .
why?????????????
BTC is going to his resistent point and many news come to btc going down so
this is right time to print money ⬇️⬇️⬇️🤑🤑
$BTC #BTCUSDTAnalysis #TrumpNewsCrypto
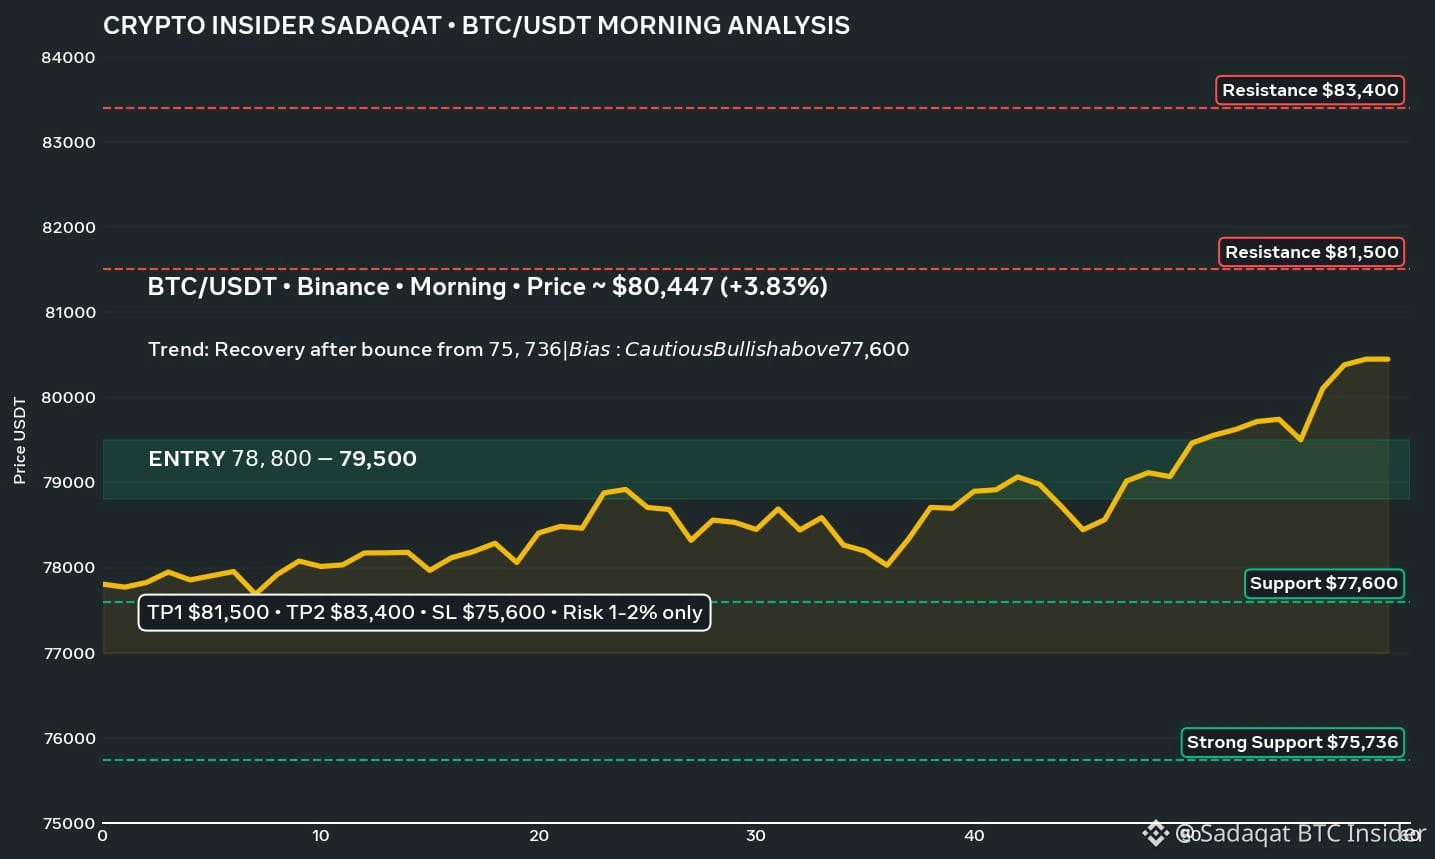
$BTC BTC∼$80,447 (+3.83%) after US midterm results calmed markets, and is now holding above $80K. *BTC/USDT - Morning Analysis - Crypto Insider Sadaqat* - *Price:* ∼$80,447 | *24H:* +3.83% - *24H Range:* $77,375 - $81,196 | *Low defended:* $75,736 - *Trend:* Recovery / Cautious Bullish above $77,600 - *Why pumped:* US midterm uncertainty cleared, $500M+ shorts liquidated, risk appetite back *Key Levels:* - *Support:* $77,600 / $75,736 (strong) - *Resistance:* $81,500 / $83,400 *Trade Plan:* - *Entry:* $78,800 - $79,500 (on retest) - *TP1:* $81,500 - *TP2:* $83,400 - *SL:* $75,600 - *Risk:* Only 1-2% capital, no high leverage *Invalidation:* 4H close below $75,600 = bounce failed, next $73,800. Break + hold above $81,500 = momentum shift to bullish. --- *--- COPY-PASTE FOR BINANCE SQUARE ---* 🟠 *BTC/USDT Morning Analysis | Crypto Insider Sadaqat* Bitcoin ne $75,736 se zabardast bounce kiya aur ab $80,447 par trade kar raha hai (+3.83%)! Bulls ne low defend kar liya. *Price:* ∼$80,447 *Trend:* Cautious Bullish above $77,600 *Levels:* Support: $77,600 / $75,736 Resistance: $81,500 / $83,400 *Plan:* Entry: $78,800 - $79,500 TP1: $81,500 | TP2: $83,400 SL: $75,600 $81,500 ke upar break = bullish momentum. $75,600 ke neeche = bounce fail. Aapka kya view hai? Pump ya Dump? Comment me batao 👇 Risk 1-2% only. Not financial advice. DYOR. #BTC走势分析 #bitcoin #BTCUSDT #CryptoInsiderSadaqat #Binance #Crypto #BTCUSDTAnalysis
$BTC BTC∼$80,447 (+3.83%) after US midterm results calmed markets, and is now holding above $80K.
*BTC/USDT - Morning Analysis - Crypto Insider Sadaqat*

- *Price:* ∼$80,447 | *24H:* +3.83%
- *24H Range:* $77,375 - $81,196 | *Low defended:* $75,736
- *Trend:* Recovery / Cautious Bullish above $77,600
- *Why pumped:* US midterm uncertainty cleared, $500M+ shorts liquidated, risk appetite back

*Key Levels:*
- *Support:* $77,600 / $75,736 (strong)
- *Resistance:* $81,500 / $83,400

*Trade Plan:*
- *Entry:* $78,800 - $79,500 (on retest)
- *TP1:* $81,500
- *TP2:* $83,400
- *SL:* $75,600
- *Risk:* Only 1-2% capital, no high leverage

*Invalidation:* 4H close below $75,600 = bounce failed, next $73,800. Break + hold above $81,500 = momentum shift to bullish.

---

*--- COPY-PASTE FOR BINANCE SQUARE ---*

🟠 *BTC/USDT Morning Analysis | Crypto Insider Sadaqat*

Bitcoin ne $75,736 se zabardast bounce kiya aur ab $80,447 par trade kar raha hai (+3.83%)! Bulls ne low defend kar liya.

*Price:* ∼$80,447
*Trend:* Cautious Bullish above $77,600

*Levels:*
Support: $77,600 / $75,736
Resistance: $81,500 / $83,400

*Plan:*
Entry: $78,800 - $79,500
TP1: $81,500 | TP2: $83,400
SL: $75,600

$81,500 ke upar break = bullish momentum. $75,600 ke neeche = bounce fail.

Aapka kya view hai? Pump ya Dump? Comment me batao 👇
Risk 1-2% only. Not financial advice. DYOR.

#BTC走势分析 #bitcoin #BTCUSDT #CryptoInsiderSadaqat #Binance #Crypto #BTCUSDTAnalysis
$BTC WARNING: Are Bitcoin Longs About to Get Liquidated? Key Levels to Watch!🚨 $BTC BREAKING: LONG OR SHORT? 📊 Act as a professional crypto market analyst and create a Binance Square post analyzing the current BTC/USDT market.$BTC Include the following: 📊 1. Market Overview Current BTC price (verify live market data) 15-minute and 1-hour trend Trading volume and momentum RSI, MACD, and key support/resistance levels 🐂 2. LONG Setup Potential entry zone Confirmation required before entry Stop-loss (SL) Take-profit targets (TP1, TP2, TP3) Risk-to-reward ratio 🐻 3. SHORT Setup Potential entry zone Confirmation required before entry Stop-loss and take-profit targets Conditions that invalidate the setup 🔥 4. Liquidation & Market Sentiment Check available long/short liquidation data Analyze open interest and funding rates if reliable data is available Identify potential liquidity zones 📈 5. Chart Include a clean BTC/USDT candlestick chart with clearly marked support, resistance, entry, stop-loss, and take-profit levels. Use actual market data, not fabricated prices. 🎯 6. Final Trading Verdict State whether the evidence currently favors LONG, SHORT, or NO TRADE. Explain why and identify the confirmation needed. #BTC #Bitcoin #BinanceSquare #CryptoTrading #BTCUSDTAnalysis

$BTC WARNING: Are Bitcoin Longs About to Get Liquidated? Key Levels to Watch!

🚨 $BTC BREAKING: LONG OR SHORT? 📊
Act as a professional crypto market analyst and create a Binance Square post analyzing the current BTC/USDT market.$BTC
Include the following:
📊 1. Market Overview
Current BTC price (verify live market data)
15-minute and 1-hour trend
Trading volume and momentum
RSI, MACD, and key support/resistance levels
🐂 2. LONG Setup
Potential entry zone
Confirmation required before entry
Stop-loss (SL)
Take-profit targets (TP1, TP2, TP3)
Risk-to-reward ratio
🐻 3. SHORT Setup
Potential entry zone
Confirmation required before entry
Stop-loss and take-profit targets
Conditions that invalidate the setup
🔥 4. Liquidation & Market Sentiment
Check available long/short liquidation data
Analyze open interest and funding rates if reliable data is available
Identify potential liquidity zones
📈 5. Chart
Include a clean BTC/USDT candlestick chart with clearly marked support, resistance, entry, stop-loss, and take-profit levels. Use actual market data, not fabricated prices.
🎯 6. Final Trading Verdict
State whether the evidence currently favors LONG, SHORT, or NO TRADE. Explain why and identify the confirmation needed.
#BTC #Bitcoin #BinanceSquare #CryptoTrading #BTCUSDTAnalysis
·
--
ສັນຍານໝີ
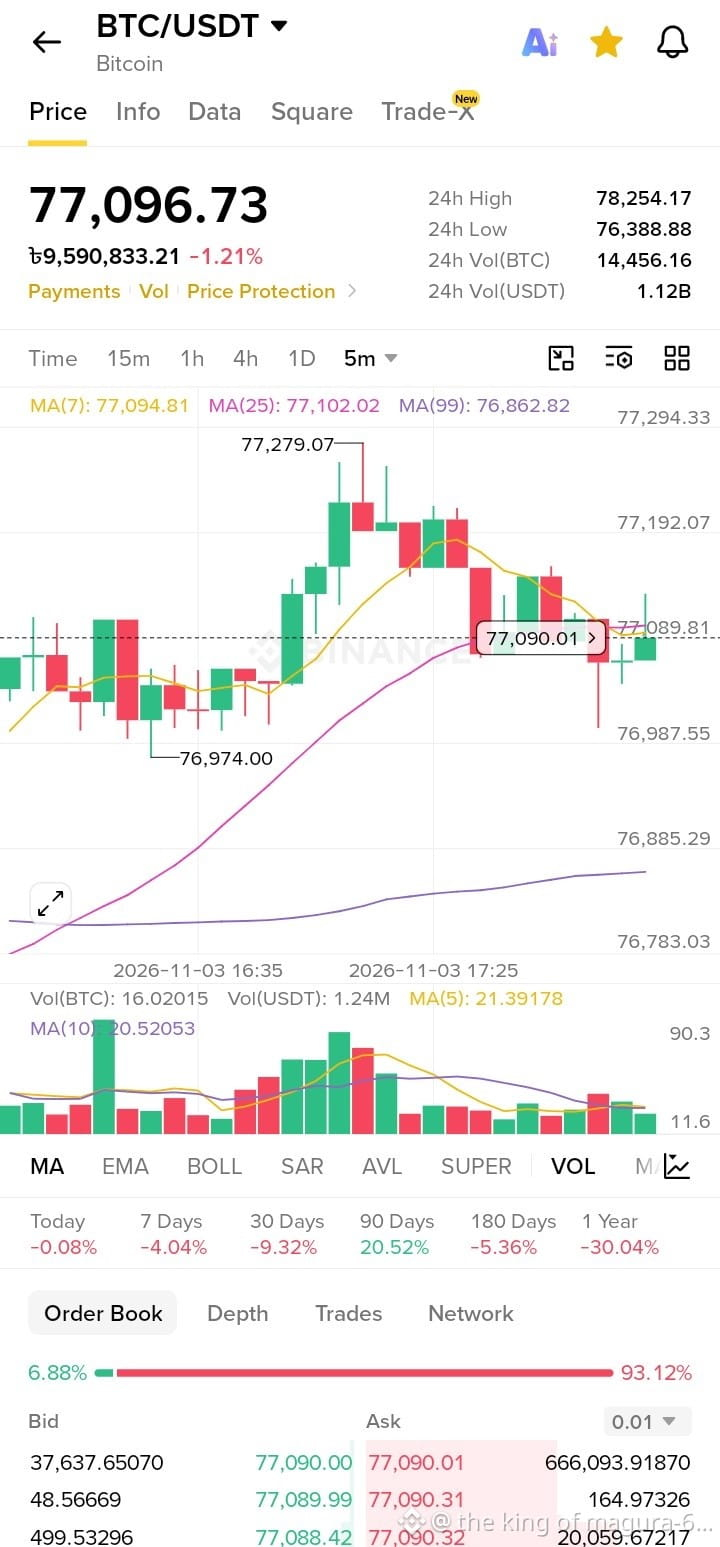
#BTC 🚨 BITCOIN PRICE UPDATE: BEARS IN CONTROL? 🐻📉 📊 BTC/USDT – 5-Minute Market Analysis Bitcoin is currently trading around $77,096, showing a decline of approximately 1.21%. 🔍 Technical Analysis: • Current Price: $77,096 • 24H High: $78,254 • 24H Low: $76,388 • MA(7): $77,094 • MA(25): $77,102 • MA(99): $76,862 📉 Market Signals: Bitcoin is showing short-term bearish pressure. The price is trading near the MA(7) and MA(25), indicating a potential consolidation zone. 🔴 Resistance Zone: $77,190 – $77,279 🟢 Support Zone: $76,987 – $76,974 ⚠️ The order book shows significant selling pressure, but sudden market movements can change the trend quickly. 🎯 What to Watch Next: A breakout above $77,279 could signal a potential short-term recovery. A breakdown below $76,974 may increase downside pressure toward the lower support zone. 💬 Your Opinion: Will BTC recover toward $77,500, or will sellers push the price below $76,900? 👇 Share your analysis in the comments! ⚠️ This is technical analysis for educational purposes only, not financial advice. Always manage your risk before trading. #BTC #BTCUSDTAnalysis #BinanceSquare #CryptoAnalysis $BTC {spot}(BTCUSDT)
#BTC 🚨 BITCOIN PRICE UPDATE: BEARS IN CONTROL? 🐻📉

📊 BTC/USDT – 5-Minute Market Analysis

Bitcoin is currently trading around $77,096, showing a decline of approximately 1.21%.

🔍 Technical Analysis: • Current Price: $77,096 • 24H High: $78,254 • 24H Low: $76,388 • MA(7): $77,094 • MA(25): $77,102 • MA(99): $76,862

📉 Market Signals: Bitcoin is showing short-term bearish pressure. The price is trading near the MA(7) and MA(25), indicating a potential consolidation zone.

🔴 Resistance Zone: $77,190 – $77,279 🟢 Support Zone: $76,987 – $76,974

⚠️ The order book shows significant selling pressure, but sudden market movements can change the trend quickly.

🎯 What to Watch Next: A breakout above $77,279 could signal a potential short-term recovery.

A breakdown below $76,974 may increase downside pressure toward the lower support zone.

💬 Your Opinion: Will BTC recover toward $77,500, or will sellers push the price below $76,900?

👇 Share your analysis in the comments!

⚠️ This is technical analysis for educational purposes only, not financial advice. Always manage your risk before trading.

#BTC #BTCUSDTAnalysis #BinanceSquare #CryptoAnalysis
$BTC
Bitcoin Up or Down - November 3, 7:20AM-7:25AM ET

Bitcoin Up or Down - November 3, 7:20AM-7:25AM ET

98%Up1%Down
ປະລິມານ $1,201,501.42
₿ BITCOIN TODAY: A CRITICAL MOMENT FOR THE CRYPTO MARKET! 🚀 Bitcoin (BTC) is trading around $77,700–$78,000, showing a modest recovery after recent market pressure. 📊 Today's Market Outlook: BTC is attempting to maintain stability near $78K. Market sentiment remains cautious. Investors are watching key support and resistance levels. Binance's recent security incident has increased market uncertainty, although withdrawals are gradually resuming. 🔥 What Comes Next? If Bitcoin maintains its momentum and buying pressure increases, we could see another recovery attempt. However, losing important support levels could bring further downside pressure. 💡 My Strategy: Stay patient, manage risk, avoid emotional decisions, and always do your own research before trading. Remember: In crypto, patience is often more valuable than prediction! Are you BULLISH 🟢 or BEARISH 🔴 on Bitcoin today? Share your thoughts below! 👇 #Bitcoin #BTC #Binance #CryptoMENA arket #bitcoin Analysis #CryptoTrends2024 ading #BTCUSDTAnalysis T #CryptoNews
₿ BITCOIN TODAY: A CRITICAL MOMENT FOR THE CRYPTO MARKET! 🚀

Bitcoin (BTC) is trading around $77,700–$78,000, showing a modest recovery after recent market pressure.

📊 Today's Market Outlook:

BTC is attempting to maintain stability near $78K.

Market sentiment remains cautious.

Investors are watching key support and resistance levels.

Binance's recent security incident has increased market uncertainty, although withdrawals are gradually resuming.

🔥 What Comes Next?

If Bitcoin maintains its momentum and buying pressure increases, we could see another recovery attempt. However, losing important support levels could bring further downside pressure.

💡 My Strategy: Stay patient, manage risk, avoid emotional decisions, and always do your own research before trading.

Remember: In crypto, patience is often more valuable than prediction!

Are you BULLISH 🟢 or BEARISH 🔴 on Bitcoin today?

Share your thoughts below! 👇

#Bitcoin #BTC #Binance #CryptoMENA arket #bitcoin Analysis #CryptoTrends2024 ading #BTCUSDTAnalysis T #CryptoNews
🚨 BITCOIN MARKET UPDATE – 31 OCTOBER 2026 🚨 ₿ Bitcoin (BTC): $77,365 USD 📉 Bitcoin is currently🚨 BITCOIN MARKET UPDATE – 31 OCTOBER 2026 🚨 ₿ Bitcoin (BTC): $77,365 USD 📉 Bitcoin is currently facing market pressure and trading volatility. Recent security concerns surrounding Binance and weakness in global markets have affected crypto investor sentiment. 📊 Market Overview: - Current Price: Around $77,365 - Market Trend: Bearish Pressure - Key Support: $76,000 - Key Resistance: $78,500 🔍 My Market View: Traders should watch the $76,000 support level carefully. A strong recovery could bring bullish momentum, while a breakdown may create further downside pressure. ⚠️ Always do your own research and manage your risk before trading. 🔥 What do you think? Will Bitcoin recover above $80,000 or fall below $75,000? 👇 Comment your prediction! #Bitcoin #BTC #CryptoNews #BitcoinUpdate #CryptoTrading #BTCUSDTAnalysis $BTC #CryptoMarket #Binance

🚨 BITCOIN MARKET UPDATE – 31 OCTOBER 2026 🚨 ₿ Bitcoin (BTC): $77,365 USD 📉 Bitcoin is currently

🚨 BITCOIN MARKET UPDATE – 31 OCTOBER 2026 🚨
₿ Bitcoin (BTC): $77,365 USD
📉 Bitcoin is currently facing market pressure and trading volatility. Recent security concerns surrounding Binance and weakness in global markets have affected crypto investor sentiment.
📊 Market Overview:
- Current Price: Around $77,365
- Market Trend: Bearish Pressure
- Key Support: $76,000
- Key Resistance: $78,500
🔍 My Market View:
Traders should watch the $76,000 support level carefully. A strong recovery could bring bullish momentum, while a breakdown may create further downside pressure.
⚠️ Always do your own research and manage your risk before trading.
🔥 What do you think?
Will Bitcoin recover above $80,000 or fall below $75,000?
👇 Comment your prediction!
#Bitcoin #BTC #CryptoNews #BitcoinUpdate #CryptoTrading #BTCUSDTAnalysis $BTC #CryptoMarket #Binance
ບົດຄວາມ
BTC/USD Technical Analysis — 31 October 2026$BTC /USD Technical Analysis — 31 October 2026 {spot}(BTCUSDT) Market outlook • Short-term and intraday trading Current bias: Bearish (selling pressure) Bitcoin is facing strong downside pressure after falling to six-week lows. The latest market analysis points to a weakening short-term trend, with price approaching an important support zone. A temporary bounce is possible, but a confirmed reversal has not yet been established. Forex.com +1 ### 1\. Current market levels Reference price: approximately $77,180, latest available market snapshot. Prices can change quickly. Borearis +1 | Level | Price (USD) | | ----------------- | ----------- | | Resistance 2 | $78,418 | | Resistance 1 | $78,019 | | Intraday pivot | $77,349 | | Current reference | $77,180 | | Support 1 | $75,353 | | Support 2 | $74,958 | | Support 3 | $74,562 | Source: Borearis +1 ### 2\. Trading scenarios Bearish scenario — Sell setup If BTC remains below $77,349 and confirms rejection on a retest, downside levels to watch are: * Target 1: $75,353 * Target 2: $74,958 * Target 3: $74,562 Bullish scenario — Recovery setup If BTC breaks above $77,349 and holds that level, watch for a recovery toward: * Target 1: $78,019 * Target 2: $78,418 A stronger recovery would require sustained buying pressure above these levels. These are conditional scenarios based on the current technical levels, not guaranteed price targets. Borearis +1 ### 3\. Indicator analysis * RSI: Around 33–35 on the daily chart, indicating weak momentum. The market may rebound, but low RSI alone is not a buy signal. * MACD: Below its signal line, supporting the bearish short-term outlook. * Moving averages: BTC is below its 20-day and 50-day averages, indicating continued selling pressure. * News risk: Recent reports of a major Binance security breach may contribute to volatility and negative sentiment. Borearis +1 ### 4\. My trading outlook Short-term trend Bearish Key decision level ### $77,349 Main downside level ### $75,353 Recovery confirmation ### $78,019+ My preference: Avoid chasing a sell after a sharp drop. Wait for a confirmed breakdown and retest before considering a short, or wait for a clear reclaim of resistance before considering a long. Use a stop-loss and keep leverage low. This is technical analysis, not a guarantee or personalized financial advice. Which timeframe do you trade? 5-minute scalping 15-minute trading 1-hour trading 4-hour swing trading Daily analysis Preferred setup Buy / Long Sell / Short Both Analyze my timeframe. #BTC☀️ #bitcoin #BTCUSDTAnalysis

BTC/USD Technical Analysis — 31 October 2026

$BTC /USD Technical Analysis — 31 October 2026
Market outlook • Short-term and intraday trading
Current bias: Bearish (selling pressure)
Bitcoin is facing strong downside pressure after falling to six-week lows. The latest market analysis points to a weakening short-term trend, with price approaching an important support zone. A temporary bounce is possible, but a confirmed reversal has not yet been established. Forex.com +1
### 1\. Current market levels
Reference price: approximately $77,180, latest available market snapshot. Prices can change quickly. Borearis +1
| Level | Price (USD) |
| ----------------- | ----------- |
| Resistance 2 | $78,418 |
| Resistance 1 | $78,019 |
| Intraday pivot | $77,349 |
| Current reference | $77,180 |
| Support 1 | $75,353 |
| Support 2 | $74,958 |
| Support 3 | $74,562 |
Source: Borearis +1
### 2\. Trading scenarios
Bearish scenario — Sell setup
If BTC remains below $77,349 and confirms rejection on a retest, downside levels to watch are:
* Target 1: $75,353
* Target 2: $74,958
* Target 3: $74,562
Bullish scenario — Recovery setup
If BTC breaks above $77,349 and holds that level, watch for a recovery toward:
* Target 1: $78,019
* Target 2: $78,418
A stronger recovery would require sustained buying pressure above these levels.
These are conditional scenarios based on the current technical levels, not guaranteed price targets. Borearis +1
### 3\. Indicator analysis
* RSI: Around 33–35 on the daily chart, indicating weak momentum. The market may rebound, but low RSI alone is not a buy signal.
* MACD: Below its signal line, supporting the bearish short-term outlook.
* Moving averages: BTC is below its 20-day and 50-day averages, indicating continued selling pressure.
* News risk: Recent reports of a major Binance security breach may contribute to volatility and negative sentiment. Borearis +1
### 4\. My trading outlook
Short-term trend
Bearish
Key decision level
### $77,349
Main downside level
### $75,353
Recovery confirmation
### $78,019+
My preference: Avoid chasing a sell after a sharp drop. Wait for a confirmed breakdown and retest before considering a short, or wait for a clear reclaim of resistance before considering a long. Use a stop-loss and keep leverage low.
This is technical analysis, not a guarantee or personalized financial advice.
Which timeframe do you trade?
5-minute scalping
15-minute trading
1-hour trading
4-hour swing trading
Daily analysis
Preferred setup
Buy / Long
Sell / Short
Both
Analyze my timeframe.
#BTC☀️ #bitcoin #BTCUSDTAnalysis
·
--
ສັນຍານໝີ
🚨 BTC Analysis & Update 📉 I have analyzed Bitcoin (BTC), and you can see the details in the attached chart. Based on this analysis, I believe the market will start dropping from the $79,500 level and could go as low as $74,500 within the next few hours. Make sure to Follow this page for daily BTC news and market updates #BTC {future}(BTCUSDT) #BTCUSDTAnalysis $BTC #EarningsSeason
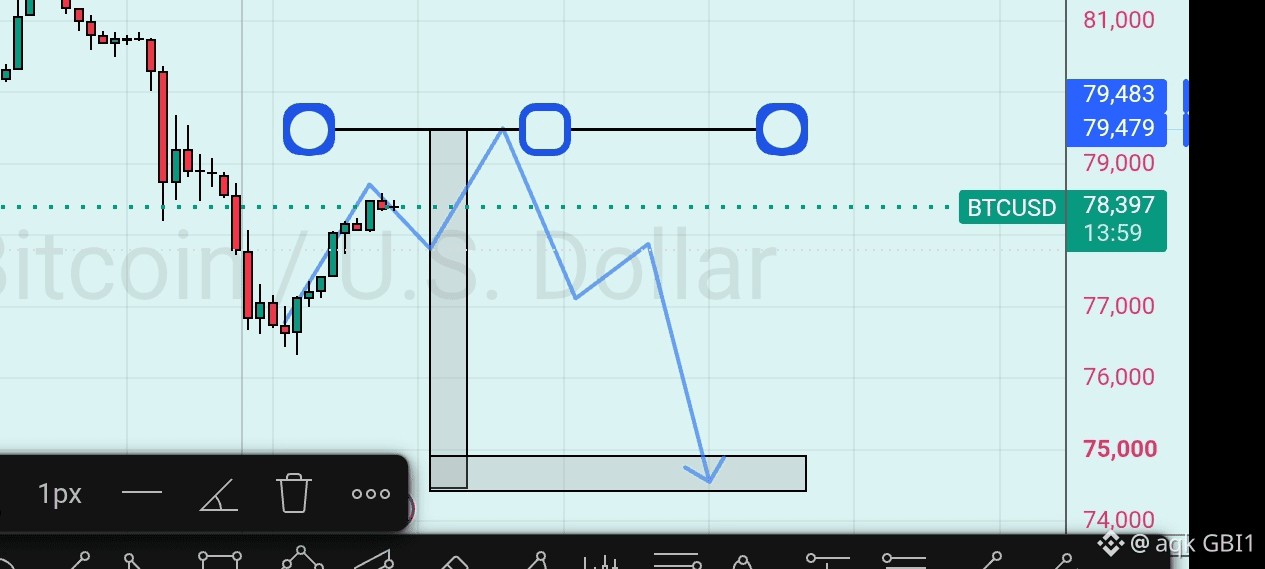
🚨 BTC Analysis & Update 📉

I have analyzed Bitcoin (BTC), and you can see the details in the attached chart. Based on this analysis, I believe the market will start dropping from the $79,500 level and could go as low as $74,500 within the next few hours.
Make sure to Follow this page for daily BTC news and market updates
#BTC

#BTCUSDTAnalysis $BTC #EarningsSeason

·
--
ສັນຍານໝີ
₿ BITCOIN THOUGHTS | BTC MARKET WATCH 📊 Bitcoin is more than just a price chart — it’s a battle between fear and greed, patience and panic. 🚀 The market can move fast, but smart decisions require discipline, research, and a clear strategy. Every dip is not automatically an opportunity, and every pump is not a guarantee of more upside. 👀 What’s next for BTC? 🐂 Bulls are watching for a breakout. 🐻 Bears are waiting for a breakdown. 🎯 Traders are watching key support and resistance levels. Remember: Don’t trade your emotions. Trade your plan. What’s your opinion? 👇 🚀 BTC to the moon or 📉 another correction? #CryptoMENA #BitcoinAnalysis #trading #BTCUSDTAnalysis $BTC {spot}(BTCUSDT)

₿ BITCOIN THOUGHTS | BTC MARKET WATCH 📊

Bitcoin is more than just a price chart — it’s a battle between fear and greed, patience and panic. 🚀

The market can move fast, but smart decisions require discipline, research, and a clear strategy. Every dip is not automatically an opportunity, and every pump is not a guarantee of more upside.

👀 What’s next for BTC?
🐂 Bulls are watching for a breakout.
🐻 Bears are waiting for a breakdown.
🎯 Traders are watching key support and resistance levels.

Remember: Don’t trade your emotions. Trade your plan.

What’s your opinion? 👇
🚀 BTC to the moon or 📉 another correction?

#CryptoMENA #BitcoinAnalysis #trading #BTCUSDTAnalysis

$BTC
·
--
ສັນຍານກະທິງ
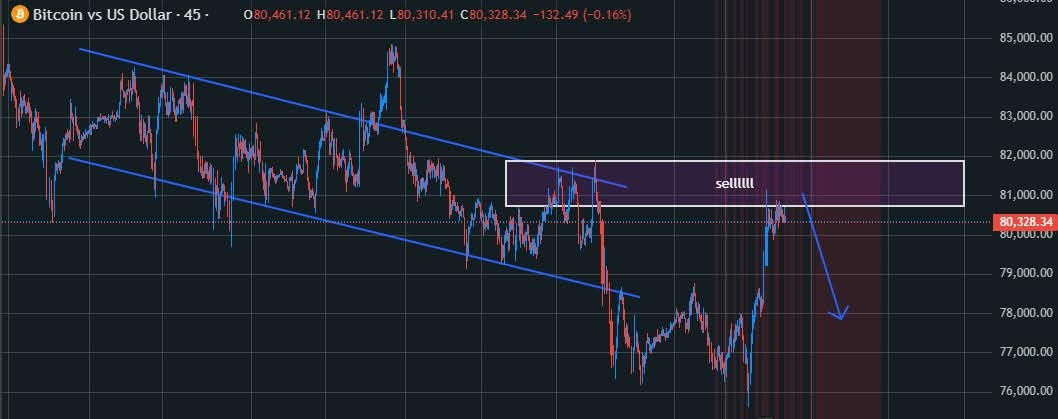
$BITCOIN is trading near $80,000, and the short-term trend currently looks bearish. BTC is facing selling pressure, with momentum indicators showing weakness. 🔴 Bearish scenario: A break below $79,000 could open the way toward $78,600. 🟢 Bullish scenario: A strong move above $81,350 could push BTC toward $82,000. ⚠️ My view: Short-term downside pressure remains, but a confirmed breakout could change the picture. Key levels: Support $79,000 | Resistance $81,350. Don't chase the market. Wait for confirmation and manage your risk carefully. #Bitcoin #BTC #CryptoMarket #BitcoinAnalysis #CryptoTrading #BTCUSDTAnalysis
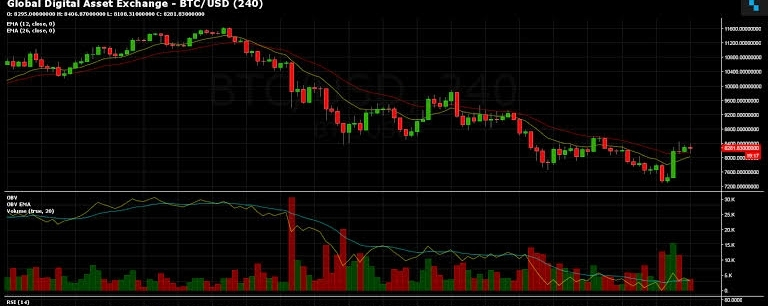
$BITCOIN is trading near $80,000, and the short-term trend currently looks bearish. BTC is facing selling pressure, with momentum indicators showing weakness.
🔴 Bearish scenario: A break below $79,000 could open the way toward $78,600.
🟢 Bullish scenario: A strong move above $81,350 could push BTC toward $82,000.
⚠️ My view: Short-term downside pressure remains, but a confirmed breakout could change the picture.
Key levels: Support $79,000 | Resistance $81,350.
Don't chase the market. Wait for confirmation and manage your risk carefully.
#Bitcoin #BTC #CryptoMarket #BitcoinAnalysis #CryptoTrading #BTCUSDTAnalysis

ເຂົ້າສູ່ລະບົບເພື່ອສຳຫຼວດເນື້ອຫາເພີ່ມເຕີມ
ເຂົ້າຮ່ວມກຸ່ມຜູ້ໃຊ້ຄຣິບໂຕທົ່ວໂລກໃນ Binance Square.
⚡️ ໄດ້ຮັບຂໍ້ມູນຫຼ້າສຸດ ແລະ ທີ່ມີປະໂຫຍດກ່ຽວກັບຄຣິບໂຕ.
💬 ໄດ້ຮັບຄວາມໄວ້ວາງໃຈຈາກຕະຫຼາດແລກປ່ຽນຄຣິບໂຕທີ່ໃຫຍ່ທີ່ສຸດໃນໂລກ.
👍 ຄົ້ນຫາຂໍ້ມູນເຊີງເລິກທີ່ແທ້ຈາກນັກສ້າງທີ່ໄດ້ຮັບການຢືນຢັນ.
ອີເມວ / ເບີໂທລະສັບ