
#bitcoinrainbow
bitcoinrainbow
3,910 views
6 ກຳລັງສົນທະນາ
ມາແຮງ
ຫຼ້າສຸດ

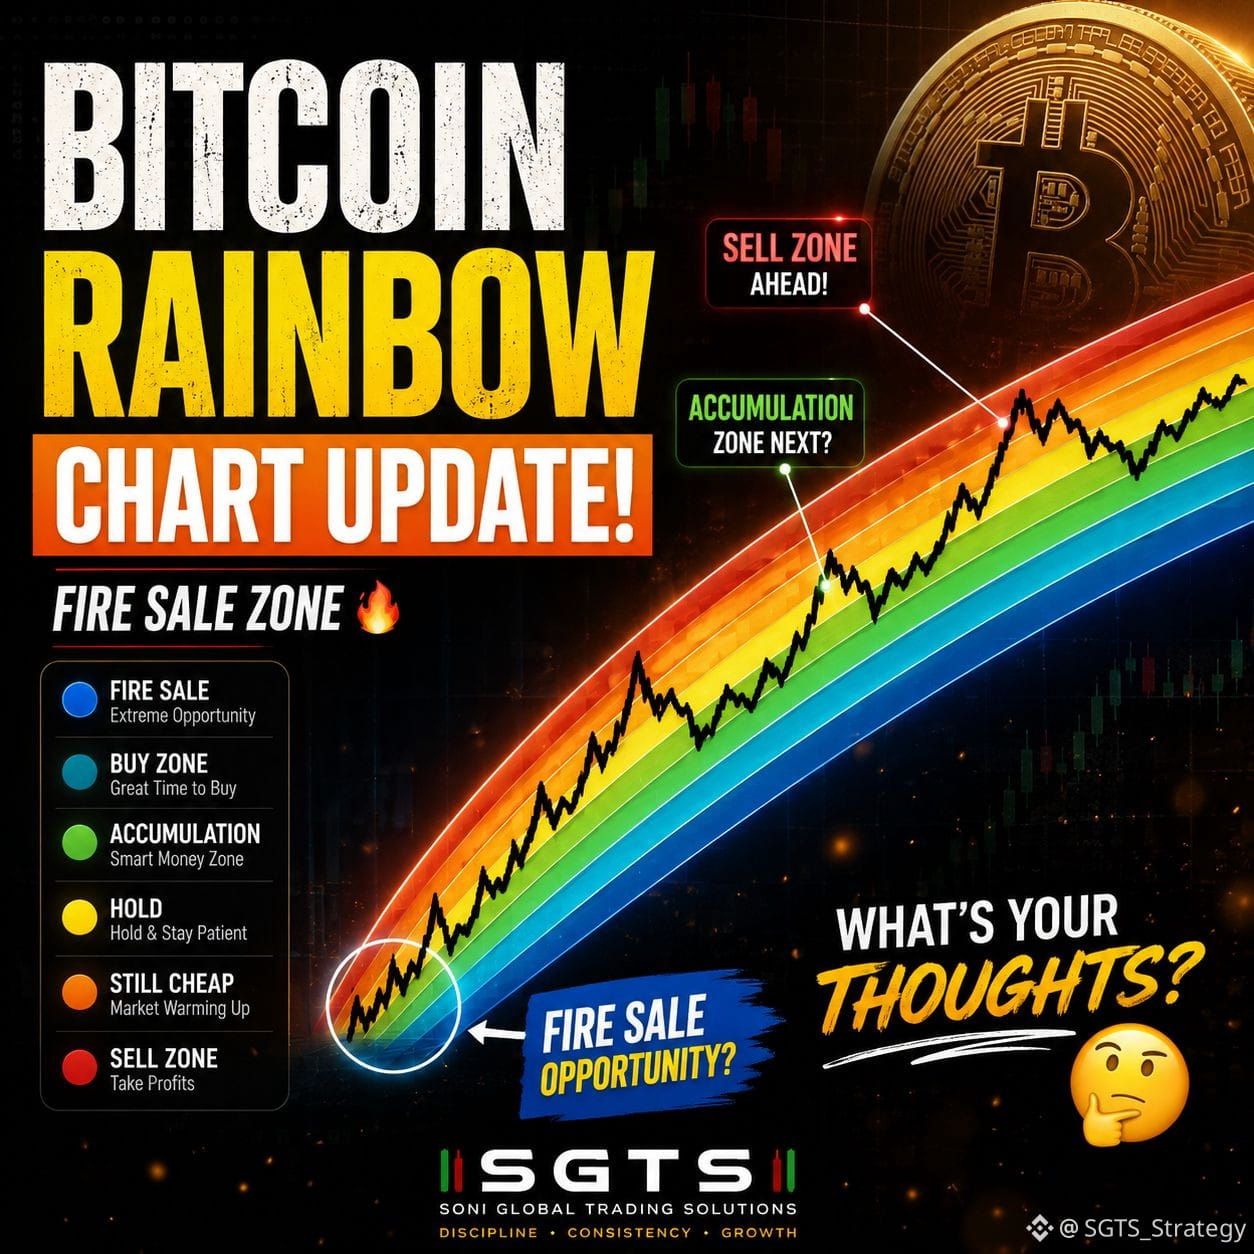
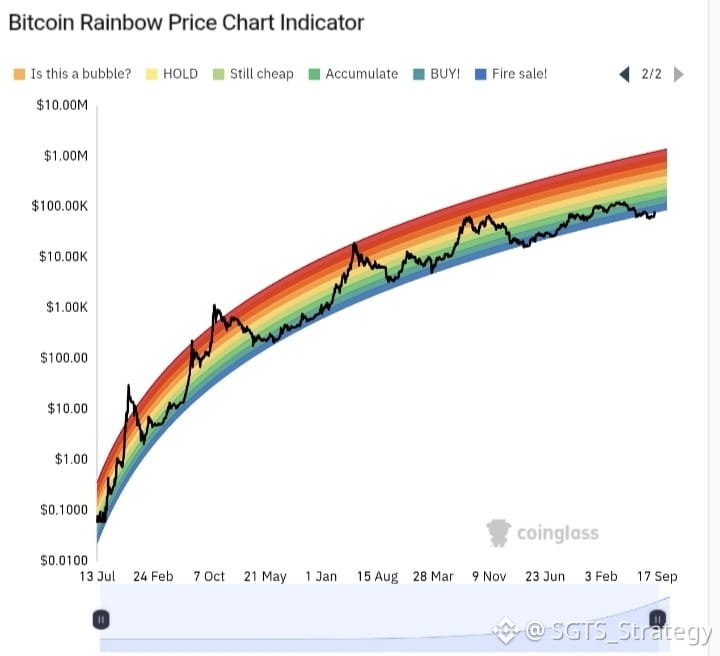
$BTC | The Bitcoin Rainbow Chart compresses cycle-position into nine logarithmic regression bands across a single colour ramp. Red (Maximum Bubble Territory) historically caught Dec 2013, Dec 2017, Apr 2021, and the late 2025 cluster. Dark blue (Buy / Accumulate) caught Jan 2015, Dec 2018, and Nov 2022.
The honest framing: it is the same log-log regression underneath as Bitcoin Power Law, just visualised differently. Useful as a quick-glance cycle-position read for a confluence stack, not load-bearing on its own.
Inside the SatoshiMacro Model it sits as a secondary visual in the Tier 1 Valuation card.
Full historical chart: https://satoshimacro.com/tools/crypto/cycle-indicators/bitcoin-rainbow-chart/
#SatoshiMacro #BitcoinRainbow #OnChain #Bitcoin
The honest framing: it is the same log-log regression underneath as Bitcoin Power Law, just visualised differently. Useful as a quick-glance cycle-position read for a confluence stack, not load-bearing on its own.
Inside the SatoshiMacro Model it sits as a secondary visual in the Tier 1 Valuation card.
Full historical chart: https://satoshimacro.com/tools/crypto/cycle-indicators/bitcoin-rainbow-chart/
#SatoshiMacro #BitcoinRainbow #OnChain #Bitcoin

ເຂົ້າສູ່ລະບົບເພື່ອສຳຫຼວດເນື້ອຫາເພີ່ມເຕີມ