

#marketanalysis
marketanalysis
10.7M ຄັ້ງທີ່ເບິ່ງ
66,390 ກຳລັງສົນທະນາ
ມາແຮງ
ຫຼ້າສຸດ

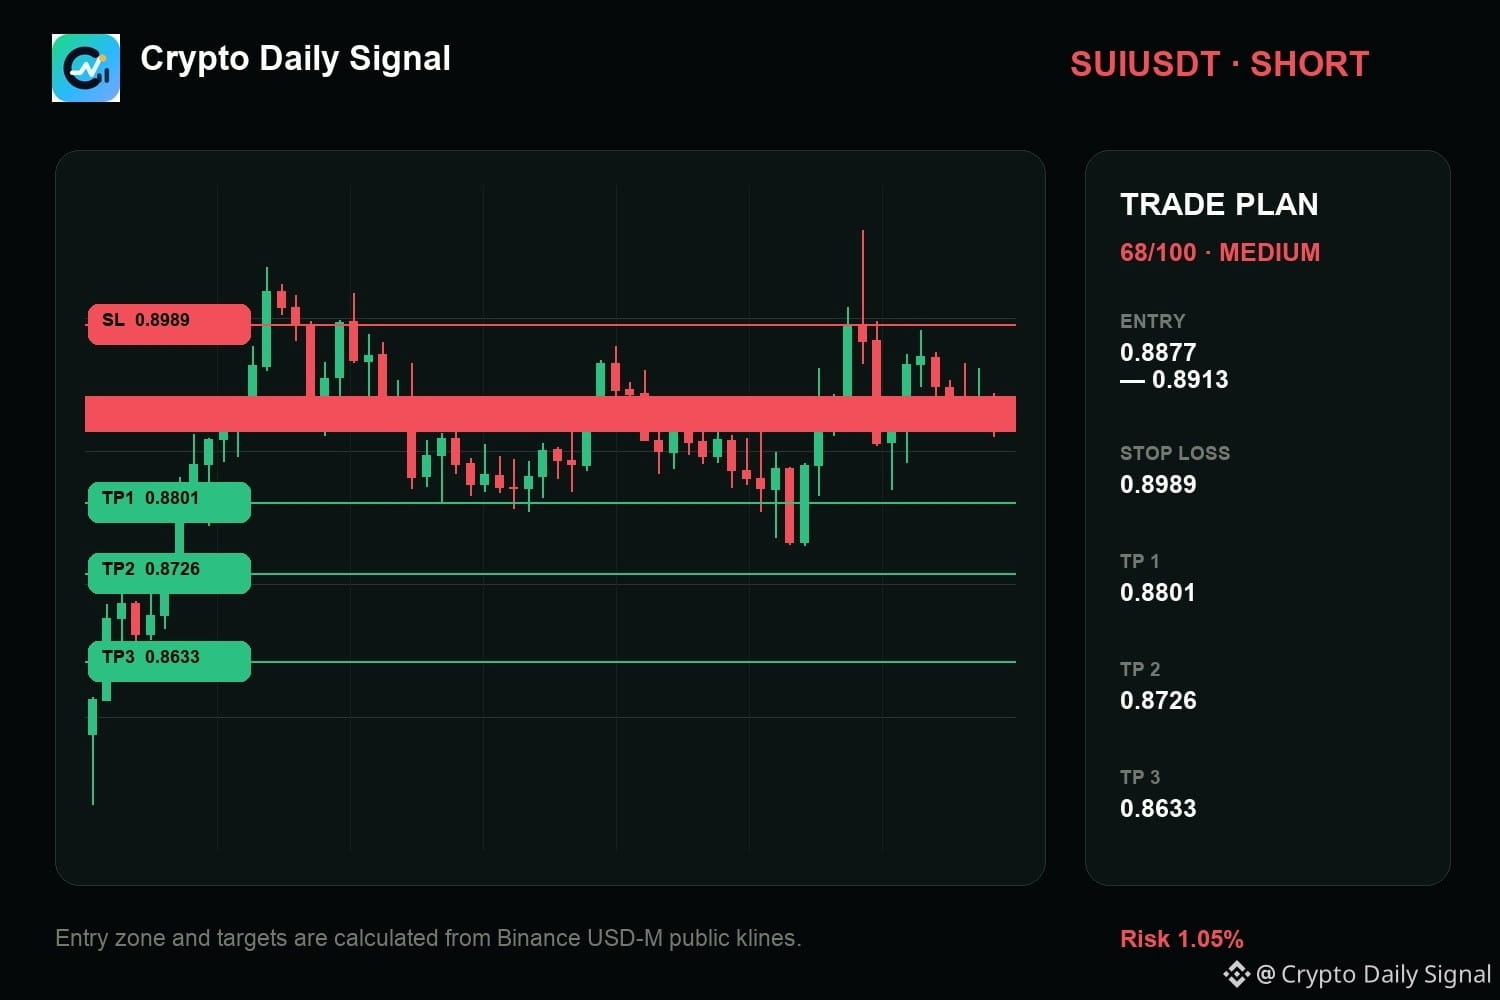
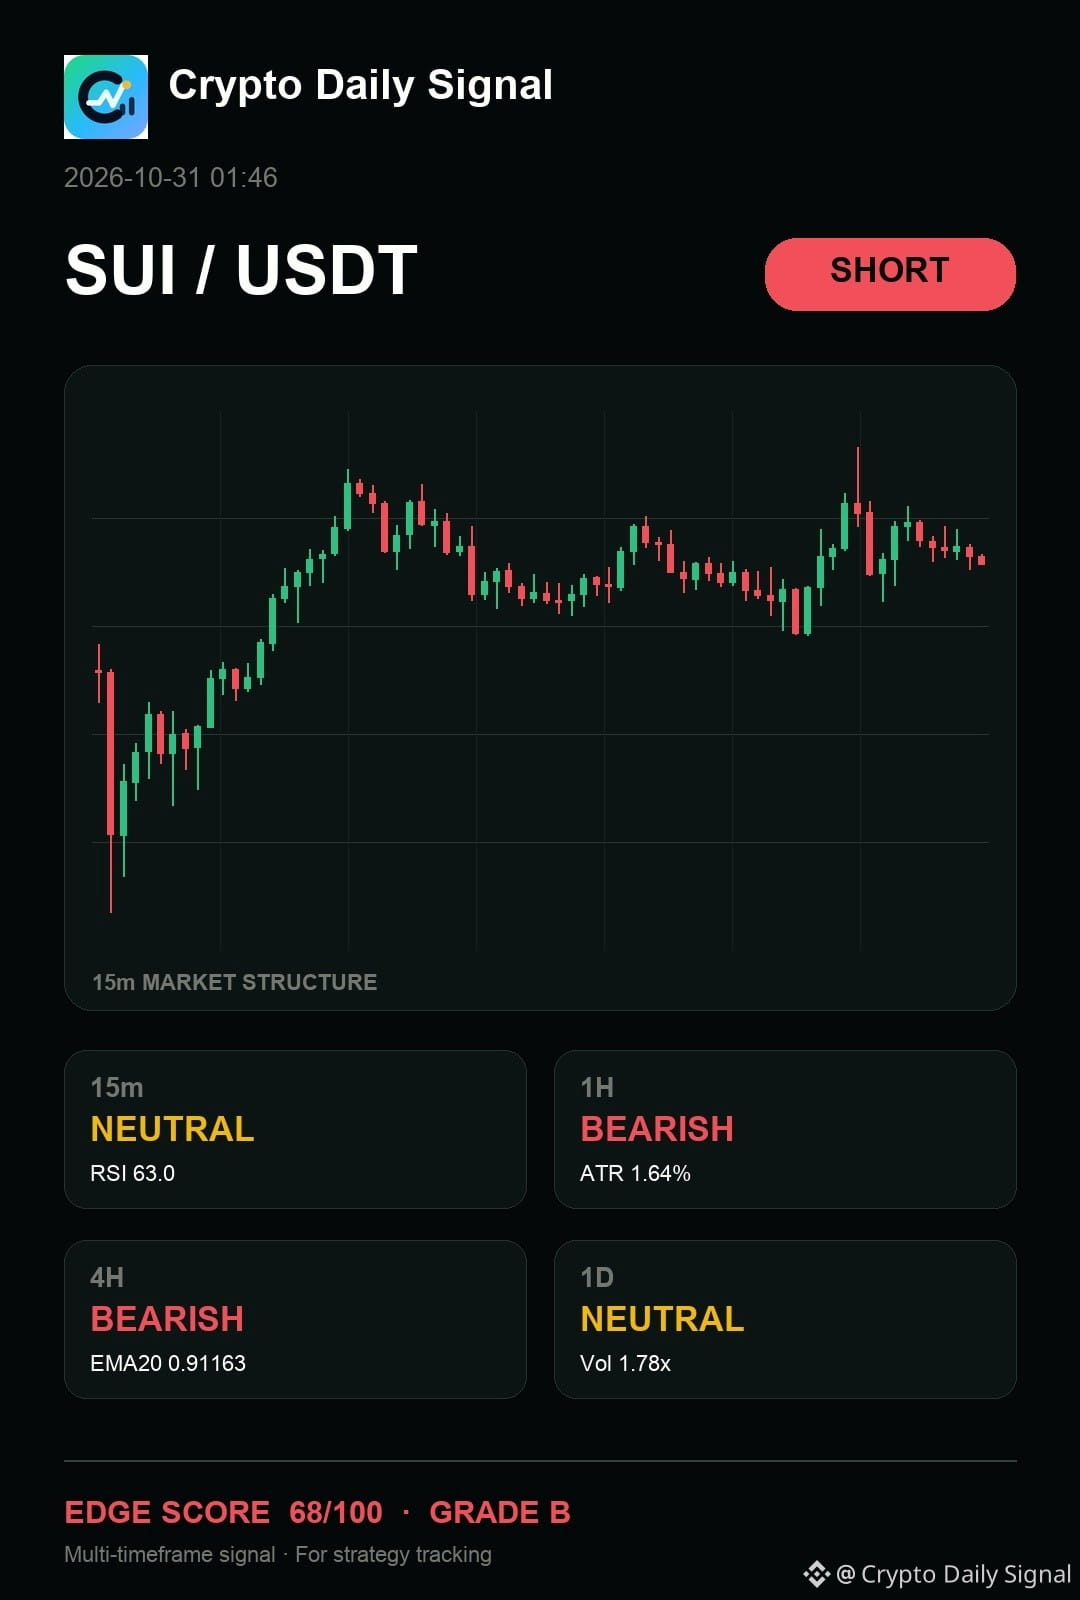
$SUI is still tilted toward sellers because the immediate price action shows lower highs inside the trading band. For this short idea to have real weight, we need the price to decisively break and close below the established range floor. A strong move back above the recent short-term swing high would negate the bearish outlook entirely.
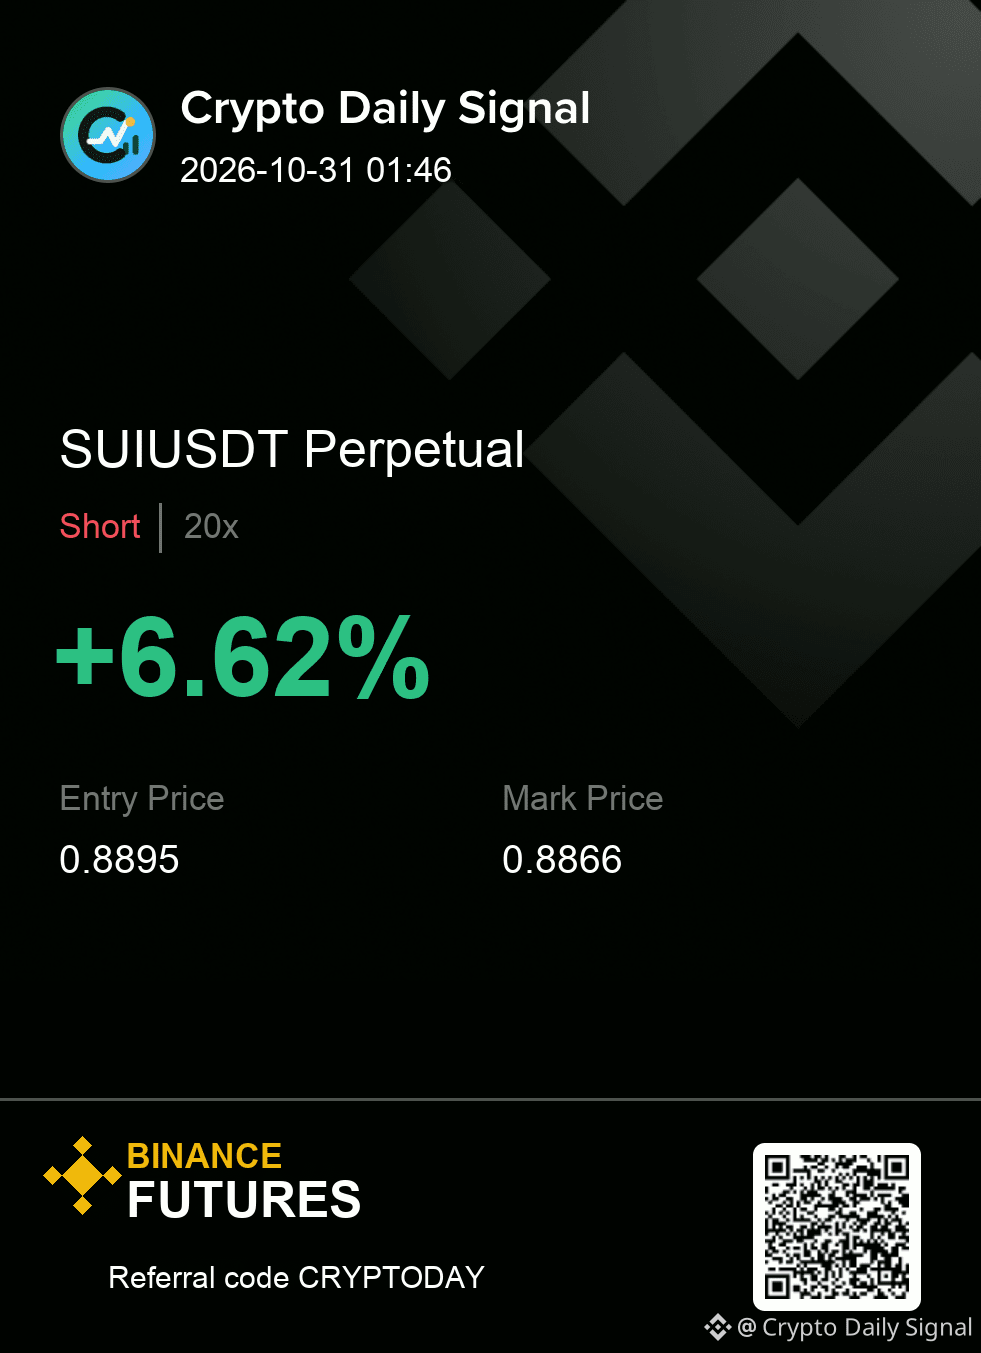
SUIUSDT SHORT
IN 0.8877 - 0.8913
OUT 0.8989
TP 0.8801 · 0.8726 · 0.8633
#MarketAnalysis
{future}(SUIUSDT)
$SUI is still tilted toward sellers because the immediate price action shows lower highs inside the trading band. For this short idea to have real weight, we need the price to decisively break and close below the established range floor. A strong move back above the recent short-term swing high would negate the bearish outlook entirely.
SUIUSDT SHORT
IN 0.8877 - 0.8913
OUT 0.8989
TP 0.8801 · 0.8726 · 0.8633
#MarketAnalysis
SUIUSDT SHORT
IN 0.8877 - 0.8913
OUT 0.8989
TP 0.8801 · 0.8726 · 0.8633
#MarketAnalysis
3

·
--
Everyone is long. The chart says otherwise.
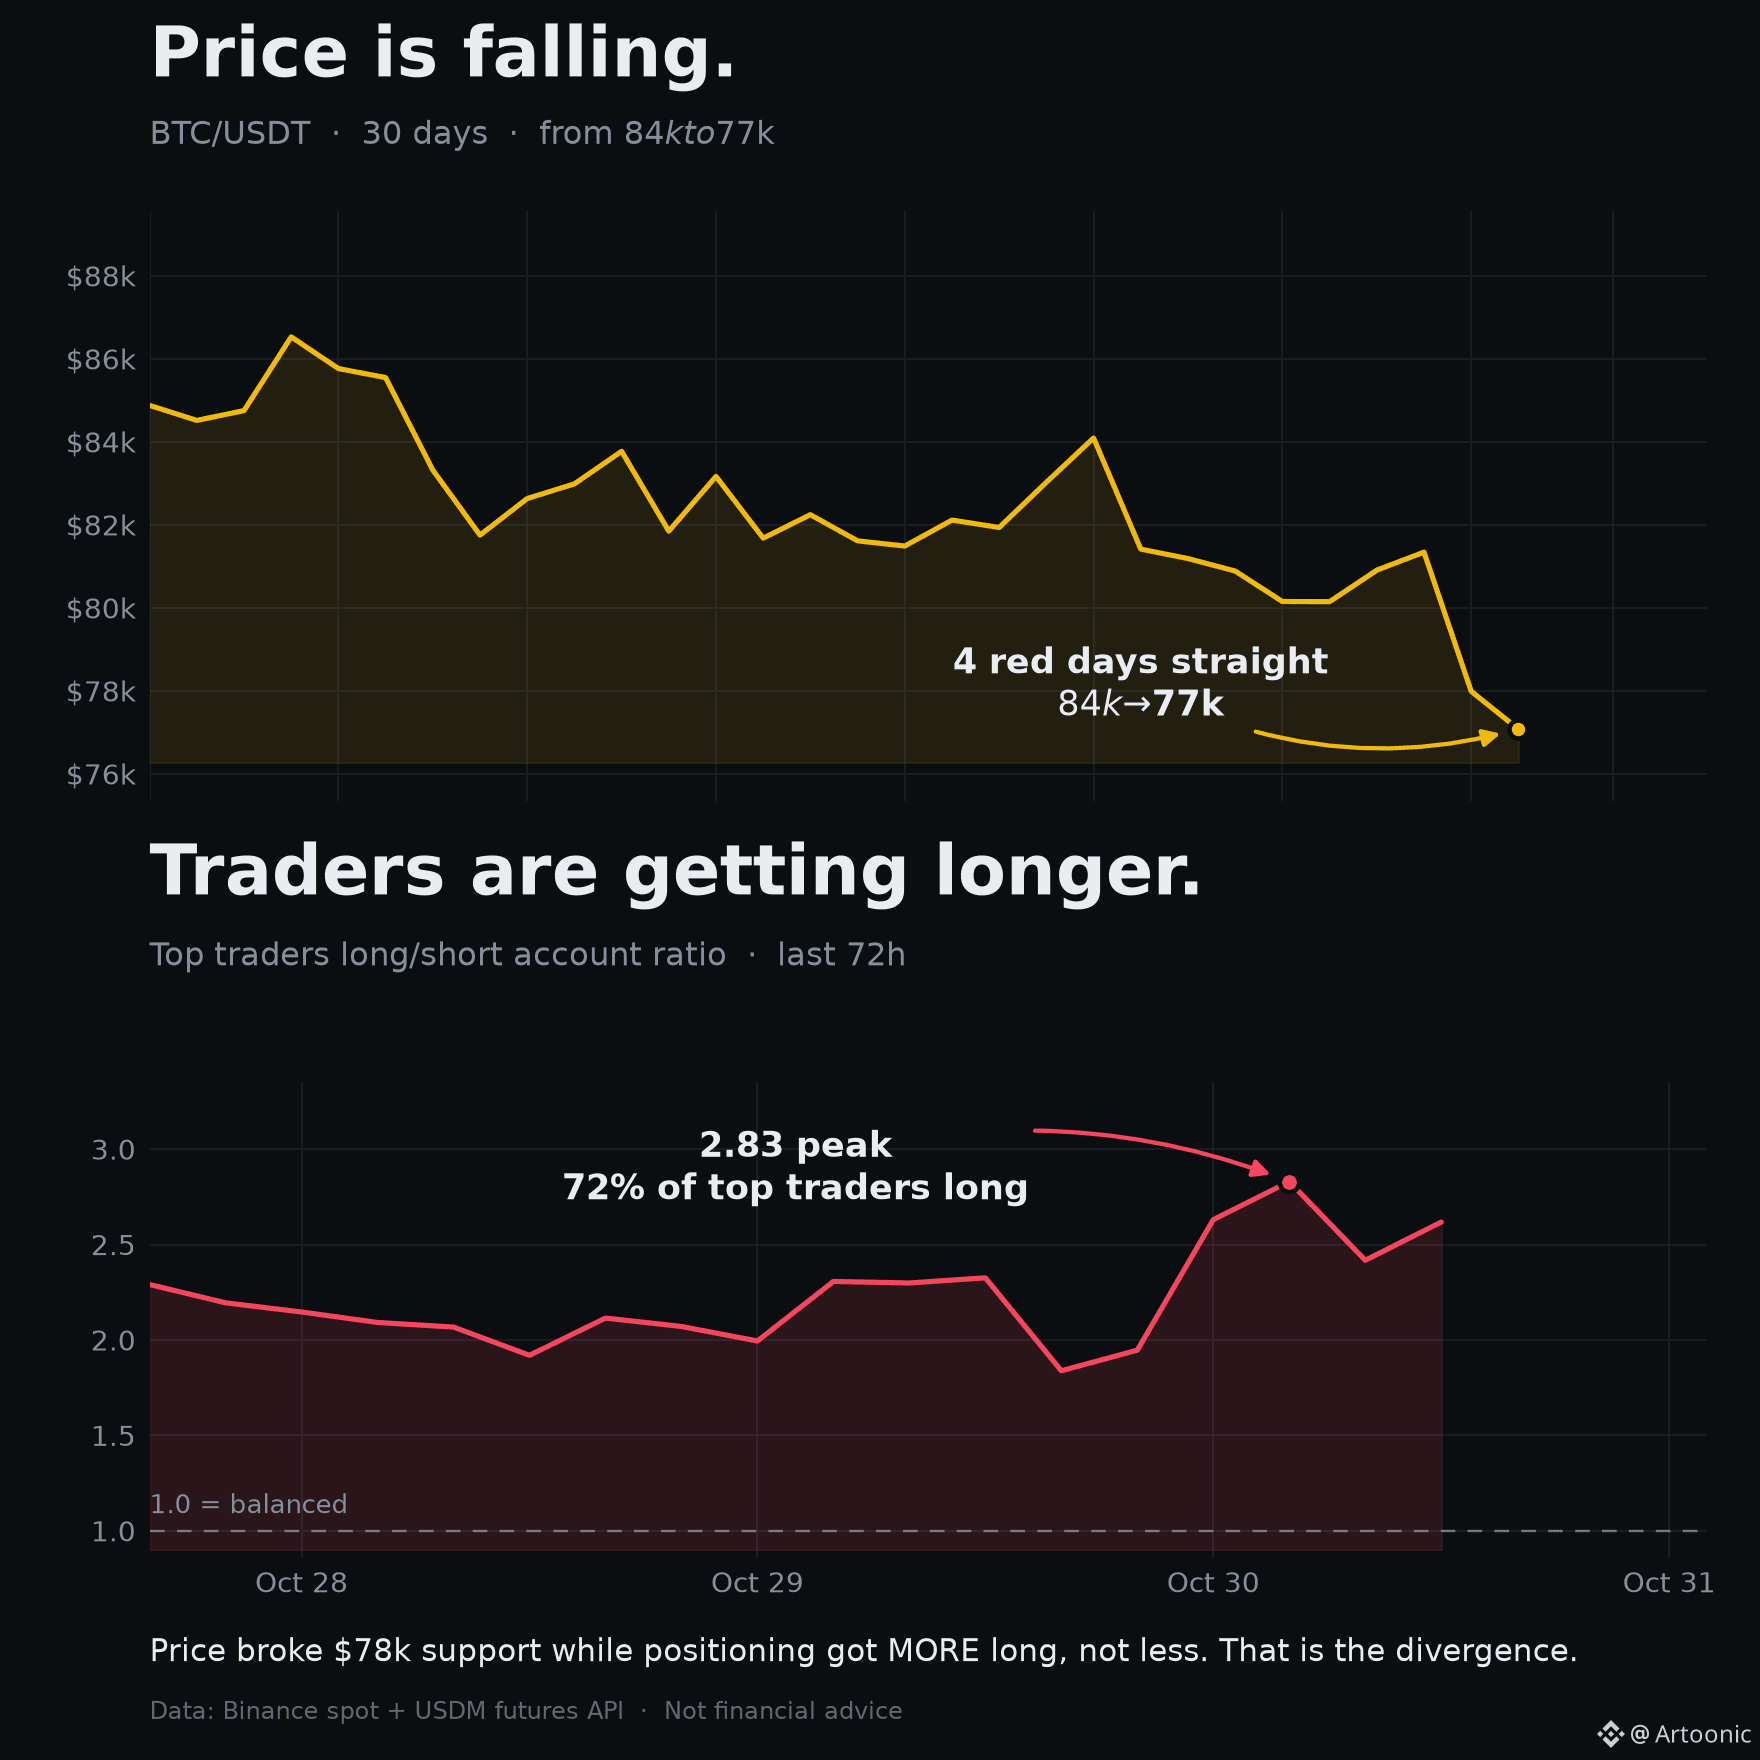
$BTC just lost $78,000 after four red days in a row.
And here is the part most people miss.
72% of top traders are still positioned long. Long/short ratio hit 2.83 at the peak. It did not fall as price fell. It went UP.
Look at the whole board:
$BTC -3.5%
$ETH -4.1%
$SOL -4.5%
Nothing is holding up. This is not a BTC problem. It is a risk-off day across the market.
Now the detail that actually matters: funding is flat at 0.01%.
Read that again. Price is falling, but funding is not negative. The longs are paying to stay in, but barely. They are not panicking. They are waiting.
That is the dangerous part of a move like this.
When everyone is already long and nobody has been shaken out, there is no capitulation. No flushed-out low. Just a slow drip while people hold and hope.
Why it matters:
Price is not the only signal. Positioning is. A red candle with 72% longs behind it says the pain may not be finished. A red candle with shorts crowded in says a squeeze is possible. Same chart, completely different setup.
Quick takeaway:
Before you buy a dip, check where the crowd already sits. If everyone is already long, you are not early. You are late to a trade that has not cleared yet. Watch for funding to flip negative or the long ratio to drop under 1.5 before calling a bottom.
Where do you think we flush out first: below $76k, or back above $80k?
#Bitcoin #CryptoTrading #BinanceSquare #MarketAnalysis #BTC
105

·
--
🚨 HYPE UNDER PRESSURE — $197K IN LONGS WIPED OUT!
🔴 Asset: $HYPE
💥 Liquidated Longs: $197,000
📍 Liquidation Price: $90.42
The market just delivered a serious warning to bullish HYPE traders. Nearly $197K in long positions were liquidated around $90.42, highlighting the risk of betting on upside momentum without proper risk management.
📉 My Market Outlook:
If HYPE struggles to reclaim $90.42 and selling pressure continues, another downside move could develop as leveraged buyers retreat. However, if buyers regain control and push price back above this level, a recovery bounce may follow.
🎯 Key Levels to Watch
$90.42: Reference level from the liquidation event.
Below the level: Watch for continued weakness and further long liquidations.
Above the level: Look for bullish confirmation before anticipating a rebound.
⚠️ Trader’s Take: Liquidation data reveals where leveraged traders got caught, not where price must go next. Wait for price action, volume, and confirmation before entering a position. Manage risk carefully.
#HYPE #Hyperliquid #CryptoTrading #Liquidations #MarketAnalysis
#StanDruckenmillerBecomesInvestorInTradeXYZ #EarningsSeason #BrazilCryptoExchangesMustApplyForLicensesByFriday #FedWatch
{spot}(HYPEUSDT)
🚨 HYPE UNDER PRESSURE — $197K IN LONGS WIPED OUT!
🔴 Asset: $HYPE
💥 Liquidated Longs: $197,000
📍 Liquidation Price: $90.42
The market just delivered a serious warning to bullish HYPE traders. Nearly $197K in long positions were liquidated around $90.42, highlighting the risk of betting on upside momentum without proper risk management.
📉 My Market Outlook:
If HYPE struggles to reclaim $90.42 and selling pressure continues, another downside move could develop as leveraged buyers retreat. However, if buyers regain control and push price back above this level, a recovery bounce may follow.
🎯 Key Levels to Watch
$90.42: Reference level from the liquidation event.
Below the level: Watch for continued weakness and further long liquidations.
Above the level: Look for bullish confirmation before anticipating a rebound.
⚠️ Trader’s Take: Liquidation data reveals where leveraged traders got caught, not where price must go next. Wait for price action, volume, and confirmation before entering a position. Manage risk carefully.
#HYPE #Hyperliquid #CryptoTrading #Liquidations #MarketAnalysis
#StanDruckenmillerBecomesInvestorInTradeXYZ #EarningsSeason #BrazilCryptoExchangesMustApplyForLicensesByFriday #FedWatch
3

🚨 OPERATIONAL ALERT: OP LONGS GET SWEPT AT $0.109! 🔴
Optimism ($OP) is flashing a warning for leveraged bulls. A $63.9K long liquidation at $0.109 shows that buyers have been caught under pressure, putting the token’s next support test in focus. ⚡
📊 PRICE ACTION RADAR
🔴 Liquidation Level: $0.109
🛡️ Support Watch: $0.106–$0.104
🚧 Resistance Watch: $0.112–$0.115
🎯 THE NEXT MOVE: BREAKDOWN OR BOUNCE?
🐻 Bearish Scenario: If OP breaks below $0.106 and fails to reclaim it, sellers could push toward $0.104.
🐂 Bullish Scenario: A convincing recovery above $0.112 could signal that buyers are regaining control, with $0.115 as the next area to watch.
📉 SIGNAL PROVIDER'S VERDICT
My short-term bias is cautiously bearish below $0.112. The liquidation highlights downside risk, but one event alone cannot confirm a sustained bearish trend.
📍 TRADE BLUEPRINT
• Short trigger: Confirmed break below $0.106.
• Invalidation: A sustained move back above $0.112.
• Potential downside zones: $0.104, then reassess price action.
• Alternative: Consider a bullish setup only after resistance is reclaimed and holds.
⚡ KEY TAKEAWAY: Don't rush into OP after the liquidation. Let price reveal whether sellers have more fuel or buyers are preparing a recovery.
⚠️ Risk Warning: These are illustrative levels, not live-verified technical zones or guaranteed targets. Always confirm market conditions, use a stop-loss, and control leverage.
#OP #Optimism #CryptoTrading #LiquidationAlert #MarketAnalysis
#CanMicrosoftDeliverOnAI #CanGoogleDefindItsCore #BitcoinCore32.1RaisesPeerConnectionLimit #BitcoinCoreIdentifiesThreeVulnerabilities
{spot}(OPUSDT)
🚨 OPERATIONAL ALERT: OP LONGS GET SWEPT AT $0.109! 🔴
Optimism ($OP) is flashing a warning for leveraged bulls. A $63.9K long liquidation at $0.109 shows that buyers have been caught under pressure, putting the token’s next support test in focus. ⚡
📊 PRICE ACTION RADAR
🔴 Liquidation Level: $0.109
🛡️ Support Watch: $0.106–$0.104
🚧 Resistance Watch: $0.112–$0.115
🎯 THE NEXT MOVE: BREAKDOWN OR BOUNCE?
🐻 Bearish Scenario: If OP breaks below $0.106 and fails to reclaim it, sellers could push toward $0.104.
🐂 Bullish Scenario: A convincing recovery above $0.112 could signal that buyers are regaining control, with $0.115 as the next area to watch.
📉 SIGNAL PROVIDER'S VERDICT
My short-term bias is cautiously bearish below $0.112. The liquidation highlights downside risk, but one event alone cannot confirm a sustained bearish trend.
📍 TRADE BLUEPRINT
• Short trigger: Confirmed break below $0.106.
• Invalidation: A sustained move back above $0.112.
• Potential downside zones: $0.104, then reassess price action.
• Alternative: Consider a bullish setup only after resistance is reclaimed and holds.
⚡ KEY TAKEAWAY: Don't rush into OP after the liquidation. Let price reveal whether sellers have more fuel or buyers are preparing a recovery.
⚠️ Risk Warning: These are illustrative levels, not live-verified technical zones or guaranteed targets. Always confirm market conditions, use a stop-loss, and control leverage.
#OP #Optimism #CryptoTrading #LiquidationAlert #MarketAnalysis
#CanMicrosoftDeliverOnAI #CanGoogleDefindItsCore #BitcoinCore32.1RaisesPeerConnectionLimit #BitcoinCoreIdentifiesThreeVulnerabilities
19
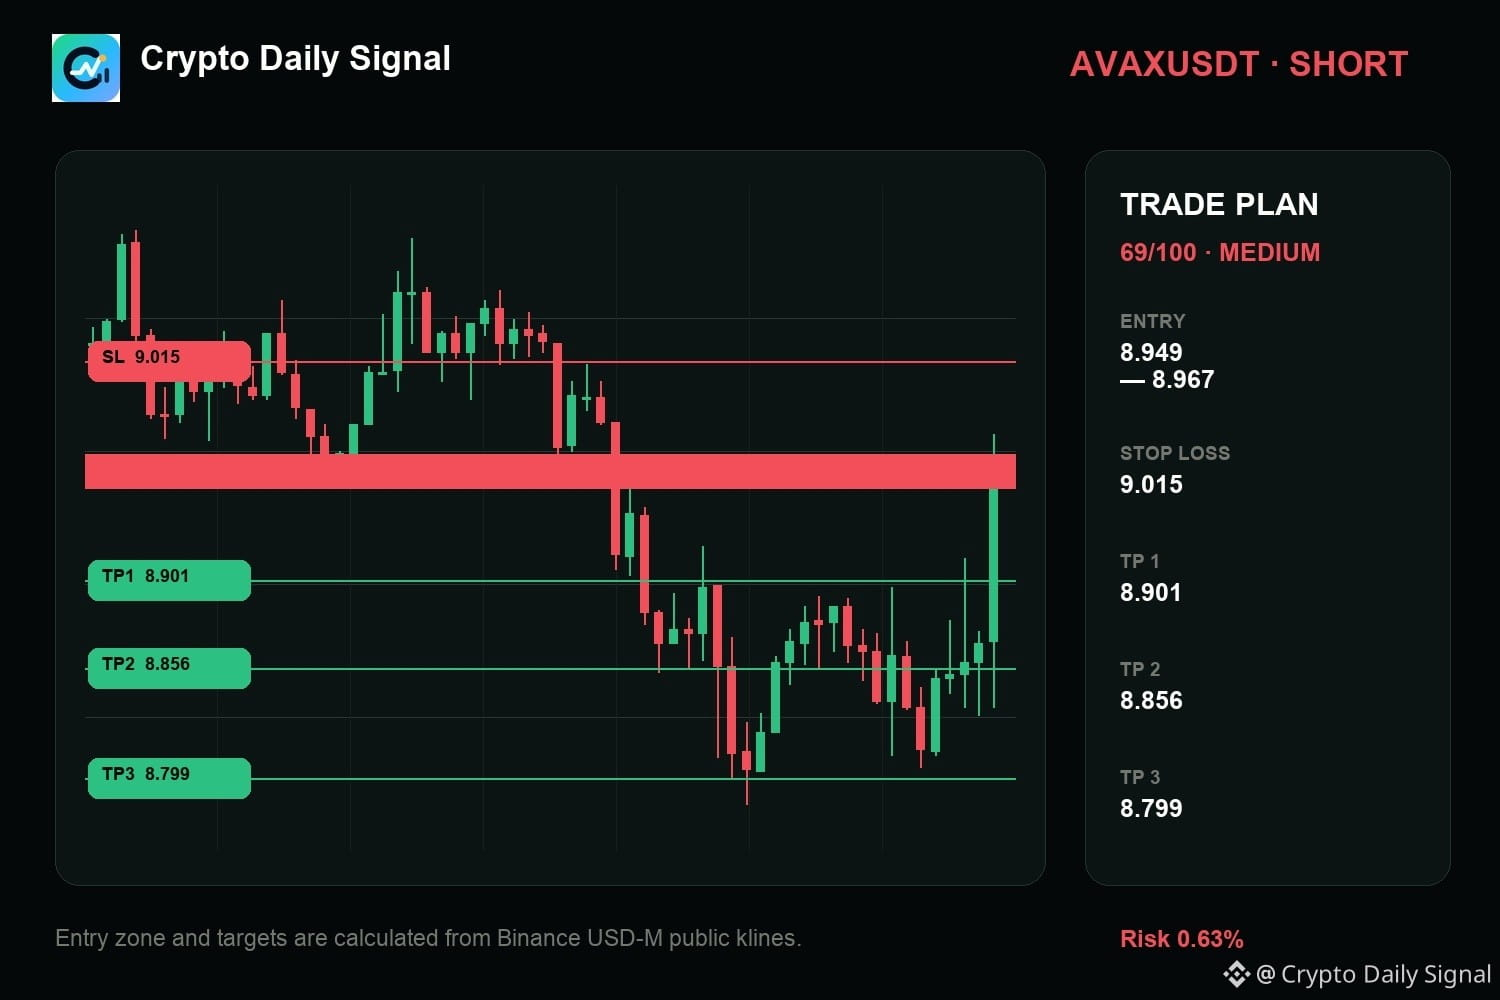
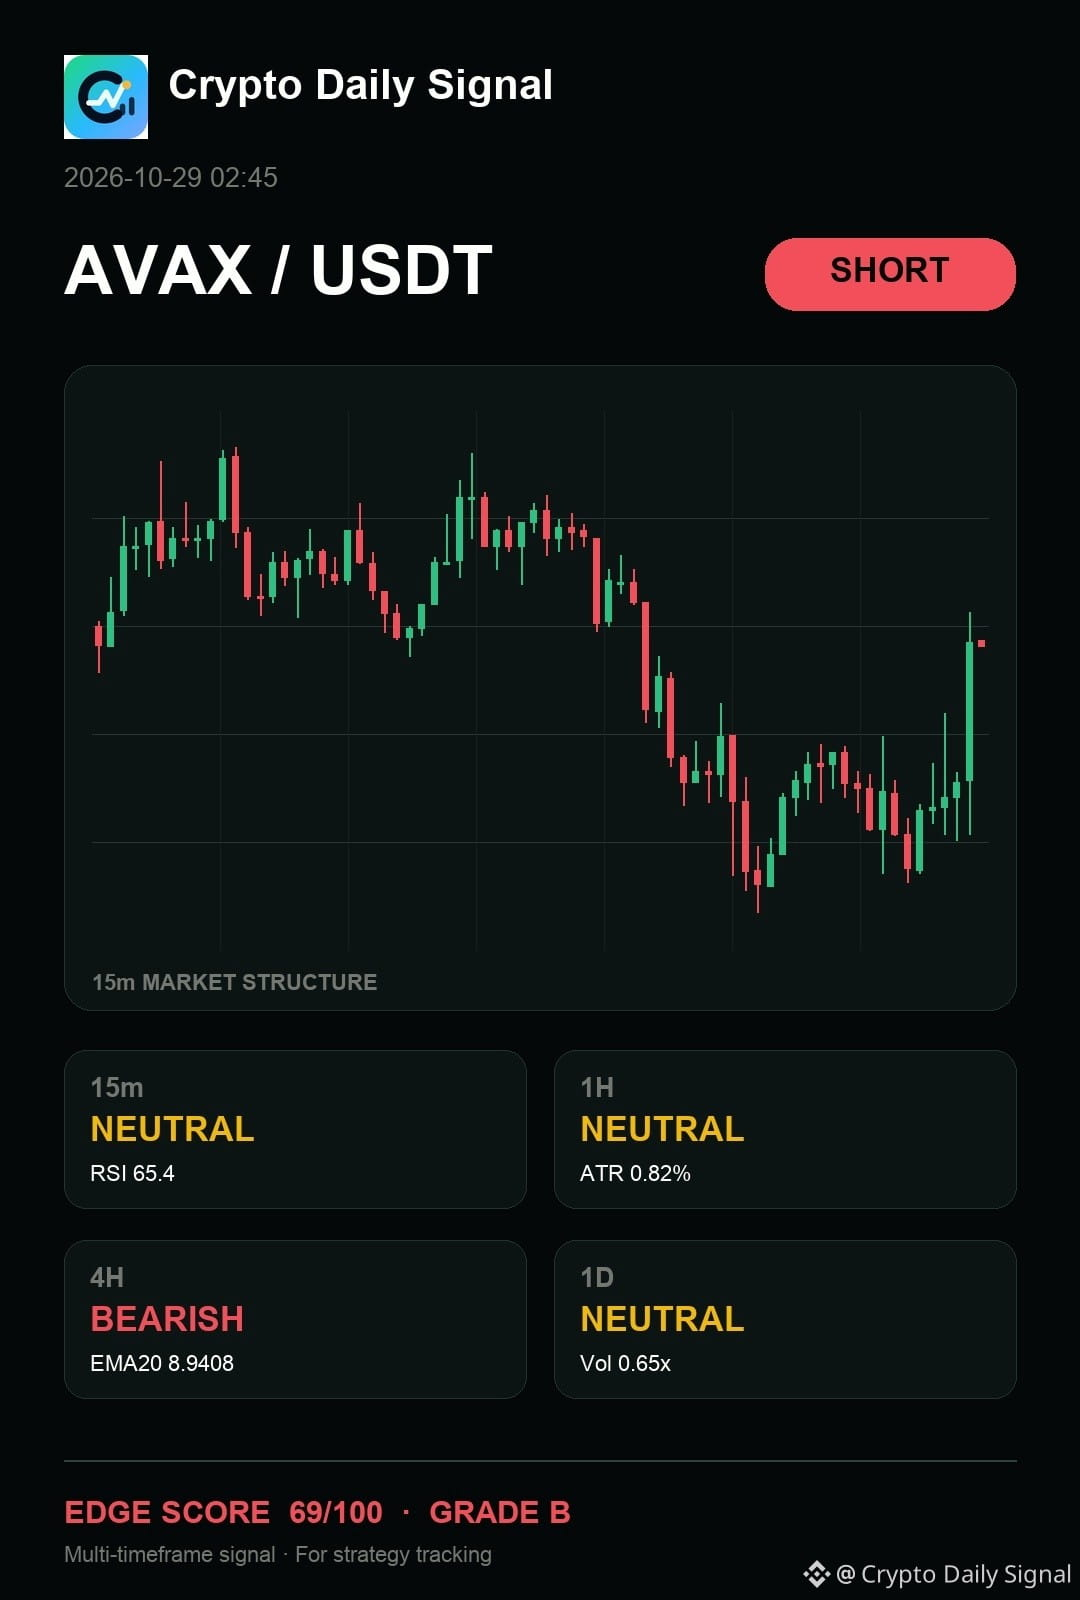
$AVAX — look, my read is simple: it is a patience trade on the short side. The setup remains bearish as the price hangs below a visible descending line, even while some short-term volume suggests weakness. Confirmation for the short narrative would come from a definitive close below recent support. A strong move back above that area would call the thesis into question.
Levels — AVAXUSDT
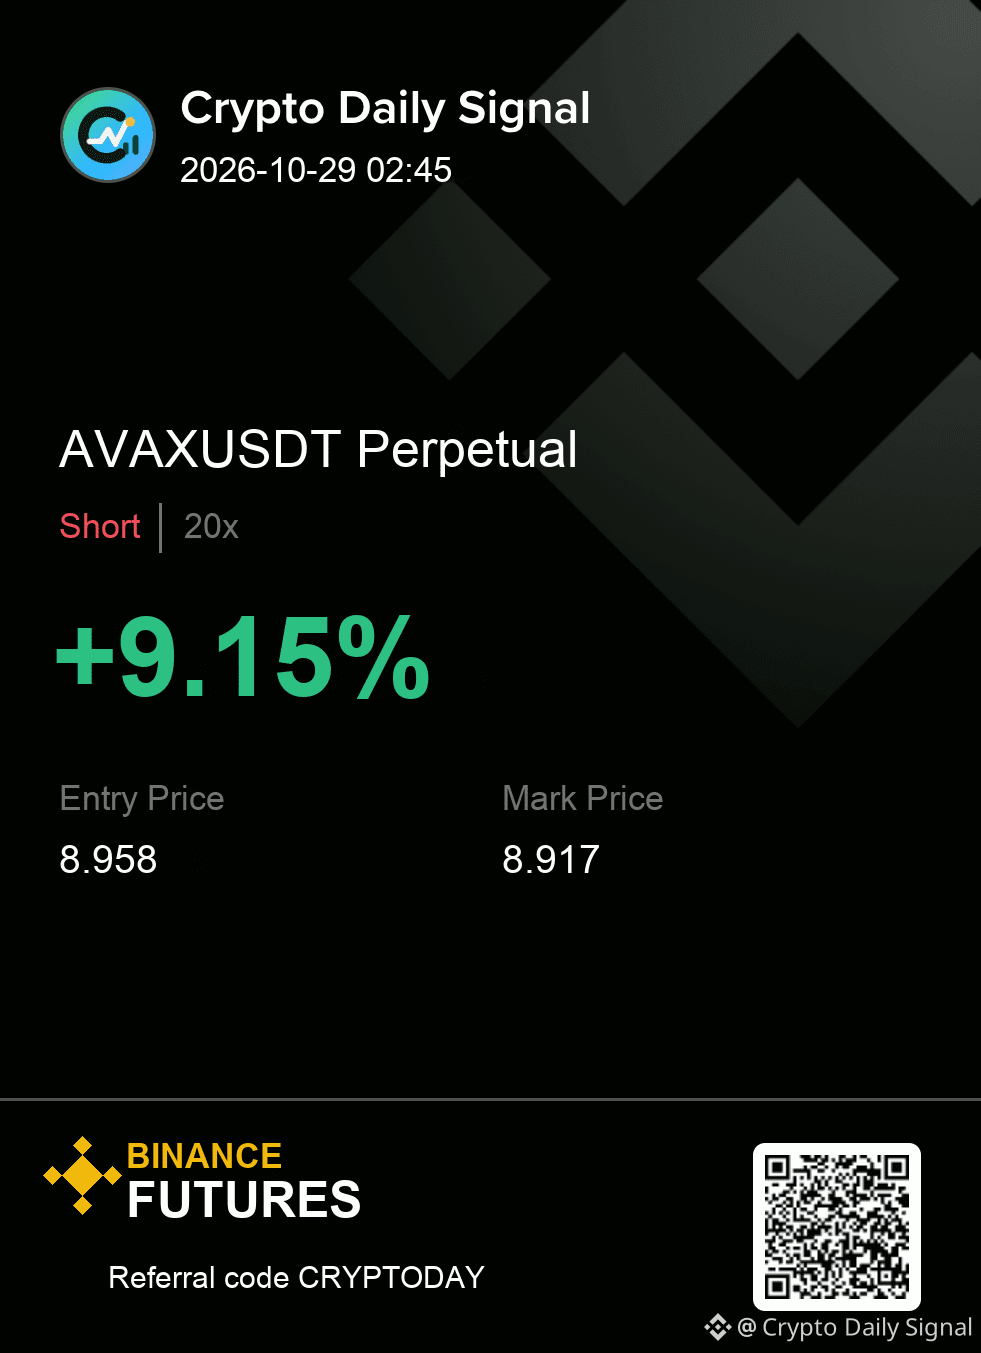
Zone: 8.949 - 8.967
Cut: 9.015
Scale: 8.901 | 8.856 | 8.799
Would you take it here, or wait for one more confirmation candle?
#MarketAnalysis
{future}(AVAXUSDT)
$AVAX — look, my read is simple: it is a patience trade on the short side. The setup remains bearish as the price hangs below a visible descending line, even while some short-term volume suggests weakness. Confirmation for the short narrative would come from a definitive close below recent support. A strong move back above that area would call the thesis into question.
Levels — AVAXUSDT
Zone: 8.949 - 8.967
Cut: 9.015
Scale: 8.901 | 8.856 | 8.799
Would you take it here, or wait for one more confirmation candle?
#MarketAnalysis
Levels — AVAXUSDT
Zone: 8.949 - 8.967
Cut: 9.015
Scale: 8.901 | 8.856 | 8.799
Would you take it here, or wait for one more confirmation candle?
#MarketAnalysis
13
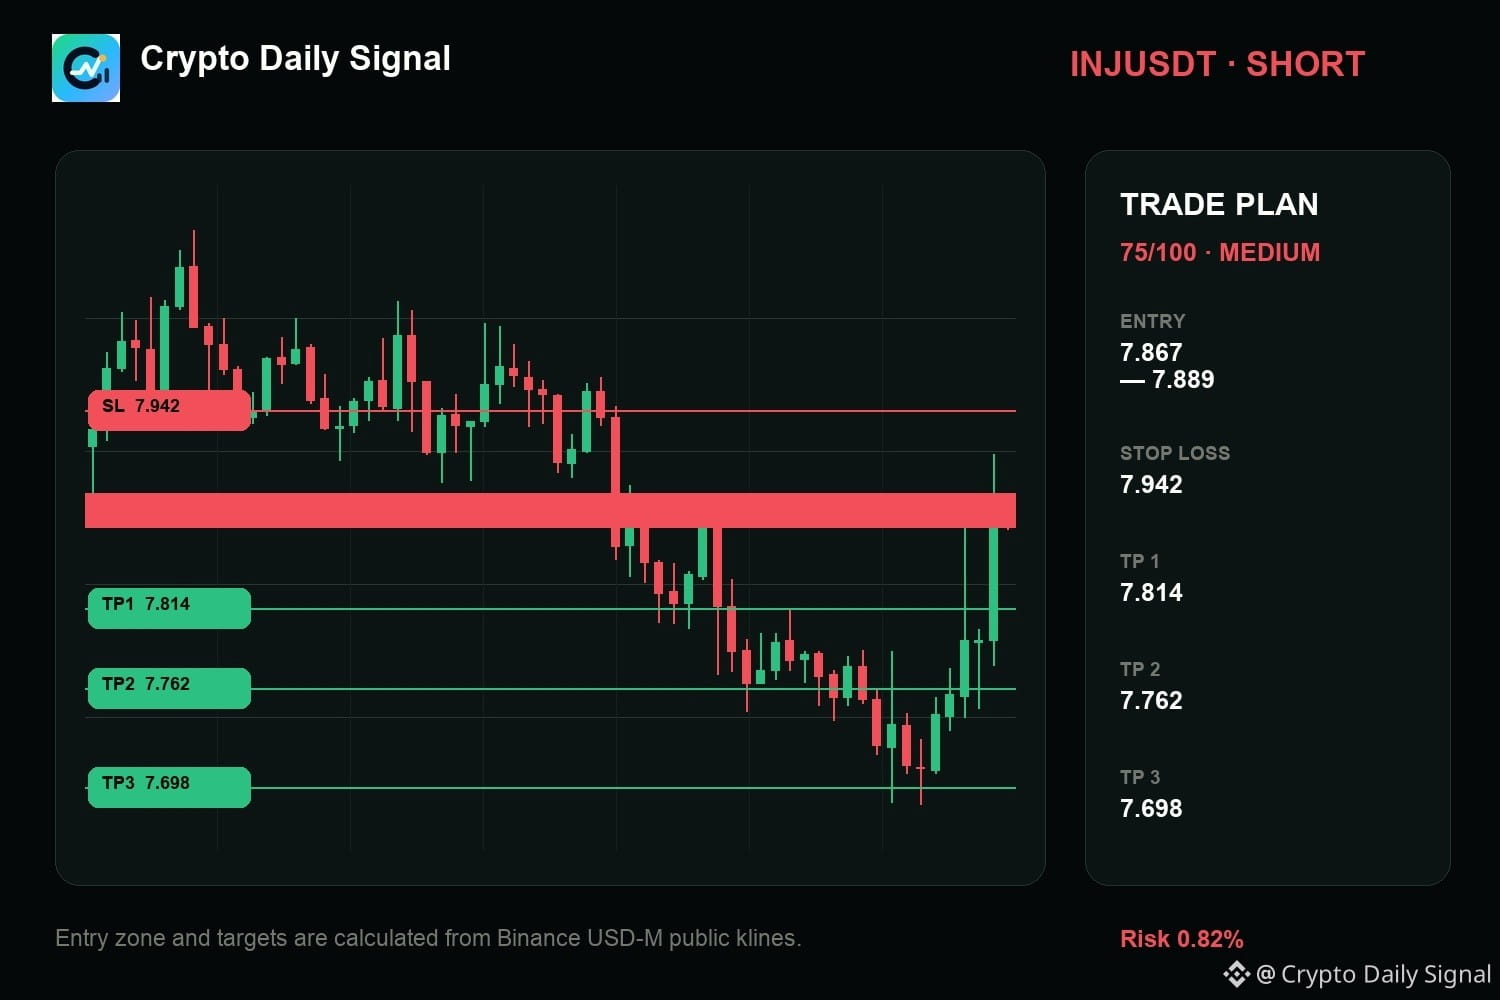
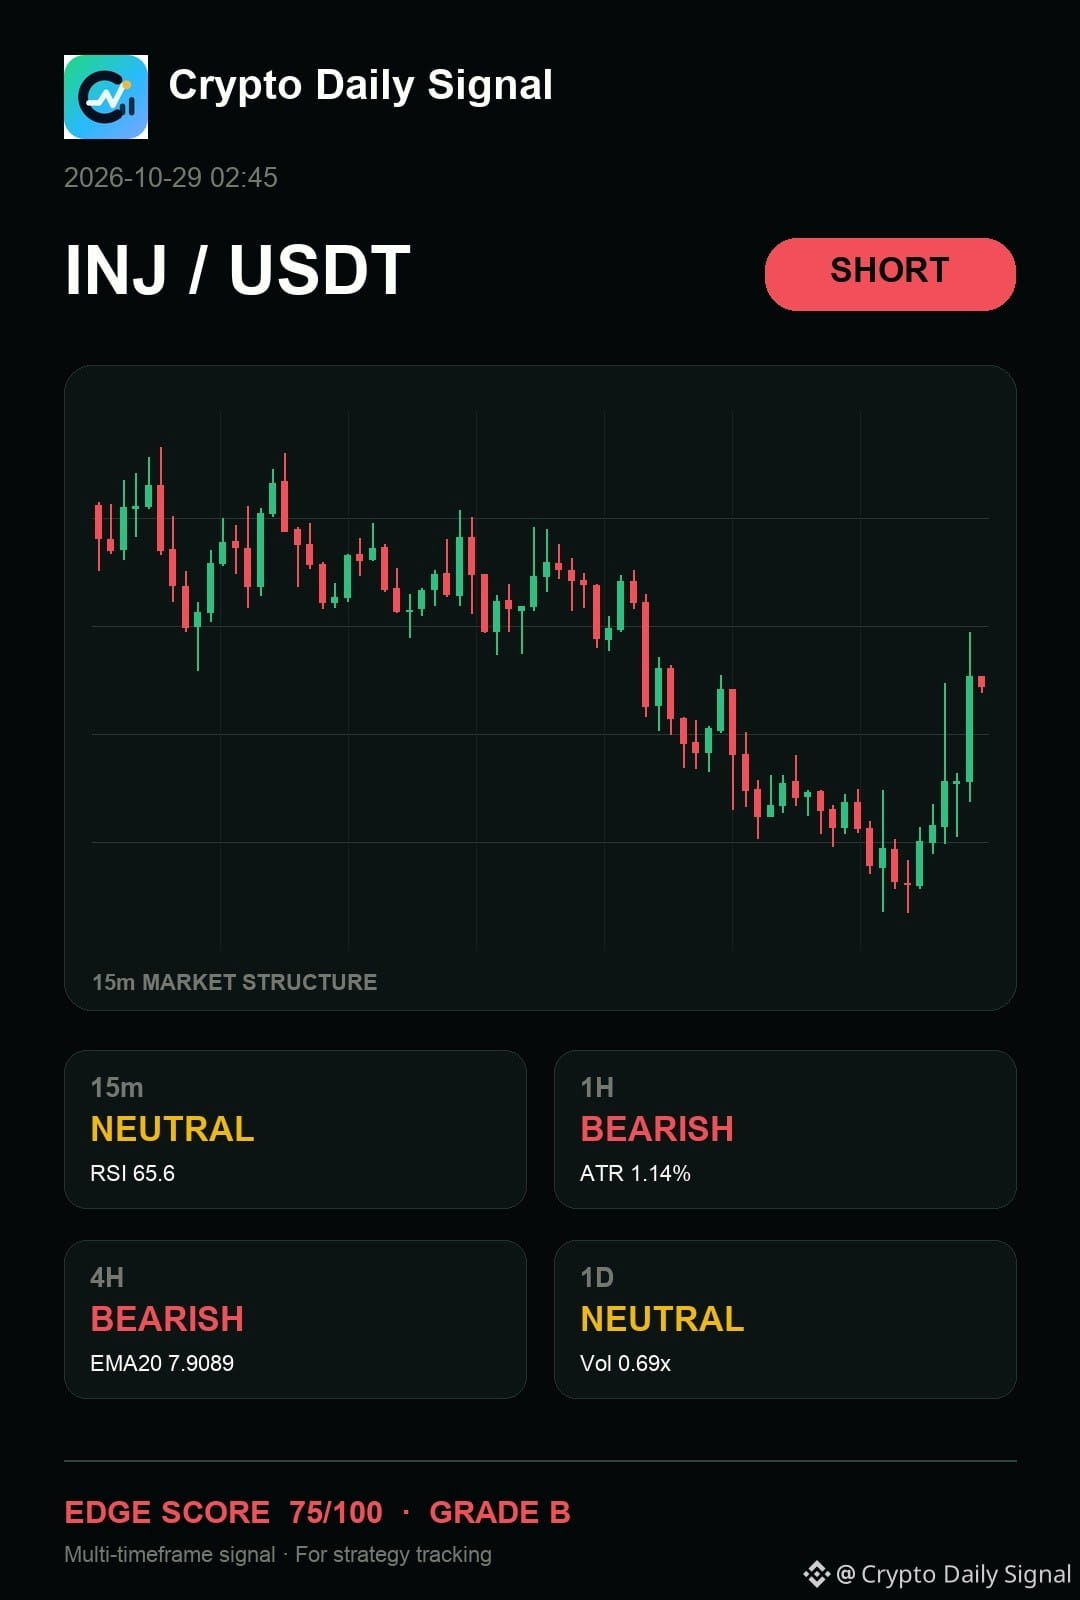
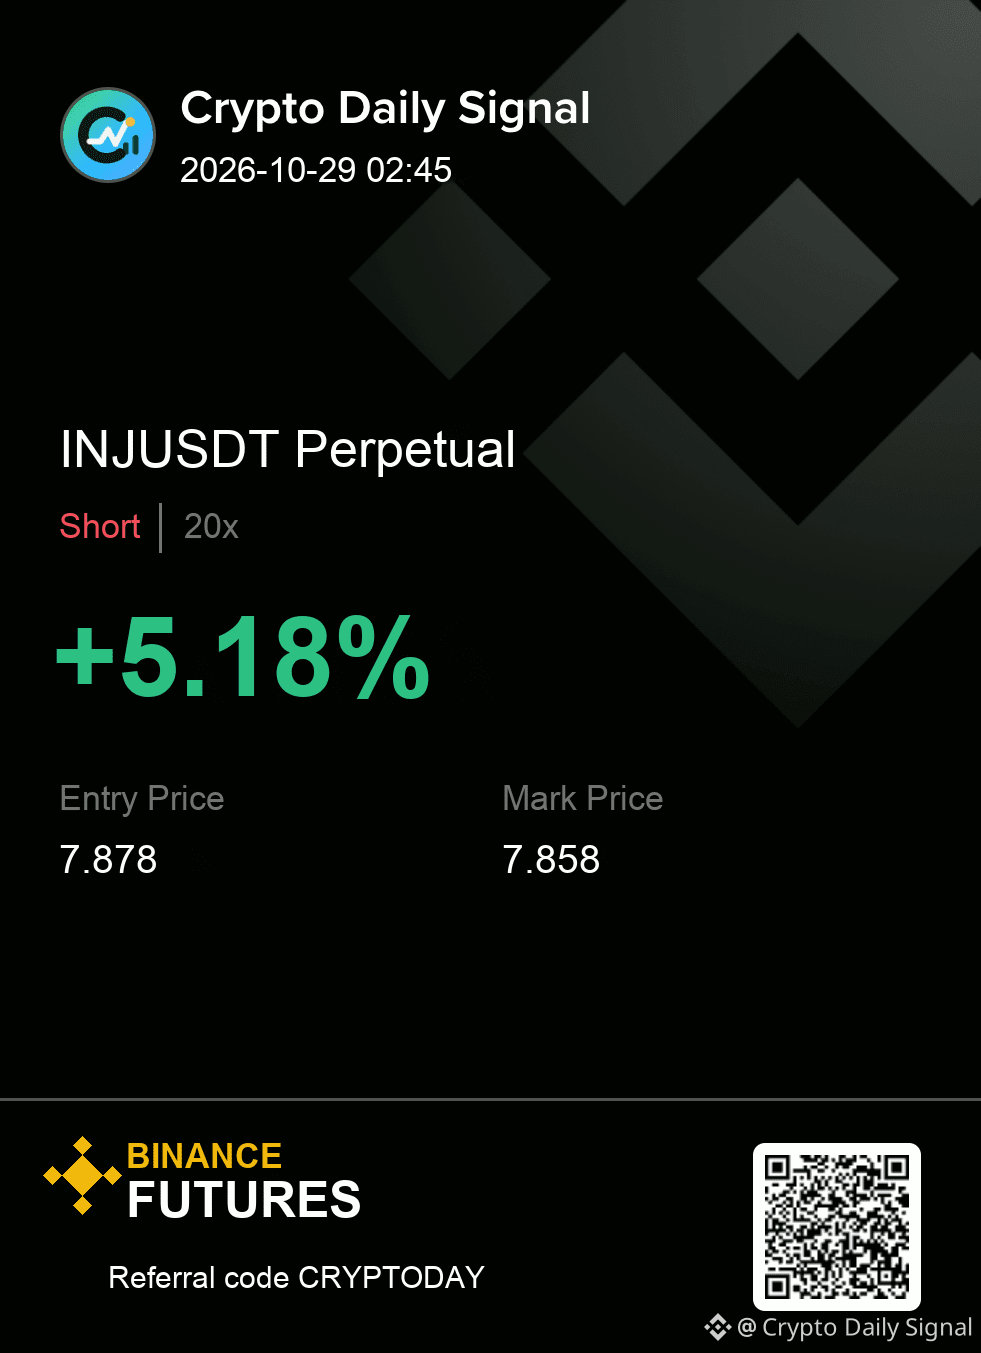
$INJ — honestly, the chart still says it is a patience trade on the short side, requiring a clean break above the recent range high for bulls to have a strong argument. The hourly view is clearly bearish, reinforced by lower highs developing as it trades near the bottom of the recent trading area. A definitive close below that range floor confirms the downside bias.
Execution is simple here: respect the zone and respect the cut.
SHORT plan for INJUSDT
7.867 - 7.889 entry | 7.942 stop
7.814 → 7.762 → 7.698
#MarketAnalysis
{future}(INJUSDT)
$INJ — honestly, the chart still says it is a patience trade on the short side, requiring a clean break above the recent range high for bulls to have a strong argument. The hourly view is clearly bearish, reinforced by lower highs developing as it trades near the bottom of the recent trading area. A definitive close below that range floor confirms the downside bias.
Execution is simple here: respect the zone and respect the cut.
SHORT plan for INJUSDT
7.867 - 7.889 entry | 7.942 stop
7.814 → 7.762 → 7.698
#MarketAnalysis
Execution is simple here: respect the zone and respect the cut.
SHORT plan for INJUSDT
7.867 - 7.889 entry | 7.942 stop
7.814 → 7.762 → 7.698
#MarketAnalysis
11

·
--
🚨 $AIN — LONG vs SHORT Setup
$AIN has surged +142% in 24H, but the latest chart shows a sharp pullback from $0.158 toward $0.117. Volatility is extremely high — don't chase the pump!
📊 Key levels from the screenshots:
- 🟢 LONG zone: $0.110–$0.117, only if price stabilizes and reclaims $0.123–$0.125.
- 🎯 Long targets: $0.130 → $0.140 → $0.150.
- 🔴 SHORT setup: Rejection around $0.123–$0.130, followed by a confirmed break below $0.110.
- 🎯 Short targets: $0.100 → $0.088.
- 🛑 Invalidation: For shorts, a strong reclaim above $0.130 weakens the setup. For longs, a breakdown below $0.109 weakens the bounce thesis.
🔎 What the data says:
• Heavy overhead liquidity sits around $0.145–$0.160.
• Funding is highly positive in the screenshot, suggesting crowded-long risk.
• Price is falling sharply, but oversold readings can still trigger violent bounces.
⚠️ My view: Neither side is confirmed yet. Wait for a retest and candle confirmation. Use a strict stop-loss and low leverage — liquidation levels are not guaranteed price targets.
#AIN #HarshOnChain #CryptoTrading #Futures #MarketAnalysis
1
421

⚡ $BTC SWEEPS INTO DEMAND ZONE AS BUYERS STEP UP FOR THE NEXT LEG UP! 🚀
Entry: 78279.8 - 78351.0 ⚡
Target: 78999.2 🚀
Stop Loss: 77973.5 ⚠️
📌 Price hit the exact demand block I mapped out earlier, absorbing sell-side pressure cleanly as institutional bids take over. 🌊 With liquidity swept right at local support, momentum is building toward higher expansion levels with tight, defined risk.
💡 Order flow shows clear seller exhaustion near this key structural pivot, setting up a sharp risk-to-reward window. 💬 Are you taking the bid inside this demand zone, or waiting for full confirmation above resistance? 👇
⚠️ Not financial advice. Always manage your risk. 🛡️
🏷️ #BTC #LongSetup #Crypto #MarketAnalysis
🔥 💎
6

💥 $BTC PRESSING INTO THE CRITICAL $83,000 MAKE-OR-BREAK LIQUIDITY WALL! ⚡
Target: 90,000 🚀
Stop Loss: 75,674 ⚠️
$BTC closed out August with a fierce 25% expansion, tearing back above $80,000 on the back of falling yields and dovish Federal Reserve commentary. 📊 Institutional momentum reclaimed key moving averages, but price action has now slammed directly into a heavy supply zone at $82,000–$83,000.
A clean, decisive breakout opens the runway toward $90,000, yet historical September seasonality demands tactical patience. 💡 If sellers defend this resistance, a swift retest of underlying support at $75,674 or even $71,781 remains on the table to sweep weak hands.
💬 Are you positioning for an immediate breakout push past $83,000, or waiting for a dip to buy support lower? 👇
⚠️ Not financial advice. Always manage your risk. 🛡️
🏷️ #BTC #Crypto #MarketAnalysis #Trading
🔥 ⚡
5

·
--
$BTC
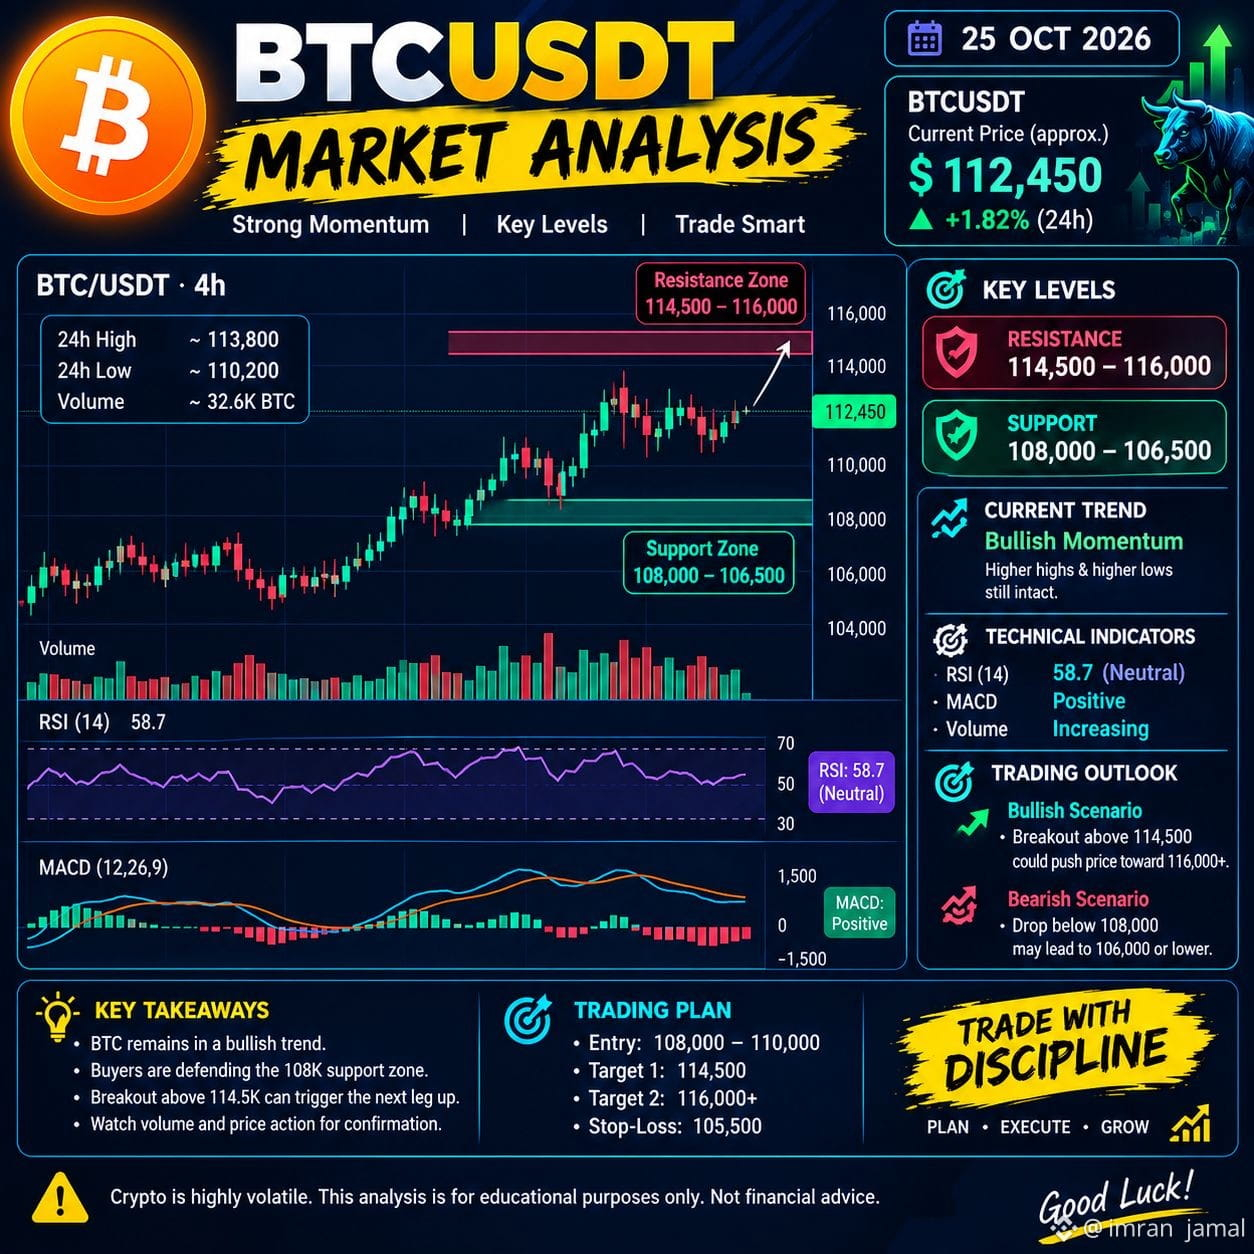
📊 BTC Market Analysis Today | October 25, 2026
₿ Bitcoin (BTC/USDT): Short-Term Bearish Pressure ⚠️
Bitcoin is trading around $80,700–$80,900 after recovering from a weekend sell-off. Short-term momentum remains weak, while the broader trend needs further confirmation. �
Coinotag +1
🔑 Key Technical Levels
Current price: ~$80,800
Resistance 1: $81,467
Resistance 2: $82,400
Support 1: $80,100
Support 2: $78,100 �
Coinotag
📈 Bullish Scenario
If BTC breaks above $81,467 and holds, a move toward $82,400 could follow.
📉 Bearish Scenario
If BTC breaks below $80,100, further downside toward $78,100 is possible.
🎯 Trading Strategy
Buy: Only after a confirmed breakout and successful retest.
Sell: Watch for a confirmed breakdown below support.
Risk management: Always use a stop-loss and avoid excessive leverage.
📰 Fundamental Factor: Traders are watching the US Federal Reserve meeting scheduled for October 27–28, which could influence Bitcoin's volatility. �
Investing.com India
⚠️ Conclusion: BTC is at a critical
#BTC☀️ #MarketAnalysis #TechnicalAnalysiss
{spot}(BTCUSDT)
$BTC
📊 BTC Market Analysis Today | October 25, 2026
₿ Bitcoin (BTC/USDT): Short-Term Bearish Pressure ⚠️
Bitcoin is trading around $80,700–$80,900 after recovering from a weekend sell-off. Short-term momentum remains weak, while the broader trend needs further confirmation. �
Coinotag +1
🔑 Key Technical Levels
Current price: ~$80,800
Resistance 1: $81,467
Resistance 2: $82,400
Support 1: $80,100
Support 2: $78,100 �
Coinotag
📈 Bullish Scenario
If BTC breaks above $81,467 and holds, a move toward $82,400 could follow.
📉 Bearish Scenario
If BTC breaks below $80,100, further downside toward $78,100 is possible.
🎯 Trading Strategy
Buy: Only after a confirmed breakout and successful retest.
Sell: Watch for a confirmed breakdown below support.
Risk management: Always use a stop-loss and avoid excessive leverage.
📰 Fundamental Factor: Traders are watching the US Federal Reserve meeting scheduled for October 27–28, which could influence Bitcoin's volatility. �
Investing.com India
⚠️ Conclusion: BTC is at a critical
#BTC☀️ #MarketAnalysis #TechnicalAnalysiss
39
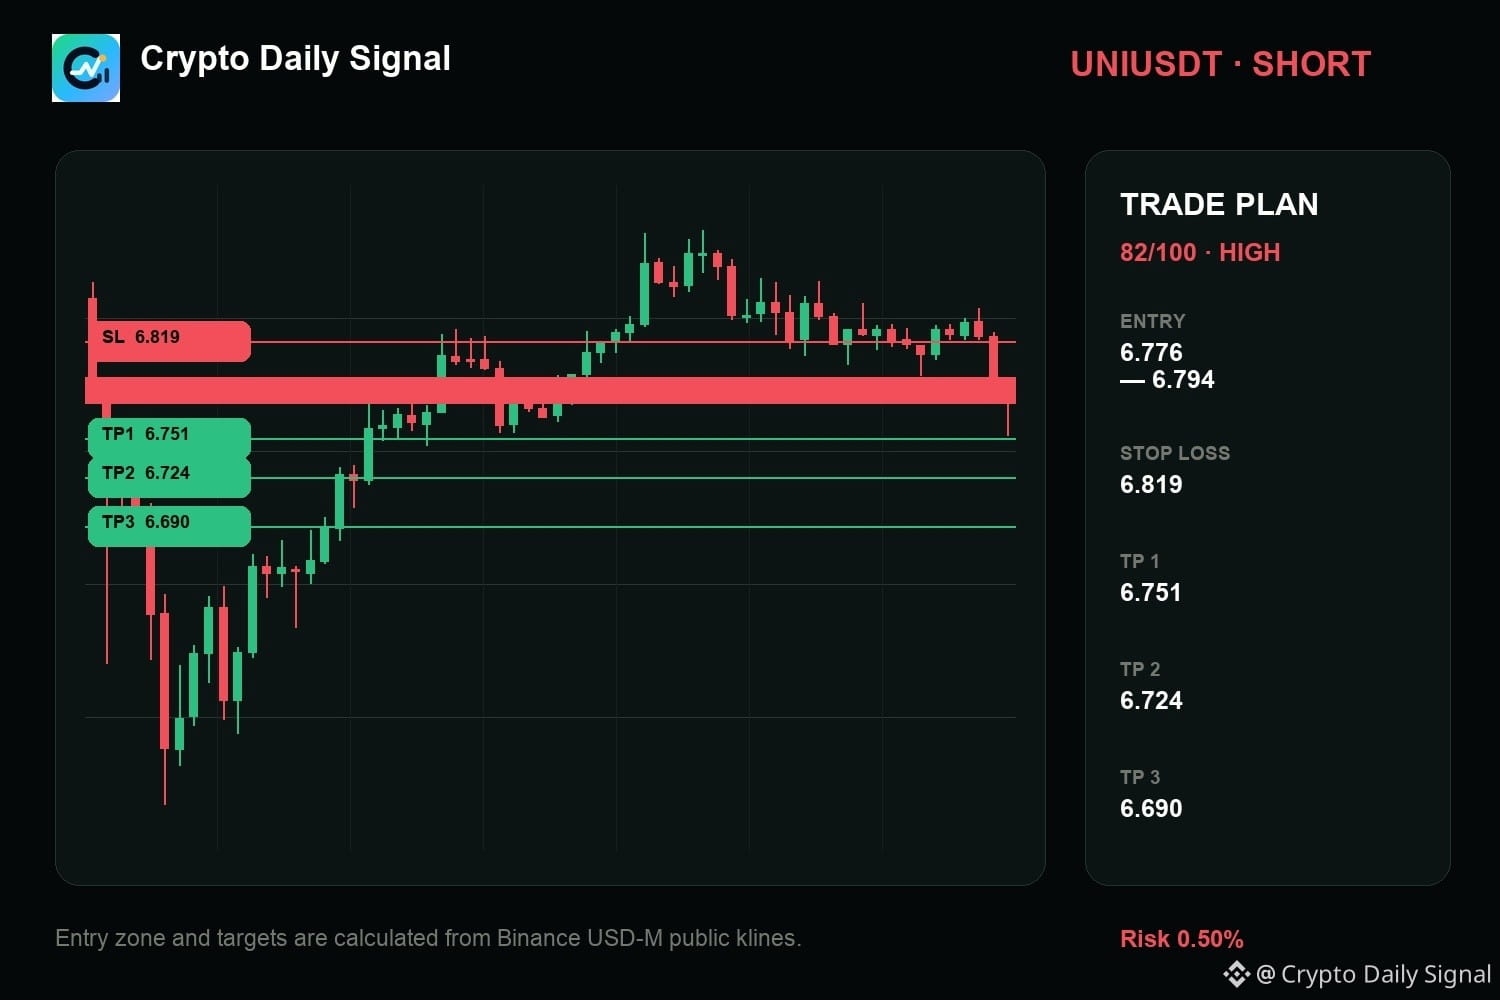
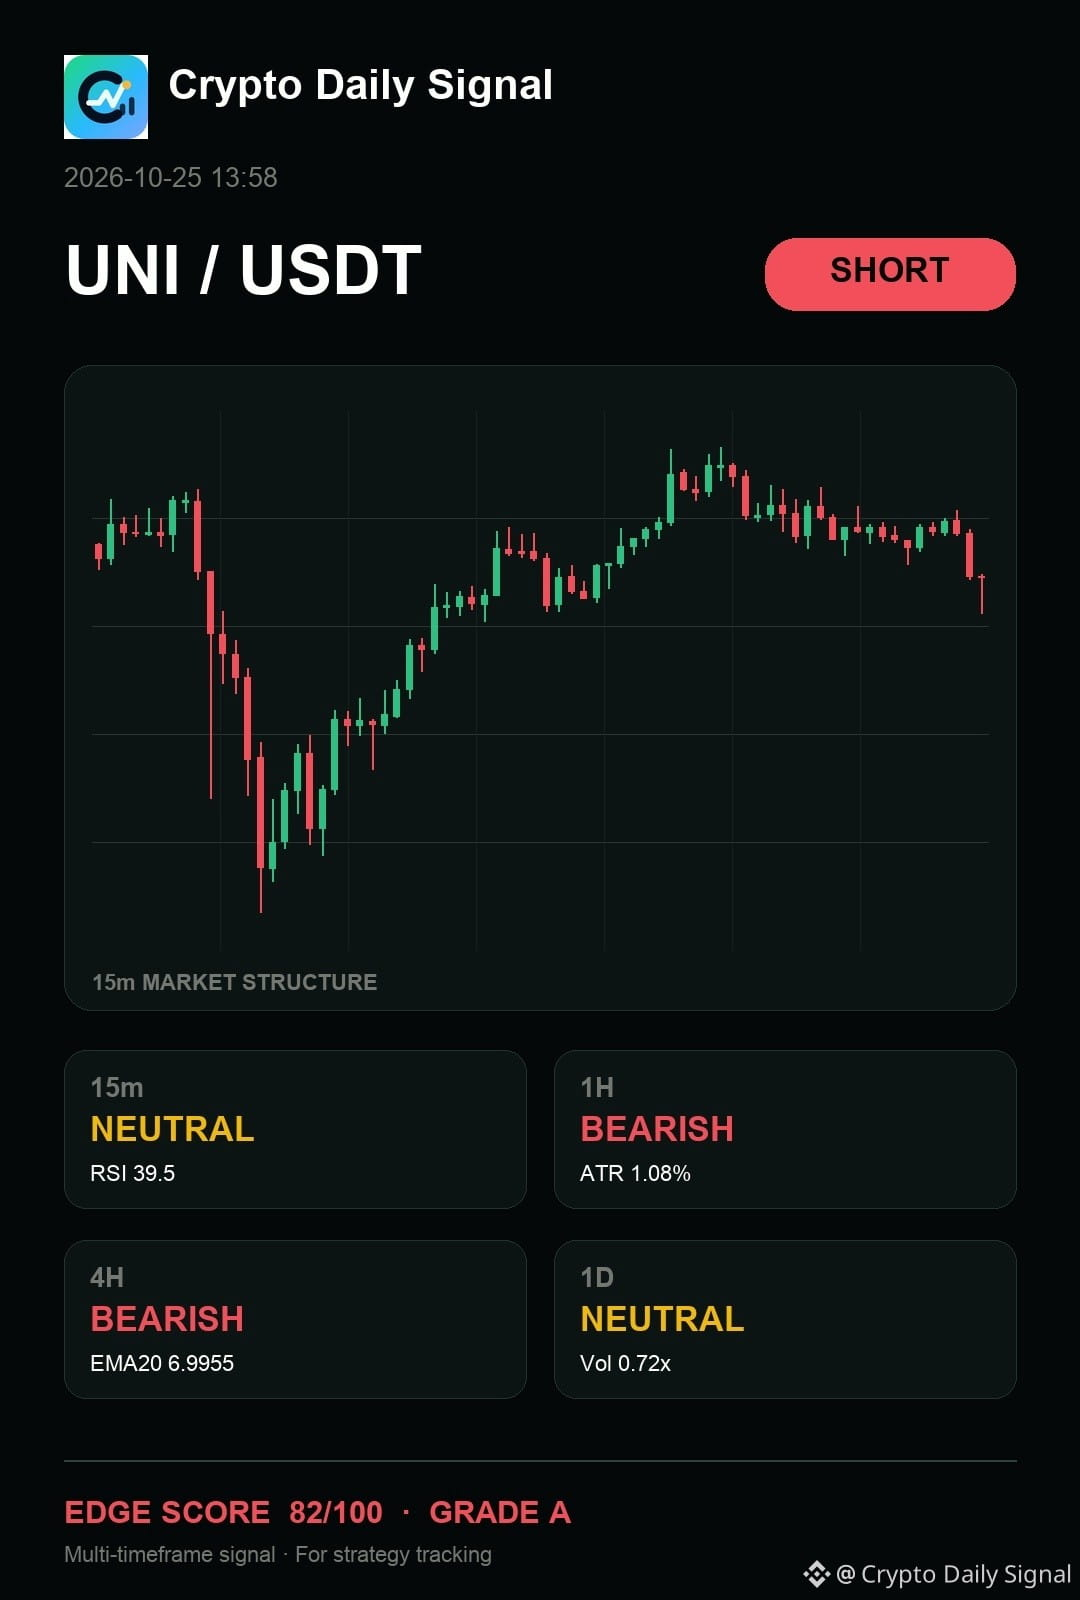
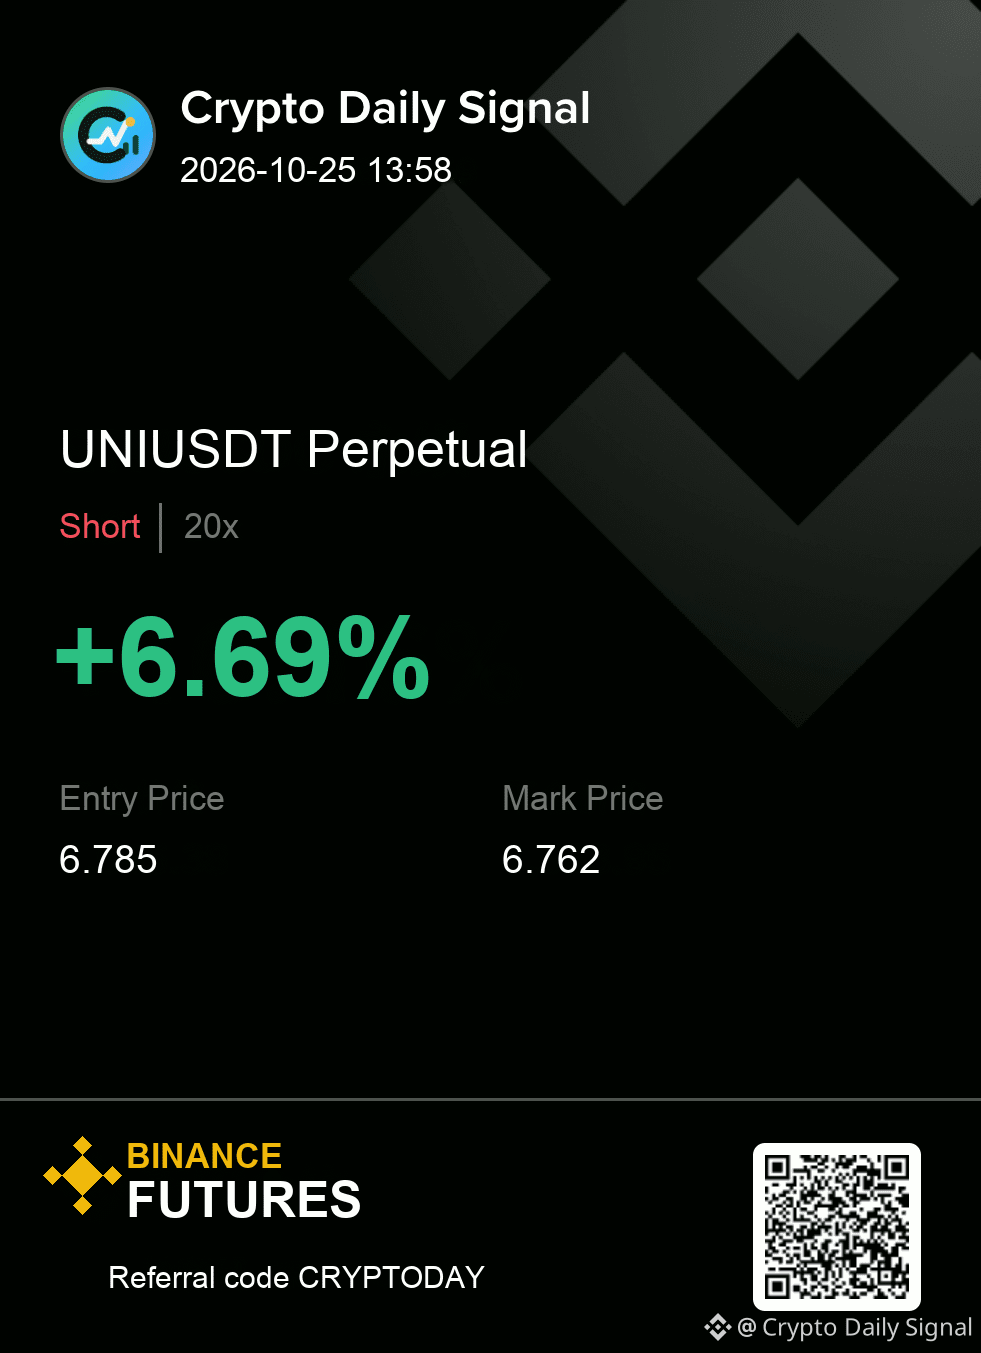
$UNI keeps me focused on the downside response as the tight range shows clear rejection at the upper boundary. The higher timeframes suggest bearish pressure despite the daily backdrop remaining neutral. For this to hold as a short, I need to see a decisive close below the range's low. A strong push over the recent local high would change my mind.
Worth tracking from here, or does the range still need more time?
UNIUSDT SHORT map
Entry → 6.776 - 6.794
SL → 6.819
TP → 6.751 · 6.724 · 6.690
#MarketAnalysis
{future}(UNIUSDT)
$UNI keeps me focused on the downside response as the tight range shows clear rejection at the upper boundary. The higher timeframes suggest bearish pressure despite the daily backdrop remaining neutral. For this to hold as a short, I need to see a decisive close below the range's low. A strong push over the recent local high would change my mind.
Worth tracking from here, or does the range still need more time?
UNIUSDT SHORT map
Entry → 6.776 - 6.794
SL → 6.819
TP → 6.751 · 6.724 · 6.690
#MarketAnalysis
Worth tracking from here, or does the range still need more time?
UNIUSDT SHORT map
Entry → 6.776 - 6.794
SL → 6.819
TP → 6.751 · 6.724 · 6.690
#MarketAnalysis
10

·
--
$BTC⚠️ CRITICAL MARKET UPDATE: Bitcoin Hits 5-Week Low Amid Historic Binance Incident! 📉
The crypto market is facing massive volatility today. Bitcoin ($BTC) has plummeted to a 5-week low, trading around the $77,300 mark.
This sharp decline triggered a massive liquidation cascade, wiping out over $1.49 Billion in long positions across the derivative markets.
🔍 What You Need to Know:
• The Trigger: Market panic following the recent $6.3 Billion Binance security incident.
• The Good News: Binance has confirmed user funds are 100% SAFE (protected by SAFU), and $3 Billion in assets are already frozen on-chain.
• Key Levels: $76,600 is the crucial support to watch. If this holds, a rebound is highly likely.
💡 My Strategy: Do not panic sell. Institutional backing through US Spot Bitcoin ETFs remains strong. Historically, these high-panic events turn out to be the ultimate 'Buy the Dip' opportunities for patient traders.
👇 What is your move right now?
Are you panic selling, holding tight, or buying the dip? Let's discuss in the comments! 💬
#Bitcoin #BTC #BinanceSquare #CryptoCrash #MarketAnalysis
89


Deciphering the Momentum Behind $FIL
Does a move above baseline volume during a period of upward hourly direction signal a genuine shift in demand? The current behavior for $FIL presents a classic puzzle for market participants. The primary clue is the elevated participation as the price trends higher within its recorded range. One mechanism to explain this is the absorption of supply. When volume stays high while prices move up, it often suggests that buyers are aggressively meeting the sell orders of those exiting old positions. This creates a foundation for a potential trend.
However, an alternative reading suggests this activity could be a local exhaustion point. In this scenario, the high volume represents a final burst of buying interest before the market runs out of fresh capital. This would mean the move lacks the structural support to clear the daily resistance of 0.8589. Instead of a healthy absorption, the activity might just be a brief flurry that leaves the asset vulnerable to a reversal.
To reassess these interpretations, one must watch the relationship between the price and the vwap. If $FIL holds above the daily vwap of 0.843944 even as volume settles, the absorption theory gains weight. Conversely, if the price drops below the support of 0.8264 while the RSI of 70.3118 remains neutral, it would weaken the bullish outlook. Such a breakdown would suggest that the high volume was not reflective of long-term conviction but rather a temporary spike in speculative activity. Monitoring the daily change of -5.9043 alongside these levels will help distinguish a true breakout from a trap.
Probabilistic market research, not a recommendation or guaranteed return.
Which observation would make you change your reading?
#FIL #MarketAnalysis
57

·
--
$PARTI 🔻 $PARTI SHORT SETUP 🔴 Sellers are stepping in — here's the setup. ⚡
$PARTI is facing significant downward pressure, reflecting an 11.07% decline over the last 24 hours as bearish momentum dominates the price action. With high liquidity and sustained selling volume, $PARTI is currently testing key support levels near its daily lows.
📊 24h: -11.07% | Vol: $29,163,487.89
📉 TRADE PLAN
🔹 Entry: 0.05060000
🛑 Stop Loss: 0.05280000
🎯 TP1: 0.04730000
🎯 TP2: 0.04550000
🎯 TP3: 0.04380000
⚖️ Risk:Reward (TP1): 1:1.50
🔔 Trigger: A confirmed hourly candle close below 0.05000000 would solidify the bearish continuation for $PARTI.
⚠️ Risk Note: High volatility is present; ensure strict position sizing as $PARTI is moving aggressively.
Wait for the market to validate this bearish trend before executing your orders.
Click below 👇🏻 to trade
$PARTI
Follow @T4_TZX for more updates...
#PARTI #CryptoTrading #MarketAnalysis #BinanceSquare
$PARTI 🔻 $PARTI SHORT SETUP 🔴 Sellers are stepping in — here's the setup. ⚡
$PARTI is facing significant downward pressure, reflecting an 11.07% decline over the last 24 hours as bearish momentum dominates the price action. With high liquidity and sustained selling volume, $PARTI is currently testing key support levels near its daily lows.
📊 24h: -11.07% | Vol: $29,163,487.89
📉 TRADE PLAN
🔹 Entry: 0.05060000
🛑 Stop Loss: 0.05280000
🎯 TP1: 0.04730000
🎯 TP2: 0.04550000
🎯 TP3: 0.04380000
⚖️ Risk:Reward (TP1): 1:1.50
🔔 Trigger: A confirmed hourly candle close below 0.05000000 would solidify the bearish continuation for $PARTI .
⚠️ Risk Note: High volatility is present; ensure strict position sizing as $PARTI is moving aggressively.
Wait for the market to validate this bearish trend before executing your orders.
Click below 👇🏻 to trade
$PARTI
Follow @T4_TZX for more updates...
#PARTI #CryptoTrading #MarketAnalysis #BinanceSquare
·
--
$AAVE 🔻 $AAVE SHORT SETUP 🔴 Sellers are stepping in — here's the setup. ⚡
$AAVE is showing significant downward momentum with a 7.03% decline over the last 24 hours, struggling to maintain higher support levels. With the current price hovering near $125.29, the bearish pressure remains dominant as volume reaches $43,497,017.08.
📊 24h: -7.03% | Vol: $43,497,017.08
📉 TRADE PLAN
🔹 Entry: 125.29
🛑 Stop Loss: 128.29
🎯 TP1: 120.79
🎯 TP2: 118.29
🎯 TP3: 116.29
⚖️ Risk:Reward (TP1): 1:1.50
🔔 Trigger: A clear breakdown and daily close below the $124.00 support level would confirm further bearish continuation for $AAVE.
⚠️ Risk Note: High volatility is present; ensure strict position sizing to manage potential downside risks.
Patience is key—wait for the market to confirm this trend before placing your trades.
Click below 👇🏻 to trade
$AAVE
Follow @T4_TZX for more updates...
#AAVE #CryptoTrading #MarketAnalysis #BinanceSquare
$AAVE 🔻 $AAVE SHORT SETUP 🔴 Sellers are stepping in — here's the setup. ⚡
$AAVE is showing significant downward momentum with a 7.03% decline over the last 24 hours, struggling to maintain higher support levels. With the current price hovering near $125.29, the bearish pressure remains dominant as volume reaches $43,497,017.08.
📊 24h: -7.03% | Vol: $43,497,017.08
📉 TRADE PLAN
🔹 Entry: 125.29
🛑 Stop Loss: 128.29
🎯 TP1: 120.79
🎯 TP2: 118.29
🎯 TP3: 116.29
⚖️ Risk:Reward (TP1): 1:1.50
🔔 Trigger: A clear breakdown and daily close below the $124.00 support level would confirm further bearish continuation for $AAVE .
⚠️ Risk Note: High volatility is present; ensure strict position sizing to manage potential downside risks.
Patience is key—wait for the market to confirm this trend before placing your trades.
Click below 👇🏻 to trade
$AAVE
Follow @T4_TZX for more updates...
#AAVE #CryptoTrading #MarketAnalysis #BinanceSquare
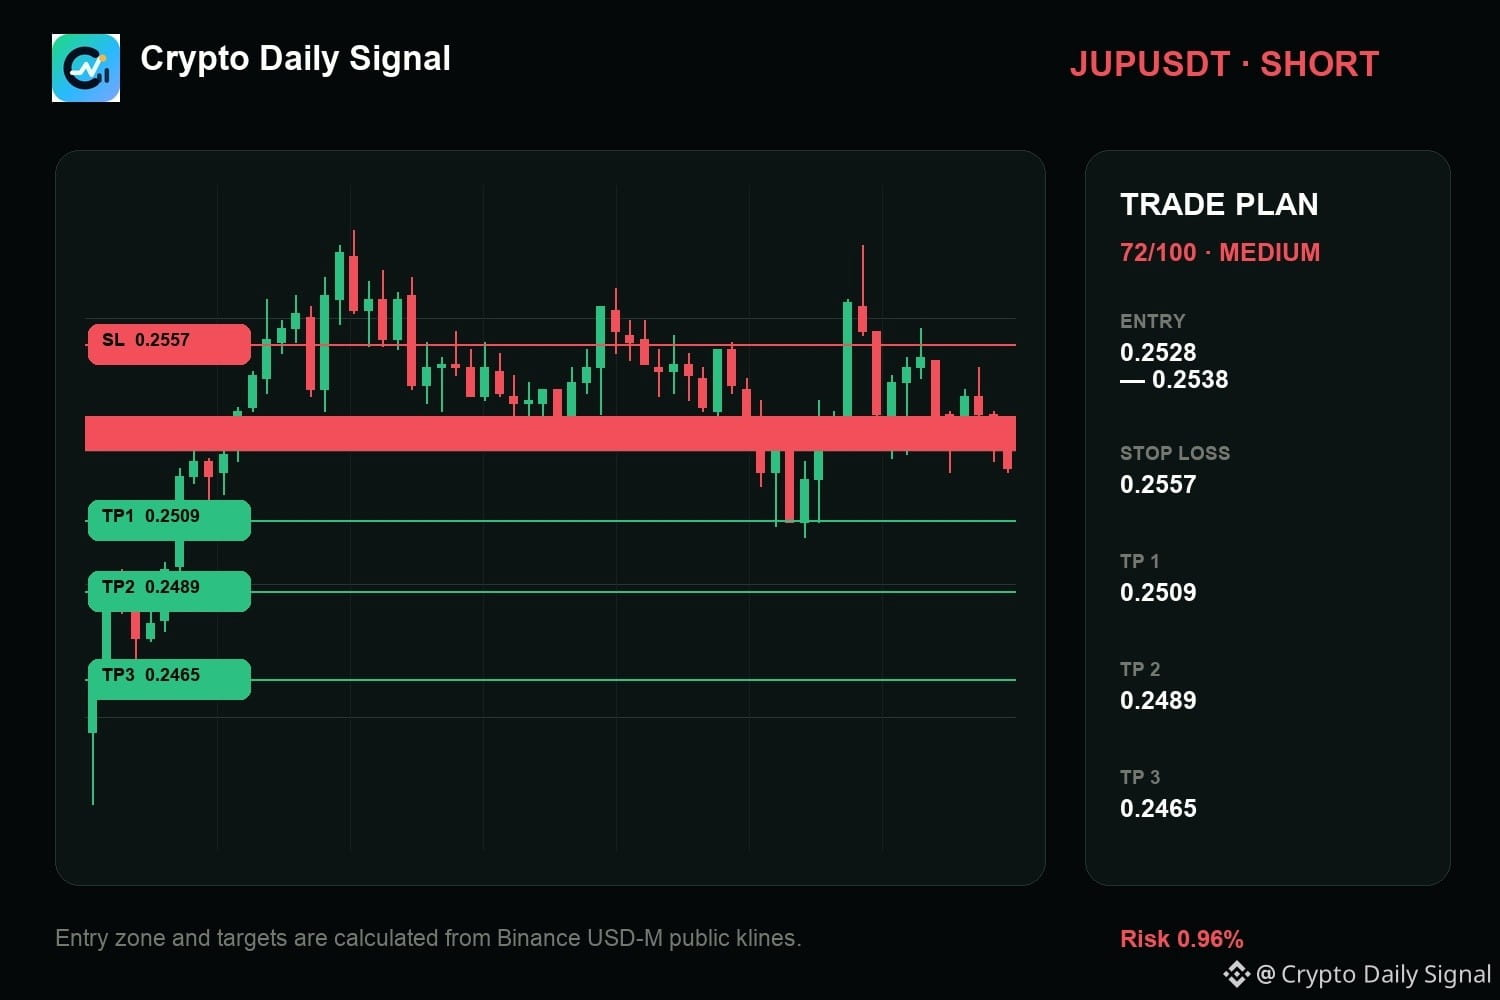
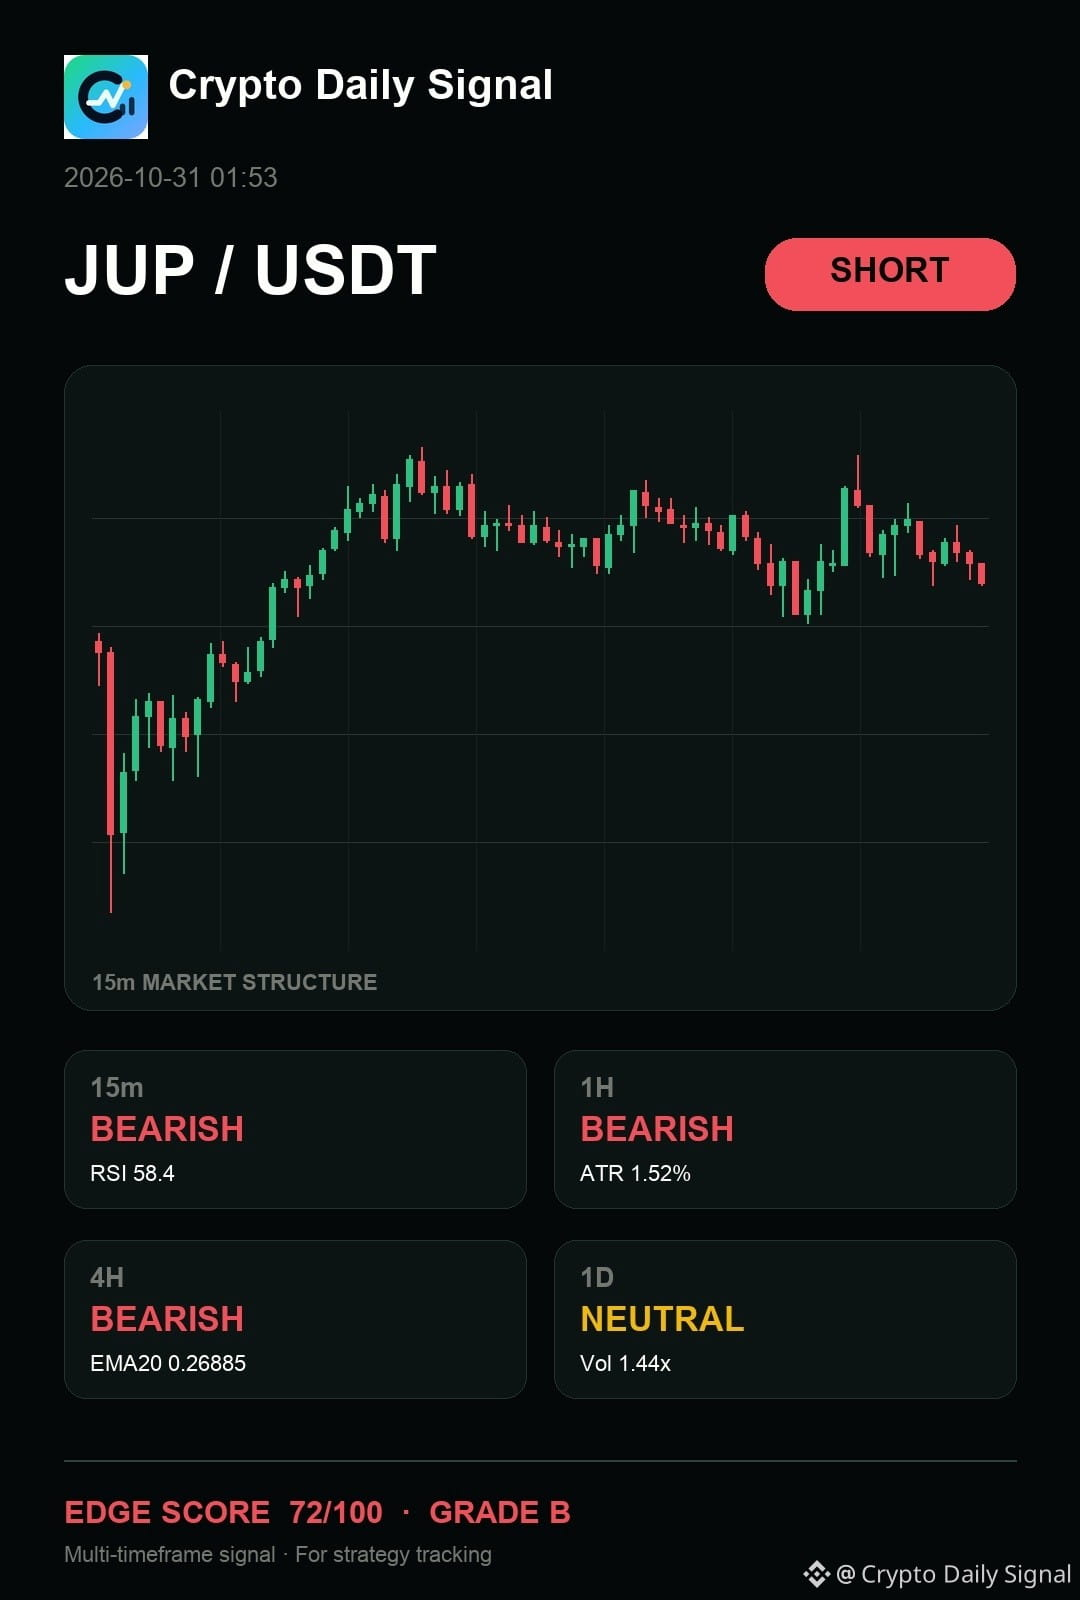
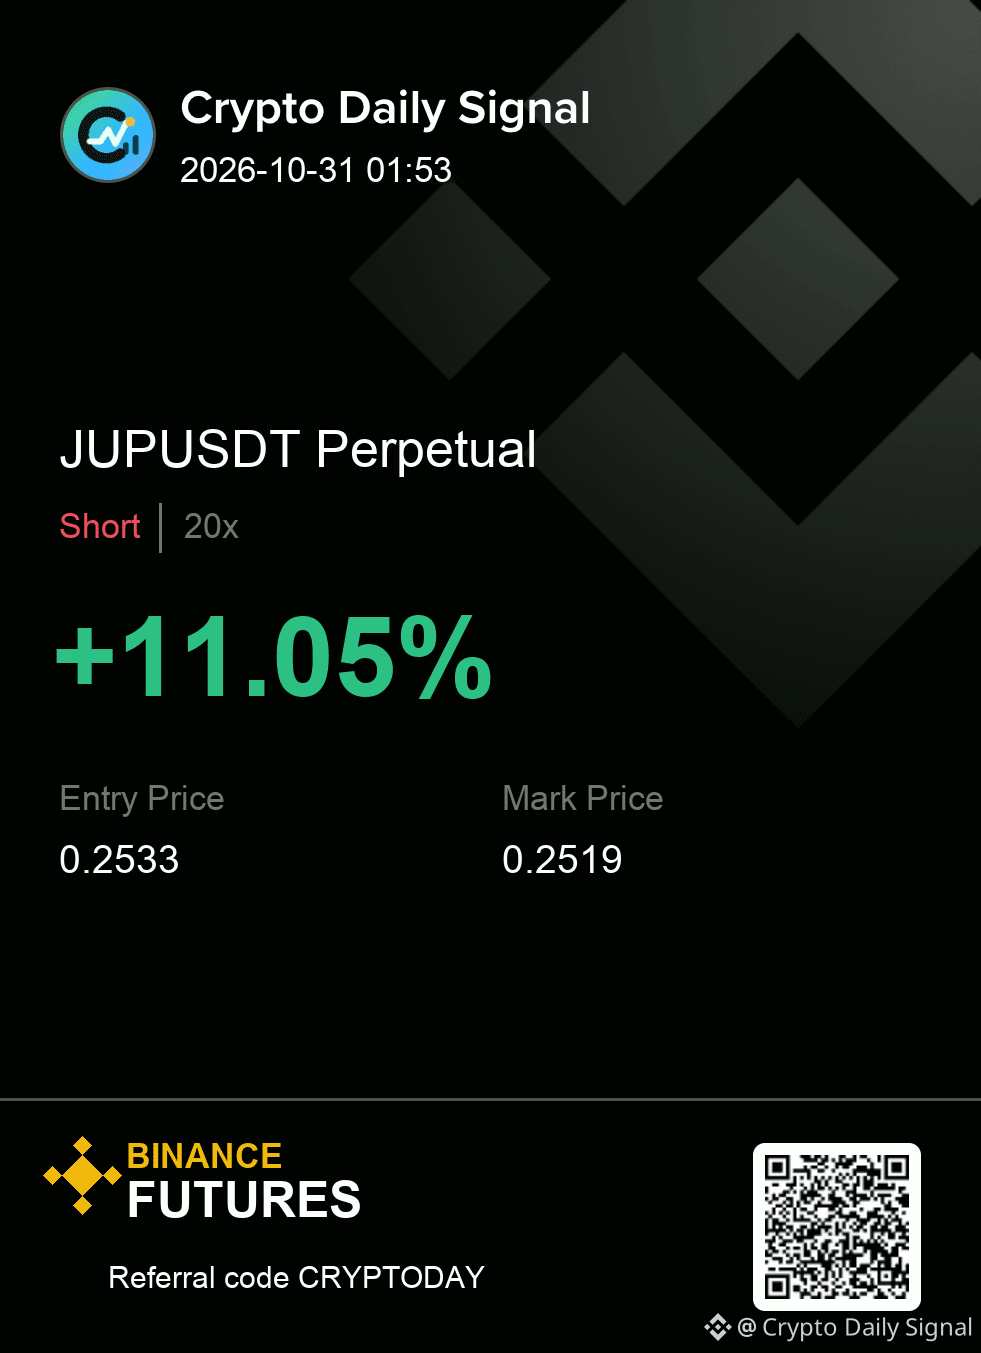
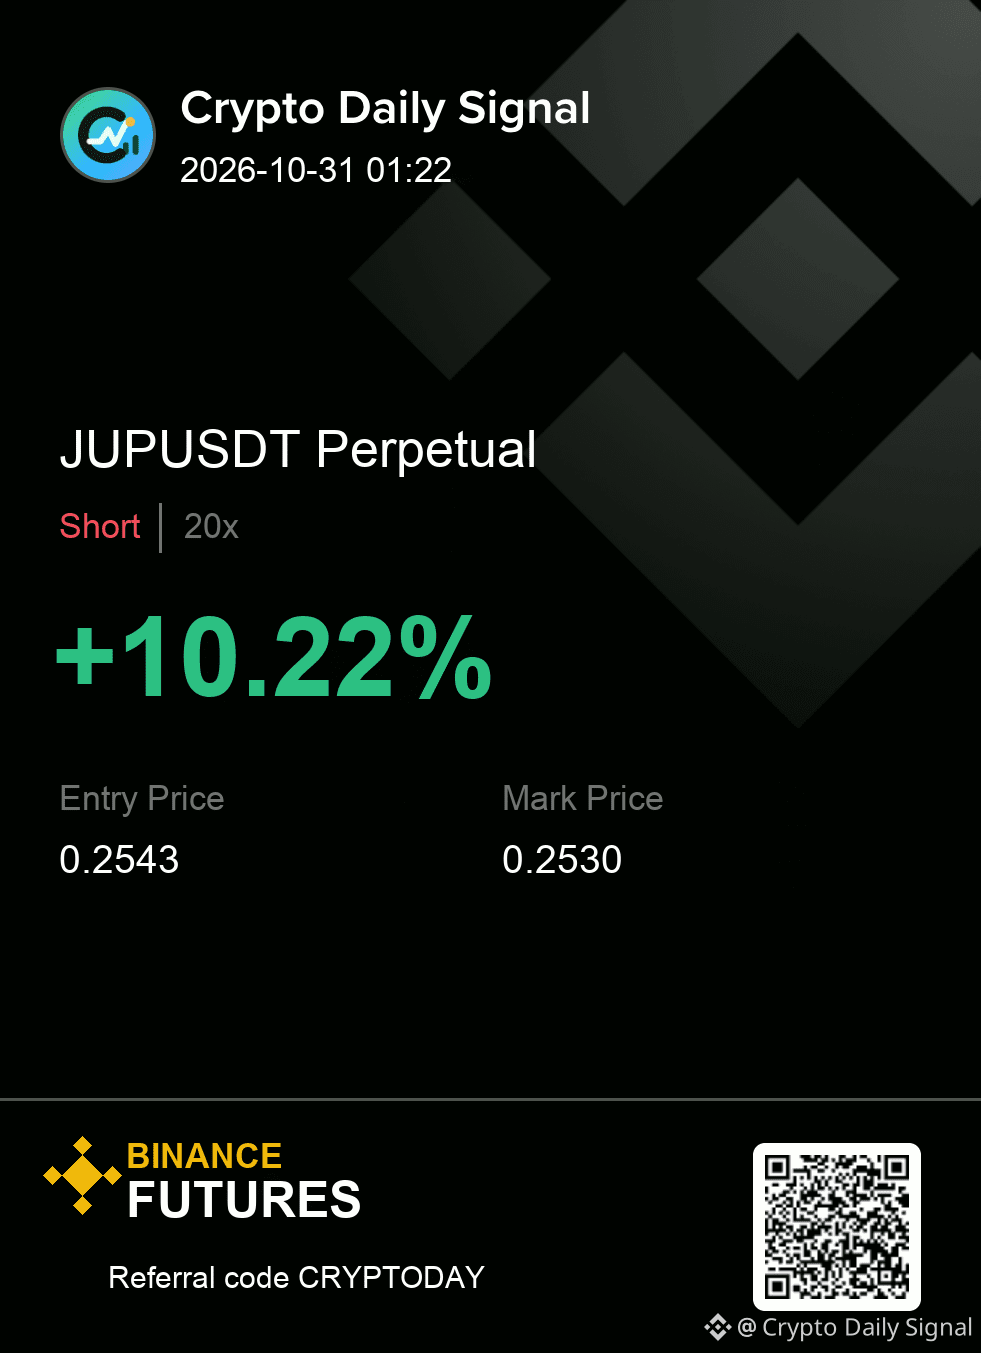
$JUP — real talk, I am treating it like it is one rejection away from a cleaner short after the recent price action showed a strong wick rejecting the upper limit. The four-hour and hourly trends suggest sellers are in control, despite the short-term momentum pushing upward. If the price drops below the immediate low from the last swing, the setup gains conviction. A firm close above the recent peak would weaken this bearish thesis considerably.
The levels matter more than the prediction. Size it accordingly.
JUPUSDT | SHORT
Entry 0.2528 - 0.2538
Invalidation 0.2557
Targets 0.2509 / 0.2489 / 0.2465
#MarketAnalysis
{future}(JUPUSDT)
$JUP — real talk, I am treating it like it is one rejection away from a cleaner short after the recent price action showed a strong wick rejecting the upper limit. The four-hour and hourly trends suggest sellers are in control, despite the short-term momentum pushing upward. If the price drops below the immediate low from the last swing, the setup gains conviction. A firm close above the recent peak would weaken this bearish thesis considerably.
The levels matter more than the prediction. Size it accordingly.
JUPUSDT | SHORT
Entry 0.2528 - 0.2538
Invalidation 0.2557
Targets 0.2509 / 0.2489 / 0.2465
#MarketAnalysis
The levels matter more than the prediction. Size it accordingly.
JUPUSDT | SHORT
Entry 0.2528 - 0.2538
Invalidation 0.2557
Targets 0.2509 / 0.2489 / 0.2465
#MarketAnalysis
1
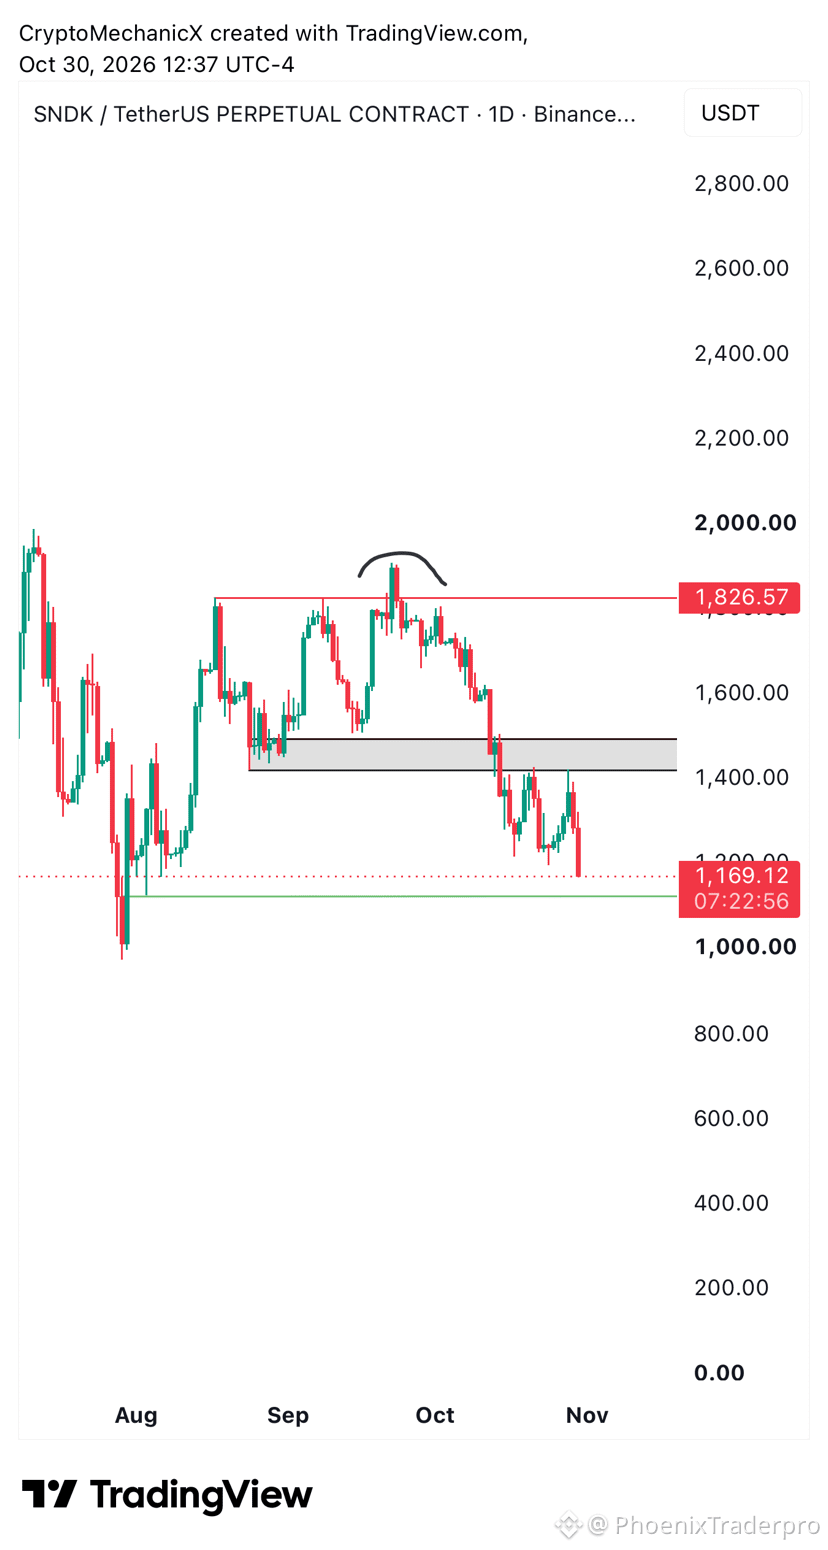
🚨 $SNDK BREAKS CRITICAL SUPPORT AS AI HYPE MEETS HARSH REALITY! 📉
📉 Sellers are carving straight through daily support levels on $SNDK with unrelenting downside pressure. Without a decisive structural reclaim above $1,500, attempting to catch this falling knife offers zero edge.
🔍 The technical breakdown mirrors deep fundamental cracks. Rising memory costs and mounting skepticism over whether massive AI infrastructure investments will yield tangible earnings are keeping smart money on the sidelines.
💡 When technical momentum and macro fundamentals align to the downside, patience is the sharpest trade on the board. 🤔 Do you see buyers defending lower demand blocks, or does $SNDK continue to bleed?
⚠️ Not financial advice. Always manage your risk. 🛡️
🏷️ #SNDK #Downtrend #PriceAction #MarketAnalysis
🐻 📉
16
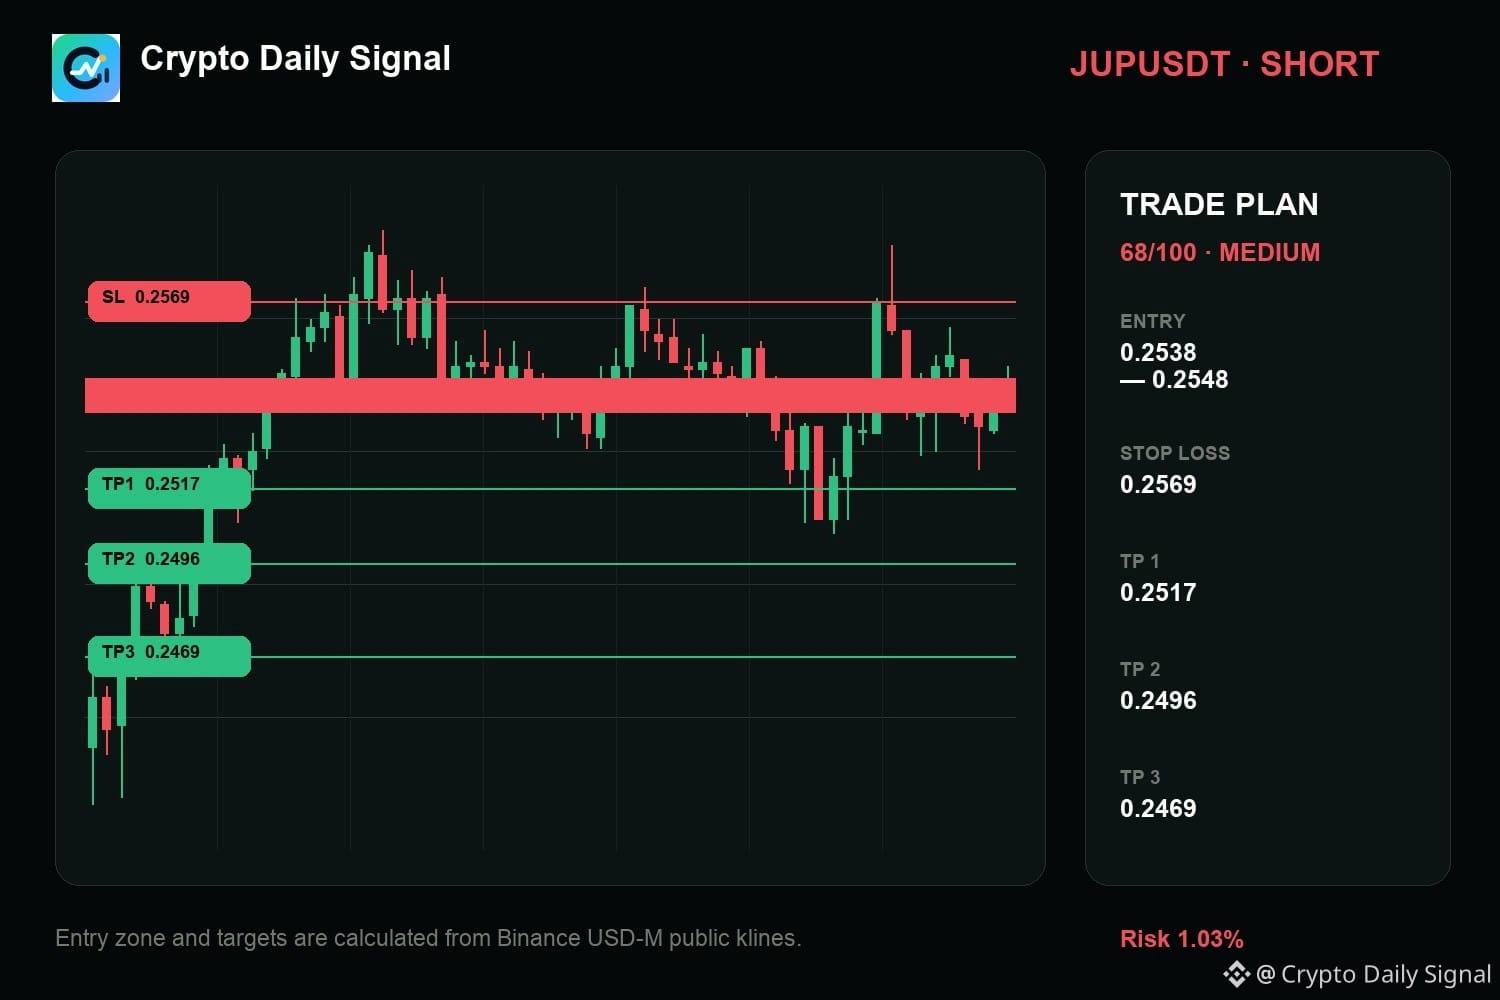
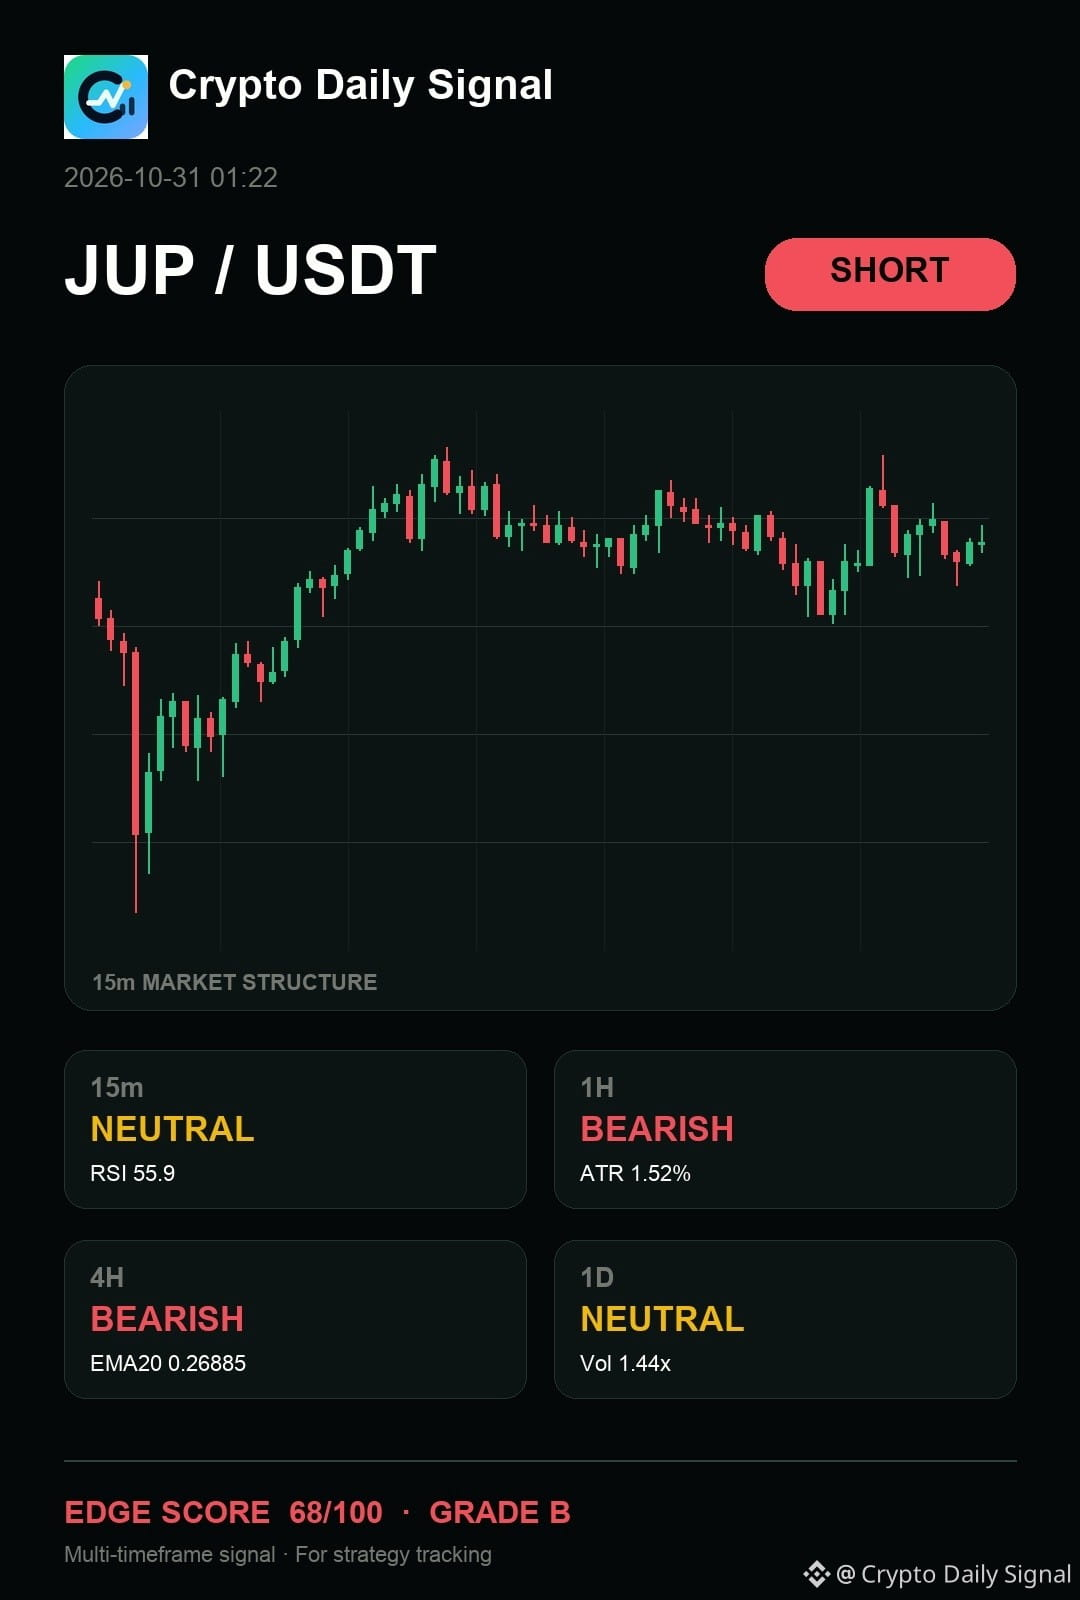
$JUP — okay, my read still says it needs the sell-side reaction to confirm the short thesis. We're seeing lower highs building inside a range, and the recent candle showed clear rejection off the upper bound. If it breaks below the immediate short-term low, that would strongly suggest the down move starts. Holding above the recent swing high keeps the short idea on hold.
Levels — JUPUSDT
Zone: 0.2538 - 0.2548
Cut: 0.2569
Scale: 0.2517 | 0.2496 | 0.2469
Would you take it here, or wait for one more confirmation candle?
#MarketAnalysis
{future}(JUPUSDT)
$JUP — okay, my read still says it needs the sell-side reaction to confirm the short thesis. We're seeing lower highs building inside a range, and the recent candle showed clear rejection off the upper bound. If it breaks below the immediate short-term low, that would strongly suggest the down move starts. Holding above the recent swing high keeps the short idea on hold.
Levels — JUPUSDT
Zone: 0.2538 - 0.2548
Cut: 0.2569
Scale: 0.2517 | 0.2496 | 0.2469
Would you take it here, or wait for one more confirmation candle?
#MarketAnalysis
Levels — JUPUSDT
Zone: 0.2538 - 0.2548
Cut: 0.2569
Scale: 0.2517 | 0.2496 | 0.2469
Would you take it here, or wait for one more confirmation candle?
#MarketAnalysis
5
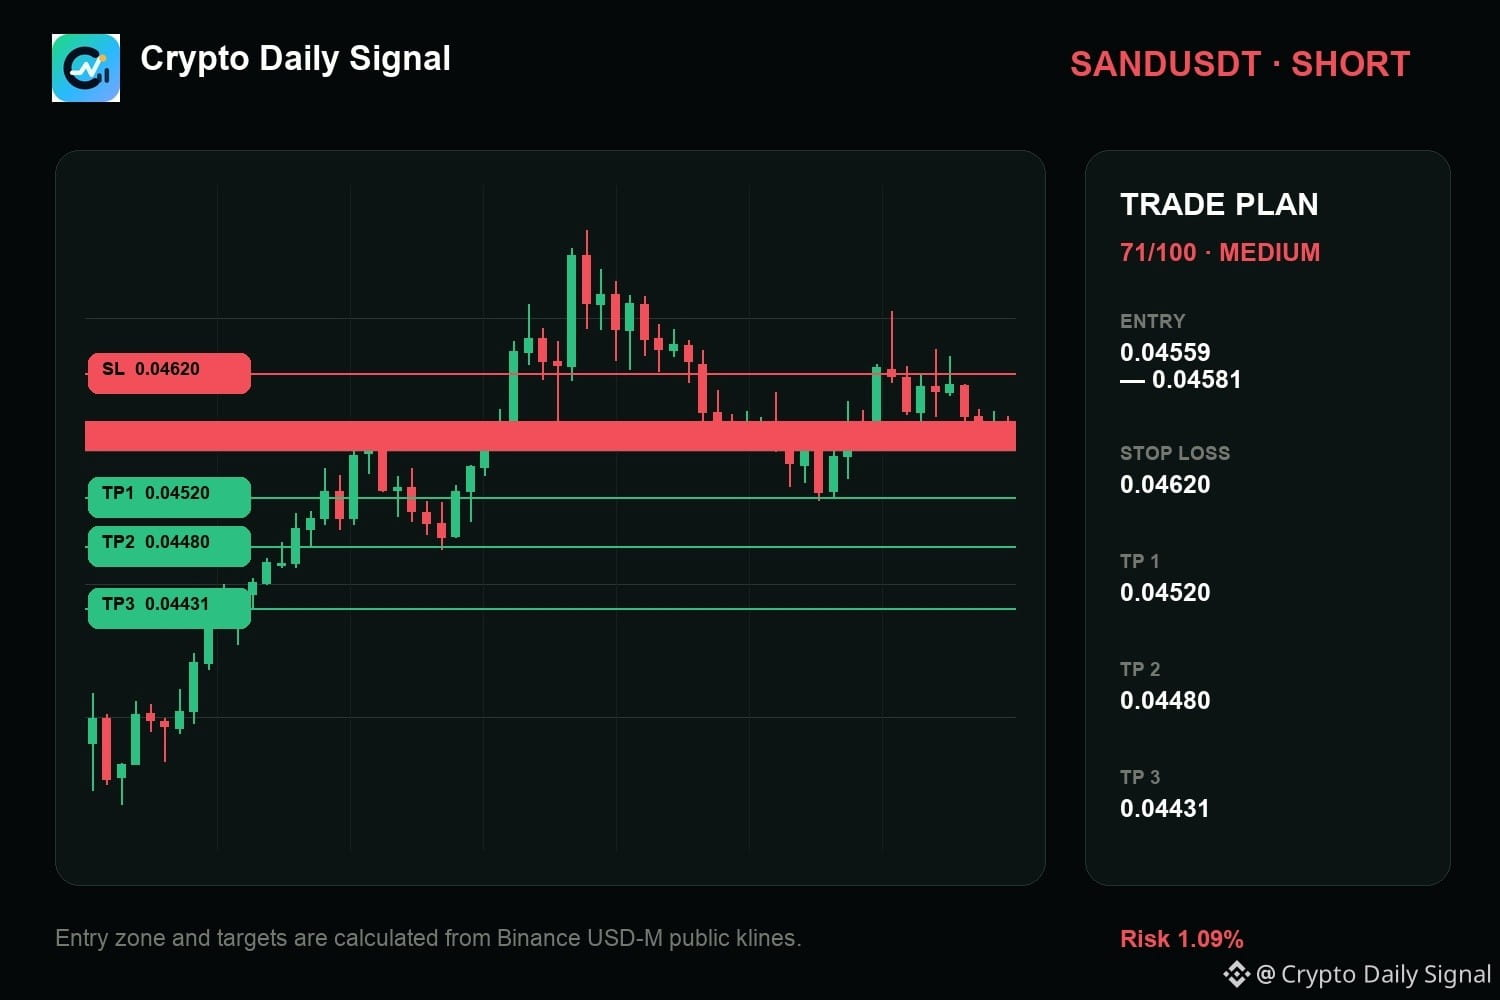
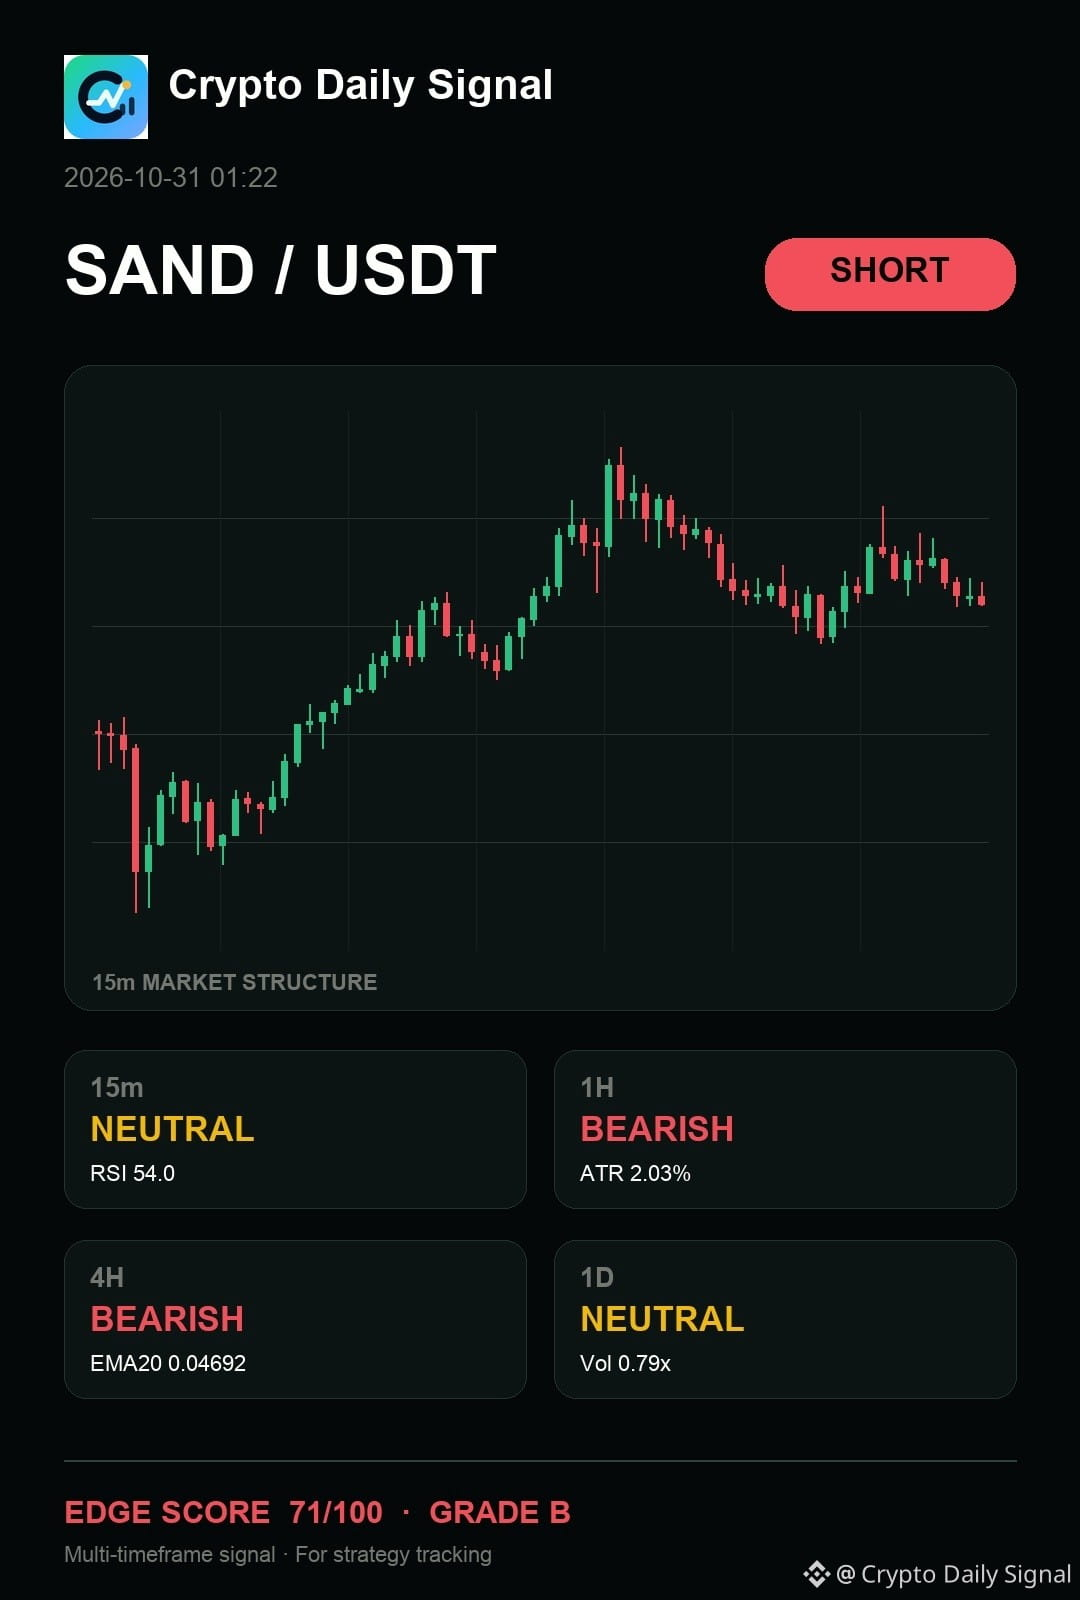
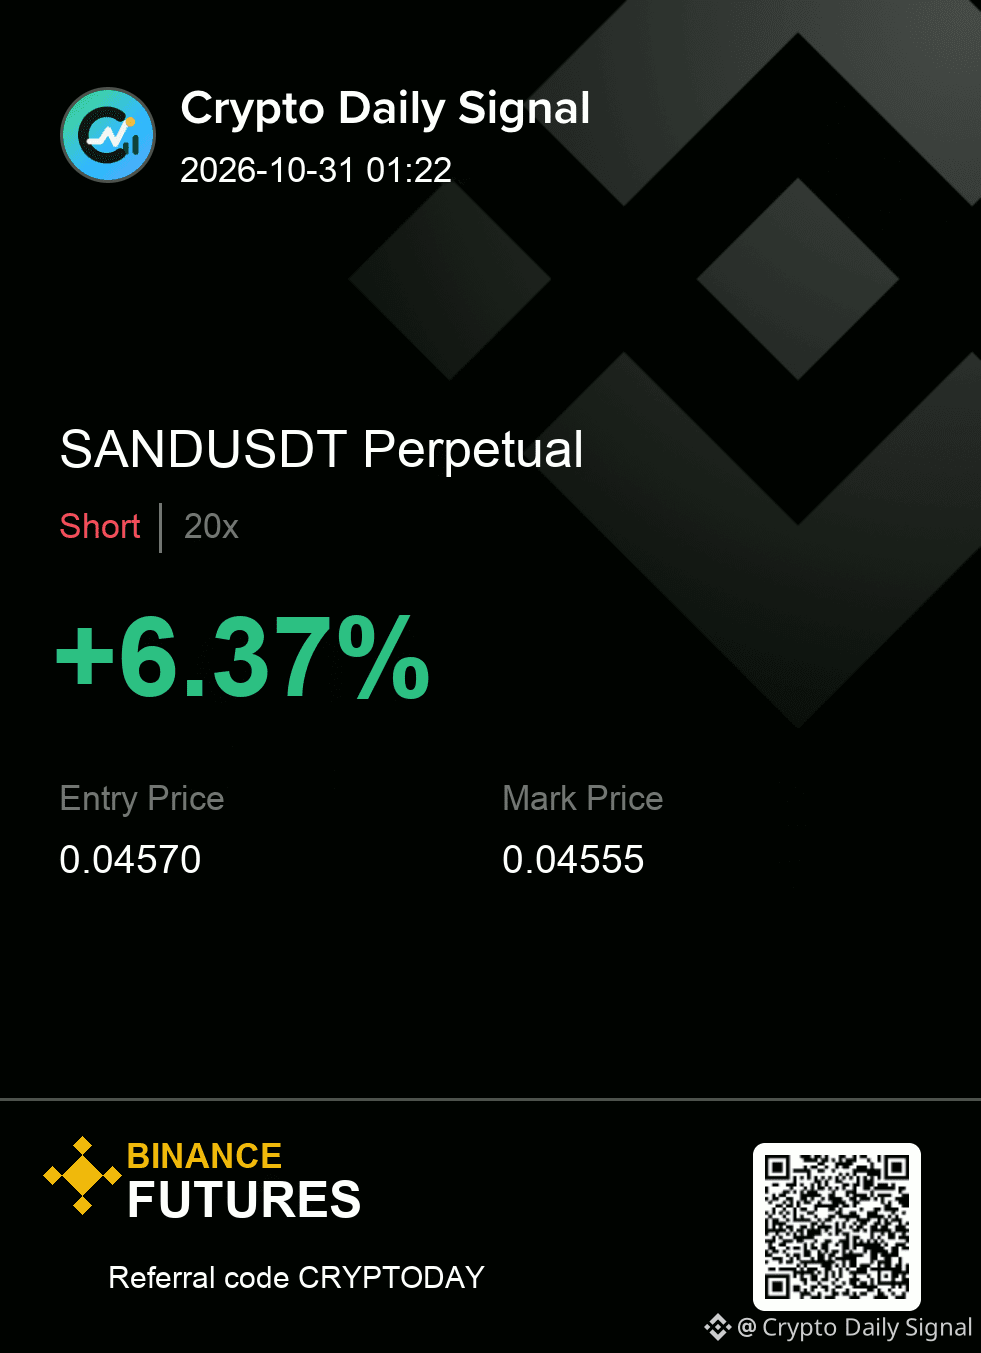
$SAND — for me, the core read is that it needs confirmation before I press the short. The price is pushing right up against where a swing high was made previously, and the recent candles show a pattern of failing to push higher. This short idea gets stronger if it closes below the recent low, but a strong move back above that prior high would kill the thesis.
Levels — SANDUSDT
Zone: 0.04559 - 0.04581
Cut: 0.04620
Scale: 0.04520 | 0.04480 | 0.04431
#MarketAnalysis
{future}(SANDUSDT)
$SAND — for me, the core read is that it needs confirmation before I press the short. The price is pushing right up against where a swing high was made previously, and the recent candles show a pattern of failing to push higher. This short idea gets stronger if it closes below the recent low, but a strong move back above that prior high would kill the thesis.
Levels — SANDUSDT
Zone: 0.04559 - 0.04581
Cut: 0.04620
Scale: 0.04520 | 0.04480 | 0.04431
#MarketAnalysis
Levels — SANDUSDT
Zone: 0.04559 - 0.04581
Cut: 0.04620
Scale: 0.04520 | 0.04480 | 0.04431
#MarketAnalysis
3
·
--
🚨 FIL SHORT SQUEEZE ALERT — BEARS UNDER PRESSURE! 🟢
Filecoin ($FIL) just delivered a warning shot to bearish traders!
💥 $61,200 in short positions liquidated at $0.864.
This liquidation event suggests that sellers were caught on the wrong side of the move, potentially adding fuel to bullish momentum. If buying pressure continues, another wave of short covering could push FIL toward higher resistance zones.
📊 My Market Outlook:
🟢 Bullish Scenario: Holding above $0.864 could strengthen the recovery and open the door toward $0.880–$0.900.
🔴 Bearish Scenario: Losing $0.864 could weaken momentum and expose the $0.850–$0.840 support area.
🎯 Key Signal: Watch trading volume and whether buyers can sustain the breakout.
🔥 Trader's Take: FIL could be preparing for another upward attempt, but confirmation is essential. I would watch for a successful retest before considering a long setup rather than chasing the initial move.
⚠️ Liquidation data is not a guaranteed trend reversal. Manage risk, use proper stop-losses, and DYOR.
#FIL #Filecoin #CryptoSignals #ShortSqueeze #CryptoTrading #MarketAnalysis
#BinanceWillListPredictPREDICT #AmazonSharesFallAbout7%InPremarketTrading #HKDollarStablecoinHKDAPToLaunchOnSolana #AmazonSharesFallAbout7%InPremarketTrading
{spot}(FILUSDT)
🚨 FIL SHORT SQUEEZE ALERT — BEARS UNDER PRESSURE! 🟢
Filecoin ($FIL) just delivered a warning shot to bearish traders!
💥 $61,200 in short positions liquidated at $0.864.
This liquidation event suggests that sellers were caught on the wrong side of the move, potentially adding fuel to bullish momentum. If buying pressure continues, another wave of short covering could push FIL toward higher resistance zones.
📊 My Market Outlook:
🟢 Bullish Scenario: Holding above $0.864 could strengthen the recovery and open the door toward $0.880–$0.900.
🔴 Bearish Scenario: Losing $0.864 could weaken momentum and expose the $0.850–$0.840 support area.
🎯 Key Signal: Watch trading volume and whether buyers can sustain the breakout.
🔥 Trader's Take: FIL could be preparing for another upward attempt, but confirmation is essential. I would watch for a successful retest before considering a long setup rather than chasing the initial move.
⚠️ Liquidation data is not a guaranteed trend reversal. Manage risk, use proper stop-losses, and DYOR.
#FIL #Filecoin #CryptoSignals #ShortSqueeze #CryptoTrading #MarketAnalysis
#BinanceWillListPredictPREDICT #AmazonSharesFallAbout7%InPremarketTrading #HKDollarStablecoinHKDAPToLaunchOnSolana #AmazonSharesFallAbout7%InPremarketTrading
25
ເຂົ້າສູ່ລະບົບເພື່ອສຳຫຼວດເນື້ອຫາເພີ່ມເຕີມ
ເຂົ້າຮ່ວມກຸ່ມຜູ້ໃຊ້ຄຣິບໂຕທົ່ວໂລກໃນ Binance Square.
⚡️ ໄດ້ຮັບຂໍ້ມູນຫຼ້າສຸດ ແລະ ທີ່ມີປະໂຫຍດກ່ຽວກັບຄຣິບໂຕ.
💬 ໄດ້ຮັບຄວາມໄວ້ວາງໃຈຈາກຕະຫຼາດແລກປ່ຽນຄຣິບໂຕທີ່ໃຫຍ່ທີ່ສຸດໃນໂລກ.
👍 ຄົ້ນຫາຂໍ້ມູນເຊີງເລິກທີ່ແທ້ຈາກນັກສ້າງທີ່ໄດ້ຮັບການຢືນຢັນ.
ອີເມວ / ເບີໂທລະສັບ
ຫົວຂໍ້ທີ່ກໍາລັງນິຍົມ
1
#UniswapA16zSeekDeFiExemptionFromIllinoisCryptoTax
11,653 ຄັ້ງທີ່ເບິ່ງ
516 ກຳລັງສົນທະນາ
2
#HKDollarStablecoinHKDAPToLaunchOnSolana
7,197 ຄັ້ງທີ່ເບິ່ງ
305 ກຳລັງສົນທະນາ
3
#$1.5BInLeveragedCryptoBetsLiquidated
23,176 ຄັ້ງທີ່ເບິ່ງ
212 ກຳລັງສົນທະນາ
4
#TrezorSaysCryptoBilisSoldWalletMayContainMaliciousComponents
1,278 ຄັ້ງທີ່ເບິ່ງ
48 ກຳລັງສົນທະນາ
5
#KOSPIFalls3.53%BackBelow6000
49,048 ຄັ້ງທີ່ເບິ່ງ
945 ກຳລັງສົນທະນາ
6
#AmazonSharesFallAbout7%InPremarketTrading
22,197 ຄັ້ງທີ່ເບິ່ງ
505 ກຳລັງສົນທະນາ
7
#USMidtermElections
205,760 ຄັ້ງທີ່ເບິ່ງ
2,218 ກຳລັງສົນທະນາ
8
#StrategySTRCReaches$99.95ForFirstTimeIn165Days
13,469 ຄັ້ງທີ່ເບິ່ງ
91 ກຳລັງສົນທະນາ
9
#BinanceWillListPredictPREDICT
73,250 ຄັ້ງທີ່ເບິ່ງ
1,270 ກຳລັງສົນທະນາ
10
#SwitzerlandFirstSpotBitcoinETFExpectedToTradeInNovember
2,494 ຄັ້ງທີ່ເບິ່ງ
103 ກຳລັງສົນທະນາ