
Traders Area
7 Жариялаулар

Traders Area
Хабарлау
Пайдаланушыны блоктау
Daily crypto updates, BTC & ETH analysis, breaking news, price action & trends. Educational content only. Not financial advice.
Кездейсоқ трейдер
3.6 жыл
0 Жазылым
25 Жазылушылар
21 лайк басылған
Жазбалар
·
--
Жоғары (өспелі)
Bitcoin closes above 50-week moving average for first time since November 2025
Bitcoin ended the week of September 20, 2026 at $81,159, crossing above its 50-week moving average of roughly $78,788. That 3% buffer above the line may not sound dramatic, but it closes the book on a 45-week period in which Bitcoin traded below one of the most closely watched trend indicators in the market.
The last time Bitcoin managed a weekly close above this level was November 9, 2025.
The catalyst for the breakout was a 6% single-day surge on September 18, which briefly pushed Bitcoin past $81,200. The move was accompanied by heightened whale activity and a wave of short liquidations.
In the days following the September 20 close, Bitcoin traded in a tight range between $81,000 and $81,450.
To put the road here in perspective: Bitcoin hit a cycle low of approximately $58,525 on June 30, 2026. That represented a 53% drawdown from the October 2025 peak above $124,000. The September 20 close means Bitcoin has recovered roughly 39% from that bottom in fewer than three months.
Galaxy Research head Alex Thorn has tracked what happens historically when Bitcoin reclaims this level after a bear-market breakdown. The data covers 13 comparable instances. In 11 of those 13 cases, the reclaim did not result in new cycle lows.
The exceptions matter too. Two of those 13 reclaims did eventually give way to new lows.
Prior episodes that followed the same pattern include recoveries in 2015, 2019, and 2023.
The immediate question for anyone tracking this development is whether Bitcoin can hold above $78,788 on subsequent weekly closes. One week above the moving average is a signal. Consecutive weeks above it start to look like confirmation.
#NewsAboutCrypto #btc85ksoon #BTC
{spot}(BTCUSDT)
Bitcoin closes above 50-week moving average for first time since November 2025
Bitcoin ended the week of September 20, 2026 at $81,159, crossing above its 50-week moving average of roughly $78,788. That 3% buffer above the line may not sound dramatic, but it closes the book on a 45-week period in which Bitcoin traded below one of the most closely watched trend indicators in the market.
The last time Bitcoin managed a weekly close above this level was November 9, 2025.
The catalyst for the breakout was a 6% single-day surge on September 18, which briefly pushed Bitcoin past $81,200. The move was accompanied by heightened whale activity and a wave of short liquidations.
In the days following the September 20 close, Bitcoin traded in a tight range between $81,000 and $81,450.
To put the road here in perspective: Bitcoin hit a cycle low of approximately $58,525 on June 30, 2026. That represented a 53% drawdown from the October 2025 peak above $124,000. The September 20 close means Bitcoin has recovered roughly 39% from that bottom in fewer than three months.
Galaxy Research head Alex Thorn has tracked what happens historically when Bitcoin reclaims this level after a bear-market breakdown. The data covers 13 comparable instances. In 11 of those 13 cases, the reclaim did not result in new cycle lows.
The exceptions matter too. Two of those 13 reclaims did eventually give way to new lows.
Prior episodes that followed the same pattern include recoveries in 2015, 2019, and 2023.
The immediate question for anyone tracking this development is whether Bitcoin can hold above $78,788 on subsequent weekly closes. One week above the moving average is a signal. Consecutive weeks above it start to look like confirmation.
#NewsAboutCrypto #btc85ksoon #BTC
Bitcoin ended the week of September 20, 2026 at $81,159, crossing above its 50-week moving average of roughly $78,788. That 3% buffer above the line may not sound dramatic, but it closes the book on a 45-week period in which Bitcoin traded below one of the most closely watched trend indicators in the market.
The last time Bitcoin managed a weekly close above this level was November 9, 2025.
The catalyst for the breakout was a 6% single-day surge on September 18, which briefly pushed Bitcoin past $81,200. The move was accompanied by heightened whale activity and a wave of short liquidations.
In the days following the September 20 close, Bitcoin traded in a tight range between $81,000 and $81,450.
To put the road here in perspective: Bitcoin hit a cycle low of approximately $58,525 on June 30, 2026. That represented a 53% drawdown from the October 2025 peak above $124,000. The September 20 close means Bitcoin has recovered roughly 39% from that bottom in fewer than three months.
Galaxy Research head Alex Thorn has tracked what happens historically when Bitcoin reclaims this level after a bear-market breakdown. The data covers 13 comparable instances. In 11 of those 13 cases, the reclaim did not result in new cycle lows.
The exceptions matter too. Two of those 13 reclaims did eventually give way to new lows.
Prior episodes that followed the same pattern include recoveries in 2015, 2019, and 2023.
The immediate question for anyone tracking this development is whether Bitcoin can hold above $78,788 on subsequent weekly closes. One week above the moving average is a signal. Consecutive weeks above it start to look like confirmation.
#NewsAboutCrypto #btc85ksoon #BTC
1
91
·
--
Breakout Zone Holds
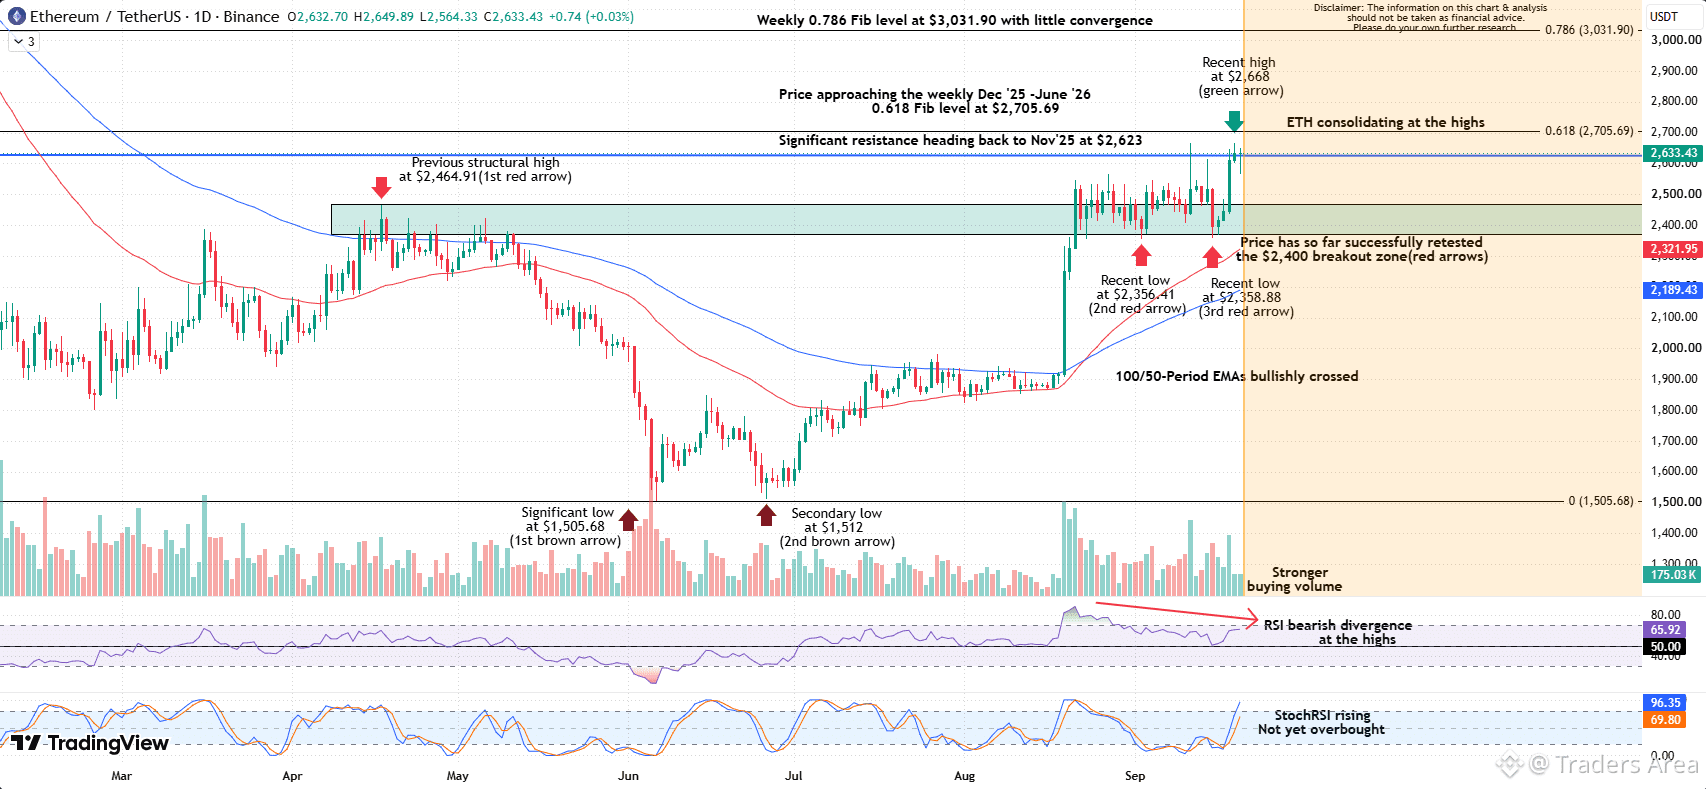
Ethereum has so far successfully retested the $2,400 breakout zone, with buyers stepping in on both recent pullbacks. Holding this area keeps the broader recovery firmly intact.
Consolidating Near the Highs
Rather than seeing a sharp rejection, ETH has been consolidating near the top of its recent range. Price has now pushed as high as $2,668, increasing the possibility of another move higher.
Major Resistance Being Tested
ETH is testing significant resistance around $2,623, an area that stretches back to November 2025. Just above sits the 0.618 Fib at $2,705.69, making this an important area for bulls to overcome.
Trend Remains Bullish
The 100/50-period EMAs remain bullishly crossed, with price comfortably above both averages. This continues to support the improving daily trend.
Buying Volume Improves
Buying volume has strengthened during the latest move towards the highs. That adds some weight to the recent push into resistance.
RSI Divergence Adds Caution
The main warning sign is the bearish RSI divergence developing at the highs. Price has pushed higher while RSI has failed to confirm the move, suggesting momentum has weakened despite the stronger price action.
In Summary
Ethereum continues to look constructive after successfully retesting the $2,400 breakout zone and consolidating near the highs. The bullishly crossed 100/50-period EMAs and stronger buying volume support the wider recovery, but bearish RSI divergence adds some caution. ETH is now testing significant resistance around $2,623, with the 0.618 Fib at $2,705.69 just above. A convincing break through this area would strengthen the case for further upside.$ETH #ETH🔥🔥🔥🔥🔥🔥
{spot}(ETHUSDT)
Breakout Zone Holds
Ethereum has so far successfully retested the $2,400 breakout zone, with buyers stepping in on both recent pullbacks. Holding this area keeps the broader recovery firmly intact.
Consolidating Near the Highs
Rather than seeing a sharp rejection, ETH has been consolidating near the top of its recent range. Price has now pushed as high as $2,668, increasing the possibility of another move higher.
Major Resistance Being Tested
ETH is testing significant resistance around $2,623, an area that stretches back to November 2025. Just above sits the 0.618 Fib at $2,705.69, making this an important area for bulls to overcome.
Trend Remains Bullish
The 100/50-period EMAs remain bullishly crossed, with price comfortably above both averages. This continues to support the improving daily trend.
Buying Volume Improves
Buying volume has strengthened during the latest move towards the highs. That adds some weight to the recent push into resistance.
RSI Divergence Adds Caution
The main warning sign is the bearish RSI divergence developing at the highs. Price has pushed higher while RSI has failed to confirm the move, suggesting momentum has weakened despite the stronger price action.
In Summary
Ethereum continues to look constructive after successfully retesting the $2,400 breakout zone and consolidating near the highs. The bullishly crossed 100/50-period EMAs and stronger buying volume support the wider recovery, but bearish RSI divergence adds some caution. ETH is now testing significant resistance around $2,623, with the 0.618 Fib at $2,705.69 just above. A convincing break through this area would strengthen the case for further upside.$ETH #ETH🔥🔥🔥🔥🔥🔥
Ethereum has so far successfully retested the $2,400 breakout zone, with buyers stepping in on both recent pullbacks. Holding this area keeps the broader recovery firmly intact.
Consolidating Near the Highs
Rather than seeing a sharp rejection, ETH has been consolidating near the top of its recent range. Price has now pushed as high as $2,668, increasing the possibility of another move higher.
Major Resistance Being Tested
ETH is testing significant resistance around $2,623, an area that stretches back to November 2025. Just above sits the 0.618 Fib at $2,705.69, making this an important area for bulls to overcome.
Trend Remains Bullish
The 100/50-period EMAs remain bullishly crossed, with price comfortably above both averages. This continues to support the improving daily trend.
Buying Volume Improves
Buying volume has strengthened during the latest move towards the highs. That adds some weight to the recent push into resistance.
RSI Divergence Adds Caution
The main warning sign is the bearish RSI divergence developing at the highs. Price has pushed higher while RSI has failed to confirm the move, suggesting momentum has weakened despite the stronger price action.
In Summary
Ethereum continues to look constructive after successfully retesting the $2,400 breakout zone and consolidating near the highs. The bullishly crossed 100/50-period EMAs and stronger buying volume support the wider recovery, but bearish RSI divergence adds some caution. ETH is now testing significant resistance around $2,623, with the 0.618 Fib at $2,705.69 just above. A convincing break through this area would strengthen the case for further upside.$ETH #ETH🔥🔥🔥🔥🔥🔥
1
304
·
--
Жоғары (өспелі)
Bulls Break Through $80K
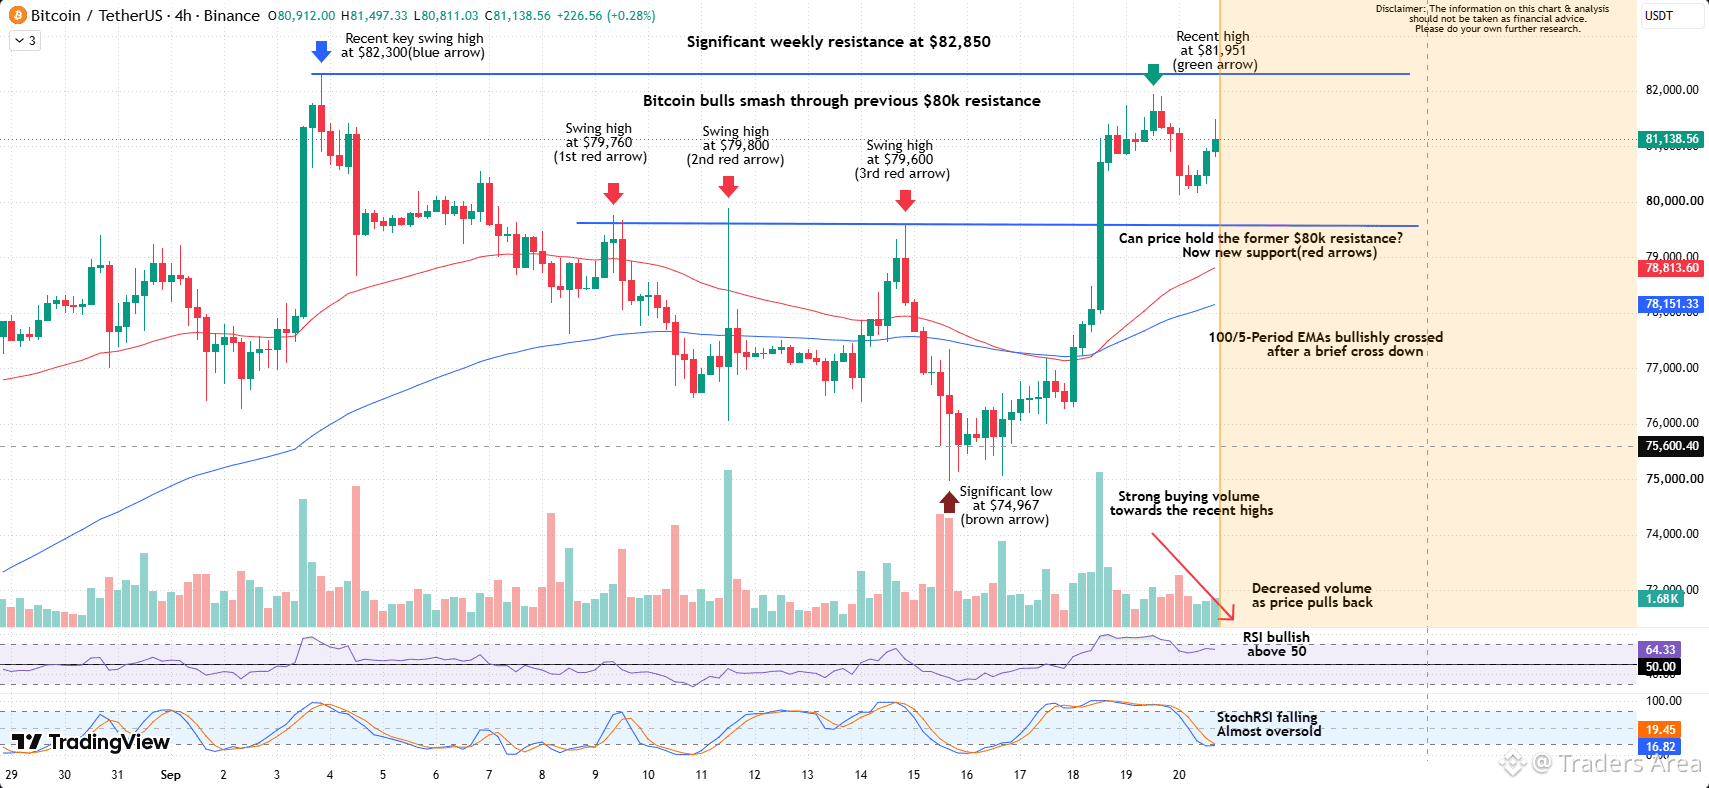
Bitcoin has finally pushed through the $79,600–$80,000 resistance that had rejected price three times. The breakout was backed by strong buying volume, giving the move more weight.
Weekly Resistance Next
Price reached $81,951 before pulling back, leaving the significant weekly resistance around $82,850 as the next major test. This area sits just above the previous $82,300 swing high.
Former Resistance Now Support
The pullback has so far remained above the former $80,000 resistance area. Holding this zone would strengthen the breakout and keep the short-term structure firmly in favour of buyers.
Volume Supports the Move
Buying volume expanded significantly during the breakout, while volume has decreased on the subsequent pullback. For now, that is a constructive combination.
EMAs Turn Bullish Again
The 100/50-period EMAs have bullishly crossed again after their brief bearish cross. Price is also trading comfortably above both averages.
Momentum Remains Strong
RSI remains bullish above 50, while StochRSI has cooled sharply from overbought territory. This has allowed some of the short-term momentum to reset without a significant loss of price structure.
In Summary
Bitcoin has finally broken through the $80,000 resistance that repeatedly capped price, with strong buying volume adding weight to the move. The pullback has so far held above that former resistance while volume has decreased, keeping the breakout intact. The 100/50-period EMAs have also turned bullish again. If $80,000 continues to hold, attention remains firmly on the significant weekly resistance around $82,850.$BTC
{spot}(BTCUSDT)
Bulls Break Through $80K
Bitcoin has finally pushed through the $79,600–$80,000 resistance that had rejected price three times. The breakout was backed by strong buying volume, giving the move more weight.
Weekly Resistance Next
Price reached $81,951 before pulling back, leaving the significant weekly resistance around $82,850 as the next major test. This area sits just above the previous $82,300 swing high.
Former Resistance Now Support
The pullback has so far remained above the former $80,000 resistance area. Holding this zone would strengthen the breakout and keep the short-term structure firmly in favour of buyers.
Volume Supports the Move
Buying volume expanded significantly during the breakout, while volume has decreased on the subsequent pullback. For now, that is a constructive combination.
EMAs Turn Bullish Again
The 100/50-period EMAs have bullishly crossed again after their brief bearish cross. Price is also trading comfortably above both averages.
Momentum Remains Strong
RSI remains bullish above 50, while StochRSI has cooled sharply from overbought territory. This has allowed some of the short-term momentum to reset without a significant loss of price structure.
In Summary
Bitcoin has finally broken through the $80,000 resistance that repeatedly capped price, with strong buying volume adding weight to the move. The pullback has so far held above that former resistance while volume has decreased, keeping the breakout intact. The 100/50-period EMAs have also turned bullish again. If $80,000 continues to hold, attention remains firmly on the significant weekly resistance around $82,850.$BTC
Bitcoin has finally pushed through the $79,600–$80,000 resistance that had rejected price three times. The breakout was backed by strong buying volume, giving the move more weight.
Weekly Resistance Next
Price reached $81,951 before pulling back, leaving the significant weekly resistance around $82,850 as the next major test. This area sits just above the previous $82,300 swing high.
Former Resistance Now Support
The pullback has so far remained above the former $80,000 resistance area. Holding this zone would strengthen the breakout and keep the short-term structure firmly in favour of buyers.
Volume Supports the Move
Buying volume expanded significantly during the breakout, while volume has decreased on the subsequent pullback. For now, that is a constructive combination.
EMAs Turn Bullish Again
The 100/50-period EMAs have bullishly crossed again after their brief bearish cross. Price is also trading comfortably above both averages.
Momentum Remains Strong
RSI remains bullish above 50, while StochRSI has cooled sharply from overbought territory. This has allowed some of the short-term momentum to reset without a significant loss of price structure.
In Summary
Bitcoin has finally broken through the $80,000 resistance that repeatedly capped price, with strong buying volume adding weight to the move. The pullback has so far held above that former resistance while volume has decreased, keeping the breakout intact. The 100/50-period EMAs have also turned bullish again. If $80,000 continues to hold, attention remains firmly on the significant weekly resistance around $82,850.$BTC
1
59
·
--
Bulls Break Through $80KBitcoin has finally pushed through the $79,600–$80,000 resistance that had rejected price three times. The breakout was backed by strong buying volume, giving the move more weight.
Weekly Resistance Next
Price reached $81,951 before pulling back, leaving the significant weekly resistance around $82,850 as the next major test. This area sits just above the previous $82,300 swing high.
Former Resistance Now Support
The pullback has so far remained above the former $80,000 resistance area. Holding this zone would strengthen the breakout and keep the short-term structure firmly in favour of buyers.
Volume Supports the Move
Buying volume expanded significantly during the breakout, while volume has decreased on the subsequent pullback. For now, that is a constructive combination.
EMAs Turn Bullish Again
The 100/50-period EMAs have bullishly crossed again after their brief bearish cross. Price is also trading comfortably above both averages.
Momentum Remains Strong
RSI remains bullish above 50, while StochRSI has cooled sharply from overbought territory. This has allowed some of the short-term momentum to reset without a significant loss of price structure.
In Summary
Bitcoin has finally broken through the $80,000 resistance that repeatedly capped price, with strong buying volume adding weight to the move. The pullback has so far held above that former resistance while volume has decreased, keeping the breakout intact. The 100/50-period EMAs have also turned bullish again. If $80,000 continues to hold, attention remains firmly on the significant weekly resistance around $82,850.#BTCBreaks80K #BTC #binanceIndia $BTC
{future}(BTCUSDT)
Bulls Break Through $80K
Bitcoin has finally pushed through the $79,600–$80,000 resistance that had rejected price three times. The breakout was backed by strong buying volume, giving the move more weight.
Weekly Resistance Next
Price reached $81,951 before pulling back, leaving the significant weekly resistance around $82,850 as the next major test. This area sits just above the previous $82,300 swing high.
Former Resistance Now Support
The pullback has so far remained above the former $80,000 resistance area. Holding this zone would strengthen the breakout and keep the short-term structure firmly in favour of buyers.
Volume Supports the Move
Buying volume expanded significantly during the breakout, while volume has decreased on the subsequent pullback. For now, that is a constructive combination.
EMAs Turn Bullish Again
The 100/50-period EMAs have bullishly crossed again after their brief bearish cross. Price is also trading comfortably above both averages.
Momentum Remains Strong
RSI remains bullish above 50, while StochRSI has cooled sharply from overbought territory. This has allowed some of the short-term momentum to reset without a significant loss of price structure.
In Summary
Bitcoin has finally broken through the $80,000 resistance that repeatedly capped price, with strong buying volume adding weight to the move. The pullback has so far held above that former resistance while volume has decreased, keeping the breakout intact. The 100/50-period EMAs have also turned bullish again. If $80,000 continues to hold, attention remains firmly on the significant weekly resistance around $82,850.#BTCBreaks80K #BTC #binanceIndia $BTC
Weekly Resistance Next
Price reached $81,951 before pulling back, leaving the significant weekly resistance around $82,850 as the next major test. This area sits just above the previous $82,300 swing high.
Former Resistance Now Support
The pullback has so far remained above the former $80,000 resistance area. Holding this zone would strengthen the breakout and keep the short-term structure firmly in favour of buyers.
Volume Supports the Move
Buying volume expanded significantly during the breakout, while volume has decreased on the subsequent pullback. For now, that is a constructive combination.
EMAs Turn Bullish Again
The 100/50-period EMAs have bullishly crossed again after their brief bearish cross. Price is also trading comfortably above both averages.
Momentum Remains Strong
RSI remains bullish above 50, while StochRSI has cooled sharply from overbought territory. This has allowed some of the short-term momentum to reset without a significant loss of price structure.
In Summary
Bitcoin has finally broken through the $80,000 resistance that repeatedly capped price, with strong buying volume adding weight to the move. The pullback has so far held above that former resistance while volume has decreased, keeping the breakout intact. The 100/50-period EMAs have also turned bullish again. If $80,000 continues to hold, attention remains firmly on the significant weekly resistance around $82,850.#BTCBreaks80K #BTC #binanceIndia $BTC
1
91
·
--
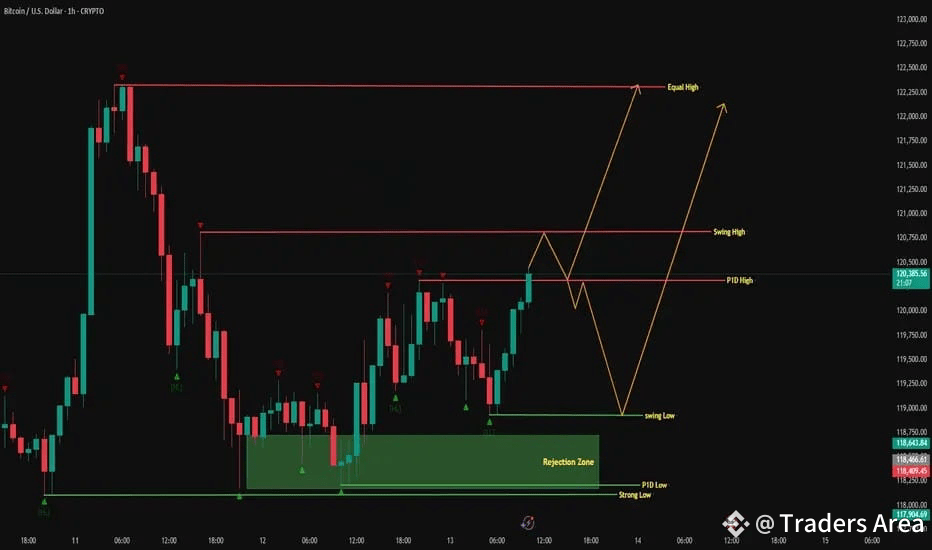
Price is currently testing the P1D High after rallying from the rejection zone.
Two potential paths from here:
1️⃣ Bullish Break & Continuation:
Hold above P1D High → Break Swing High → target Equal High around 122,200.
2️⃣ Bearish Rejection & Retracement:
Reject from Swing High → drop toward Swing Low at 118,750 or deeper into the Rejection Zone near 118,000.
Key Levels:
Resistance: P1D High (120,400), Swing High (120,750), Equal High (122,200)
Support: Swing Low (118,750), Rejection Zone (118,000–117,900)
📌 Plan: Wait for breakout confirmation or rejection reaction before entering.
#BTC #ETH #solana
Price is currently testing the P1D High after rallying from the rejection zone.
Two potential paths from here:
1️⃣ Bullish Break & Continuation:
Hold above P1D High → Break Swing High → target Equal High around 122,200.
2️⃣ Bearish Rejection & Retracement:
Reject from Swing High → drop toward Swing Low at 118,750 or deeper into the Rejection Zone near 118,000.
Key Levels:
Resistance: P1D High (120,400), Swing High (120,750), Equal High (122,200)
Support: Swing Low (118,750), Rejection Zone (118,000–117,900)
📌 Plan: Wait for breakout confirmation or rejection reaction before entering.
#BTC #ETH #solana
Two potential paths from here:
1️⃣ Bullish Break & Continuation:
Hold above P1D High → Break Swing High → target Equal High around 122,200.
2️⃣ Bearish Rejection & Retracement:
Reject from Swing High → drop toward Swing Low at 118,750 or deeper into the Rejection Zone near 118,000.
Key Levels:
Resistance: P1D High (120,400), Swing High (120,750), Equal High (122,200)
Support: Swing Low (118,750), Rejection Zone (118,000–117,900)
📌 Plan: Wait for breakout confirmation or rejection reaction before entering.
#BTC #ETH #solana
4
59
·
--
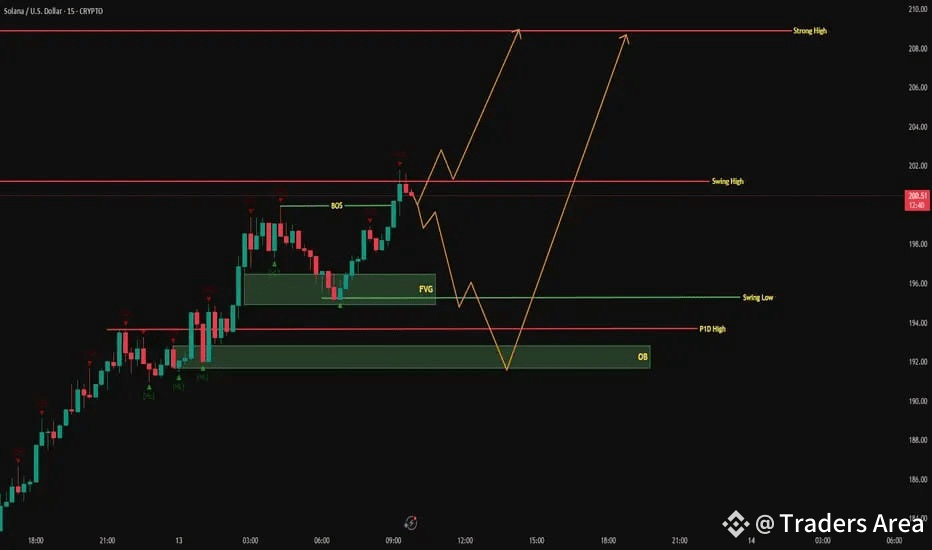
Price is currently reacting near the Swing High at 200 after a strong bullish push.
Two possible scenarios ahead:
1️⃣ Immediate Continuation:
Break and hold above Swing High → target the Strong High near 209.
2️⃣ Deeper Retracement Before Rally:
Reject from Swing High → drop toward FVG (196) or even OB at 185–184, before bouncing back to target Strong High.
Key Levels:
Resistance: Swing High (200), Strong High (209)
Support: Swing Low (196), OB Demand Zone (185–184)
📌 Plan: Watch the reaction at Swing High for entry confirmation — both breakout and retracement setups possible.
#solana #BTC #ETH
Price is currently reacting near the Swing High at 200 after a strong bullish push.
Two possible scenarios ahead:
1️⃣ Immediate Continuation:
Break and hold above Swing High → target the Strong High near 209.
2️⃣ Deeper Retracement Before Rally:
Reject from Swing High → drop toward FVG (196) or even OB at 185–184, before bouncing back to target Strong High.
Key Levels:
Resistance: Swing High (200), Strong High (209)
Support: Swing Low (196), OB Demand Zone (185–184)
📌 Plan: Watch the reaction at Swing High for entry confirmation — both breakout and retracement setups possible.
#solana #BTC #ETH
Two possible scenarios ahead:
1️⃣ Immediate Continuation:
Break and hold above Swing High → target the Strong High near 209.
2️⃣ Deeper Retracement Before Rally:
Reject from Swing High → drop toward FVG (196) or even OB at 185–184, before bouncing back to target Strong High.
Key Levels:
Resistance: Swing High (200), Strong High (209)
Support: Swing Low (196), OB Demand Zone (185–184)
📌 Plan: Watch the reaction at Swing High for entry confirmation — both breakout and retracement setups possible.
#solana #BTC #ETH
7
106
·
--
Жоғары (өспелі)
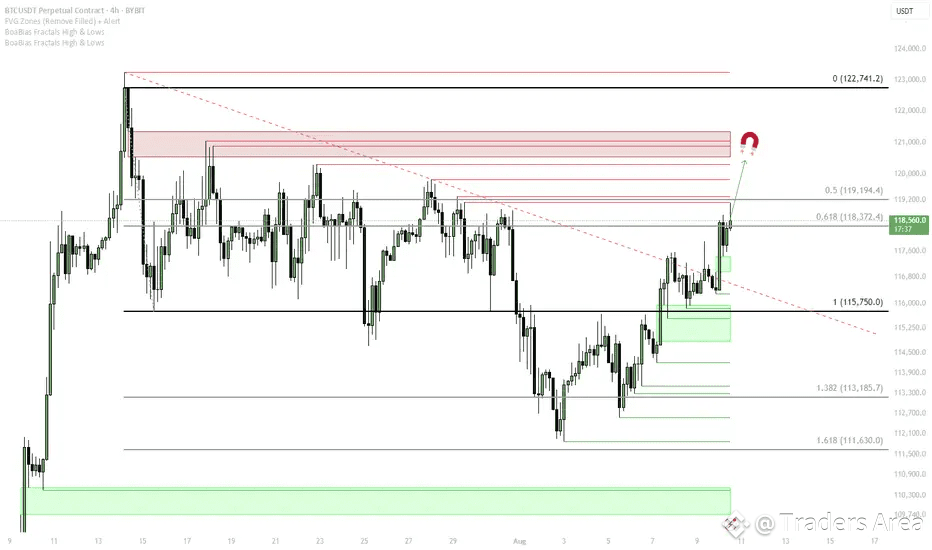
BTC has broken a descending trendline and is pushing toward the mid-range resistance at 119,500. Above that sits a liquidity pocket at 121,000, with the range high at 123,250.
Momentum signals on higher timeframes remain bullish, with accumulation patterns in place, but lower timeframes show bearish RSI divergences, suggesting the potential for a pullback before continuation.
Bullish scenario:
Hold above 117,000 – 117,454 (4H Bull FVG) keeps bullish momentum intact.
Break and close above 119,500 sets up a liquidity sweep at 121,000.
If momentum sustains, an extension toward 123,250 (Range High) becomes possible.
Bearish / Invalidation scenario:
Rejection from 119,500 followed by a break below 117,000 could pull price back toward 115,750 (Range Low).
Loss of 115,750 exposes deeper retrace into 1W Bull FVG 110,655 – 115,900.
Trading plan:
Watch for breakout + retest of 119,500 to target 121k.
Take partial profits into 121,000; leave runner toward 123,250.
Protect downside if price loses 117,000.
#BinanceAlphaAlert #BTC
BTC has broken a descending trendline and is pushing toward the mid-range resistance at 119,500. Above that sits a liquidity pocket at 121,000, with the range high at 123,250.
Momentum signals on higher timeframes remain bullish, with accumulation patterns in place, but lower timeframes show bearish RSI divergences, suggesting the potential for a pullback before continuation.
Bullish scenario:
Hold above 117,000 – 117,454 (4H Bull FVG) keeps bullish momentum intact.
Break and close above 119,500 sets up a liquidity sweep at 121,000.
If momentum sustains, an extension toward 123,250 (Range High) becomes possible.
Bearish / Invalidation scenario:
Rejection from 119,500 followed by a break below 117,000 could pull price back toward 115,750 (Range Low).
Loss of 115,750 exposes deeper retrace into 1W Bull FVG 110,655 – 115,900.
Trading plan:
Watch for breakout + retest of 119,500 to target 121k.
Take partial profits into 121,000; leave runner toward 123,250.
Protect downside if price loses 117,000.
#BinanceAlphaAlert #BTC
Momentum signals on higher timeframes remain bullish, with accumulation patterns in place, but lower timeframes show bearish RSI divergences, suggesting the potential for a pullback before continuation.
Bullish scenario:
Hold above 117,000 – 117,454 (4H Bull FVG) keeps bullish momentum intact.
Break and close above 119,500 sets up a liquidity sweep at 121,000.
If momentum sustains, an extension toward 123,250 (Range High) becomes possible.
Bearish / Invalidation scenario:
Rejection from 119,500 followed by a break below 117,000 could pull price back toward 115,750 (Range Low).
Loss of 115,750 exposes deeper retrace into 1W Bull FVG 110,655 – 115,900.
Trading plan:
Watch for breakout + retest of 119,500 to target 121k.
Take partial profits into 121,000; leave runner toward 123,250.
Protect downside if price loses 117,000.
#BinanceAlphaAlert #BTC
6
6
Көбірек контент көру үшін кіріңіз
Binance Square платформасында әлемдік криптоқоғамдастыққа қосылыңыз
⚡️ Криптовалюта туралы ең соңғы және пайдалы ақпаратты алыңыз.
💬 Әлемдегі ең ірі криптобиржаның сеніміне ие.
👍 Расталған авторлардың нақты пікірлерін табыңыз.
Электрондық пошта/телефон нөмірі
Трендтегі тақырыптар
AIStocksWhatNext
766,083 рет көрілді
5,880 адам талқылап жатыр
Share & Win Traffic Reward in our Trending Hashtag Campaign
✨Topic: What Other Investment Opportunities Remain as AI Stocks Keep Rising?
👉How to Join:
Publish a short post or article with hashtag #AIStocksWhatNext
Share whether you’re bullish or bearish, and post your AI stock holdings or trade — using the trade widget may improve your eligibility.
You can also strengthen your post by sharing data or charts, and avoiding AI-generated images.
✍️Create content based on the below angles:
- Nvidia says chip sales will double next year, and top AI companies keep hitting record revenue, the compute spend behind it is just as staggering. Is AI demand really taking off? And how long can it last? AI stocks are up across the board. Is this a real breakout, or just a short-term bounce?
- Industry leaders are calling to slow down AI development, while Trump plans to build an “AI Force”, claiming AI could account for 25% of U.S. GDP in the future. Whose side are you on? Will state-level backing be a long-term win for AI stocks?
- Are you buying AI stocks? Share your AI-related trade/holdings with our trade sharing widget.
⏰Campaign Period:
- 2026-09-22 7:00 - 2026-09-24 4:00 UTC
🎁Reward:
- Qualified posts that comply with the above guidelines and contain more than 100 words will be reviewed and may receive a random traffic boost of 500 to 3,000 views. You will receive a notification from your feed secretary if your post is selected.
- Get a chance to have your article featured on Binance Square Official
Need ideas for your post? Visit the topic page #AIStocksWhatNext or the Square Guide on How to Post for Better Reach.
Binance Square Official
·554 лайк
·1.5M рет көрілді
BitcoinRejectedAt$87,300Twice
0 рет көрілді
0 адам талқылап жатыр
BCHJumps28%OnCMEFuturesListing
1,234 рет көрілді
179 адам талқылап жатыр