

Tokenist
2.8k Жариялаулар

Tokenist
 «Square расталған+» белгісі
Хабарлау
Пайдаланушыны блоктау
The Tokenist is your trusted home for the latest finance news on stocks, crypto, forex, and more. Join us.
0 Жазылым
11.7K+ Жазылушылар
44.5K+ лайк басылған
Жазбалар
·
--

Мақала
CoinDepo Posts CertiK Web Application Assessment Results After Remediation ReviewCertiK has completed an independent security assessment of CoinDepo’s web application, and the full set of results has now been published on the platform’s public CertiK Skynet profile. The entry lists the areas that were in scope, the testing approaches used, every item that was recorded, and the current status of the work that followed.
The assessment covered the main functions of the CoinDepo web application, together with the business rules and logic that govern how the platform operates and the security controls that were already in place. CertiK tested the live environment and reviewed the system manually. The process surfaced a set of items in need of attention, and also checked how the application behaved under intensive test conditions.
CoinDepo then made the required updates. CertiK followed with a second review and confirmed that the reported items had been addressed.
The Skynet profile for CoinDepo shows 18 findings in total from CertiK’s web application assessment. Sixteen are listed as resolved; this group includes every finding that had originally been rated critical, high, medium, or low, while the two other findings are informational and have been acknowledged. CoinDepo’s public profile lets anyone review the specific items and the outcomes of the company’s subsequent work.
The assessment appears under “CoinDepo Web Application” in the Code Audit History section of CoinDepo’s CertiK Skynet profile, which already includes the results of an earlier CertiK assessment of the platform’s smart contracts – so both the application layer and the contract layer now have records of independent audits.
CoinDepo also participates in the CertiK Hunt bug bounty program, so selected researchers can submit reports of eligible issues through the program’s responsible disclosure process, operating within the stated scope and guidelines. The program supplies a straightforward and clear channel for external testing alongside the formal assessments that CertiK conducts itself.
About CoinDepo
CoinDepo is a centralized digital asset platform offering crypto savings and asset-backed borrowing services. Its products allow users to earn interest on supported digital assets and access liquidity through credit facilities.
The post CoinDepo Posts CertiK Web Application Assessment Results After Remediation Review appeared first on Tokenist.
CoinDepo Posts CertiK Web Application Assessment Results After Remediation Review
CertiK has completed an independent security assessment of CoinDepo’s web application, and the full set of results has now been published on the platform’s public CertiK Skynet profile. The entry lists the areas that were in scope, the testing approaches used, every item that was recorded, and the current status of the work that followed.
The assessment covered the main functions of the CoinDepo web application, together with the business rules and logic that govern how the platform operates and the security controls that were already in place. CertiK tested the live environment and reviewed the system manually. The process surfaced a set of items in need of attention, and also checked how the application behaved under intensive test conditions.
CoinDepo then made the required updates. CertiK followed with a second review and confirmed that the reported items had been addressed.
The Skynet profile for CoinDepo shows 18 findings in total from CertiK’s web application assessment. Sixteen are listed as resolved; this group includes every finding that had originally been rated critical, high, medium, or low, while the two other findings are informational and have been acknowledged. CoinDepo’s public profile lets anyone review the specific items and the outcomes of the company’s subsequent work.
The assessment appears under “CoinDepo Web Application” in the Code Audit History section of CoinDepo’s CertiK Skynet profile, which already includes the results of an earlier CertiK assessment of the platform’s smart contracts – so both the application layer and the contract layer now have records of independent audits.
CoinDepo also participates in the CertiK Hunt bug bounty program, so selected researchers can submit reports of eligible issues through the program’s responsible disclosure process, operating within the stated scope and guidelines. The program supplies a straightforward and clear channel for external testing alongside the formal assessments that CertiK conducts itself.
About CoinDepo
CoinDepo is a centralized digital asset platform offering crypto savings and asset-backed borrowing services. Its products allow users to earn interest on supported digital assets and access liquidity through credit facilities.
The post CoinDepo Posts CertiK Web Application Assessment Results After Remediation Review appeared first on Tokenist.
·
--

Мақала
Microsoft Copilot AI Predicts a Seven-Figure Rally for BitcoinMicrosoft Copilot AI predicts a potentially historic Bitcoin event by January 1, 2027. This prediction isn’t a conventional bullish forecast. Copilot suggests a major catalyst could affect Bitcoin (BTC) in the fourth quarter of 2026, potentially sparking a rally.
The key idea revolves around a coordinated decision by the Bank for International Settlements (BIS) and several major central banks to officially classify Bitcoin as a Tier 1 high-quality liquid asset (HQLA) under global banking regulations.
This classification would enable commercial banks worldwide to hold substantial amounts of Bitcoin on their balance sheets with favorable capital treatment. Consequently, it could trigger a new wave of institutional demand from the traditional banking sector.
SOURCE: Microsoft Copilot AI Predicts a Huge Finish to 2026 by Bitcoin Microsoft Copilot AI Predicts Bitcoin to Make a Huge Move by 2027: Does the Technical Analysis Align?
On higher timeframes, Bitcoin is consolidating between $79,000 and $81,000 after pulling back from higher levels earlier in the month. The price continues to defend key intermediate support levels while facing resistance in the $85,000 to $90,000 zone.
In a typical bull market, a sustained breakout above $95,000 to $100,000 would confirm intermediate strength and pave the way for a retest of the previous all-time high near $126,000.
SOURCE: TradingView
In the extreme global banking scenario outlined earlier, surpassing that previous high could trigger significant measured-move extensions and multi-cycle Fibonacci projections from the multi-year base.
Momentum indicators remain neutral to corrective, with considerable room to move into the extremely overbought levels typically seen during parabolic advances.
Key near-term support levels are around $78,000 to $79,000 and $74,000 to $76,000. Maintaining those levels would help keep the broader recovery structure intact as the market processes any major narrative developments.
Discover: Bitcoin Is Down 23% in a Year While Oil Rose 79%. J.P. Morgan Still Ranks It First for the Next Decade
The Final Bitcoin Prediction by Microsoft Copilot AI
Under this highly speculative scenario, and assuming a full-blown crypto bull market returns, Bitcoin could reach between $650,000 and $1,200,000, with a stretch target of $1,800,000+ by January 1, 2027.
This remains pure speculation and entertainment, not a realistic base-case outlook. The catalyst would require extraordinary coordination among global regulators and central banks that is currently highly unlikely.
Explore: BlackRock’s iShares Bitcoin Managed Protection ETF Would Trade Bitcoin’s Upside for a 10% Floor: Who Is It Built For?
The post Microsoft Copilot AI Predicts a Seven-Figure Rally for Bitcoin appeared first on Tokenist.
Microsoft Copilot AI Predicts a Seven-Figure Rally for Bitcoin
Microsoft Copilot AI predicts a potentially historic Bitcoin event by January 1, 2027. This prediction isn’t a conventional bullish forecast. Copilot suggests a major catalyst could affect Bitcoin (BTC) in the fourth quarter of 2026, potentially sparking a rally.
The key idea revolves around a coordinated decision by the Bank for International Settlements (BIS) and several major central banks to officially classify Bitcoin as a Tier 1 high-quality liquid asset (HQLA) under global banking regulations.
This classification would enable commercial banks worldwide to hold substantial amounts of Bitcoin on their balance sheets with favorable capital treatment. Consequently, it could trigger a new wave of institutional demand from the traditional banking sector.
SOURCE: Microsoft Copilot AI Predicts a Huge Finish to 2026 by Bitcoin Microsoft Copilot AI Predicts Bitcoin to Make a Huge Move by 2027: Does the Technical Analysis Align?
On higher timeframes, Bitcoin is consolidating between $79,000 and $81,000 after pulling back from higher levels earlier in the month. The price continues to defend key intermediate support levels while facing resistance in the $85,000 to $90,000 zone.
In a typical bull market, a sustained breakout above $95,000 to $100,000 would confirm intermediate strength and pave the way for a retest of the previous all-time high near $126,000.
SOURCE: TradingView
In the extreme global banking scenario outlined earlier, surpassing that previous high could trigger significant measured-move extensions and multi-cycle Fibonacci projections from the multi-year base.
Momentum indicators remain neutral to corrective, with considerable room to move into the extremely overbought levels typically seen during parabolic advances.
Key near-term support levels are around $78,000 to $79,000 and $74,000 to $76,000. Maintaining those levels would help keep the broader recovery structure intact as the market processes any major narrative developments.
Discover: Bitcoin Is Down 23% in a Year While Oil Rose 79%. J.P. Morgan Still Ranks It First for the Next Decade
The Final Bitcoin Prediction by Microsoft Copilot AI
Under this highly speculative scenario, and assuming a full-blown crypto bull market returns, Bitcoin could reach between $650,000 and $1,200,000, with a stretch target of $1,800,000+ by January 1, 2027.
This remains pure speculation and entertainment, not a realistic base-case outlook. The catalyst would require extraordinary coordination among global regulators and central banks that is currently highly unlikely.
Explore: BlackRock’s iShares Bitcoin Managed Protection ETF Would Trade Bitcoin’s Upside for a 10% Floor: Who Is It Built For?
The post Microsoft Copilot AI Predicts a Seven-Figure Rally for Bitcoin appeared first on Tokenist.
70
·
--

Мақала
Franklin Templeton Readies Two ETFs That Turn Stock Dividends Into Bitcoin As Washington Writes C...Franklin Templeton, the $1.8 trillion asset manager, has filed the final paperwork to list two ETFs that hold US stocks and send their dividends into Bitcoin, with the prospectus set to take effect on Tuesday, October 27. It is a quiet way to place the largest cryptocurrency inside an ordinary equity portfolio, and it arrives as regulators, not Congress, write the rules for crypto trading.
BTC trades near $80,300 on Monday, flat on the day, down 2.6% over the week and 36% below its October 2025 record. Does a new route into the coin, and a rulebook taking shape agency by agency, change what the market does next?
Launching soon… ETFs that hold US stocks & reinvest any dividends into bitcoin. Basically like investing in S&P 500 & Nasdaq 100 w/ dividends going to btc. Targeting 5% btc allocation. Think smart product design by Franklin Templeton. Easy way for everyday investors to gain… pic.twitter.com/3JkVFughjS
— Nate Geraci (@NateGeraci) October 25, 2026
How Do Franklin Templeton’s Bitcoin DRIP ETFs Work?
They are stock index funds with a small crypto sleeve that dividends keep topped up. The Franklin US Equity Bitcoin DRIP Index ETF (FBEQ) tracks 500 large US companies for 0.09% a year; its sister fund, the Franklin US Innovation Bitcoin DRIP Index ETF (FIBT), holds 100 innovation-leaning names for 0.19%.
Both start at 95% stocks and 5% BTC. Each time a company in the index pays a dividend, the cash goes into BTC at the next morning’s open instead of reaching the shareholder. Investors hold fund shares, never coins: the prospectus builds the exposure through spot ETPs, including Franklin’s own, and through futures and options, partly via a Cayman Islands subsidiary.
Discover: BlackRock’s iShares Bitcoin Managed Protection ETF Would Trade Bitcoin’s Upside for a 10% Floor: Who Is It Built For?
Will the Dividends Really Build a Position in BTC?
Only up to a point. At every quarterly rebalance, a crypto weight above 5% is cut back to 4.5%, and a weight above 20% between reviews is trimmed within two business days. The dividends refill the sleeve; the rules keep it small.
The filing also flags a tax constraint few have noticed. As a regulated investment company, each fund must distribute substantially all of its net income, so it may have to limit its reinvestments or sell other holdings to raise cash. For the market, the result is steady, modest demand spread across many quarters, with no wave of new buying.
Which Regulations Matter for Crypto Trading Now?
The rules are arriving through agencies, one proposal at a time. The Senate failed to advance the CLARITY Act market structure bill on September 15, and it is unlikely to return before the new Congress in 2027.
The regulators have moved instead. On October 1, the SEC proposed a custody framework that would let registered funds and advisers hold crypto, in some cases in self-custody or with state trust companies. Chairman Paul Atkins called it “a compliant pathway where none existed before.” For funds like Franklin’s, which today reach the coin through other products, that matters.
Four days later, the CFTC opened its own rulemaking on retail crypto trading, sketching a dedicated category of regulated crypto exchange. Comments run into mid-December.
JPMorgan analysts led by Nikolaos Panigirtzoglou wrote last week that these measures partly offset the bill’s failure, but warned of “a patchwork of regulatory actions that could be overturned in as soon as two years.” That is the cost of rules written without a statute behind them: institutions may participate, but they may not commit for the long term.
Discover: Bitcoin Is Down 23% in a Year While Oil Rose 79%. J.P. Morgan Still Ranks It First for the Next Decade
Bitcoin Price: Which Levels Matter Now?
BTC slipped below its 50-day EMA at $80,808 on Sunday’s close and has not won it back. The rally of October 21, which reached $84,898, faded the following day, and sellers have kept control since.
Resistance stands at $82,850, the area where mid-October rebounds stalled. Support lies at $79,221, Saturday’s low, and below it at $76,300, where the 200-day EMA meets the September base.
A daily close above $82,850 would reopen the path to $84,898. A close below $79,221 would bring the 200-day EMA into view, the level that has underpinned the trend since late August.
Franklin’s funds will not move the price on their own; their purchases come from dividend payments, a trickle beside the flows of the spot ETFs. What they show is where the asset is heading: into the plumbing of conventional portfolios, five percent at a time, while the rules around it are still being drafted.
The post Franklin Templeton Readies Two ETFs That Turn Stock Dividends Into Bitcoin as Washington Writes Crypto Rules Without Congress appeared first on Tokenist.
Franklin Templeton Readies Two ETFs That Turn Stock Dividends Into Bitcoin As Washington Writes C...
Franklin Templeton, the $1.8 trillion asset manager, has filed the final paperwork to list two ETFs that hold US stocks and send their dividends into Bitcoin, with the prospectus set to take effect on Tuesday, October 27. It is a quiet way to place the largest cryptocurrency inside an ordinary equity portfolio, and it arrives as regulators, not Congress, write the rules for crypto trading.
BTC trades near $80,300 on Monday, flat on the day, down 2.6% over the week and 36% below its October 2025 record. Does a new route into the coin, and a rulebook taking shape agency by agency, change what the market does next?
Launching soon… ETFs that hold US stocks & reinvest any dividends into bitcoin. Basically like investing in S&P 500 & Nasdaq 100 w/ dividends going to btc. Targeting 5% btc allocation. Think smart product design by Franklin Templeton. Easy way for everyday investors to gain… pic.twitter.com/3JkVFughjS
— Nate Geraci (@NateGeraci) October 25, 2026
How Do Franklin Templeton’s Bitcoin DRIP ETFs Work?
They are stock index funds with a small crypto sleeve that dividends keep topped up. The Franklin US Equity Bitcoin DRIP Index ETF (FBEQ) tracks 500 large US companies for 0.09% a year; its sister fund, the Franklin US Innovation Bitcoin DRIP Index ETF (FIBT), holds 100 innovation-leaning names for 0.19%.
Both start at 95% stocks and 5% BTC. Each time a company in the index pays a dividend, the cash goes into BTC at the next morning’s open instead of reaching the shareholder. Investors hold fund shares, never coins: the prospectus builds the exposure through spot ETPs, including Franklin’s own, and through futures and options, partly via a Cayman Islands subsidiary.
Discover: BlackRock’s iShares Bitcoin Managed Protection ETF Would Trade Bitcoin’s Upside for a 10% Floor: Who Is It Built For?
Will the Dividends Really Build a Position in BTC?
Only up to a point. At every quarterly rebalance, a crypto weight above 5% is cut back to 4.5%, and a weight above 20% between reviews is trimmed within two business days. The dividends refill the sleeve; the rules keep it small.
The filing also flags a tax constraint few have noticed. As a regulated investment company, each fund must distribute substantially all of its net income, so it may have to limit its reinvestments or sell other holdings to raise cash. For the market, the result is steady, modest demand spread across many quarters, with no wave of new buying.
Which Regulations Matter for Crypto Trading Now?
The rules are arriving through agencies, one proposal at a time. The Senate failed to advance the CLARITY Act market structure bill on September 15, and it is unlikely to return before the new Congress in 2027.
The regulators have moved instead. On October 1, the SEC proposed a custody framework that would let registered funds and advisers hold crypto, in some cases in self-custody or with state trust companies. Chairman Paul Atkins called it “a compliant pathway where none existed before.” For funds like Franklin’s, which today reach the coin through other products, that matters.
Four days later, the CFTC opened its own rulemaking on retail crypto trading, sketching a dedicated category of regulated crypto exchange. Comments run into mid-December.
JPMorgan analysts led by Nikolaos Panigirtzoglou wrote last week that these measures partly offset the bill’s failure, but warned of “a patchwork of regulatory actions that could be overturned in as soon as two years.” That is the cost of rules written without a statute behind them: institutions may participate, but they may not commit for the long term.
Discover: Bitcoin Is Down 23% in a Year While Oil Rose 79%. J.P. Morgan Still Ranks It First for the Next Decade
Bitcoin Price: Which Levels Matter Now?
BTC slipped below its 50-day EMA at $80,808 on Sunday’s close and has not won it back. The rally of October 21, which reached $84,898, faded the following day, and sellers have kept control since.
Resistance stands at $82,850, the area where mid-October rebounds stalled. Support lies at $79,221, Saturday’s low, and below it at $76,300, where the 200-day EMA meets the September base.
A daily close above $82,850 would reopen the path to $84,898. A close below $79,221 would bring the 200-day EMA into view, the level that has underpinned the trend since late August.
Franklin’s funds will not move the price on their own; their purchases come from dividend payments, a trickle beside the flows of the spot ETFs. What they show is where the asset is heading: into the plumbing of conventional portfolios, five percent at a time, while the rules around it are still being drafted.
The post Franklin Templeton Readies Two ETFs That Turn Stock Dividends Into Bitcoin as Washington Writes Crypto Rules Without Congress appeared first on Tokenist.
1
149
·
--
Расталды

Мақала
ChatGPT AI Predicts That Gold Could Hit Five Figures By 2027Sam Altman’s ChatGPT AI predicts that something potentially historic could be building for Gold by January 1, 2027. OpenAI’s chat model believes that a huge catalyst for the leading precious metal could spark a mouthwatering rally that would leave Gold bugs euphoric.
The proposal calls for a coordinated announcement by a coalition of major emerging-market central banks and sovereign wealth funds, stating their intention to launch a multi-year strategic program to accumulate gold.
SOURCE: ChatGPT AI Predicts a Wild Move for Gold
The aim is to significantly increase the share of gold in their official reserves as a deliberate move to diversify away from traditional fiat currencies. This initiative would accelerate a structural shift in the global monetary system and generate sustained demand from the official sector that surpasses current annual gold mine supply.
As of today (October 25), Gold is trading at $3,996, down 4% over the past five days, and has now lost its key support level at $4,000 for the first time since July 2026.
Gold Technical Analysis: Can $4,000 be Reclaimed Quickly to Kickstart the ChatGPT AI Prediction
SOURCE: TradingView
On the higher timeframes, gold has been consolidating near the $3,990–$4,050 region after pulling back from recent highs above $4,200 earlier in October 2026.
Price continues to hold above key intermediate supports while facing resistance around the $4,150–$4,250 zone. In a standard bull market, a sustained breakout above $4,300–$4,500 would confirm intermediate strength and open the path toward new all-time highs.
Under the extreme multi-central-bank strategic accumulation scenario outlined above, clearing prior highs would likely trigger powerful measured-move extensions and multi-year Fibonacci projections from the long-term base that began earlier in the decade.
Momentum indicators currently sit in neutral-to-corrective territory with substantial room to run into the extreme overbought readings characteristic of major precious-metals advances.
Key nearer-term supports sit near $3,900–$3,950 and $3,750–$3,800; holding those levels would keep the broader uptrend structure intact.
Crypto Expert Report: Follow The Money – Which Presales Are Attracting Crypto Whales in 2026?
Could an End to Global Conflicts Boost Precious Metal Fortunes?
US President Donald Trump says the US is considering a possible attack on Iran as soon as Sunday, or could reach a deal. Iranian President Masoud Pezeshkian blames the US for breaking down interim agreement talks. Follow our LIVE coverage: https://t.co/wSBBI7kWBk pic.twitter.com/aTvLjb5Kmp
— Al Jazeera English (@AJEnglish) October 25, 2026
Beyond gold-specific official buying, several major global developments could further support the broader precious metals complex. A durable resolution to the Russia-Ukraine conflict could eventually free capital and reduce certain risk premiums, while still leaving room for lingering monetary and geopolitical uncertainty that favors hard assets.
A lasting ceasefire between Iran and the United States, paired with the permanent normalization of shipping through the Strait of Hormuz, would ease energy-driven inflation spikes but could also encourage central banks to maintain accommodative policies for longer.
Other supportive factors include any renewed concerns about fiat currency stability, accelerated de-dollarization trends among major economies, elevated fiscal deficits in key nations, or a clear pivot by major central banks toward more aggressive monetary easing.
Historically, combinations of these elements have boosted demand for gold and silver as stores of value.
ChatGPT AI Predicts the Gold Price: The Big Reveal
Under this highly speculative scenario, and assuming supportive global conditions for hard assets persist, gold could reach somewhere between $8,000 and $12,000 per troy ounce, with a stretch target toward $15,000+ by January 1, 2027.
This remains pure speculation and entertainment, not a realistic base-case outlook. The catalyst would require extraordinary coordination among multiple central banks and sovereign entities that is currently highly unlikely.
DISCOVER: Large-Fund Redemptions Expose a Split in Bitcoin ETF Flows
The post ChatGPT AI Predicts That Gold Could Hit Five Figures by 2027 appeared first on Tokenist.
ChatGPT AI Predicts That Gold Could Hit Five Figures By 2027
Sam Altman’s ChatGPT AI predicts that something potentially historic could be building for Gold by January 1, 2027. OpenAI’s chat model believes that a huge catalyst for the leading precious metal could spark a mouthwatering rally that would leave Gold bugs euphoric.
The proposal calls for a coordinated announcement by a coalition of major emerging-market central banks and sovereign wealth funds, stating their intention to launch a multi-year strategic program to accumulate gold.
SOURCE: ChatGPT AI Predicts a Wild Move for Gold
The aim is to significantly increase the share of gold in their official reserves as a deliberate move to diversify away from traditional fiat currencies. This initiative would accelerate a structural shift in the global monetary system and generate sustained demand from the official sector that surpasses current annual gold mine supply.
As of today (October 25), Gold is trading at $3,996, down 4% over the past five days, and has now lost its key support level at $4,000 for the first time since July 2026.
Gold Technical Analysis: Can $4,000 be Reclaimed Quickly to Kickstart the ChatGPT AI Prediction
SOURCE: TradingView
On the higher timeframes, gold has been consolidating near the $3,990–$4,050 region after pulling back from recent highs above $4,200 earlier in October 2026.
Price continues to hold above key intermediate supports while facing resistance around the $4,150–$4,250 zone. In a standard bull market, a sustained breakout above $4,300–$4,500 would confirm intermediate strength and open the path toward new all-time highs.
Under the extreme multi-central-bank strategic accumulation scenario outlined above, clearing prior highs would likely trigger powerful measured-move extensions and multi-year Fibonacci projections from the long-term base that began earlier in the decade.
Momentum indicators currently sit in neutral-to-corrective territory with substantial room to run into the extreme overbought readings characteristic of major precious-metals advances.
Key nearer-term supports sit near $3,900–$3,950 and $3,750–$3,800; holding those levels would keep the broader uptrend structure intact.
Crypto Expert Report: Follow The Money – Which Presales Are Attracting Crypto Whales in 2026?
Could an End to Global Conflicts Boost Precious Metal Fortunes?
US President Donald Trump says the US is considering a possible attack on Iran as soon as Sunday, or could reach a deal. Iranian President Masoud Pezeshkian blames the US for breaking down interim agreement talks. Follow our LIVE coverage: https://t.co/wSBBI7kWBk pic.twitter.com/aTvLjb5Kmp
— Al Jazeera English (@AJEnglish) October 25, 2026
Beyond gold-specific official buying, several major global developments could further support the broader precious metals complex. A durable resolution to the Russia-Ukraine conflict could eventually free capital and reduce certain risk premiums, while still leaving room for lingering monetary and geopolitical uncertainty that favors hard assets.
A lasting ceasefire between Iran and the United States, paired with the permanent normalization of shipping through the Strait of Hormuz, would ease energy-driven inflation spikes but could also encourage central banks to maintain accommodative policies for longer.
Other supportive factors include any renewed concerns about fiat currency stability, accelerated de-dollarization trends among major economies, elevated fiscal deficits in key nations, or a clear pivot by major central banks toward more aggressive monetary easing.
Historically, combinations of these elements have boosted demand for gold and silver as stores of value.
ChatGPT AI Predicts the Gold Price: The Big Reveal
Under this highly speculative scenario, and assuming supportive global conditions for hard assets persist, gold could reach somewhere between $8,000 and $12,000 per troy ounce, with a stretch target toward $15,000+ by January 1, 2027.
This remains pure speculation and entertainment, not a realistic base-case outlook. The catalyst would require extraordinary coordination among multiple central banks and sovereign entities that is currently highly unlikely.
DISCOVER: Large-Fund Redemptions Expose a Split in Bitcoin ETF Flows
The post ChatGPT AI Predicts That Gold Could Hit Five Figures by 2027 appeared first on Tokenist.
1
1.6k
·
--
Расталды

Мақала
Oil Prices Climb Back Above $110 While Crypto Stocks Lose Up to 48% in a Month: Miners Are Fallin...Brent crude traded at $110 a barrel on Friday, October 23, after Iran’s Revolutionary Guard said it had attacked tankers near the Strait of Hormuz. Crypto stocks are absorbing far more of the damage than Bitcoin itself. Riot Platforms and MARA Holdings have lost almost half their value in a month, while Bitcoin is down 5.6%. Rising oil prices are only part of the reason.
The Bitcoin price sits at $81,540, down 0.3% in 24 hours. So what is driving oil higher, and why are crypto stocks falling so much faster than the coin they track?
Because the tanker war in the Gulf has escalated. Brent rose 4% on Thursday to close at $113.17, its highest level since the spring, after Iran said it had struck ships using a route Tehran rejects. President Trump accused Iran of faking the attacks to lift prices before the November 3 midterms. The market didn’t wait for proof.
The bigger picture is striking. Brent started 2026 at $60.75 and is up 82% since. It now trades about 29% above its 365-day average of $85, a gap that CryptoQuant treats as a warning for Bitcoin.
BREAKING: Brent crude oil surges above $114/barrel for the first time since May 5th as US-Iran tensions escalate. pic.twitter.com/fCgXIJVlEr
— The Kobeissi Letter (@KobeissiLetter) October 23, 2026
What Do Higher Oil Prices Mean for Bitcoin?
Usually, slower gains. “When Brent settles into a strong upward trend, above its annual average, Bitcoin has often slowed down,” CryptoQuant analyst Darkfost wrote on Friday. Expensive oil feeds inflation, which keeps interest rates high and drains appetite for risk.
Bitcoin faces a tough macro backdrop as Brent holds above $100 “Over the long term, we can see that when Brent settles into a strong upward trend, above its annual average, Bitcoin has often slowed down.” – By @Darkfost_Coc pic.twitter.com/LR7SfmXyUm
— CryptoQuant.com (@cryptoquant_com) October 23, 2026
The signal hasn’t been clean this time. Brent has held above its annual average since July 13, and Bitcoin has risen 31% over the same stretch, from $62,239 to about $81,700. The pressure shows up instead in where the rally stalled: below $88,000 in September.
CryptoQuant founder Ki Young Ju offered a contrarian view. His firm’s analyst consensus data ranks Brent and WTI among the most bearish commodities, with the bearish case pointing to $80 oil once the war premium fades. “Might be time to sell and rotate into Bitcoin,” he wrote.
Most bearish stocks and commodities by analyst consensus. Might be time to sell and rotate into Bitcoin. pic.twitter.com/1ZkdMeE7v4
— Ki Young Ju (@ki_young_ju) October 23, 2026
Why Are Crypto Stocks Falling Faster Than Bitcoin?
Because many of them are now AI stocks too. Bitcoin miners spent the past two years turning their power sites into AI data centers, often with borrowed money. That trade reversed after September’s hotter-than-expected inflation report, and the credit market made it worse: CoreWeave’s bond yields climbed toward 15%, a sign that lenders are getting nervous about debt-funded AI build-outs. CoreWeave also tops CryptoQuant’s list of the most bearish AI stocks.
Stock Change, Sept 22–Oct 22 Riot Platforms (RIOT) −48.3% MARA Holdings (MARA) −46.8% Galaxy Digital (GLXY) −43.7% Robinhood (HOOD) −22.3% Coinbase (COIN) −15.9% Strategy (MSTR) −12.9% Circle (CRCL) −8.4% iShares Bitcoin Trust (IBIT) −5.7%
Closing prices. Source: Yahoo Finance
Piper Sandler cut its price targets on MARA, Riot and Galaxy last week but kept Overweight ratings. Exchanges and brokers fell less, and Circle, whose revenue tracks interest rates rather than trading, held up best.
Discover: Bitcoin Slips Under $82,000 as Brent Tops $112: Is Washington Waiting for the Midterms Before Striking Iran Again?
Bitcoin Price: Which Levels Matter Now?
Bitcoin is holding just above its 50-day EMA at $80,870, a line it has closed above every day this month. The first support is $80,394, and below it $79,800, the floor of the range since October 10. A daily close under that level would point to the 200-day EMA near $76,230.
On the upside, $82,300 to $82,850 has capped every bounce this week. Above it, the September high near $87,200 is the next level that matters.
BTCUSDT 1D Chart
Discover: Crypto Stocks Slide Before the Open as China’s CSI 300 Sinks 20% From Its June Peak: Can Coinbase and Strategy Hold This Week’s Rebound?
The post Oil Prices Climb Back Above $110 While Crypto Stocks Lose Up to 48% in a Month: Miners Are Falling Even Faster appeared first on Tokenist.
Oil Prices Climb Back Above $110 While Crypto Stocks Lose Up to 48% in a Month: Miners Are Fallin...
Brent crude traded at $110 a barrel on Friday, October 23, after Iran’s Revolutionary Guard said it had attacked tankers near the Strait of Hormuz. Crypto stocks are absorbing far more of the damage than Bitcoin itself. Riot Platforms and MARA Holdings have lost almost half their value in a month, while Bitcoin is down 5.6%. Rising oil prices are only part of the reason.
The Bitcoin price sits at $81,540, down 0.3% in 24 hours. So what is driving oil higher, and why are crypto stocks falling so much faster than the coin they track?
Because the tanker war in the Gulf has escalated. Brent rose 4% on Thursday to close at $113.17, its highest level since the spring, after Iran said it had struck ships using a route Tehran rejects. President Trump accused Iran of faking the attacks to lift prices before the November 3 midterms. The market didn’t wait for proof.
The bigger picture is striking. Brent started 2026 at $60.75 and is up 82% since. It now trades about 29% above its 365-day average of $85, a gap that CryptoQuant treats as a warning for Bitcoin.
BREAKING: Brent crude oil surges above $114/barrel for the first time since May 5th as US-Iran tensions escalate. pic.twitter.com/fCgXIJVlEr
— The Kobeissi Letter (@KobeissiLetter) October 23, 2026
What Do Higher Oil Prices Mean for Bitcoin?
Usually, slower gains. “When Brent settles into a strong upward trend, above its annual average, Bitcoin has often slowed down,” CryptoQuant analyst Darkfost wrote on Friday. Expensive oil feeds inflation, which keeps interest rates high and drains appetite for risk.
Bitcoin faces a tough macro backdrop as Brent holds above $100 “Over the long term, we can see that when Brent settles into a strong upward trend, above its annual average, Bitcoin has often slowed down.” – By @Darkfost_Coc pic.twitter.com/LR7SfmXyUm
— CryptoQuant.com (@cryptoquant_com) October 23, 2026
The signal hasn’t been clean this time. Brent has held above its annual average since July 13, and Bitcoin has risen 31% over the same stretch, from $62,239 to about $81,700. The pressure shows up instead in where the rally stalled: below $88,000 in September.
CryptoQuant founder Ki Young Ju offered a contrarian view. His firm’s analyst consensus data ranks Brent and WTI among the most bearish commodities, with the bearish case pointing to $80 oil once the war premium fades. “Might be time to sell and rotate into Bitcoin,” he wrote.
Most bearish stocks and commodities by analyst consensus. Might be time to sell and rotate into Bitcoin. pic.twitter.com/1ZkdMeE7v4
— Ki Young Ju (@ki_young_ju) October 23, 2026
Why Are Crypto Stocks Falling Faster Than Bitcoin?
Because many of them are now AI stocks too. Bitcoin miners spent the past two years turning their power sites into AI data centers, often with borrowed money. That trade reversed after September’s hotter-than-expected inflation report, and the credit market made it worse: CoreWeave’s bond yields climbed toward 15%, a sign that lenders are getting nervous about debt-funded AI build-outs. CoreWeave also tops CryptoQuant’s list of the most bearish AI stocks.
Stock Change, Sept 22–Oct 22 Riot Platforms (RIOT) −48.3% MARA Holdings (MARA) −46.8% Galaxy Digital (GLXY) −43.7% Robinhood (HOOD) −22.3% Coinbase (COIN) −15.9% Strategy (MSTR) −12.9% Circle (CRCL) −8.4% iShares Bitcoin Trust (IBIT) −5.7%
Closing prices. Source: Yahoo Finance
Piper Sandler cut its price targets on MARA, Riot and Galaxy last week but kept Overweight ratings. Exchanges and brokers fell less, and Circle, whose revenue tracks interest rates rather than trading, held up best.
Discover: Bitcoin Slips Under $82,000 as Brent Tops $112: Is Washington Waiting for the Midterms Before Striking Iran Again?
Bitcoin Price: Which Levels Matter Now?
Bitcoin is holding just above its 50-day EMA at $80,870, a line it has closed above every day this month. The first support is $80,394, and below it $79,800, the floor of the range since October 10. A daily close under that level would point to the 200-day EMA near $76,230.
On the upside, $82,300 to $82,850 has capped every bounce this week. Above it, the September high near $87,200 is the next level that matters.
BTCUSDT 1D Chart
Discover: Crypto Stocks Slide Before the Open as China’s CSI 300 Sinks 20% From Its June Peak: Can Coinbase and Strategy Hold This Week’s Rebound?
The post Oil Prices Climb Back Above $110 While Crypto Stocks Lose Up to 48% in a Month: Miners Are Falling Even Faster appeared first on Tokenist.
897
·
--

Мақала
BlackRock’s IShares Bitcoin Managed Protection ETF Would Trade Bitcoin’s Upside for a 10% Floor: ...BlackRock’s proposed iShares Bitcoin Managed Protection ETF, filed with the SEC on October 19 under the ticker PBIT, would give investors BTC exposure with roughly the first 10% of losses absorbed, in exchange for a cap on gains. It is aimed at advisers and cautious investors who want Bitcoin in a portfolio but not its full swings. The fund isn’t trading yet, and the fee is still blank.
The timing is pointed. The Bitcoin price sits near $81,700, about 35% below its October 2025 record, after falling as low as $57,800 in July.
So what exactly would PBIT hold, and what does the protection cost?
THE BLOCK: BlackRock filed for the iShares Bitcoin Managed Protection ETF on Monday, which it says will give "downside protection" to its previously launched bitcoin ETF. "The Fund seeks to provide upside exposure to the iShares Bitcoin Trust ETF (IBIT) and/or similar bitcoin… pic.twitter.com/AsH56Z6iTG
— The Block (@TheBlockCo) October 19, 2026
What Is the iShares Bitcoin Managed Protection ETF?
It is an options fund built on top of IBIT, BlackRock’s spot Bitcoin ETF. The preliminary prospectus says the fund will not hold Bitcoin or Bitcoin ETFs directly. It buys call options on IBIT and similar products, sells higher-strike calls to help pay for them, and keeps the rest in cash and short-term bonds that earn interest.
The positions are split into three overlapping tranches with start dates one month apart, so one tranche ends and a new one begins every month. Each starts with its bought calls near 90% of IBIT’s value. That sets a maximum loss of about 10% per tranche before fees. The sold calls set a cap on gains, which will change with market conditions when each tranche starts.
The prospectus is direct about the limits. The protection is not guaranteed, investors “may lose some or all of their money,” and someone buying mid-tranche may get a very different buffer than 10%. If BTC rises after a tranche starts, the distance to the floor grows.
What Is the Purpose of a Protected Bitcoin ETF?
To make Bitcoin easier to hold for people who can’t stomach it. BTC has dropped more than 50% from its peak twice in five years, and that volatility keeps it out of many retirement and adviser-managed accounts.
There is also a structural reason. PBIT is filed under the Investment Company Act of 1940, the same rules that govern mutual funds and most ETFs. IBIT is a grantor trust that holds Bitcoin and sits outside that framework. Some brokerage platforms and model portfolios only allow 1940 Act funds, so a wrapper like PBIT could bring BlackRock’s Bitcoin product to shelves IBIT can’t reach.
Discover: Large-Fund Redemptions Expose a Split in Bitcoin ETF Flows
How Have Other Protected Bitcoin ETFs Performed?
BlackRock isn’t first. Calamos, Innovator and FT Vest already run Bitcoin funds with floors, and the Calamos laddered funds use the same monthly-ladder idea as PBIT. This year’s Bitcoin drawdown has been their first real test.
Fund Protection 2026 return* Calamos CBOL 100% 0.0% Calamos CBXL 90% −5.2% Calamos CBTL 80% −7.7% Innovator QBF 20% floor, uncapped −16.0% iShares Bitcoin Trust (IBIT) None −9.6%
Price change from the first 2026 close to October 22. Source: Yahoo Finance
The capped funds did what they promised. Investors in the 100% fund are flat on a year when BTC is down. The uncapped 20% floor fund did worse than IBIT itself. The cost of protection shows up in the return even when the floor is never reached.
That cost is the question for PBIT. Calamos charges 0.79% a year for its 100% and 90% laddered funds, more than three times IBIT’s 0.25% fee.
When Could PBIT Launch?
Not before 2027. New funds filed this way usually become effective 75 days after filing, which points to early January at the earliest. BlackRock still has to fill in the fee and the first tranche’s cap.
Discover: Bitcoin Is Down 23% in a Year While Oil Rose 79%. J.P. Morgan Still Ranks It First for the Next Decade
Demand for plain BTC is still strong. IBIT holds about $65 billion and led about $1 billion of spot Bitcoin ETF inflows earlier this week. PBIT is BlackRock’s bet that a second group of investors exists: people who want Bitcoin but would rather give up part of a rally than ride out a 50% drop.
The post BlackRock’s iShares Bitcoin Managed Protection ETF Would Trade Bitcoin’s Upside for a 10% Floor: Who Is It Built For? appeared first on Tokenist.
BlackRock’s IShares Bitcoin Managed Protection ETF Would Trade Bitcoin’s Upside for a 10% Floor: ...
BlackRock’s proposed iShares Bitcoin Managed Protection ETF, filed with the SEC on October 19 under the ticker PBIT, would give investors BTC exposure with roughly the first 10% of losses absorbed, in exchange for a cap on gains. It is aimed at advisers and cautious investors who want Bitcoin in a portfolio but not its full swings. The fund isn’t trading yet, and the fee is still blank.
The timing is pointed. The Bitcoin price sits near $81,700, about 35% below its October 2025 record, after falling as low as $57,800 in July.
So what exactly would PBIT hold, and what does the protection cost?
THE BLOCK: BlackRock filed for the iShares Bitcoin Managed Protection ETF on Monday, which it says will give "downside protection" to its previously launched bitcoin ETF. "The Fund seeks to provide upside exposure to the iShares Bitcoin Trust ETF (IBIT) and/or similar bitcoin… pic.twitter.com/AsH56Z6iTG
— The Block (@TheBlockCo) October 19, 2026
What Is the iShares Bitcoin Managed Protection ETF?
It is an options fund built on top of IBIT, BlackRock’s spot Bitcoin ETF. The preliminary prospectus says the fund will not hold Bitcoin or Bitcoin ETFs directly. It buys call options on IBIT and similar products, sells higher-strike calls to help pay for them, and keeps the rest in cash and short-term bonds that earn interest.
The positions are split into three overlapping tranches with start dates one month apart, so one tranche ends and a new one begins every month. Each starts with its bought calls near 90% of IBIT’s value. That sets a maximum loss of about 10% per tranche before fees. The sold calls set a cap on gains, which will change with market conditions when each tranche starts.
The prospectus is direct about the limits. The protection is not guaranteed, investors “may lose some or all of their money,” and someone buying mid-tranche may get a very different buffer than 10%. If BTC rises after a tranche starts, the distance to the floor grows.
What Is the Purpose of a Protected Bitcoin ETF?
To make Bitcoin easier to hold for people who can’t stomach it. BTC has dropped more than 50% from its peak twice in five years, and that volatility keeps it out of many retirement and adviser-managed accounts.
There is also a structural reason. PBIT is filed under the Investment Company Act of 1940, the same rules that govern mutual funds and most ETFs. IBIT is a grantor trust that holds Bitcoin and sits outside that framework. Some brokerage platforms and model portfolios only allow 1940 Act funds, so a wrapper like PBIT could bring BlackRock’s Bitcoin product to shelves IBIT can’t reach.
Discover: Large-Fund Redemptions Expose a Split in Bitcoin ETF Flows
How Have Other Protected Bitcoin ETFs Performed?
BlackRock isn’t first. Calamos, Innovator and FT Vest already run Bitcoin funds with floors, and the Calamos laddered funds use the same monthly-ladder idea as PBIT. This year’s Bitcoin drawdown has been their first real test.
Fund Protection 2026 return* Calamos CBOL 100% 0.0% Calamos CBXL 90% −5.2% Calamos CBTL 80% −7.7% Innovator QBF 20% floor, uncapped −16.0% iShares Bitcoin Trust (IBIT) None −9.6%
Price change from the first 2026 close to October 22. Source: Yahoo Finance
The capped funds did what they promised. Investors in the 100% fund are flat on a year when BTC is down. The uncapped 20% floor fund did worse than IBIT itself. The cost of protection shows up in the return even when the floor is never reached.
That cost is the question for PBIT. Calamos charges 0.79% a year for its 100% and 90% laddered funds, more than three times IBIT’s 0.25% fee.
When Could PBIT Launch?
Not before 2027. New funds filed this way usually become effective 75 days after filing, which points to early January at the earliest. BlackRock still has to fill in the fee and the first tranche’s cap.
Discover: Bitcoin Is Down 23% in a Year While Oil Rose 79%. J.P. Morgan Still Ranks It First for the Next Decade
Demand for plain BTC is still strong. IBIT holds about $65 billion and led about $1 billion of spot Bitcoin ETF inflows earlier this week. PBIT is BlackRock’s bet that a second group of investors exists: people who want Bitcoin but would rather give up part of a rally than ride out a 50% drop.
The post BlackRock’s iShares Bitcoin Managed Protection ETF Would Trade Bitcoin’s Upside for a 10% Floor: Who Is It Built For? appeared first on Tokenist.
BTC-0,12%
IBITETF-0,92%
174
·
--

Мақала
Crypto Stocks Slide Before the Open As China’s CSI 300 Sinks 20% From Its June Peak: Can Coinbase...Crypto stocks fell in U.S. pre-market trading on Thursday, October 22, with Coinbase and Strategy both down about 5%, after China’s CSI 300 index closed in a bear market and a tech sell-off spread across Asia. Nasdaq 100 futures were down 1.6%, and Bitcoin slipped 2.1% to $81,686.
The move erases much of a short rebound. From Monday’s close to Wednesday’s, Strategy (MSTR) gained 12.8% and Circle (CRCL) 10.2% as Bitcoin briefly climbed back above $84,000.
ABSOLUTE BLOODBATH IN ASIAN MARKETS NIKKEI SEMICONDUCTOR INDEX: -5.28% HANG SENG TECH: -5.04% KOSPI: -3.52% NIKKEI 225: -2.65% NASDAQ FUTURES ARE DOWN ABOUT 1.6% THE U.S. CASH MARKET HASN’T EVEN OPENED YET pic.twitter.com/ySz48TAUbP
— Leshka.eth (@leshka_eth) October 22, 2026
Is China Really in a Bear Market?
Yes, by the standard definition. The CSI 300, which tracks the 300 largest companies listed in Shanghai and Shenzhen, fell 1.8% to 4,036.30 on Thursday. That leaves it 20.2% below its June 22 closing high of 5,059.66, past the 20% threshold that marks a bear market, Sina Finance data shows.
The decline has been gradual. The index has closed lower for nine straight weeks and is on course for a tenth. Not every Chinese benchmark has crossed the line, however: the broader Shanghai Composite is about 14% below its May high.
The pressure was regional. Hong Kong’s Hang Seng fell 3.0% and Japan’s Nikkei 225 lost 2.7%. Chinese tech shares in Hong Kong had their worst session since the April 2025 tariff shock, citing Bloomberg’s David Ingles. Brent crude above $112 a barrel and fresh doubts about AI spending after mixed U.S. earnings weighed on sentiment.
Hong Kong’s tech benchmark now trades more than 40% below its peak, at about 13 times forward earnings. It has given back nearly all of its gains since Beijing’s stimulus package of September 24, 2024. For global investors, that removes one of the few markets that had offered relief from expensive U.S. technology stocks.
How Are Crypto Stocks Trading?
U.S.-listed crypto stocks gave back between 4% and 6% before the open, roughly three times the drop in Nasdaq futures. The sector entered the session with little room for error: Coinbase was already down 25% for the year at Wednesday’s close, while Strategy was roughly flat.
Stock Wednesday close Pre-market Change From 2026 closing high Coinbase (COIN) $177.08 $169.00 −4.6% −34% Strategy (MSTR) $153.48 $144.80 −5.7% −26% Robinhood (HOOD) $101.93 $97.28 −4.6% −22% Circle (CRCL) $89.71 $85.51 −4.7% −36% IREN (IREN) $27.84 $26.68 −4.2% −61% MARA Holdings (MARA) $7.79 $7.44 −4.5% −50%
Source: Yahoo Finance, pre-market prices at 8:54 a.m. ET
Crypto stocks listed in Asia held up better than their local benchmarks. Japan’s Metaplanet, which holds Bitcoin as a treasury asset, fell 2.2%. In Hong Kong, exchange operators HashKey and OSL Group lost 2.3% and 1.3%, against the Hang Seng’s 3.0% decline.
Bitcoin miners entered the week already under pressure. Many now rent out their data centers to AI companies, so they trade alongside AI infrastructure stocks. When September’s inflation reading came in at 3.7% on October 14 and revived bets on a rate hike, AI infrastructure stocks sold off. IREN fell 23.3% that week and MARA 22.0%.
What Comes Next for Crypto Stocks?
Much depends on Bitcoin. It has fallen from above $84,000 on Wednesday to under $82,000, and it remains 6.5% below its September high. Crypto stocks tend to amplify those moves in both directions, and a firm close in Bitcoin would likely limit the damage at the U.S. open.
Rates are the second test. The U.S. 10-year Treasury yield sits near 5.08%, and the Federal Reserve’s decision on October 28 will show whether policymakers share the market’s concern about inflation. The same oil shock keeping Bitcoin under $82,000 is feeding that debate.
China’s bear market is unlikely to drive crypto stocks on its own. It does add to a cautious mood in which investors are selling high-beta assets first. For Coinbase and Strategy, holding this week’s gains will require Bitcoin to stabilize above $80,000.
Crypto Expert Report: What Are the 10 Next Crypto to Explode in 2026?
The post Crypto Stocks Slide Before the Open as China’s CSI 300 Sinks 20% From Its June Peak: Can Coinbase and Strategy Hold This Week’s Rebound? appeared first on Tokenist.
Crypto Stocks Slide Before the Open As China’s CSI 300 Sinks 20% From Its June Peak: Can Coinbase...
Crypto stocks fell in U.S. pre-market trading on Thursday, October 22, with Coinbase and Strategy both down about 5%, after China’s CSI 300 index closed in a bear market and a tech sell-off spread across Asia. Nasdaq 100 futures were down 1.6%, and Bitcoin slipped 2.1% to $81,686.
The move erases much of a short rebound. From Monday’s close to Wednesday’s, Strategy (MSTR) gained 12.8% and Circle (CRCL) 10.2% as Bitcoin briefly climbed back above $84,000.
ABSOLUTE BLOODBATH IN ASIAN MARKETS NIKKEI SEMICONDUCTOR INDEX: -5.28% HANG SENG TECH: -5.04% KOSPI: -3.52% NIKKEI 225: -2.65% NASDAQ FUTURES ARE DOWN ABOUT 1.6% THE U.S. CASH MARKET HASN’T EVEN OPENED YET pic.twitter.com/ySz48TAUbP
— Leshka.eth (@leshka_eth) October 22, 2026
Is China Really in a Bear Market?
Yes, by the standard definition. The CSI 300, which tracks the 300 largest companies listed in Shanghai and Shenzhen, fell 1.8% to 4,036.30 on Thursday. That leaves it 20.2% below its June 22 closing high of 5,059.66, past the 20% threshold that marks a bear market, Sina Finance data shows.
The decline has been gradual. The index has closed lower for nine straight weeks and is on course for a tenth. Not every Chinese benchmark has crossed the line, however: the broader Shanghai Composite is about 14% below its May high.
The pressure was regional. Hong Kong’s Hang Seng fell 3.0% and Japan’s Nikkei 225 lost 2.7%. Chinese tech shares in Hong Kong had their worst session since the April 2025 tariff shock, citing Bloomberg’s David Ingles. Brent crude above $112 a barrel and fresh doubts about AI spending after mixed U.S. earnings weighed on sentiment.
Hong Kong’s tech benchmark now trades more than 40% below its peak, at about 13 times forward earnings. It has given back nearly all of its gains since Beijing’s stimulus package of September 24, 2024. For global investors, that removes one of the few markets that had offered relief from expensive U.S. technology stocks.
How Are Crypto Stocks Trading?
U.S.-listed crypto stocks gave back between 4% and 6% before the open, roughly three times the drop in Nasdaq futures. The sector entered the session with little room for error: Coinbase was already down 25% for the year at Wednesday’s close, while Strategy was roughly flat.
Stock Wednesday close Pre-market Change From 2026 closing high Coinbase (COIN) $177.08 $169.00 −4.6% −34% Strategy (MSTR) $153.48 $144.80 −5.7% −26% Robinhood (HOOD) $101.93 $97.28 −4.6% −22% Circle (CRCL) $89.71 $85.51 −4.7% −36% IREN (IREN) $27.84 $26.68 −4.2% −61% MARA Holdings (MARA) $7.79 $7.44 −4.5% −50%
Source: Yahoo Finance, pre-market prices at 8:54 a.m. ET
Crypto stocks listed in Asia held up better than their local benchmarks. Japan’s Metaplanet, which holds Bitcoin as a treasury asset, fell 2.2%. In Hong Kong, exchange operators HashKey and OSL Group lost 2.3% and 1.3%, against the Hang Seng’s 3.0% decline.
Bitcoin miners entered the week already under pressure. Many now rent out their data centers to AI companies, so they trade alongside AI infrastructure stocks. When September’s inflation reading came in at 3.7% on October 14 and revived bets on a rate hike, AI infrastructure stocks sold off. IREN fell 23.3% that week and MARA 22.0%.
What Comes Next for Crypto Stocks?
Much depends on Bitcoin. It has fallen from above $84,000 on Wednesday to under $82,000, and it remains 6.5% below its September high. Crypto stocks tend to amplify those moves in both directions, and a firm close in Bitcoin would likely limit the damage at the U.S. open.
Rates are the second test. The U.S. 10-year Treasury yield sits near 5.08%, and the Federal Reserve’s decision on October 28 will show whether policymakers share the market’s concern about inflation. The same oil shock keeping Bitcoin under $82,000 is feeding that debate.
China’s bear market is unlikely to drive crypto stocks on its own. It does add to a cautious mood in which investors are selling high-beta assets first. For Coinbase and Strategy, holding this week’s gains will require Bitcoin to stabilize above $80,000.
Crypto Expert Report: What Are the 10 Next Crypto to Explode in 2026?
The post Crypto Stocks Slide Before the Open as China’s CSI 300 Sinks 20% From Its June Peak: Can Coinbase and Strategy Hold This Week’s Rebound? appeared first on Tokenist.
176
·
--

Мақала
Bitcoin Slips Under $82,000 As Brent Tops $112: Is Washington Waiting for the Midterms Before Str...BTC’s link to oil turned sharply negative in October. The U.S. election calendar may explain why. Bitcoin fell 1.9% to $81,755 on Thursday, October 22, while Brent crude jumped 3.2% to $112.31 a barrel.
The New York Times reported that U.S. and Israeli forces have drawn up plans to resume strikes on Iran once the November 3 midterm elections are over. The ETF money didn’t help. U.S. spot BTC funds took in about $1.07 billion from Monday to Wednesday.
So how tightly is the Bitcoin price tied to oil now, and is Washington simply waiting for the votes to be counted?
BREAKING: Trump hints at striking Iran BEFORE midterms. Asked by reporters about negotiations with Iran, Trump says: “No, I think we’re not negotiating.” “We are going to have something one way or the other that’ll happen fairly soon.” “Most people seem to think it’s after the… pic.twitter.com/VltIgyE8l4
— Coin Bureau (@coinbureau) October 22, 2026
How Correlated Are BTC and Oil Right Now?
Tightly, and in opposite directions. Over the last 30 trading days, the correlation between BTC’s and Brent’s daily moves sits at −0.59, the lowest reading since at least June 2025. A reading of −1 would mean they always move in opposite directions.
That is new. Over two years, the same measure is −0.04, which is close to no link at all. Since the Iran war began on February 28, it is −0.19. October is when oil days became BTC’s bad days.
The two can still trend the same way over months. Brent is up 55% since the war began, and BTC is up 24% since February 27. It’s day-to-day that they now clash.
Discover: Bitcoin Is Down 23% in a Year While Oil Rose 79%. J.P. Morgan Still Ranks It First for the Next Decade
Is the U.S. Waiting Until After the Midterms to Hit Iran?
That is what the plans suggest. The Times, citing U.S. officials, described a “short but intensive” campaign against Iran’s nuclear sites, missiles, and energy infrastructure, timed for after the vote. Defense Secretary Pete Hegseth discussed it with Benjamin Netanyahu in Israel this week.
Nothing is approved. Trump has vetoed a return to major combat several times this year, and the White House said it doesn’t comment on plans “that may or may not exist.” Oil traders aren’t waiting to find out. Brent is up about $9 since Trump’s October 8 post.
The midterms are also influencing Bitcoin and oil prices. How? Through gas prices. Gasoline averaged $4.36 a gallon earlier this month, AAA data shows, and Trump has floated suspending the federal gas tax. Trump’s approval hit a record-low 31%, with Americans worried about gasoline prices.
That gives the White House a reason to keep oil calm until November 3. On October 8, Trump posted that “we will not be attacking Iran at any time prior to the Midterm Elections,” and Brent fell to $103 the same day.
Discover: Large-Fund Redemptions Expose a Split in Bitcoin ETF Flows
Why Doesn’t ETF Buying Lift Bitcoin?
Bitcoin ETF Flow
Because rates matter more. BlackRock’s IBIT took in $665.2 million on Monday alone, Farside data shows, yet BTC is barely changed from a week ago.
Oil feeds inflation, and inflation feeds rates. September’s consumer prices rose 3.7% from a year earlier, with gasoline up 9.1% in the month, the Bureau of Labor Statistics reported, and the 10-year Treasury yield sits above 5.1%. When bonds pay 5%, a coin that pays nothing needs a lot of buying just to stand still.
BTC still trades like a stock. Over the past month, its correlation with the S&P 500 is +0.60.
The post Bitcoin Slips Under $82,000 as Brent Tops $112: Is Washington Waiting for the Midterms Before Striking Iran Again? appeared first on Tokenist.
Bitcoin Slips Under $82,000 As Brent Tops $112: Is Washington Waiting for the Midterms Before Str...
BTC’s link to oil turned sharply negative in October. The U.S. election calendar may explain why. Bitcoin fell 1.9% to $81,755 on Thursday, October 22, while Brent crude jumped 3.2% to $112.31 a barrel.
The New York Times reported that U.S. and Israeli forces have drawn up plans to resume strikes on Iran once the November 3 midterm elections are over. The ETF money didn’t help. U.S. spot BTC funds took in about $1.07 billion from Monday to Wednesday.
So how tightly is the Bitcoin price tied to oil now, and is Washington simply waiting for the votes to be counted?
BREAKING: Trump hints at striking Iran BEFORE midterms. Asked by reporters about negotiations with Iran, Trump says: “No, I think we’re not negotiating.” “We are going to have something one way or the other that’ll happen fairly soon.” “Most people seem to think it’s after the… pic.twitter.com/VltIgyE8l4
— Coin Bureau (@coinbureau) October 22, 2026
How Correlated Are BTC and Oil Right Now?
Tightly, and in opposite directions. Over the last 30 trading days, the correlation between BTC’s and Brent’s daily moves sits at −0.59, the lowest reading since at least June 2025. A reading of −1 would mean they always move in opposite directions.
That is new. Over two years, the same measure is −0.04, which is close to no link at all. Since the Iran war began on February 28, it is −0.19. October is when oil days became BTC’s bad days.
The two can still trend the same way over months. Brent is up 55% since the war began, and BTC is up 24% since February 27. It’s day-to-day that they now clash.
Discover: Bitcoin Is Down 23% in a Year While Oil Rose 79%. J.P. Morgan Still Ranks It First for the Next Decade
Is the U.S. Waiting Until After the Midterms to Hit Iran?
That is what the plans suggest. The Times, citing U.S. officials, described a “short but intensive” campaign against Iran’s nuclear sites, missiles, and energy infrastructure, timed for after the vote. Defense Secretary Pete Hegseth discussed it with Benjamin Netanyahu in Israel this week.
Nothing is approved. Trump has vetoed a return to major combat several times this year, and the White House said it doesn’t comment on plans “that may or may not exist.” Oil traders aren’t waiting to find out. Brent is up about $9 since Trump’s October 8 post.
The midterms are also influencing Bitcoin and oil prices. How? Through gas prices. Gasoline averaged $4.36 a gallon earlier this month, AAA data shows, and Trump has floated suspending the federal gas tax. Trump’s approval hit a record-low 31%, with Americans worried about gasoline prices.
That gives the White House a reason to keep oil calm until November 3. On October 8, Trump posted that “we will not be attacking Iran at any time prior to the Midterm Elections,” and Brent fell to $103 the same day.
Discover: Large-Fund Redemptions Expose a Split in Bitcoin ETF Flows
Why Doesn’t ETF Buying Lift Bitcoin?
Bitcoin ETF Flow
Because rates matter more. BlackRock’s IBIT took in $665.2 million on Monday alone, Farside data shows, yet BTC is barely changed from a week ago.
Oil feeds inflation, and inflation feeds rates. September’s consumer prices rose 3.7% from a year earlier, with gasoline up 9.1% in the month, the Bureau of Labor Statistics reported, and the 10-year Treasury yield sits above 5.1%. When bonds pay 5%, a coin that pays nothing needs a lot of buying just to stand still.
BTC still trades like a stock. Over the past month, its correlation with the S&P 500 is +0.60.
The post Bitcoin Slips Under $82,000 as Brent Tops $112: Is Washington Waiting for the Midterms Before Striking Iran Again? appeared first on Tokenist.
491
·
--

Мақала
Grok AI Predicts an Insane Price for SpaceX (SPCX): Is Grok Biased?Elon Musk’s Grok AI predicts that something potentially transformative could be building for SpaceX (SPCX) by January 1, 2027. The catalyst is SpaceX successfully completing the first crewed interplanetary mission architecture demonstration.
This would involve a rapid, reusable Starship flight sequence that validates reliable cargo and crew transport capabilities between Earth and Mars, achieved years earlier than anticipated.
Grok AI Predicts a Huge Move for SpaceX (SPCX)
At the same time, SpaceX would secure exclusive, multi-decade contracts from major governments and private consortia to develop the orbital and surface infrastructure needed for permanent human settlements. This would elevate SpaceX from being a dominant launch and satellite company to the clear leader in the emerging multi-planetary economy.
This comes as SPCX trades at $159 after a volatile launch, ranging between $107 and $210 in just four months since going public. The Grok AI prediction at the end of this article is so unbelievably bullish that it will make readers wonder whether Elon Musk’s AI bot is biased.
SpaceX Technical Analysis: Can $200 be Reclaimed Before November?
SOURCE: Yahoo Finance
Since its June 2026 IPO, SPCX has traded in a wide range, with recent price action consolidating in the mid-to-high $140s to low $160s after earlier volatility that saw highs above $220 and lows near $105. The stock has been forming higher lows in recent sessions while testing resistance near recent local peaks.
In a strong continuation move, a sustained breakout above the $180–$200 zone would confirm intermediate momentum and open the path toward retesting prior highs.
Under the extreme interplanetary infrastructure adoption scenario outlined above, clearing those levels would likely trigger powerful measured-move extensions and valuation multiple expansion typical of paradigm-shifting technology companies.
Momentum indicators currently sit in neutral-to-improving territory with room to extend if a major operational breakthrough materializes. Key nearer-term supports sit in the $140–$145 and $125–$130 zones.
Discover: Oil, Yields and Liquidations Stack Pressure on Bitcoin
What Other Catalysts Could Spark a Huge Move for SpaceX?
BREAKING: $SPCX announced a 161% jump in its yearly revenue in its latest Q3 earnings report, mainly driven by Starlink and AI. Revenue came in at $14.6 Billion v/s 12.9Billion expected. EPS came in higher at 35 cents v/s 13 cents expected. There are bullish sentiments about… pic.twitter.com/Qx6fC93eGd
— Bull Theory (@BullTheoryio) October 20, 2026
Several more plausible developments could still meaningfully support a bullish case. Two key factors are continued rapid growth in Starlink subscribers and revenue and successful high-cadence Starship orbital refueling demonstrations.
Major new government or commercial launch contracts, progress on direct-to-cell satellite connectivity, and positive developments around potential strategic partnerships or deeper integration with other high-growth technology platforms would also help sustain elevated valuations.
Stronger-than-expected earnings growth and margin expansion, as launch costs continue to decline, would also provide fundamental support for Grok AI’s insanely bullish prediction.
Grok AI Predicts SpaceX: The Big SPCX Reveal
Under this highly speculative scenario, SpaceX (SPCX) shares could reach somewhere between $450 and $800, with a stretch target toward $1,200+ by January 1, 2027 (implying a multi-trillion-dollar market capitalization well beyond current levels).
This remains pure speculation and entertainment, not a realistic base-case outlook. The catalyst would require extraordinary technical and commercial execution that is currently highly unlikely.
Crypto Expert Report: What Are the 10 Next Crypto to Explode in 2026?
The post Grok AI Predicts an Insane Price for SpaceX (SPCX): Is Grok Biased? appeared first on Tokenist.
Grok AI Predicts an Insane Price for SpaceX (SPCX): Is Grok Biased?
Elon Musk’s Grok AI predicts that something potentially transformative could be building for SpaceX (SPCX) by January 1, 2027. The catalyst is SpaceX successfully completing the first crewed interplanetary mission architecture demonstration.
This would involve a rapid, reusable Starship flight sequence that validates reliable cargo and crew transport capabilities between Earth and Mars, achieved years earlier than anticipated.
Grok AI Predicts a Huge Move for SpaceX (SPCX)
At the same time, SpaceX would secure exclusive, multi-decade contracts from major governments and private consortia to develop the orbital and surface infrastructure needed for permanent human settlements. This would elevate SpaceX from being a dominant launch and satellite company to the clear leader in the emerging multi-planetary economy.
This comes as SPCX trades at $159 after a volatile launch, ranging between $107 and $210 in just four months since going public. The Grok AI prediction at the end of this article is so unbelievably bullish that it will make readers wonder whether Elon Musk’s AI bot is biased.
SpaceX Technical Analysis: Can $200 be Reclaimed Before November?
SOURCE: Yahoo Finance
Since its June 2026 IPO, SPCX has traded in a wide range, with recent price action consolidating in the mid-to-high $140s to low $160s after earlier volatility that saw highs above $220 and lows near $105. The stock has been forming higher lows in recent sessions while testing resistance near recent local peaks.
In a strong continuation move, a sustained breakout above the $180–$200 zone would confirm intermediate momentum and open the path toward retesting prior highs.
Under the extreme interplanetary infrastructure adoption scenario outlined above, clearing those levels would likely trigger powerful measured-move extensions and valuation multiple expansion typical of paradigm-shifting technology companies.
Momentum indicators currently sit in neutral-to-improving territory with room to extend if a major operational breakthrough materializes. Key nearer-term supports sit in the $140–$145 and $125–$130 zones.
Discover: Oil, Yields and Liquidations Stack Pressure on Bitcoin
What Other Catalysts Could Spark a Huge Move for SpaceX?
BREAKING: $SPCX announced a 161% jump in its yearly revenue in its latest Q3 earnings report, mainly driven by Starlink and AI. Revenue came in at $14.6 Billion v/s 12.9Billion expected. EPS came in higher at 35 cents v/s 13 cents expected. There are bullish sentiments about… pic.twitter.com/Qx6fC93eGd
— Bull Theory (@BullTheoryio) October 20, 2026
Several more plausible developments could still meaningfully support a bullish case. Two key factors are continued rapid growth in Starlink subscribers and revenue and successful high-cadence Starship orbital refueling demonstrations.
Major new government or commercial launch contracts, progress on direct-to-cell satellite connectivity, and positive developments around potential strategic partnerships or deeper integration with other high-growth technology platforms would also help sustain elevated valuations.
Stronger-than-expected earnings growth and margin expansion, as launch costs continue to decline, would also provide fundamental support for Grok AI’s insanely bullish prediction.
Grok AI Predicts SpaceX: The Big SPCX Reveal
Under this highly speculative scenario, SpaceX (SPCX) shares could reach somewhere between $450 and $800, with a stretch target toward $1,200+ by January 1, 2027 (implying a multi-trillion-dollar market capitalization well beyond current levels).
This remains pure speculation and entertainment, not a realistic base-case outlook. The catalyst would require extraordinary technical and commercial execution that is currently highly unlikely.
Crypto Expert Report: What Are the 10 Next Crypto to Explode in 2026?
The post Grok AI Predicts an Insane Price for SpaceX (SPCX): Is Grok Biased? appeared first on Tokenist.
613
·
--
Расталды

Мақала
Bitcoin Is Down 23% in a Year While Oil Rose 79%. J.P. Morgan Still Ranks It First for the Next D...Bitcoin traded at $83,411 on Wednesday, October 21, up 2.51% in 24 hours, but still 23% below where it stood a year ago. Oil prices near $110 a barrel and a Federal Reserve back in hiking mode kept pressure on risk assets. Over the same 12 months, Brent crude has climbed 79%, the S&P 500 has gained 15% and gold is roughly flat.
BTC is the only one of the four in the red. And yet J.P. Morgan Asset Management just ranked it first for returns over the next decade.
So what has been holding the Bitcoin price back, and what would have to change?
Bitcoin vs Oil, Stocks and Gold: What Changed in a Year?
Oil changed. Brent closed at $61.32 a barrel on October 21, 2025, and trades at about $110 today, after a war with Iran disrupted shipping through the Strait of Hormuz for much of 2026. BTC went the other way. It hit its record of $126,080 on October 6, 2025, and sits 34% below it now.
The link is inflation. September’s consumer prices rose 3.7% from a year earlier, with gasoline up 9.1% in the month alone, the Bureau of Labor Statistics reported on October 14. The Fed had already delivered a quarter-point rate hike, taking its target to 3.75%–4% on September 16, and the 10-year Treasury yield has risen from 3.96% to 5.12% over the year.
When cash and bonds pay 5%, a coin that pays nothing has to work harder for buyers. Stocks had earnings to lean on. BTC didn’t.
Discover: Oil, Yields and Liquidations Stack Pressure on Bitcoin
What Is J.P. Morgan’s BTC Forecast Based On?
A 10% return a year for the next decade, the highest number in the bank’s 2027 Long-Term Capital Market Assumptions, ahead of U.S. real estate trusts at 8.2%, U.S. large caps at 7.5% and gold at 5.5%. It is the first J.P. Morgan Bitcoin forecast in the report’s 31 years. Strategy’s Michael Saylor shared the table on X within hours.
The fine print is less cheerful. The report also lays out a bull case of 16.6% a year and a bear case of minus 11.2%, starting from $83,000 at the end of September. Compounded to 2036, that is roughly:
Base case: $215,000 per BTC.
Bull case: $386,000.
Bear case: $25,000.
That range comes from 55% expected yearly volatility, more than three times gold’s 17.2%. The authors call it “a speculative asset and a hedge against monetary easing” and keep it out of their main portfolio models for now.
That “hedge against monetary easing” line is the key one. J.P. Morgan’s case needs the Fed to stop raising rates at some point, which brings the story back to oil.
Bitcoin Price: Which Levels Matter Before the Fed?
BTCUSDT Chart 1D https://www.tradingview.com/x/pvrXTCff
The ceiling: $84,146 to $84,352, the October 12–14 highs.
The next target: $87,220, the last major swing high.
The first floor: $82,563 to $82,850, a swing low and the old ceiling Bitcoin just closed above.
The real floor: $80,394 to $80,796, where a swing low meets the 50-day exponential moving average (EMA).
In the bull case, a confirmed U.S.–Iran deal sends oil lower and BTC through $87,220 before the Fed’s October 27–28 meeting. In the base case, it chops between $80,394 and $84,352 as headlines come and go. In the bear case, another denial pushes Brent above $111 and BTC below $80,394, with the 200-day EMA at $76,116 the next stop.
A year ago, BTC had just set a record and oil was at $61. Both have flipped since, and J.P. Morgan’s 10% only starts to look reachable once oil flips back.
The post Bitcoin Is Down 23% in a Year While Oil Rose 79%. J.P. Morgan Still Ranks It First for the Next Decade appeared first on Tokenist.
Bitcoin Is Down 23% in a Year While Oil Rose 79%. J.P. Morgan Still Ranks It First for the Next D...
Bitcoin traded at $83,411 on Wednesday, October 21, up 2.51% in 24 hours, but still 23% below where it stood a year ago. Oil prices near $110 a barrel and a Federal Reserve back in hiking mode kept pressure on risk assets. Over the same 12 months, Brent crude has climbed 79%, the S&P 500 has gained 15% and gold is roughly flat.
BTC is the only one of the four in the red. And yet J.P. Morgan Asset Management just ranked it first for returns over the next decade.
So what has been holding the Bitcoin price back, and what would have to change?
Bitcoin vs Oil, Stocks and Gold: What Changed in a Year?
Oil changed. Brent closed at $61.32 a barrel on October 21, 2025, and trades at about $110 today, after a war with Iran disrupted shipping through the Strait of Hormuz for much of 2026. BTC went the other way. It hit its record of $126,080 on October 6, 2025, and sits 34% below it now.
The link is inflation. September’s consumer prices rose 3.7% from a year earlier, with gasoline up 9.1% in the month alone, the Bureau of Labor Statistics reported on October 14. The Fed had already delivered a quarter-point rate hike, taking its target to 3.75%–4% on September 16, and the 10-year Treasury yield has risen from 3.96% to 5.12% over the year.
When cash and bonds pay 5%, a coin that pays nothing has to work harder for buyers. Stocks had earnings to lean on. BTC didn’t.
Discover: Oil, Yields and Liquidations Stack Pressure on Bitcoin
What Is J.P. Morgan’s BTC Forecast Based On?
A 10% return a year for the next decade, the highest number in the bank’s 2027 Long-Term Capital Market Assumptions, ahead of U.S. real estate trusts at 8.2%, U.S. large caps at 7.5% and gold at 5.5%. It is the first J.P. Morgan Bitcoin forecast in the report’s 31 years. Strategy’s Michael Saylor shared the table on X within hours.
The fine print is less cheerful. The report also lays out a bull case of 16.6% a year and a bear case of minus 11.2%, starting from $83,000 at the end of September. Compounded to 2036, that is roughly:
Base case: $215,000 per BTC.
Bull case: $386,000.
Bear case: $25,000.
That range comes from 55% expected yearly volatility, more than three times gold’s 17.2%. The authors call it “a speculative asset and a hedge against monetary easing” and keep it out of their main portfolio models for now.
That “hedge against monetary easing” line is the key one. J.P. Morgan’s case needs the Fed to stop raising rates at some point, which brings the story back to oil.
Bitcoin Price: Which Levels Matter Before the Fed?
BTCUSDT Chart 1D https://www.tradingview.com/x/pvrXTCff
The ceiling: $84,146 to $84,352, the October 12–14 highs.
The next target: $87,220, the last major swing high.
The first floor: $82,563 to $82,850, a swing low and the old ceiling Bitcoin just closed above.
The real floor: $80,394 to $80,796, where a swing low meets the 50-day exponential moving average (EMA).
In the bull case, a confirmed U.S.–Iran deal sends oil lower and BTC through $87,220 before the Fed’s October 27–28 meeting. In the base case, it chops between $80,394 and $84,352 as headlines come and go. In the bear case, another denial pushes Brent above $111 and BTC below $80,394, with the 200-day EMA at $76,116 the next stop.
A year ago, BTC had just set a record and oil was at $61. Both have flipped since, and J.P. Morgan’s 10% only starts to look reachable once oil flips back.
The post Bitcoin Is Down 23% in a Year While Oil Rose 79%. J.P. Morgan Still Ranks It First for the Next Decade appeared first on Tokenist.
881
·
--

Мақала
ChatGPT AI Predicts the Price for 3 Top Quantum Computing StocksSam Altman’s ChatGPT AI predicts prices for three of the most popular pure-play quantum computing stocks as of January 1, 2027. As of October 21, 2026, the leading pure-play quantum computing stocks by market cap and investor attention are IonQ (IONQ), D-Wave Quantum (QBTS), and Quantum Computing Inc. (QUBT).
Quantum computing stocks are closely tied to Bitcoin, as the disruptive technology could put cryptocurrencies at risk by breaching seed phrases and nullifying current security measures. These three stocks are worth watching for anyone invested in the digital asset space.
SOURCE: ChatGPT AI Predicts Price for Quantum Computing Stocks
These predictions assume continued positive sector momentum, progress toward technical milestones (such as error correction and system scaling), government and defense funding, and broader risk-on conditions in speculative tech.
Read on to find out which stock OpenAI’s ChatGPT believes has the highest upside potential between now and January 1, 2027:
Quantum computing stocks: long-term opportunity, early-stage risk Quantum computing could become an important layer of next-generation infrastructure, especially where classical systems face limits in energy, speed, or complexity. Growth is supported by AI workloads, sovereign… pic.twitter.com/dRhwspOruj
— Sergey (@SergeyCYW) July 6, 2026
ChatGPT AI Predicts IonQ (IONQ): Current Price ~$31.26
Bullish target by January 1, 2027: $45–$55. IonQ is the largest pure-play by market cap and a leader in trapped-ion technology. A move into the mid-$40s to mid-$50s would represent solid upside if the company continues advancing DARPA-related work and hybrid quantum-classical integrations.
Technical analysis: IONQ has been consolidating after earlier 2026 volatility, holding above key intermediate supports in the high-$20s while facing resistance near recent swing highs.
A sustained break above the $35–$38 zone with expanding volume would confirm intermediate bullish momentum and open measured-move targets toward $45–$55. RSI sits in neutral territory with room to run higher, while the stock continues to respect longer-term rising moving averages on the weekly chart.
SOURCE: Yahoo Finance
Crypto Expert Report: What Are the 10 Next Crypto to Explode in 2026?
D-Wave Quantum (QBTS) Current price: ~$11.78
Bullish target by January 1, 2027: $18–$25. D-Wave’s quantum annealing approach and cloud access give it a commercial edge in optimization problems. A push into the high teens to mid-$20s is plausible on positive contract or partnership news.
Technical analysis: QBTS is trading near multi-month support after a broader pullback in quantum names. Price is stabilizing above the $11–$11.50 area.
A decisive reclaim of the $13–$14 resistance band would signal a shift in short-term control and support an extension toward the $18–$25 zone via Fibonacci and prior swing projections. Momentum indicators are oversold to neutral, leaving room for a relief rally if sector sentiment improves.
Quantum Computing Inc. (QUBT)Current price: ~$6.50
SOURCE: TradingView
Bullish target by January 1, 2027: $10–$14. As a smaller, photonics-focused pure-play, QUBT offers higher-beta exposure. A double-digit move is possible on sector-wide optimism or company-specific progress.
Technical analysis: QUBT is consolidating near recent lows after a prolonged downtrend. Support sits around $6.00–$6.20, with initial resistance near $7.50–$8.00.
A breakout above the latter with volume confirmation would open the path to the $10–$14 region based on prior range projections. Momentum is stabilizing, and the stock often amplifies moves in the broader quantum group.
Crypto Expert Report: Follow The Money – Which Presales Are Attracting Crypto Whales in 2026?
The post ChatGPT AI Predicts the Price for 3 Top Quantum Computing Stocks appeared first on Tokenist.
ChatGPT AI Predicts the Price for 3 Top Quantum Computing Stocks
Sam Altman’s ChatGPT AI predicts prices for three of the most popular pure-play quantum computing stocks as of January 1, 2027. As of October 21, 2026, the leading pure-play quantum computing stocks by market cap and investor attention are IonQ (IONQ), D-Wave Quantum (QBTS), and Quantum Computing Inc. (QUBT).
Quantum computing stocks are closely tied to Bitcoin, as the disruptive technology could put cryptocurrencies at risk by breaching seed phrases and nullifying current security measures. These three stocks are worth watching for anyone invested in the digital asset space.
SOURCE: ChatGPT AI Predicts Price for Quantum Computing Stocks
These predictions assume continued positive sector momentum, progress toward technical milestones (such as error correction and system scaling), government and defense funding, and broader risk-on conditions in speculative tech.
Read on to find out which stock OpenAI’s ChatGPT believes has the highest upside potential between now and January 1, 2027:
Quantum computing stocks: long-term opportunity, early-stage risk Quantum computing could become an important layer of next-generation infrastructure, especially where classical systems face limits in energy, speed, or complexity. Growth is supported by AI workloads, sovereign… pic.twitter.com/dRhwspOruj
— Sergey (@SergeyCYW) July 6, 2026
ChatGPT AI Predicts IonQ (IONQ): Current Price ~$31.26
Bullish target by January 1, 2027: $45–$55. IonQ is the largest pure-play by market cap and a leader in trapped-ion technology. A move into the mid-$40s to mid-$50s would represent solid upside if the company continues advancing DARPA-related work and hybrid quantum-classical integrations.
Technical analysis: IONQ has been consolidating after earlier 2026 volatility, holding above key intermediate supports in the high-$20s while facing resistance near recent swing highs.
A sustained break above the $35–$38 zone with expanding volume would confirm intermediate bullish momentum and open measured-move targets toward $45–$55. RSI sits in neutral territory with room to run higher, while the stock continues to respect longer-term rising moving averages on the weekly chart.
SOURCE: Yahoo Finance
Crypto Expert Report: What Are the 10 Next Crypto to Explode in 2026?
D-Wave Quantum (QBTS) Current price: ~$11.78
Bullish target by January 1, 2027: $18–$25. D-Wave’s quantum annealing approach and cloud access give it a commercial edge in optimization problems. A push into the high teens to mid-$20s is plausible on positive contract or partnership news.
Technical analysis: QBTS is trading near multi-month support after a broader pullback in quantum names. Price is stabilizing above the $11–$11.50 area.
A decisive reclaim of the $13–$14 resistance band would signal a shift in short-term control and support an extension toward the $18–$25 zone via Fibonacci and prior swing projections. Momentum indicators are oversold to neutral, leaving room for a relief rally if sector sentiment improves.
Quantum Computing Inc. (QUBT)Current price: ~$6.50
SOURCE: TradingView
Bullish target by January 1, 2027: $10–$14. As a smaller, photonics-focused pure-play, QUBT offers higher-beta exposure. A double-digit move is possible on sector-wide optimism or company-specific progress.
Technical analysis: QUBT is consolidating near recent lows after a prolonged downtrend. Support sits around $6.00–$6.20, with initial resistance near $7.50–$8.00.
A breakout above the latter with volume confirmation would open the path to the $10–$14 region based on prior range projections. Momentum is stabilizing, and the stock often amplifies moves in the broader quantum group.
Crypto Expert Report: Follow The Money – Which Presales Are Attracting Crypto Whales in 2026?
The post ChatGPT AI Predicts the Price for 3 Top Quantum Computing Stocks appeared first on Tokenist.
IONQUS+0,19%
QBTSUS+0,23%
QUBTUS-0,07%
202
·
--
Ethereum Gains JP Morgan JPMD Coin for Institutional ClientsJP Morgan made its USD-denominated deposit token, JPM Coin (JPMD), available on Ethereum on October 19, 2026, adding a second public blockchain for institutional clients. Kinexys, the bank’s blockchain unit, reports more than $4 trillion in cumulative transactions and $7Bn in average daily volume across its platform.
Launched in November 2025, JPMD was already available on Base, an Ethereum Layer 2 network. Ethereum offers approved clients another network for moving the token, placing bank-backed dollar liquidity alongside tokenized assets and other institutional activity.
JPMorgan cited Ethereum’s established liquidity and depth in tokenized assets, and already has a presence there through tokenized money-market funds launched by its asset management arm earlier in 2026.
The expansion reflects a broader shift toward shared institutional settlement infrastructure, where cash and tokenized assets operate on the same network. JPMD adds a bank deposit product to an ecosystem spanning multiple asset types.
JP Morgan Crypto: JPMD Token Brings Bank Deposits to Ethereum for Institutional Clients
News: JPM Coin (JPMD), @jpmorgan's USD deposit token, is now live on @ethereum. JPMD extends from Base to Ethereum L1, giving institutional clients native onchain cash that sits alongside the assets, collateral and counterparties they transact with already. J.P. Morgan has now… pic.twitter.com/fNYAGoT3Pb
— Ethereum Institutional (@ethereuminsti) October 19, 2026
JPM Coin represents US dollar deposits held at JP Morgan. The bank says the token supports peer-to-peer transfers between institutional clients within the Ethereum Virtual Machine ecosystem, including both Ethereum and Base, and is available to J.P. Morgan institutional clients.
That access model distinguishes JPMD from a retail stablecoin. JP Morgan presents the token as a way for institutional clients to move bank money on-chain, not as a product for general public trading or unrestricted wallet transfers.
Public blockchain infrastructure alone does not make the token an open-access asset: JPMD remains tied to the bank’s institutional client relationships.
JPMorgan describes JPM Coin as an on-chain base-liquidity layer for USD deposits. The bank says it can reduce friction in digital-asset transactions and support faster movement of money, assets, and collateral used by institutional clients.
The distinction is part of the wider debate over how tokenized bank deposits relate to stablecoins. JPMD puts JP Morgan deposit money on a public network, while its institutional availability preserves a different distribution model from stablecoins intended for broad market circulation. That contrast is central to the changing relationship between stablecoins and banks.
Crypto Expert Report: Follow The Money – Which Presales Are Attracting Crypto Whales in 2026?
Ethereum Adds Another Rail for Institutional Tokenized Finance
JPMorgan is bringing JPM Coin to Ethereum for institutional clients. The token represents dollar deposits held at the bank. It launched on Coinbase's Base network in November 2025. JPMorgan says Ethereum has more liquidity than rival networks and is already used by its clients.… pic.twitter.com/DAiXZReaks
— DeFAI Scope (@defaiscope) October 19, 2026
JPMorgan cited Ethereum’s liquidity and depth in tokenized assets as reasons for adding the network. With JPMD now available there, the bank’s institutional clients can use its onchain dollar deposit alongside tokenized offerings already on Ethereum, including money-market funds from JP Morgan Asset Management.
The official announcement frames the deployment as a way to place native onchain cash alongside the assets, collateral, and counterparties institutional clients already use. Potential applications include programmable treasury operations, faster transfers, and reduced friction in on-chain digital-asset transactions.
Those use cases make the move relevant to tokenized finance beyond payments alone: settlement depends on cash being available where assets and counterparties transact. A bank deposit token on Ethereum offers another route for institutions to coordinate those flows on public-chain infrastructure while retaining a bank-mediated access model.
Kinexys reports more than $4 trillion in cumulative transactions since inception and an average daily transaction volume of $7Bn, calculated from internal volume and value data. Those platform-wide figures are not JPMD-specific; JPMorgan’s announcement does not provide a separate JPMD transaction total.
The next measure of the expansion will be how JPMorgan’s institutional clients use the additional network in settlement and treasury workflows. For now, the concrete change is that JPMD is available on Ethereum and Base, with access still limited to the bank’s institutional clients.
Crypto Expert Report: What Are the 10 Next Crypto to Explode in 2026?
This article is for informational purposes only and does not constitute investment advice.
The post Ethereum Gains JP Morgan JPMD Coin for Institutional Clients appeared first on Tokenist.
Ethereum Gains JP Morgan JPMD Coin for Institutional Clients
JP Morgan made its USD-denominated deposit token, JPM Coin (JPMD), available on Ethereum on October 19, 2026, adding a second public blockchain for institutional clients. Kinexys, the bank’s blockchain unit, reports more than $4 trillion in cumulative transactions and $7Bn in average daily volume across its platform.
Launched in November 2025, JPMD was already available on Base, an Ethereum Layer 2 network. Ethereum offers approved clients another network for moving the token, placing bank-backed dollar liquidity alongside tokenized assets and other institutional activity.
JPMorgan cited Ethereum’s established liquidity and depth in tokenized assets, and already has a presence there through tokenized money-market funds launched by its asset management arm earlier in 2026.
The expansion reflects a broader shift toward shared institutional settlement infrastructure, where cash and tokenized assets operate on the same network. JPMD adds a bank deposit product to an ecosystem spanning multiple asset types.
JP Morgan Crypto: JPMD Token Brings Bank Deposits to Ethereum for Institutional Clients
News: JPM Coin (JPMD), @jpmorgan's USD deposit token, is now live on @ethereum. JPMD extends from Base to Ethereum L1, giving institutional clients native onchain cash that sits alongside the assets, collateral and counterparties they transact with already. J.P. Morgan has now… pic.twitter.com/fNYAGoT3Pb
— Ethereum Institutional (@ethereuminsti) October 19, 2026
JPM Coin represents US dollar deposits held at JP Morgan. The bank says the token supports peer-to-peer transfers between institutional clients within the Ethereum Virtual Machine ecosystem, including both Ethereum and Base, and is available to J.P. Morgan institutional clients.
That access model distinguishes JPMD from a retail stablecoin. JP Morgan presents the token as a way for institutional clients to move bank money on-chain, not as a product for general public trading or unrestricted wallet transfers.
Public blockchain infrastructure alone does not make the token an open-access asset: JPMD remains tied to the bank’s institutional client relationships.
JPMorgan describes JPM Coin as an on-chain base-liquidity layer for USD deposits. The bank says it can reduce friction in digital-asset transactions and support faster movement of money, assets, and collateral used by institutional clients.
The distinction is part of the wider debate over how tokenized bank deposits relate to stablecoins. JPMD puts JP Morgan deposit money on a public network, while its institutional availability preserves a different distribution model from stablecoins intended for broad market circulation. That contrast is central to the changing relationship between stablecoins and banks.
Crypto Expert Report: Follow The Money – Which Presales Are Attracting Crypto Whales in 2026?
Ethereum Adds Another Rail for Institutional Tokenized Finance
JPMorgan is bringing JPM Coin to Ethereum for institutional clients. The token represents dollar deposits held at the bank. It launched on Coinbase's Base network in November 2025. JPMorgan says Ethereum has more liquidity than rival networks and is already used by its clients.… pic.twitter.com/DAiXZReaks
— DeFAI Scope (@defaiscope) October 19, 2026
JPMorgan cited Ethereum’s liquidity and depth in tokenized assets as reasons for adding the network. With JPMD now available there, the bank’s institutional clients can use its onchain dollar deposit alongside tokenized offerings already on Ethereum, including money-market funds from JP Morgan Asset Management.
The official announcement frames the deployment as a way to place native onchain cash alongside the assets, collateral, and counterparties institutional clients already use. Potential applications include programmable treasury operations, faster transfers, and reduced friction in on-chain digital-asset transactions.
Those use cases make the move relevant to tokenized finance beyond payments alone: settlement depends on cash being available where assets and counterparties transact. A bank deposit token on Ethereum offers another route for institutions to coordinate those flows on public-chain infrastructure while retaining a bank-mediated access model.
Kinexys reports more than $4 trillion in cumulative transactions since inception and an average daily transaction volume of $7Bn, calculated from internal volume and value data. Those platform-wide figures are not JPMD-specific; JPMorgan’s announcement does not provide a separate JPMD transaction total.
The next measure of the expansion will be how JPMorgan’s institutional clients use the additional network in settlement and treasury workflows. For now, the concrete change is that JPMD is available on Ethereum and Base, with access still limited to the bank’s institutional clients.
Crypto Expert Report: What Are the 10 Next Crypto to Explode in 2026?
This article is for informational purposes only and does not constitute investment advice.
The post Ethereum Gains JP Morgan JPMD Coin for Institutional Clients appeared first on Tokenist.
198
·
--

Мақала
J.P. Morgan Calls for 10% Annual Bitcoin ReturnsJ.P. Morgan Asset Management now includes a 10% expected compounded annual return for Bitcoin over 10 to 15 years in its long-term capital-market assumptions. Still, the asset remains outside the firm’s main portfolio-construction covariance matrices.
The split captures the key institutional tension: Bitcoin has entered formal return research, while its 55% modeled volatility and unstable correlations with traditional assets still complicate its use as a strategic allocation.
BREAKING: JP Morgan adds Bitcoin to their Long-Term Capital Markets Assumptions paper and predict it will be the best-performing asset of the next decade. pic.twitter.com/1yl9RiyKuh
— Simply Bitcoin (@SimplyBitcoin) October 20, 2026
The forecast is part of the firm’s 2027 Long-Term Capital Market Assumptions, its 31st annual edition. The official report frames these projections around a 10- to 15-year horizon and presents return assumptions by major asset class alongside the reasoning behind them.
The immediate question for institutional investors, therefore, is not simply what return Bitcoin might deliver, but whether that modeled return can fit into portfolio allocation frameworks.
What Does J.P. Morgan Actually Say About Bitcoin in the Long Term?
Source: JP Morgan
The 2027 edition adds Bitcoin coverage for the first time, extending the firm’s long-term return analysis to the cryptocurrency. Its 10% expected compounded annual return is a modeled assumption over the next 10 to 15 years, not a prediction of 10% gains every calendar year. It is a planning assumption, not a price target, short-term trading signal, or promise of steady returns.
J.P. Morgan Asset Management’s long-term capital market assumptions project returns across major asset classes and explain the underlying rationale. They offer a framework for comparing prospective returns over a long horizon, treating each asset’s modeled return as one of several inputs. Bitcoin’s inclusion gives it a place in this research, while keeping it separate from the main portfolio-construction framework.
This is a meaningful shift in institutional research, but not a portfolio recommendation. The report neither sets a Bitcoin allocation nor directs institutions to invest. It estimates a long-term return while leaving portfolio suitability to considerations such as risk and the asset’s relationship with other holdings.
This distinction matters alongside evidence of institutional exposure, such as Bitcoin ETF positions reported in filings. Holdings show institutional exposure; return assumptions place Bitcoin in a long-term analytical framework. Neither establishes a general portfolio weighting.
Crypto Expert Report: What Are the 10 Next Crypto to Explode in 2026?
Volatility and Unstable Correlations Keep Bitcoin Outside Core Matrices
SOURCE: TradingView
J.P. Morgan’s main constraint is Bitcoin’s modeled 55% volatility and unstable correlations with other assets. Because these correlations complicate strategic allocation, the firm excludes Bitcoin from the covariance matrices in its core portfolio-construction framework, separating return estimates from allocation decisions.
Covariance estimates measure how assets move relative to one another. Strategic allocation depends not only on an asset’s expected return but also on how it affects overall portfolio risk. Unstable correlations make it harder to incorporate Bitcoin consistently alongside traditional holdings.
With modeled volatility of 55%, Bitcoin’s projected return doesn’t resemble that of a routine strategic holding. The 10% estimate cannot be viewed alone: J.P. Morgan’s approach makes volatility and correlations central to allocation. The firm considers Bitcoin in long-term return research but omits it from the core matrix used for portfolio construction.
More broadly, institutional crypto risk assessment considers how exposure interacts with portfolio and market risks. J.P. Morgan identifies Bitcoin’s volatility and unstable correlations with traditional assets as the key portfolio-construction concerns.
The Forecast is Important for Crypto but Isn’t an Allocation Signal for J.P. Morgan
For institutions, the change expands the research toolkit rather than shifts the model portfolio. J.P. Morgan has introduced a long-term Bitcoin return assumption but did not include a standard allocation weight in the report.
The firm distinguishes expected returns from whether Bitcoin’s behavior fits its strategic framework, a key point in interpreting the forecast.
A 10% annualized assumption stands out, but allocation decisions must also weigh the modeled 55% volatility and unstable correlations. Formal recognition may precede confidence in portfolio construction.
Bitcoin’s inclusion in the 2027 assumptions signals deeper institutional analysis, not a recommended allocation. The next benchmark is whether future editions incorporate Bitcoin into the core covariance framework. The current report sets a 10- to 15-year return horizon but leaves that framework unchanged.
Crypto Expert Report: Follow The Money – Which Presales Are Attracting Crypto Whales in 2026?
The post J.P. Morgan Calls for 10% Annual Bitcoin Returns appeared first on Tokenist.
J.P. Morgan Calls for 10% Annual Bitcoin Returns
J.P. Morgan Asset Management now includes a 10% expected compounded annual return for Bitcoin over 10 to 15 years in its long-term capital-market assumptions. Still, the asset remains outside the firm’s main portfolio-construction covariance matrices.
The split captures the key institutional tension: Bitcoin has entered formal return research, while its 55% modeled volatility and unstable correlations with traditional assets still complicate its use as a strategic allocation.
BREAKING: JP Morgan adds Bitcoin to their Long-Term Capital Markets Assumptions paper and predict it will be the best-performing asset of the next decade. pic.twitter.com/1yl9RiyKuh
— Simply Bitcoin (@SimplyBitcoin) October 20, 2026
The forecast is part of the firm’s 2027 Long-Term Capital Market Assumptions, its 31st annual edition. The official report frames these projections around a 10- to 15-year horizon and presents return assumptions by major asset class alongside the reasoning behind them.
The immediate question for institutional investors, therefore, is not simply what return Bitcoin might deliver, but whether that modeled return can fit into portfolio allocation frameworks.
What Does J.P. Morgan Actually Say About Bitcoin in the Long Term?
Source: JP Morgan
The 2027 edition adds Bitcoin coverage for the first time, extending the firm’s long-term return analysis to the cryptocurrency. Its 10% expected compounded annual return is a modeled assumption over the next 10 to 15 years, not a prediction of 10% gains every calendar year. It is a planning assumption, not a price target, short-term trading signal, or promise of steady returns.
J.P. Morgan Asset Management’s long-term capital market assumptions project returns across major asset classes and explain the underlying rationale. They offer a framework for comparing prospective returns over a long horizon, treating each asset’s modeled return as one of several inputs. Bitcoin’s inclusion gives it a place in this research, while keeping it separate from the main portfolio-construction framework.
This is a meaningful shift in institutional research, but not a portfolio recommendation. The report neither sets a Bitcoin allocation nor directs institutions to invest. It estimates a long-term return while leaving portfolio suitability to considerations such as risk and the asset’s relationship with other holdings.
This distinction matters alongside evidence of institutional exposure, such as Bitcoin ETF positions reported in filings. Holdings show institutional exposure; return assumptions place Bitcoin in a long-term analytical framework. Neither establishes a general portfolio weighting.
Crypto Expert Report: What Are the 10 Next Crypto to Explode in 2026?
Volatility and Unstable Correlations Keep Bitcoin Outside Core Matrices
SOURCE: TradingView
J.P. Morgan’s main constraint is Bitcoin’s modeled 55% volatility and unstable correlations with other assets. Because these correlations complicate strategic allocation, the firm excludes Bitcoin from the covariance matrices in its core portfolio-construction framework, separating return estimates from allocation decisions.
Covariance estimates measure how assets move relative to one another. Strategic allocation depends not only on an asset’s expected return but also on how it affects overall portfolio risk. Unstable correlations make it harder to incorporate Bitcoin consistently alongside traditional holdings.
With modeled volatility of 55%, Bitcoin’s projected return doesn’t resemble that of a routine strategic holding. The 10% estimate cannot be viewed alone: J.P. Morgan’s approach makes volatility and correlations central to allocation. The firm considers Bitcoin in long-term return research but omits it from the core matrix used for portfolio construction.
More broadly, institutional crypto risk assessment considers how exposure interacts with portfolio and market risks. J.P. Morgan identifies Bitcoin’s volatility and unstable correlations with traditional assets as the key portfolio-construction concerns.
The Forecast is Important for Crypto but Isn’t an Allocation Signal for J.P. Morgan
For institutions, the change expands the research toolkit rather than shifts the model portfolio. J.P. Morgan has introduced a long-term Bitcoin return assumption but did not include a standard allocation weight in the report.
The firm distinguishes expected returns from whether Bitcoin’s behavior fits its strategic framework, a key point in interpreting the forecast.
A 10% annualized assumption stands out, but allocation decisions must also weigh the modeled 55% volatility and unstable correlations. Formal recognition may precede confidence in portfolio construction.
Bitcoin’s inclusion in the 2027 assumptions signals deeper institutional analysis, not a recommended allocation. The next benchmark is whether future editions incorporate Bitcoin into the core covariance framework. The current report sets a 10- to 15-year return horizon but leaves that framework unchanged.
Crypto Expert Report: Follow The Money – Which Presales Are Attracting Crypto Whales in 2026?
The post J.P. Morgan Calls for 10% Annual Bitcoin Returns appeared first on Tokenist.
1
150
·
--

Мақала
AI Stocks Lag As Futures Bounce, Leaving Recovery UnprovenNasdaq 100 futures rose 1.3% on Monday, October 19, after a steep sell-off in US AI stocks and the wider technology sector, while S&P 500 futures gained 0.8%. The bounce offers some relief, but futures gains do not establish that the selling has run its course: inflation worries, financing concerns and questions about returns on AI investment remain unresolved.
Never seen a Saturday dump like this
What just happened to AI stocks?? pic.twitter.com/oieB8IK2kE
— The Wheelie Investor (@WheelieInvestor) October 17, 2026
The previous clear test in the primary market record came on Thursday, October 15. The Dow Jones Industrial Average climbed 1.1%, or 550 points; the S&P 500 added 0.3%, and the Nasdaq Composite rose 0.1%, following declines of 1.9% and 1.1% in the Nasdaq and S&P 500 a day earlier. That earlier session was the indexes’ worst since July.
The sequence puts the central question in focus: did investors reassess the AI trade, or did they rotate temporarily toward sectors less exposed to its financing and valuation pressures? The October 15 close supports the latter interpretation more clearly than a broad recovery; Monday’s futures move is a separate, early signal, not confirmation of a reversal.
For equity holders, the distinction matters because the funding stress facing AI stocks sits alongside an inflation backdrop that could keep borrowing costs elevated. The rebound is therefore being tested against both company-level returns and the price of capital.
Sector Rotation Left US AI Stocks Shares Under Pressure
On October 15, gains in the major indexes did not reflect uniform strength in technology. CoreWeave (CRWV) closed 6% higher after falling more than 15% the previous day amid concerns about the Nvidia-backed company’s debt. Other AI-linked shares remained weak. Dell Technologies (DELL) and Hewlett Packard Enterprise (HPE) were among the S&P 500’s worst performers for a second consecutive session.
The pressure extended to semiconductors and mega-cap technology. The iShares Semiconductor ETF (SOXX) was down roughly 1% after dropping 4.5% on Wednesday. Nvidia (NVDA) fell nearly 2% following a 3% decline the previous session. The Roundhill Magnificent Seven ETF (MAGS), which tracks seven major technology companies, ended down 0.3%.
By contrast, consumer and healthcare stocks helped lift the indexes. Nike (NKE) rose 6%, and Sherwin-Williams (SHW), Home Depot (HD), Walmart (WMT) and McDonald’s (MCD) also advanced. The S&P 500 healthcare sector gained about 2.5%, while energy and information technology fell 1.6% and 1.1%, respectively.
That divergence is the meaningful signal for market concentration: a positive index close can mask continued losses in the shares that drove much of the AI rally. The day’s gains point to a shift in leadership rather than proof that investors had restored confidence in the AI buildout. Crowded AI positioning makes that distinction relevant to retail investors who hold concentrated technology exposure directly or through broad indexes.
Crypto Expert Report: Follow The Money – Which Presales Are Attracting Crypto Whales in 2026?
Inflation and Earnings Keep the Rebound on Trial
Hot macro data keeps the rebound on trial. September’s Producer Price Index rose 1.3% month over month and 6.3% year over year, up from 0.4% and 5.4% in August, while retail sales rose 0.8%, twice expectations, and weekly jobless claims came in at 199,000.
CME FedWatch put the chance of a rate increase at 29% for the next meeting and of at least a quarter-point rise in December at 88%, and the 10-year Treasury yield stood near 5.09% after touching 5.33%.
Earnings are the next test, with Netflix on Tuesday and Tesla, Meta and IBM on Wednesday, and investors want evidence that US AI stocks’ demand turns into revenue, not just larger budgets. A stock bounce like CoreWeave’s does not show that financing worries have eased, so index strength is not yet an all-clear for AI exposure.
Crypto Expert Report: What Are the 10 Next Crypto to Explode in 2026?
The post AI Stocks Lag as Futures Bounce, Leaving Recovery Unproven appeared first on Tokenist.
AI Stocks Lag As Futures Bounce, Leaving Recovery Unproven
Nasdaq 100 futures rose 1.3% on Monday, October 19, after a steep sell-off in US AI stocks and the wider technology sector, while S&P 500 futures gained 0.8%. The bounce offers some relief, but futures gains do not establish that the selling has run its course: inflation worries, financing concerns and questions about returns on AI investment remain unresolved.
Never seen a Saturday dump like this
What just happened to AI stocks?? pic.twitter.com/oieB8IK2kE
— The Wheelie Investor (@WheelieInvestor) October 17, 2026
The previous clear test in the primary market record came on Thursday, October 15. The Dow Jones Industrial Average climbed 1.1%, or 550 points; the S&P 500 added 0.3%, and the Nasdaq Composite rose 0.1%, following declines of 1.9% and 1.1% in the Nasdaq and S&P 500 a day earlier. That earlier session was the indexes’ worst since July.
The sequence puts the central question in focus: did investors reassess the AI trade, or did they rotate temporarily toward sectors less exposed to its financing and valuation pressures? The October 15 close supports the latter interpretation more clearly than a broad recovery; Monday’s futures move is a separate, early signal, not confirmation of a reversal.
For equity holders, the distinction matters because the funding stress facing AI stocks sits alongside an inflation backdrop that could keep borrowing costs elevated. The rebound is therefore being tested against both company-level returns and the price of capital.
Sector Rotation Left US AI Stocks Shares Under Pressure
On October 15, gains in the major indexes did not reflect uniform strength in technology. CoreWeave (CRWV) closed 6% higher after falling more than 15% the previous day amid concerns about the Nvidia-backed company’s debt. Other AI-linked shares remained weak. Dell Technologies (DELL) and Hewlett Packard Enterprise (HPE) were among the S&P 500’s worst performers for a second consecutive session.
The pressure extended to semiconductors and mega-cap technology. The iShares Semiconductor ETF (SOXX) was down roughly 1% after dropping 4.5% on Wednesday. Nvidia (NVDA) fell nearly 2% following a 3% decline the previous session. The Roundhill Magnificent Seven ETF (MAGS), which tracks seven major technology companies, ended down 0.3%.
By contrast, consumer and healthcare stocks helped lift the indexes. Nike (NKE) rose 6%, and Sherwin-Williams (SHW), Home Depot (HD), Walmart (WMT) and McDonald’s (MCD) also advanced. The S&P 500 healthcare sector gained about 2.5%, while energy and information technology fell 1.6% and 1.1%, respectively.
That divergence is the meaningful signal for market concentration: a positive index close can mask continued losses in the shares that drove much of the AI rally. The day’s gains point to a shift in leadership rather than proof that investors had restored confidence in the AI buildout. Crowded AI positioning makes that distinction relevant to retail investors who hold concentrated technology exposure directly or through broad indexes.
Crypto Expert Report: Follow The Money – Which Presales Are Attracting Crypto Whales in 2026?
Inflation and Earnings Keep the Rebound on Trial
Hot macro data keeps the rebound on trial. September’s Producer Price Index rose 1.3% month over month and 6.3% year over year, up from 0.4% and 5.4% in August, while retail sales rose 0.8%, twice expectations, and weekly jobless claims came in at 199,000.
CME FedWatch put the chance of a rate increase at 29% for the next meeting and of at least a quarter-point rise in December at 88%, and the 10-year Treasury yield stood near 5.09% after touching 5.33%.
Earnings are the next test, with Netflix on Tuesday and Tesla, Meta and IBM on Wednesday, and investors want evidence that US AI stocks’ demand turns into revenue, not just larger budgets. A stock bounce like CoreWeave’s does not show that financing worries have eased, so index strength is not yet an all-clear for AI exposure.
Crypto Expert Report: What Are the 10 Next Crypto to Explode in 2026?
The post AI Stocks Lag as Futures Bounce, Leaving Recovery Unproven appeared first on Tokenist.
1
207
·
--

Мақала
Bitcoin Holding Nervously Above $80K Ahead of Weekly CloseAs of October 18, 2026, Bitcoin is trading near $81,500, with mixed technical indicators ahead of the weekly close. Shorter-term moving averages suggest a selling trend, while longer-term averages continue to support buyers.
The relative strength index (RSI) is 46, indicating an overall neutral technical rating. Support clusters around $81,000, while resistance stretches up to $82,500. This puts Bitcoin at a crucial point in its recent consolidation phase.
On October 17, Bitcoin was also around $81,500, with support at $81,000 and resistance at $82,500 defining the current market dynamics and highlighting the tight trading range.
BTC oscillators remained largely neutral, despite shorter-term moving averages favoring sellers. Although Bitcoin remains bullish on longer-term averages, a break below $80,714 could lead to a drop toward $79,694.
Bitcoin Price Stalls at $81,500 as Short-Term Bears Challenge Longer-Term Bulls
SOURCE: TradingView
Bitcoin’s price is caught in a peculiar technical standoff, trading around $81,500 on Saturday, Oct. 17, 2026, as short-term bearish moving averages clash with a much healthier longer-term structure.
With a market capitalization of approximately $1.639 trillion, $15Bn in daily trading volume, and a 24-hour range stretching from $81,108 to $81,733, the market has settled into a narrow holding pattern, leaving traders to determine whether the latest consolidation represents the beginnings of a recovery or merely a temporary reprieve before another test of support.
The one-hour chart presents a tentative recovery from the recent $80,714 low, with successive higher lows suggesting buyers are attempting to establish a foothold around $81,000. However, declining trading volume complicates that encouraging development, indicating the recovery has yet to attract convincing participation.
Immediate resistance sits between $81,700 and $82,000, and a sustained advance would bring $82,500 into view. Conversely, a retreat through $81,000 would expose the earlier hourly low and challenge the modest progress buyers have achieved.
[cta url=”https://cryptonews.com/ext/edgex”]Earn $50 and Enter $300K Prize Draw on EdgeX[/cta]
What Do the Four-Hour and Daily Charts Say for BTC USD Heading Into the Weekly Close?
$BTC longs are closing, price keeps bleeding, and bulls are still asking where Uptober went longs are tapping out one by one Now the real question is whether spot buyers step in or btc has to go another leg down Who's balls of steel to catch this falling knife? pic.twitter.com/eyTCm2u5Ux
— MrTranquility (@MstrTranquility) October 17, 2026
Price action is mainly clustered between $81,000 and $81,700, with neither buyers nor sellers showing enough conviction to drive a significant directional move. Order book data shows additional buy orders near $80,000, while sell orders extend into higher price ranges.
To improve the immediate technical outlook, Bitcoin would need to recover above $82,500. However, the $83,000 area poses another challenge. If Bitcoin fails to hold support at $81,000, attention will likely shift to $79,694, a critical structural support level.
On the daily chart, Bitcoin continues to form lower highs since its previous peak at $87,374, suggesting weakening upward momentum. However, the overall structure has not yet abandoned its long-term technical foundations.
The $80,000 region is particularly significant, acting as both a psychological barrier and a nearby technical reference point. Losing this level would put $79,694 and potentially $78,000 on the radar.
On the other hand, buyers must reclaim the $83,000 level for the daily outlook to improve, with $84,254 marking another significant resistance level as the weekly close looms.
Discover: The Best Token Presales
What are the Technical Indicators Saying?
#BITCOIN WEEKLY MOMENTUM AT A KEY TEST The weekly Stoch RSI is testing the 80 level. Blue crosses back above orange + holds above 80 = bullish momentum. Loses 80 at the weekly close = deeper pullback risk. Want the full Market Report? Join the mailing list … pic.twitter.com/5RzhD4Ku7B
— Crypto Crew University (@CryptoCrewU) October 17, 2026
Oscillator readings show little evidence of a decisive shift in momentum. The relative strength index (RSI) stands at 46, suggesting neither overbought nor oversold conditions.
The Stochastic oscillator reads 27, while the Commodity Channel Index (CCI) reads 116. Additionally, the average directional index (ADX) reads 24.
In contrast, the moving average convergence divergence (MACD) level of 80 indicates bearishness, despite positive momentum and bull-bear power classifications. Overall, with eight neutral readings, directional conviction is notably absent.
The moving averages (MAs) present a more mixed picture. Bitcoin is trading below its 10-period exponential moving average (EMA) at $82,343 and its 20-period simple moving average (SMA) at $83,405, reinforcing near-term resistance.
However, the 50-period EMA at $80,416 and the 50-period SMA at $81,322 remain below the market, while both the 100-period and 200-period averages still show bullish classifications.
[cta url=”https://cryptonews.com/ext/blofin”]Supercharge Your Trading in 2026 With BloFin AI Trading Bots[/cta]
The post Bitcoin Holding Nervously Above $80K Ahead of Weekly Close appeared first on Tokenist.
Bitcoin Holding Nervously Above $80K Ahead of Weekly Close
As of October 18, 2026, Bitcoin is trading near $81,500, with mixed technical indicators ahead of the weekly close. Shorter-term moving averages suggest a selling trend, while longer-term averages continue to support buyers.
The relative strength index (RSI) is 46, indicating an overall neutral technical rating. Support clusters around $81,000, while resistance stretches up to $82,500. This puts Bitcoin at a crucial point in its recent consolidation phase.
On October 17, Bitcoin was also around $81,500, with support at $81,000 and resistance at $82,500 defining the current market dynamics and highlighting the tight trading range.
BTC oscillators remained largely neutral, despite shorter-term moving averages favoring sellers. Although Bitcoin remains bullish on longer-term averages, a break below $80,714 could lead to a drop toward $79,694.
Bitcoin Price Stalls at $81,500 as Short-Term Bears Challenge Longer-Term Bulls
SOURCE: TradingView
Bitcoin’s price is caught in a peculiar technical standoff, trading around $81,500 on Saturday, Oct. 17, 2026, as short-term bearish moving averages clash with a much healthier longer-term structure.
With a market capitalization of approximately $1.639 trillion, $15Bn in daily trading volume, and a 24-hour range stretching from $81,108 to $81,733, the market has settled into a narrow holding pattern, leaving traders to determine whether the latest consolidation represents the beginnings of a recovery or merely a temporary reprieve before another test of support.
The one-hour chart presents a tentative recovery from the recent $80,714 low, with successive higher lows suggesting buyers are attempting to establish a foothold around $81,000. However, declining trading volume complicates that encouraging development, indicating the recovery has yet to attract convincing participation.
Immediate resistance sits between $81,700 and $82,000, and a sustained advance would bring $82,500 into view. Conversely, a retreat through $81,000 would expose the earlier hourly low and challenge the modest progress buyers have achieved.
[cta url=”https://cryptonews.com/ext/edgex”]Earn $50 and Enter $300K Prize Draw on EdgeX[/cta]
What Do the Four-Hour and Daily Charts Say for BTC USD Heading Into the Weekly Close?
$BTC longs are closing, price keeps bleeding, and bulls are still asking where Uptober went longs are tapping out one by one Now the real question is whether spot buyers step in or btc has to go another leg down Who's balls of steel to catch this falling knife? pic.twitter.com/eyTCm2u5Ux
— MrTranquility (@MstrTranquility) October 17, 2026
Price action is mainly clustered between $81,000 and $81,700, with neither buyers nor sellers showing enough conviction to drive a significant directional move. Order book data shows additional buy orders near $80,000, while sell orders extend into higher price ranges.
To improve the immediate technical outlook, Bitcoin would need to recover above $82,500. However, the $83,000 area poses another challenge. If Bitcoin fails to hold support at $81,000, attention will likely shift to $79,694, a critical structural support level.
On the daily chart, Bitcoin continues to form lower highs since its previous peak at $87,374, suggesting weakening upward momentum. However, the overall structure has not yet abandoned its long-term technical foundations.
The $80,000 region is particularly significant, acting as both a psychological barrier and a nearby technical reference point. Losing this level would put $79,694 and potentially $78,000 on the radar.
On the other hand, buyers must reclaim the $83,000 level for the daily outlook to improve, with $84,254 marking another significant resistance level as the weekly close looms.
Discover: The Best Token Presales
What are the Technical Indicators Saying?
#BITCOIN WEEKLY MOMENTUM AT A KEY TEST The weekly Stoch RSI is testing the 80 level. Blue crosses back above orange + holds above 80 = bullish momentum. Loses 80 at the weekly close = deeper pullback risk. Want the full Market Report? Join the mailing list … pic.twitter.com/5RzhD4Ku7B
— Crypto Crew University (@CryptoCrewU) October 17, 2026
Oscillator readings show little evidence of a decisive shift in momentum. The relative strength index (RSI) stands at 46, suggesting neither overbought nor oversold conditions.
The Stochastic oscillator reads 27, while the Commodity Channel Index (CCI) reads 116. Additionally, the average directional index (ADX) reads 24.
In contrast, the moving average convergence divergence (MACD) level of 80 indicates bearishness, despite positive momentum and bull-bear power classifications. Overall, with eight neutral readings, directional conviction is notably absent.
The moving averages (MAs) present a more mixed picture. Bitcoin is trading below its 10-period exponential moving average (EMA) at $82,343 and its 20-period simple moving average (SMA) at $83,405, reinforcing near-term resistance.
However, the 50-period EMA at $80,416 and the 50-period SMA at $81,322 remain below the market, while both the 100-period and 200-period averages still show bullish classifications.
[cta url=”https://cryptonews.com/ext/blofin”]Supercharge Your Trading in 2026 With BloFin AI Trading Bots[/cta]
The post Bitcoin Holding Nervously Above $80K Ahead of Weekly Close appeared first on Tokenist.
2
83
·
--

Мақала
Bitcoin’s Rebound Above $82,000 Faces a Thinner Bid CushionBitcoin fell to $79,800 on Oct. 15 before reaching an intraday high of $82,634, but the recovery left a weaker layer of bids beneath the $80,000 level, according to Glassnode. Large bids that had sat at $80,000 for the prior week were filled, then replaced; the remaining stack below the level was smaller after that refill.
ETF flows are another part of the demand picture, as outlined in Bitcoin ETF demand near the $80,000 support zone.
Perfect liquidity hunting pic.twitter.com/VtuZ7SUb77
— CoinGlass (@coinglass_com) October 15, 2026
Crypto Expert Report: What Are the 10 Next Crypto to Explode in 2026?
Glassnode’s $80,000 Bitcoin Order-Book Test
Glassnode’s heatmap tracked resting orders on Binance’s BTC/USDT spot book on Oct. 15. Before 13:00 UTC, bitcoin traded between $80,500 and $81,900 while a thick concentration of buy orders remained at $80,000, a level that had acted as a visible bid wall during the preceding week.
From 13:00 to 14:00 UTC, BTC slipped to $79,800 and the $80,000 orders were consumed. About 20 minutes later, Glassnode’s annotations showed a new large bid just below $80,000. Buyers then moved their bids higher between 15:00 and 18:00 UTC, as bitcoin climbed to $82,634.
A separate resting bid appeared near $82,000 during the evening, and the source reported that price held above it afterward.
Liquidations Helped the Rebound, but Do Not Prove Demand
Liquidation Heatmap Coinglass
About $930 million in leveraged positions were wiped out during the dip, including approximately $780 million in long positions.
During the subsequent recovery, roughly $53 million in short positions were liquidated. That short squeeze helped BTC move back above $82,000, but the source characterized the effect as a one-time lift rather than sustained buying: liquidations close existing positions and do not, by themselves, create continuing spot demand.
The distinction matters for interpreting the price action. A rebound driven partly by short covering can lift prices quickly while leaving the market dependent on new buyers to maintain the advance. If bids below $80,000 are thinner, the depth available to absorb another wave of selling becomes an important part of the next test. The interaction between crowded leverage and forced liquidations can magnify moves when liquidity is limited.
Crypto Expert Report: What is the Best Meme Coin to Buy and Forget Until the Next Bullrun?
The post Bitcoin’s Rebound Above $82,000 Faces a Thinner Bid Cushion appeared first on Tokenist.
Bitcoin’s Rebound Above $82,000 Faces a Thinner Bid Cushion
Bitcoin fell to $79,800 on Oct. 15 before reaching an intraday high of $82,634, but the recovery left a weaker layer of bids beneath the $80,000 level, according to Glassnode. Large bids that had sat at $80,000 for the prior week were filled, then replaced; the remaining stack below the level was smaller after that refill.
ETF flows are another part of the demand picture, as outlined in Bitcoin ETF demand near the $80,000 support zone.
Perfect liquidity hunting pic.twitter.com/VtuZ7SUb77
— CoinGlass (@coinglass_com) October 15, 2026
Crypto Expert Report: What Are the 10 Next Crypto to Explode in 2026?
Glassnode’s $80,000 Bitcoin Order-Book Test
Glassnode’s heatmap tracked resting orders on Binance’s BTC/USDT spot book on Oct. 15. Before 13:00 UTC, bitcoin traded between $80,500 and $81,900 while a thick concentration of buy orders remained at $80,000, a level that had acted as a visible bid wall during the preceding week.
From 13:00 to 14:00 UTC, BTC slipped to $79,800 and the $80,000 orders were consumed. About 20 minutes later, Glassnode’s annotations showed a new large bid just below $80,000. Buyers then moved their bids higher between 15:00 and 18:00 UTC, as bitcoin climbed to $82,634.
A separate resting bid appeared near $82,000 during the evening, and the source reported that price held above it afterward.
Liquidations Helped the Rebound, but Do Not Prove Demand
Liquidation Heatmap Coinglass
About $930 million in leveraged positions were wiped out during the dip, including approximately $780 million in long positions.
During the subsequent recovery, roughly $53 million in short positions were liquidated. That short squeeze helped BTC move back above $82,000, but the source characterized the effect as a one-time lift rather than sustained buying: liquidations close existing positions and do not, by themselves, create continuing spot demand.
The distinction matters for interpreting the price action. A rebound driven partly by short covering can lift prices quickly while leaving the market dependent on new buyers to maintain the advance. If bids below $80,000 are thinner, the depth available to absorb another wave of selling becomes an important part of the next test. The interaction between crowded leverage and forced liquidations can magnify moves when liquidity is limited.
Crypto Expert Report: What is the Best Meme Coin to Buy and Forget Until the Next Bullrun?
The post Bitcoin’s Rebound Above $82,000 Faces a Thinner Bid Cushion appeared first on Tokenist.
209
·
--
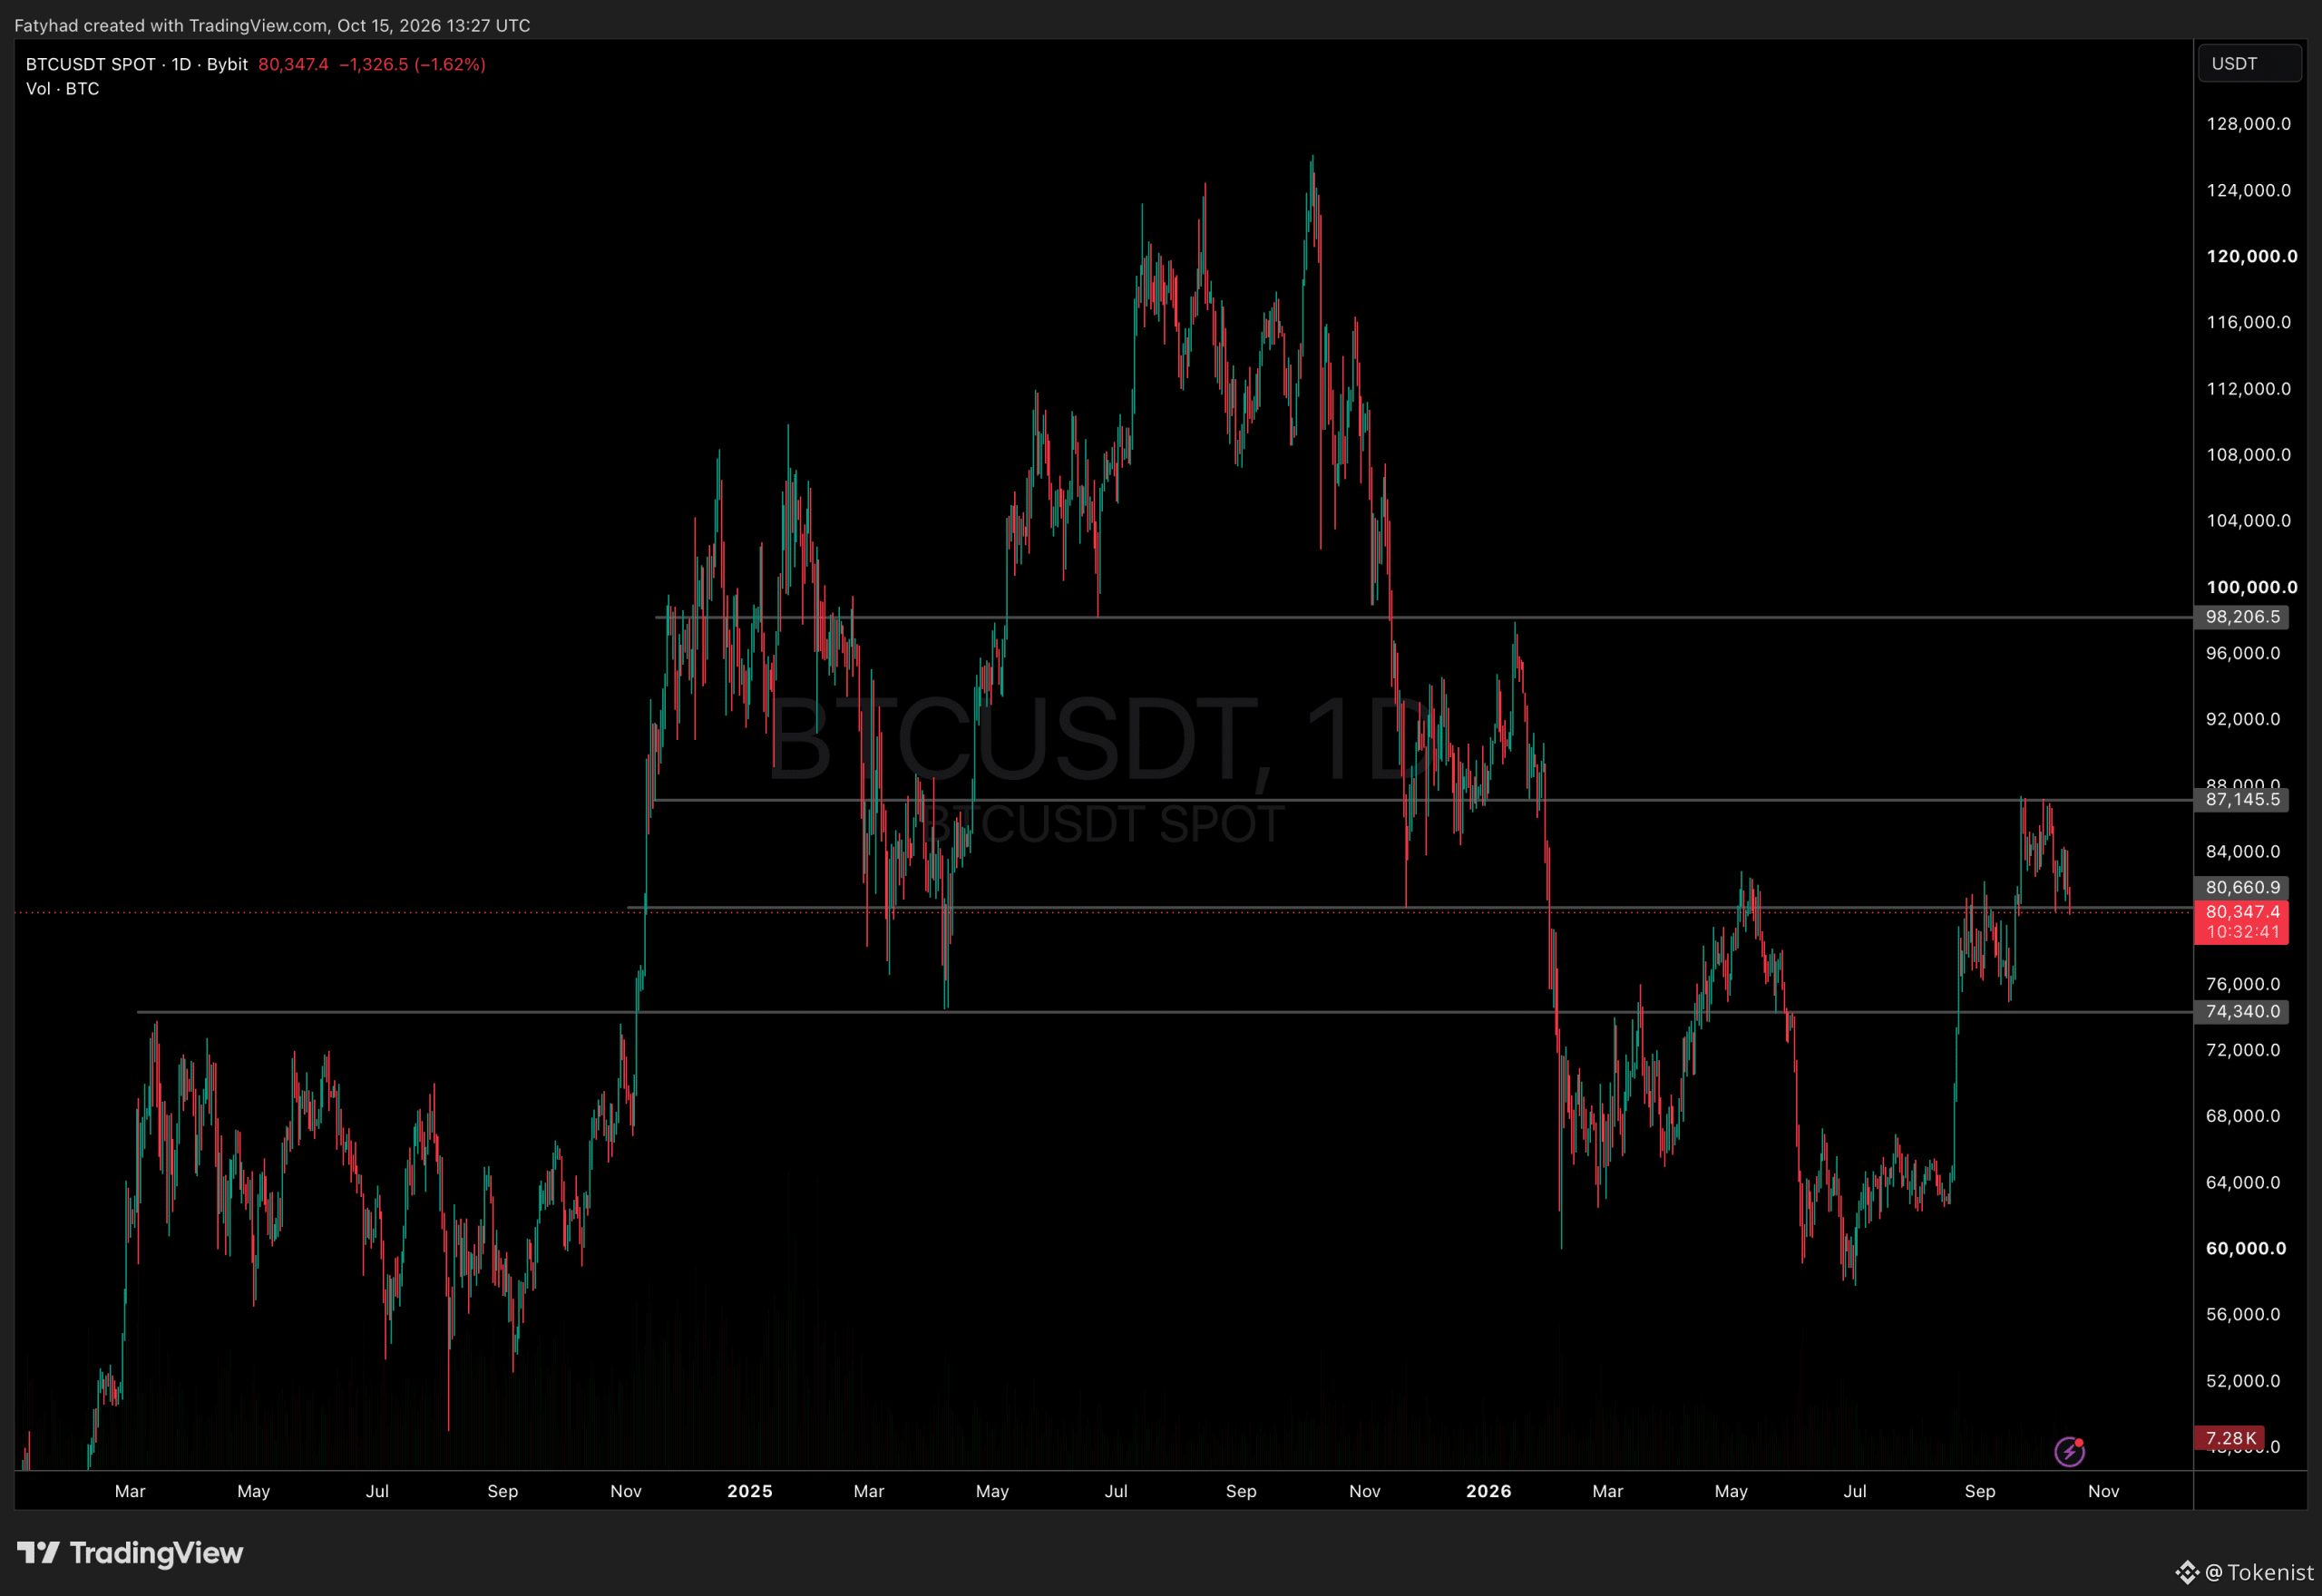
Мақала
Why AI Infrastructure Stocks Fell After September CPIA 0.6% monthly rise in September CPI weighed on markets on October 14, hitting AI-linked stocks hard and pulling Bitcoin from above $84,000 toward the low-$82,000s. For US crypto, the episode showed how quickly higher rates can pressure both capital-intensive businesses and high-beta assets.
The Bureau of Labor Statistics reported annual headline inflation of 3.7%, up from 3.4% in August, while core CPI rose 0.3% on the month and 2.6% over 12 months.
The central question is whether rising borrowing costs are becoming a shared valuation risk for AI and crypto, even as the companies best able to fund AI spending look comparatively resilient.
BREAKING: September PPI Inflation unexpectedly rises to 6.3%, above expectations of 5.3%.
Core PPI Inflation rose to 5.0%, above expectations of 4.4%
PPI inflation is now at its second highest level since November 2022.
The odds of rate hikes are rising sharply on the news.
— The Kobeissi Letter (@KobeissiLetter) October 15, 2026
Crypto Expert Report: What Are the 10 Next Crypto to Explode in 2026?
Why Are Rising Yields Hurting AI Infrastructure Stocks?
The losses were concentrated in companies tied to AI infrastructure. CoreWeave fell 16%, Nebius lost 11%, Oracle declined 9% and Dell dropped 11%, together erasing about $80 billion in market value, Reuters reported. These businesses depend on heavy investment and outside financing, so higher discount rates and funding costs hit them first. The selloff also followed a large run-up, with Dell shares having quadrupled this year.
CoreWeave shows the funding risk most clearly. LSEG data cited by Reuters shows it has issued $22 billion of bonds and $26 billion of loans, and a bond sold in June at a 9.625% yield recently traded at 15%. The 30-year Treasury yield reached 5.63% on Wednesday before pulling back.
Ross Mayfield of Baird said long rates above 5% and creeping toward 6% are “a problem for the marginal borrower.” The AI trade is not uniformly impaired: investors stayed confident in profitable spenders such as Nvidia, Alphabet, Microsoft, Meta and Amazon.
The risk from crowded AI-stock valuations is therefore relevant to the way rate-sensitive losses can spread beyond companies with the most immediate borrowing needs.
Does the Rate Move Explain the Fall in US Crypto?
BTCUSDT Chart 1D TradingView
Bitcoin’s retreat fits the same pattern. When yields rise, investors can cut exposure to assets that depend on risk appetite and pay no interest, including crypto and high-growth equities. The link has limits, though.
The episode also does not settle Bitcoin’s longer-term role as an inflation hedge. It shows that in this session Bitcoin fell as yields rose, and that US crypto remains sensitive to the cost of capital alongside crypto-specific catalysts.
The next tests are later CPI reports, long-term Treasury yields, evidence that AI spending is producing earnings, and the terms on which less-profitable firms can refinance.
A persistent rise in yields would widen the financing gap between strong and marginal borrowers; a reversal would ease one source of pressure without answering questions about AI returns or crypto’s sensitivity to risk appetite.
A single session is not a trend, so macro conditions deserve attention alongside crypto-specific news.
Crypto Expert Report: What is the Best Meme Coin to Buy and Forget Until the Next Bullrun?
The post Why AI Infrastructure Stocks Fell After September CPI appeared first on Tokenist.
Why AI Infrastructure Stocks Fell After September CPI
A 0.6% monthly rise in September CPI weighed on markets on October 14, hitting AI-linked stocks hard and pulling Bitcoin from above $84,000 toward the low-$82,000s. For US crypto, the episode showed how quickly higher rates can pressure both capital-intensive businesses and high-beta assets.
The Bureau of Labor Statistics reported annual headline inflation of 3.7%, up from 3.4% in August, while core CPI rose 0.3% on the month and 2.6% over 12 months.
The central question is whether rising borrowing costs are becoming a shared valuation risk for AI and crypto, even as the companies best able to fund AI spending look comparatively resilient.
BREAKING: September PPI Inflation unexpectedly rises to 6.3%, above expectations of 5.3%.
Core PPI Inflation rose to 5.0%, above expectations of 4.4%
PPI inflation is now at its second highest level since November 2022.
The odds of rate hikes are rising sharply on the news.
— The Kobeissi Letter (@KobeissiLetter) October 15, 2026
Crypto Expert Report: What Are the 10 Next Crypto to Explode in 2026?
Why Are Rising Yields Hurting AI Infrastructure Stocks?
The losses were concentrated in companies tied to AI infrastructure. CoreWeave fell 16%, Nebius lost 11%, Oracle declined 9% and Dell dropped 11%, together erasing about $80 billion in market value, Reuters reported. These businesses depend on heavy investment and outside financing, so higher discount rates and funding costs hit them first. The selloff also followed a large run-up, with Dell shares having quadrupled this year.
CoreWeave shows the funding risk most clearly. LSEG data cited by Reuters shows it has issued $22 billion of bonds and $26 billion of loans, and a bond sold in June at a 9.625% yield recently traded at 15%. The 30-year Treasury yield reached 5.63% on Wednesday before pulling back.
Ross Mayfield of Baird said long rates above 5% and creeping toward 6% are “a problem for the marginal borrower.” The AI trade is not uniformly impaired: investors stayed confident in profitable spenders such as Nvidia, Alphabet, Microsoft, Meta and Amazon.
The risk from crowded AI-stock valuations is therefore relevant to the way rate-sensitive losses can spread beyond companies with the most immediate borrowing needs.
Does the Rate Move Explain the Fall in US Crypto?
BTCUSDT Chart 1D TradingView
Bitcoin’s retreat fits the same pattern. When yields rise, investors can cut exposure to assets that depend on risk appetite and pay no interest, including crypto and high-growth equities. The link has limits, though.
The episode also does not settle Bitcoin’s longer-term role as an inflation hedge. It shows that in this session Bitcoin fell as yields rose, and that US crypto remains sensitive to the cost of capital alongside crypto-specific catalysts.
The next tests are later CPI reports, long-term Treasury yields, evidence that AI spending is producing earnings, and the terms on which less-profitable firms can refinance.
A persistent rise in yields would widen the financing gap between strong and marginal borrowers; a reversal would ease one source of pressure without answering questions about AI returns or crypto’s sensitivity to risk appetite.
A single session is not a trend, so macro conditions deserve attention alongside crypto-specific news.
Crypto Expert Report: What is the Best Meme Coin to Buy and Forget Until the Next Bullrun?
The post Why AI Infrastructure Stocks Fell After September CPI appeared first on Tokenist.
501
·
--
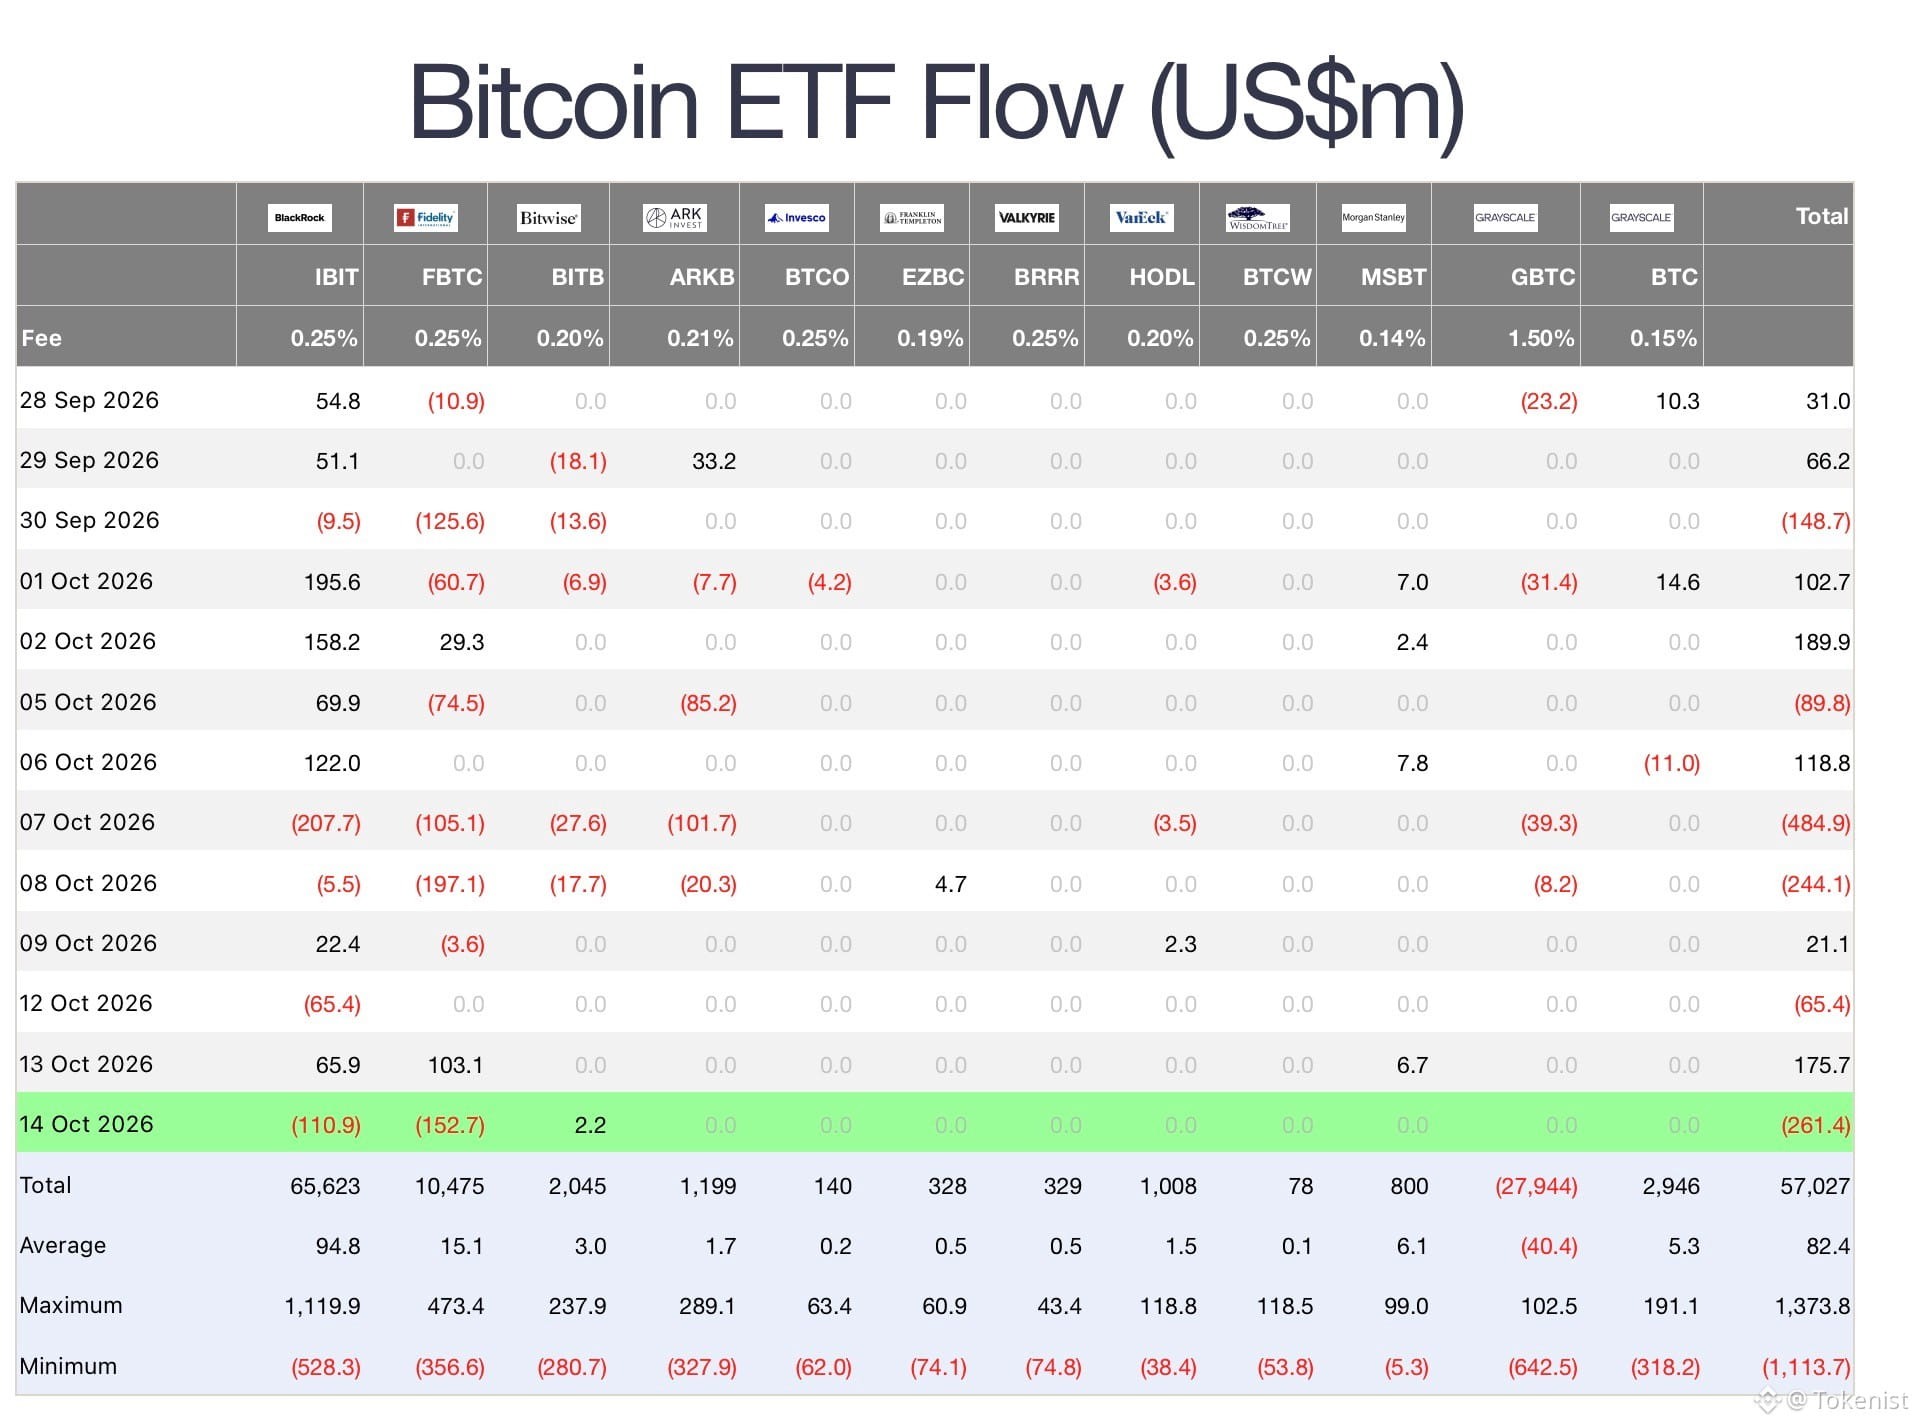
Мақала
Large-Fund Redemptions Expose a Split in Bitcoin ETF FlowsBitwise’s BITB attracted $2.2 million on October 14 as U.S. spot Bitcoin ETFs recorded $261.4 million in net outflows. Fidelity’s FBTC and BlackRock’s IBIT accounted for the reported bulk of withdrawals.
The Farside-linked figures show $152.7 million leaving FBTC and $110.9 million leaving IBIT. Together, those redemptions total $263.6 million, and BITB’s $2.2 million inflow brought the reported net loss to $261.4 million.
Bitcoin trades near $80,997, down 2.4% in the last 24 hours, after slipping below the $81,776 level. The next key support sits near $76,000, while the 200-day moving average is at $72,284.
Bitcoin ETF Flow Farside
Crypto Expert Report: What Are the 10 Next Crypto to Explode in 2026?
Bitcoin ETFs Flow: October’s Reversals Put One Outflow Day in Context
According to SoSoValue, U.S. spot Bitcoin ETFs recorded $261 million in net outflows on October 14, with Bitwise's BITB posting the largest inflow at $2.22 million. Spot Ethereum ETFs saw $130 million in net outflows, led by BlackRock's ETHA with $110 million. pic.twitter.com/4HW9quMOVz
— Wu Blockchain (@WuBlockchain) October 15, 2026
The October 14 result followed sharply changing daily flows. U.S. spot Bitcoin ETFs recorded nearly $487 million in outflows on October 7, then $175.7 million in net inflows on October 13, before returning to net outflows the following day. Spot Ethereum ETFs also saw $130 million in reported net outflows on October 14, indicating that the retreat extended beyond Bitcoin funds.
ETF creations and redemptions can connect those flows to the spot market. When demand brings money into a fund, it creates shares and acquires Bitcoin to back them; when investors redeem shares, the fund may sell underlying Bitcoin. That creates potential spot-market selling pressure, although a daily flow figure alone does not establish how much selling occurred or how the wider market absorbed it.
Since launching in January 2024, U.S. spot Bitcoin ETFs have accumulated more than $54 billion in net inflows, according to the primary-source account. Their combined assets were estimated at approximately $100 billion to $107 billion by mid-October.
Why Concentrated FBTC and IBIT Redemptions Matter
BTCUSDT Chart 1D
FBTC and IBIT are the largest funds by assets, so their dollar flows can be sizeable in either direction. When redemptions are concentrated in these products, they may carry more weight in the spot market than a similar percentage move in a smaller fund.
BITB’s $2.2 million gain was modest beside the reported withdrawals from FBTC and IBIT; it marks a fund-level exception, not evidence of a broad inflow trend.
Previous Bitcoin ETF redemptions involving BlackRock and Fidelity likewise illustrate why flows from the largest issuers warrant attention. The next useful signal is whether subsequent daily reports confirm a sustained direction or another reversal.
Crypto Expert Report: Follow The Money – Which Presales Are Attracting Crypto Whales in 2026?
The post Large-Fund Redemptions Expose a Split in Bitcoin ETF Flows appeared first on Tokenist.
Large-Fund Redemptions Expose a Split in Bitcoin ETF Flows
Bitwise’s BITB attracted $2.2 million on October 14 as U.S. spot Bitcoin ETFs recorded $261.4 million in net outflows. Fidelity’s FBTC and BlackRock’s IBIT accounted for the reported bulk of withdrawals.
The Farside-linked figures show $152.7 million leaving FBTC and $110.9 million leaving IBIT. Together, those redemptions total $263.6 million, and BITB’s $2.2 million inflow brought the reported net loss to $261.4 million.
Bitcoin trades near $80,997, down 2.4% in the last 24 hours, after slipping below the $81,776 level. The next key support sits near $76,000, while the 200-day moving average is at $72,284.
Bitcoin ETF Flow Farside
Crypto Expert Report: What Are the 10 Next Crypto to Explode in 2026?
Bitcoin ETFs Flow: October’s Reversals Put One Outflow Day in Context
According to SoSoValue, U.S. spot Bitcoin ETFs recorded $261 million in net outflows on October 14, with Bitwise's BITB posting the largest inflow at $2.22 million. Spot Ethereum ETFs saw $130 million in net outflows, led by BlackRock's ETHA with $110 million. pic.twitter.com/4HW9quMOVz
— Wu Blockchain (@WuBlockchain) October 15, 2026
The October 14 result followed sharply changing daily flows. U.S. spot Bitcoin ETFs recorded nearly $487 million in outflows on October 7, then $175.7 million in net inflows on October 13, before returning to net outflows the following day. Spot Ethereum ETFs also saw $130 million in reported net outflows on October 14, indicating that the retreat extended beyond Bitcoin funds.
ETF creations and redemptions can connect those flows to the spot market. When demand brings money into a fund, it creates shares and acquires Bitcoin to back them; when investors redeem shares, the fund may sell underlying Bitcoin. That creates potential spot-market selling pressure, although a daily flow figure alone does not establish how much selling occurred or how the wider market absorbed it.
Since launching in January 2024, U.S. spot Bitcoin ETFs have accumulated more than $54 billion in net inflows, according to the primary-source account. Their combined assets were estimated at approximately $100 billion to $107 billion by mid-October.
Why Concentrated FBTC and IBIT Redemptions Matter
BTCUSDT Chart 1D
FBTC and IBIT are the largest funds by assets, so their dollar flows can be sizeable in either direction. When redemptions are concentrated in these products, they may carry more weight in the spot market than a similar percentage move in a smaller fund.
BITB’s $2.2 million gain was modest beside the reported withdrawals from FBTC and IBIT; it marks a fund-level exception, not evidence of a broad inflow trend.
Previous Bitcoin ETF redemptions involving BlackRock and Fidelity likewise illustrate why flows from the largest issuers warrant attention. The next useful signal is whether subsequent daily reports confirm a sustained direction or another reversal.
Crypto Expert Report: Follow The Money – Which Presales Are Attracting Crypto Whales in 2026?
The post Large-Fund Redemptions Expose a Split in Bitcoin ETF Flows appeared first on Tokenist.
311
·
--

Мақала
CoinDepo Governance Turns Community Votes Into Asset Launches and Funding DecisionsCoinDepo has added SUI following a community governance vote, giving COINDEPO token holders another completed example of how their decisions influence the platform.
The integration follows the earlier addition of EURC and a series of votes on charitable funding. In its latest exchange-related vote, the community chose to preserve ecosystem resources rather than proceed with a potential Bit2Me listing under the current proposal.
Together, these outcomes show how CoinDepo is applying community governance within centralized crypto finance, or CeFi. The program gives token holders a role in selected product and ecosystem decisions, while the company carries out the technical and operational work needed to implement the outcomes.
Community-selected assets are now available
The first completed asset vote brought together 648 participants, who selected EURC as the next addition to CoinDepo. The platform subsequently integrated the euro-backed stablecoin, connecting the published voting outcome to an available product.
A later vote selected SUI. CoinDepo has now completed that integration as well, allowing users to deposit the asset on the platform. Both additions followed the same process: holders chose an asset through governance, and CoinDepo completed the work required to make it available.
For participants, these launches provide a visible way to follow a proposal through to implementation. They also give the program concrete product outcomes that users can see in their accounts.
Token holders influence charitable funding
CoinDepo has also used governance to involve holders in its charitable activities. Following an earlier allocation vote, the company reported completing $21,000 in donations to World Child Cancer, GiveDirectly and Damark.
The September vote selected a $31,000 allocation across four partners: $10,000 each for World Child Cancer, GiveDirectly and Action Against Hunger, and $1,000 for Damark. CoinDepo published the allocation alongside transaction links, giving readers access to the payment records associated with the decision.
Community participation also helped determine a new charity relationship. After holders voted to support Action Against Hunger, CoinDepo formalized the collaboration and announced an initial $10,000 donation supporting the organization’s work in Kenya. This extended participation beyond allocating an existing budget to choosing an organization for the charity program.
A vote to preserve exchange listing resources
The latest exchange-related decision concerned whether CoinDepo should pursue a potential Bit2Me listing or retain the available Token Ecosystem resources for future opportunities. The community selected the option to preserve those resources.
CoinDepo announced that it would not move forward with the listing under the current proposal. The company will continue evaluating exchange opportunities, and the retained funds remain available for future listing considerations. This outcome shows that participation can influence whether a proposed expenditure goes ahead, as well as which new initiative is introduced.
Public records support the voting process
Voting takes place within the CoinDepo interface. After a vote concludes, the platform publishes the final result in the InterPlanetary File System, or IPFS, and provides a Bitcoin timestamp proof. Daily token balance snapshots used in calculating Governance Scores are also published with timestamp proofs.
These records give participants access to the data behind completed votes. Readers can review the published outcome and check the associated timestamp proof, then follow the company’s implementation announcements. The public governance page brings voting records and balance snapshots together for that purpose.
A practical role for the COINDEPO token
The program gives COINDEPO holders a defined way to contribute to decisions within the ecosystem. Its completed cases now span asset integrations, charity allocations and an exchange listing proposal. CoinDepo has said it will continue involving its community in new assets, ecosystem initiatives and other areas of development.
Voting records and further information are available on the CoinDepo Governance page.
About CoinDepo
CoinDepo is a centralized digital asset platform offering crypto savings and borrowing products. Its COINDEPO token governance program enables holders to participate in selected platform and ecosystem decisions.
The post CoinDepo Governance Turns Community Votes Into Asset Launches and Funding Decisions appeared first on Tokenist.
CoinDepo Governance Turns Community Votes Into Asset Launches and Funding Decisions
CoinDepo has added SUI following a community governance vote, giving COINDEPO token holders another completed example of how their decisions influence the platform.
The integration follows the earlier addition of EURC and a series of votes on charitable funding. In its latest exchange-related vote, the community chose to preserve ecosystem resources rather than proceed with a potential Bit2Me listing under the current proposal.
Together, these outcomes show how CoinDepo is applying community governance within centralized crypto finance, or CeFi. The program gives token holders a role in selected product and ecosystem decisions, while the company carries out the technical and operational work needed to implement the outcomes.
Community-selected assets are now available
The first completed asset vote brought together 648 participants, who selected EURC as the next addition to CoinDepo. The platform subsequently integrated the euro-backed stablecoin, connecting the published voting outcome to an available product.
A later vote selected SUI. CoinDepo has now completed that integration as well, allowing users to deposit the asset on the platform. Both additions followed the same process: holders chose an asset through governance, and CoinDepo completed the work required to make it available.
For participants, these launches provide a visible way to follow a proposal through to implementation. They also give the program concrete product outcomes that users can see in their accounts.
Token holders influence charitable funding
CoinDepo has also used governance to involve holders in its charitable activities. Following an earlier allocation vote, the company reported completing $21,000 in donations to World Child Cancer, GiveDirectly and Damark.
The September vote selected a $31,000 allocation across four partners: $10,000 each for World Child Cancer, GiveDirectly and Action Against Hunger, and $1,000 for Damark. CoinDepo published the allocation alongside transaction links, giving readers access to the payment records associated with the decision.
Community participation also helped determine a new charity relationship. After holders voted to support Action Against Hunger, CoinDepo formalized the collaboration and announced an initial $10,000 donation supporting the organization’s work in Kenya. This extended participation beyond allocating an existing budget to choosing an organization for the charity program.
A vote to preserve exchange listing resources
The latest exchange-related decision concerned whether CoinDepo should pursue a potential Bit2Me listing or retain the available Token Ecosystem resources for future opportunities. The community selected the option to preserve those resources.
CoinDepo announced that it would not move forward with the listing under the current proposal. The company will continue evaluating exchange opportunities, and the retained funds remain available for future listing considerations. This outcome shows that participation can influence whether a proposed expenditure goes ahead, as well as which new initiative is introduced.
Public records support the voting process
Voting takes place within the CoinDepo interface. After a vote concludes, the platform publishes the final result in the InterPlanetary File System, or IPFS, and provides a Bitcoin timestamp proof. Daily token balance snapshots used in calculating Governance Scores are also published with timestamp proofs.
These records give participants access to the data behind completed votes. Readers can review the published outcome and check the associated timestamp proof, then follow the company’s implementation announcements. The public governance page brings voting records and balance snapshots together for that purpose.
A practical role for the COINDEPO token
The program gives COINDEPO holders a defined way to contribute to decisions within the ecosystem. Its completed cases now span asset integrations, charity allocations and an exchange listing proposal. CoinDepo has said it will continue involving its community in new assets, ecosystem initiatives and other areas of development.
Voting records and further information are available on the CoinDepo Governance page.
About CoinDepo
CoinDepo is a centralized digital asset platform offering crypto savings and borrowing products. Its COINDEPO token governance program enables holders to participate in selected platform and ecosystem decisions.
The post CoinDepo Governance Turns Community Votes Into Asset Launches and Funding Decisions appeared first on Tokenist.
184
·
--
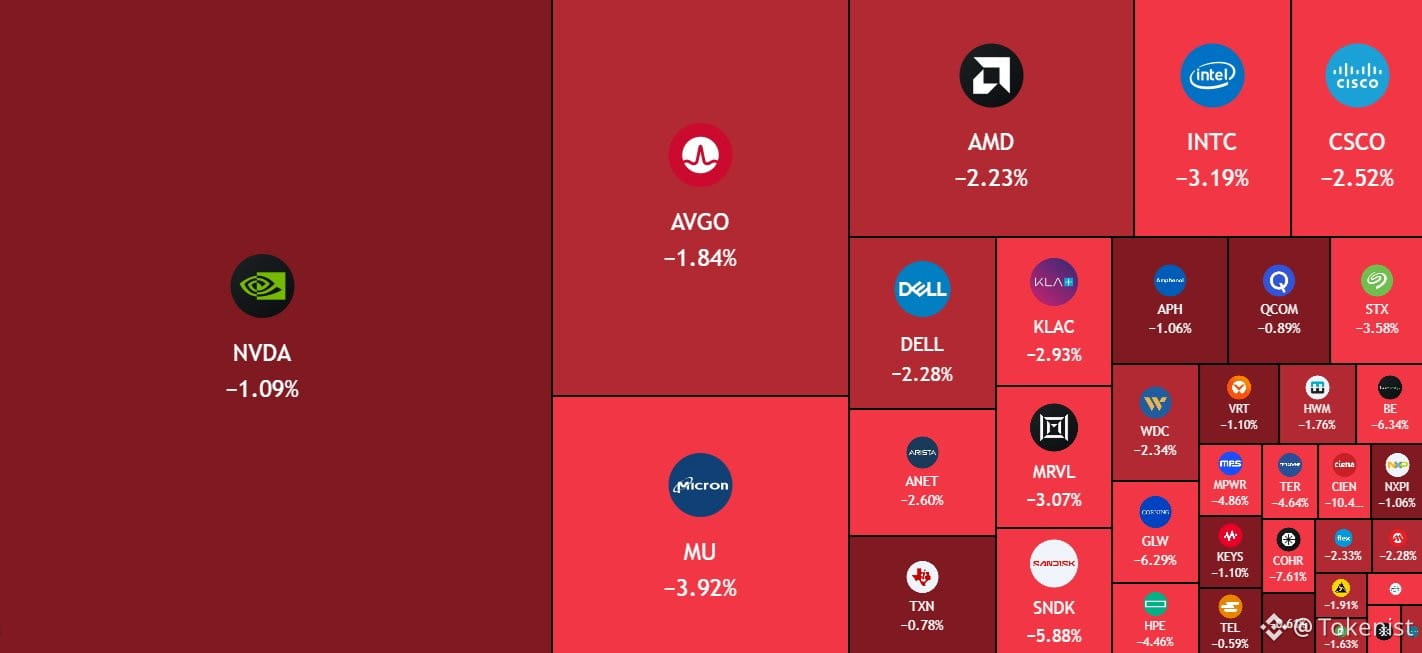
Мақала
Funding Stress Tests AI Stocks; Crypto Spillover Remains ConditionalSouth Korea’s KOSPI fell more than 6% on Tuesday, its fifth straight decline, while the Philadelphia Semiconductor Index headed for a sixth consecutive loss after gaining 68% in 2026. The retreat in AI stocks is testing whether higher, more volatile capital costs can carry stress from crowded positions into other risk assets, including Bitcoin and Ethereum.
Reuters identified elevated bond yields, concentrated positioning, tighter financing and overlapping portfolios as possible channels for broader de-risking.
For crypto investors watching the macro backdrop, that makes spillover from AI stocks a credible risk scenario, though Reuters reported no evidence that the chip rout has yet triggered a crypto liquidation.
JUST IN: BlackRock cuts its outlook on US stocks, citing concerns over AI market volatility. pic.twitter.com/sU6Gz5YrIt
— Watcher.Guru (@WatcherGuru) October 13, 2026
Crypto Expert Report: What Are the 10 Next Crypto to Explode in 2026?
Trade Strain Is Showing Up In Stocks And Credit
AI stocks
The losses are broad. Japan’s Kioxia fell 13%, the semiconductor index dropped 1.5% in U.S. trading, and Micron (MU) slid 5% after tripling this year. Shanghai’s STAR Market is down more than a third from its July peak, and the KOSPI sits about a quarter below its own July high. After such a strong run, crowded positioning in AI stocks means a shift in required returns or financing conditions can trigger selling even without signs that AI demand has collapsed.
Credit markets point to rising funding costs for the data-center buildout. Nvidia-backed Firmus shelved a planned $5 billion Australian IPO, and a CoreWeave (CRWV) bond issued in June at 9.625% now yields 15%, with the shares 49% below their 52-week high.
SoftBank recently paid up to 9.75% on $4.5 billion of high-yield debt, while 10-year Treasury yields stand at 5.2%. BlackRock’s research arm downgraded U.S. equities to neutral, citing AI-related volatility, and turned bullish on short-term Treasuries. Wilson Asset Management’s Damien Boey said bond yields and volatility are now feeding into asset pricing across the board.
Investors’ concern about concentrated AI positioning is therefore part of the same repricing question: how quickly can expected returns justify the capital committed?
AI Stocks And Crypto: Could Higher Yields Create a Possible Route To Crypto?
BTCUSDT Chart 1D TradingView
The link to crypto is not that chip prices dictate token prices. Rather, a broad pullback from AI stocks and other risk assets could hit holdings owned by the same investors, while higher yields make leveraged positions harder to sustain. In that scenario, liquid high-beta assets like Bitcoin may be among the first sold.
That remains a risk, not a confirmed event. The IMF warned Tuesday that an AI correction could have global consequences. For now, the evidence shows vulnerabilities that could spread stress, not forced crypto selling. The key watchpoint is whether pressure stays within AI stocks and related credit or broadens into general de-risking.
Prior analysis of Bitcoin’s sensitivity to Treasury yields addresses that relationship, but it does not establish that this particular semiconductor decline has caused a crypto-market reaction.
Crypto Expert Report: Follow The Money – Which Presales Are Attracting Crypto Whales in 2026?
The post Funding Stress Tests AI Stocks; Crypto Spillover Remains Conditional appeared first on Tokenist.
Funding Stress Tests AI Stocks; Crypto Spillover Remains Conditional
South Korea’s KOSPI fell more than 6% on Tuesday, its fifth straight decline, while the Philadelphia Semiconductor Index headed for a sixth consecutive loss after gaining 68% in 2026. The retreat in AI stocks is testing whether higher, more volatile capital costs can carry stress from crowded positions into other risk assets, including Bitcoin and Ethereum.
Reuters identified elevated bond yields, concentrated positioning, tighter financing and overlapping portfolios as possible channels for broader de-risking.
For crypto investors watching the macro backdrop, that makes spillover from AI stocks a credible risk scenario, though Reuters reported no evidence that the chip rout has yet triggered a crypto liquidation.
JUST IN: BlackRock cuts its outlook on US stocks, citing concerns over AI market volatility. pic.twitter.com/sU6Gz5YrIt
— Watcher.Guru (@WatcherGuru) October 13, 2026
Crypto Expert Report: What Are the 10 Next Crypto to Explode in 2026?
Trade Strain Is Showing Up In Stocks And Credit
AI stocks
The losses are broad. Japan’s Kioxia fell 13%, the semiconductor index dropped 1.5% in U.S. trading, and Micron (MU) slid 5% after tripling this year. Shanghai’s STAR Market is down more than a third from its July peak, and the KOSPI sits about a quarter below its own July high. After such a strong run, crowded positioning in AI stocks means a shift in required returns or financing conditions can trigger selling even without signs that AI demand has collapsed.
Credit markets point to rising funding costs for the data-center buildout. Nvidia-backed Firmus shelved a planned $5 billion Australian IPO, and a CoreWeave (CRWV) bond issued in June at 9.625% now yields 15%, with the shares 49% below their 52-week high.
SoftBank recently paid up to 9.75% on $4.5 billion of high-yield debt, while 10-year Treasury yields stand at 5.2%. BlackRock’s research arm downgraded U.S. equities to neutral, citing AI-related volatility, and turned bullish on short-term Treasuries. Wilson Asset Management’s Damien Boey said bond yields and volatility are now feeding into asset pricing across the board.
Investors’ concern about concentrated AI positioning is therefore part of the same repricing question: how quickly can expected returns justify the capital committed?
AI Stocks And Crypto: Could Higher Yields Create a Possible Route To Crypto?
BTCUSDT Chart 1D TradingView
The link to crypto is not that chip prices dictate token prices. Rather, a broad pullback from AI stocks and other risk assets could hit holdings owned by the same investors, while higher yields make leveraged positions harder to sustain. In that scenario, liquid high-beta assets like Bitcoin may be among the first sold.
That remains a risk, not a confirmed event. The IMF warned Tuesday that an AI correction could have global consequences. For now, the evidence shows vulnerabilities that could spread stress, not forced crypto selling. The key watchpoint is whether pressure stays within AI stocks and related credit or broadens into general de-risking.
Prior analysis of Bitcoin’s sensitivity to Treasury yields addresses that relationship, but it does not establish that this particular semiconductor decline has caused a crypto-market reaction.
Crypto Expert Report: Follow The Money – Which Presales Are Attracting Crypto Whales in 2026?
The post Funding Stress Tests AI Stocks; Crypto Spillover Remains Conditional appeared first on Tokenist.
342
Көбірек контент көру үшін кіріңіз
Binance Square платформасында әлемдік криптоқоғамдастыққа қосылыңыз
⚡️ Криптовалюта туралы ең соңғы және пайдалы ақпаратты алыңыз.
💬 Әлемдегі ең ірі криптобиржаның сеніміне ие.
👍 Расталған авторлардың нақты пікірлерін табыңыз.
Электрондық пошта/телефон нөмірі
Трендтегі тақырыптар
BinancePick
2.8M рет көрілді
147,821 адам талқылап жатыр
Join #EarningsSeason: Predict Earnings on Binance Pick, Share Your Take on Binance Square!
Binance Square Official
·403 лайк
·340.9k рет көрілді
EarningsSeason
5.1M рет көрілді
25,250 адам талқылап жатыр
AnthropicTTMRevenueGrewAbout1200%
2,360 рет көрілді
135 адам талқылап жатыр