

Thebitcoin537
1k Жариялаулар

Thebitcoin537
Хабарлау
Пайдаланушыны блоктау
We post more trades - Twitter @Thebitcoin537
0 Жазылым
789 Жазылушылар
1.3K+ лайк басылған
Жазбалар
Барлығы
Баға ұсыныстары
Видеолар
PINNED
·
--
Жоғары (өспелі)
$PENGU
{future}(PENGUUSDT)
tp hit
$PENGU
tp hit
tp hit
Thebitcoin537
·
--
Жоғары (өспелі)$PENGU
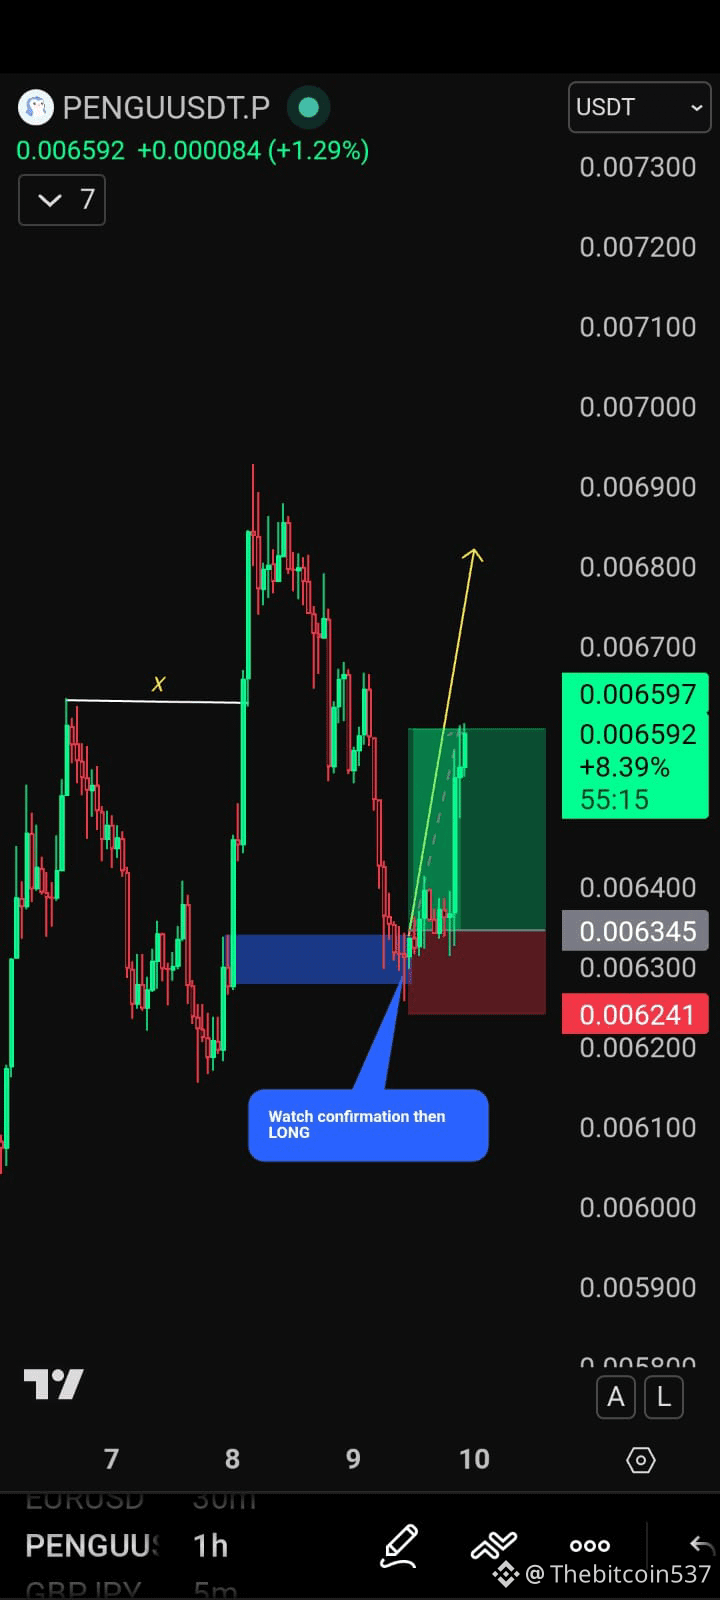
PENGUUSDT – 1H Update
Price tapping demand after pullback.
Watching demand / POI (≈0.00620–0.00635) 🔵
🔎 Plan:
• Wait for confirmation at zone
• Look for bullish reaction
• If holds → move toward 0.00680+
#pengu #thebitcoin537
PENGUUSDT – 1H Update
Price tapping demand after pullback.
Watching demand / POI (≈0.00620–0.00635) 🔵
🔎 Plan:
• Wait for confirmation at zone
• Look for bullish reaction
• If holds → move toward 0.00680+
#pengu #thebitcoin537
129
·
--
Жоғары (өспелі)
$MAGIC
{future}(MAGICUSDT)
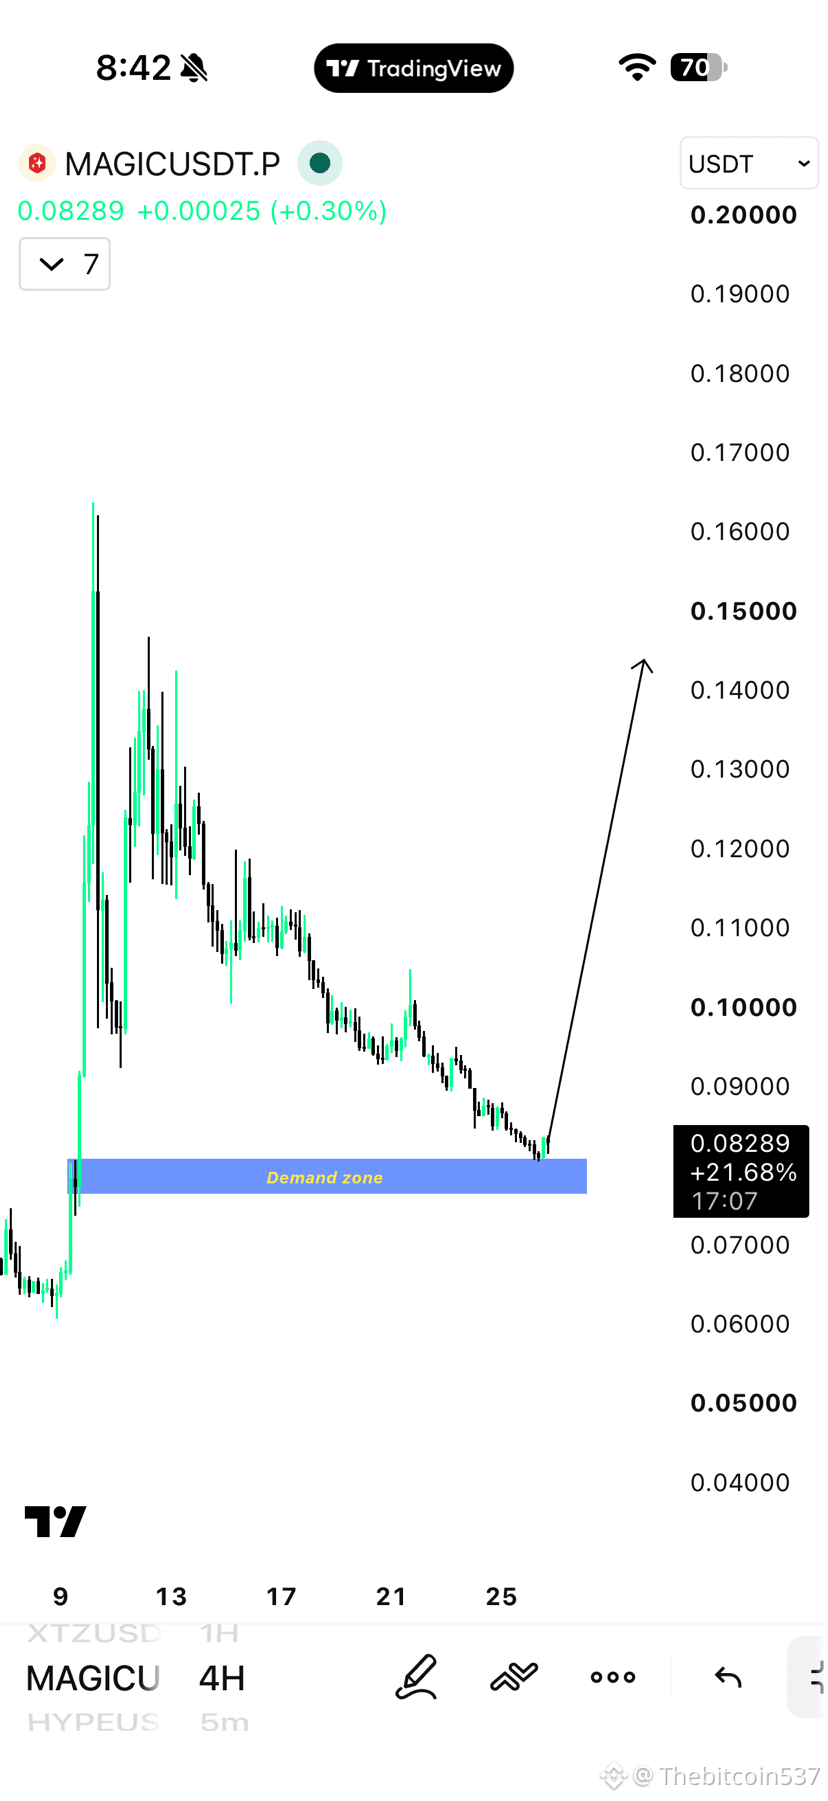
$MAGIC coin in 4H Demand Zone 📈. Confirmation candle can pump it hard 🚀.
Keep in your list 📝.
$MAGIC
$MAGIC coin in 4H Demand Zone 📈. Confirmation candle can pump it hard 🚀.
Keep in your list 📝.
$MAGIC coin in 4H Demand Zone 📈. Confirmation candle can pump it hard 🚀.
Keep in your list 📝.
33
·
--
Жоғары (өспелі)
$ETH
{future}(ETHUSDT)
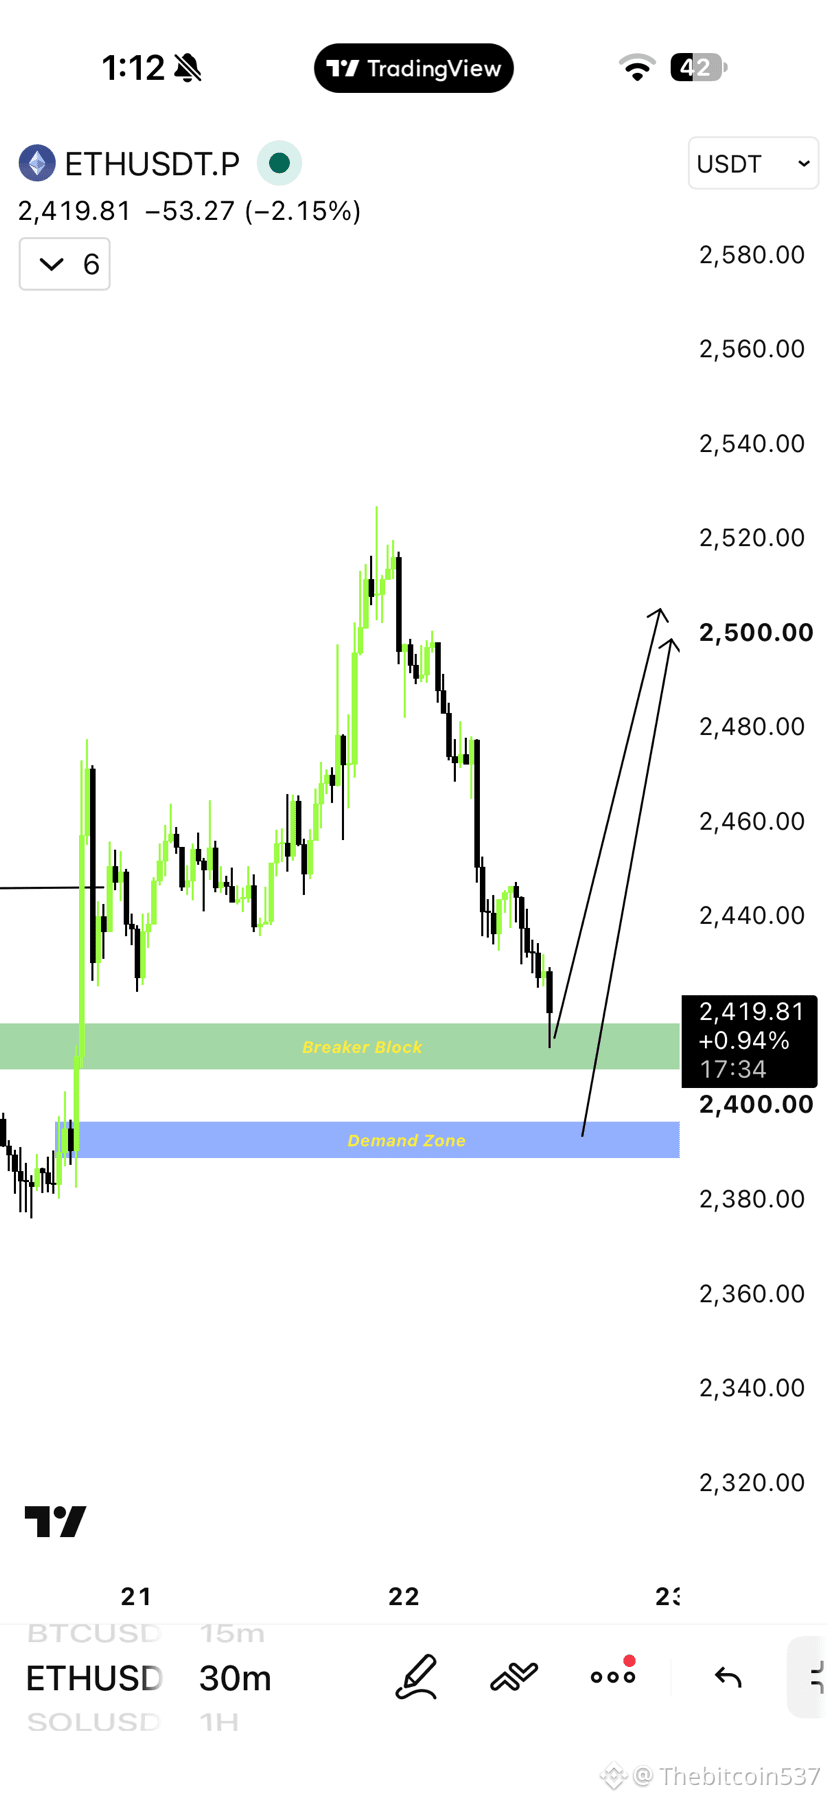
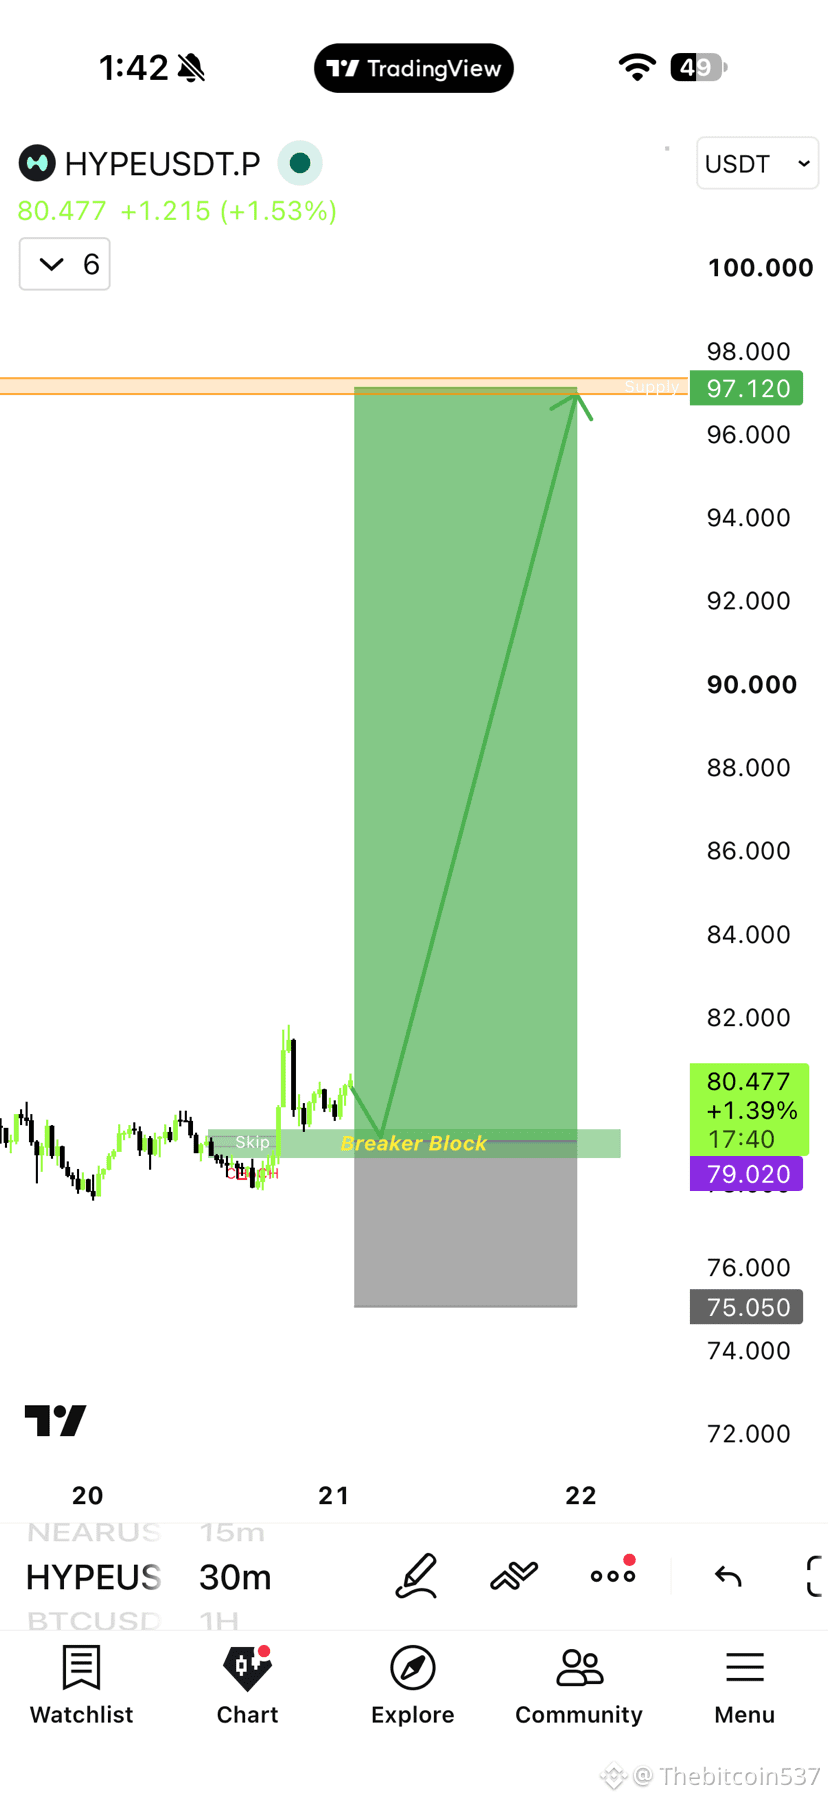
$ETH up from either marked BREAKER BLOCK area 📈 or if it goes down then there is Bullush Demand Zone where we can plan for LONGs.
#EthereumSurpasses$2500 #EarningsSeason
$ETH
$ETH up from either marked BREAKER BLOCK area 📈 or if it goes down then there is Bullush Demand Zone where we can plan for LONGs.
#EthereumSurpasses$2500 #EarningsSeason
$ETH up from either marked BREAKER BLOCK area 📈 or if it goes down then there is Bullush Demand Zone where we can plan for LONGs.
#EthereumSurpasses$2500 #EarningsSeason
188
·
--
Жоғары (өспелі)
$TAO
{future}(TAOUSDT)
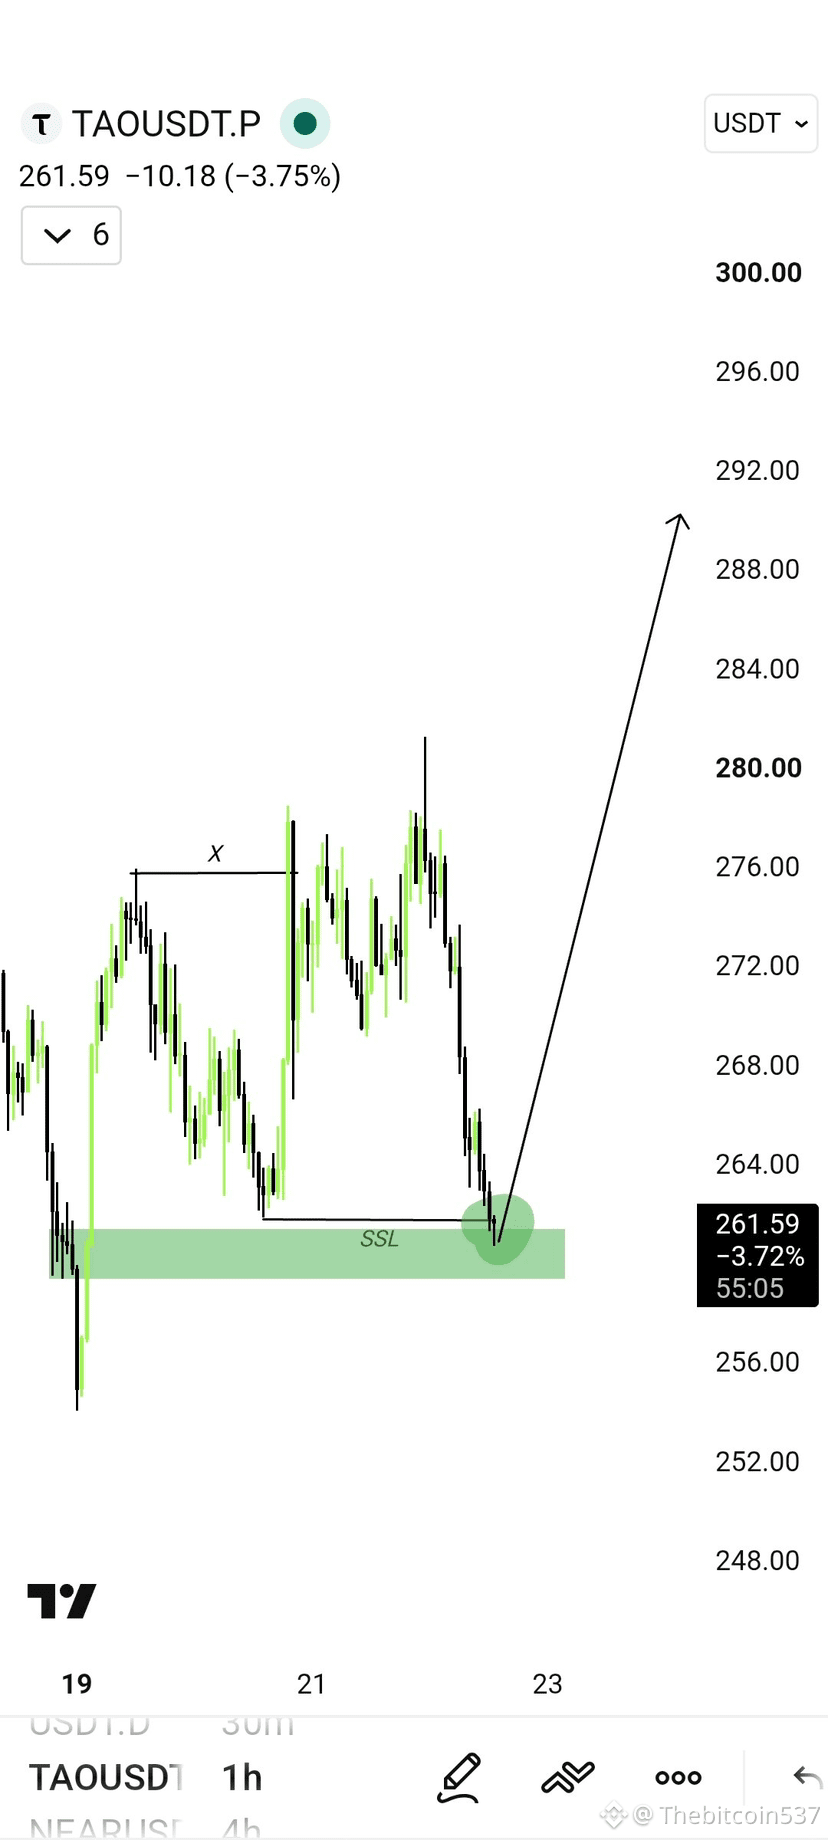
$TAO SSL Sweep Sweep Setup.
If BTC and Usdt dominance behaves then it can pump hard. Manage your risk.
$TAO
$TAO SSL Sweep Sweep Setup.
If BTC and Usdt dominance behaves then it can pump hard. Manage your risk.
$TAO SSL Sweep Sweep Setup.
If BTC and Usdt dominance behaves then it can pump hard. Manage your risk.
2
1.4k
·
--
Жоғары (өспелі)
$DOGE
{future}(DOGEUSDT)
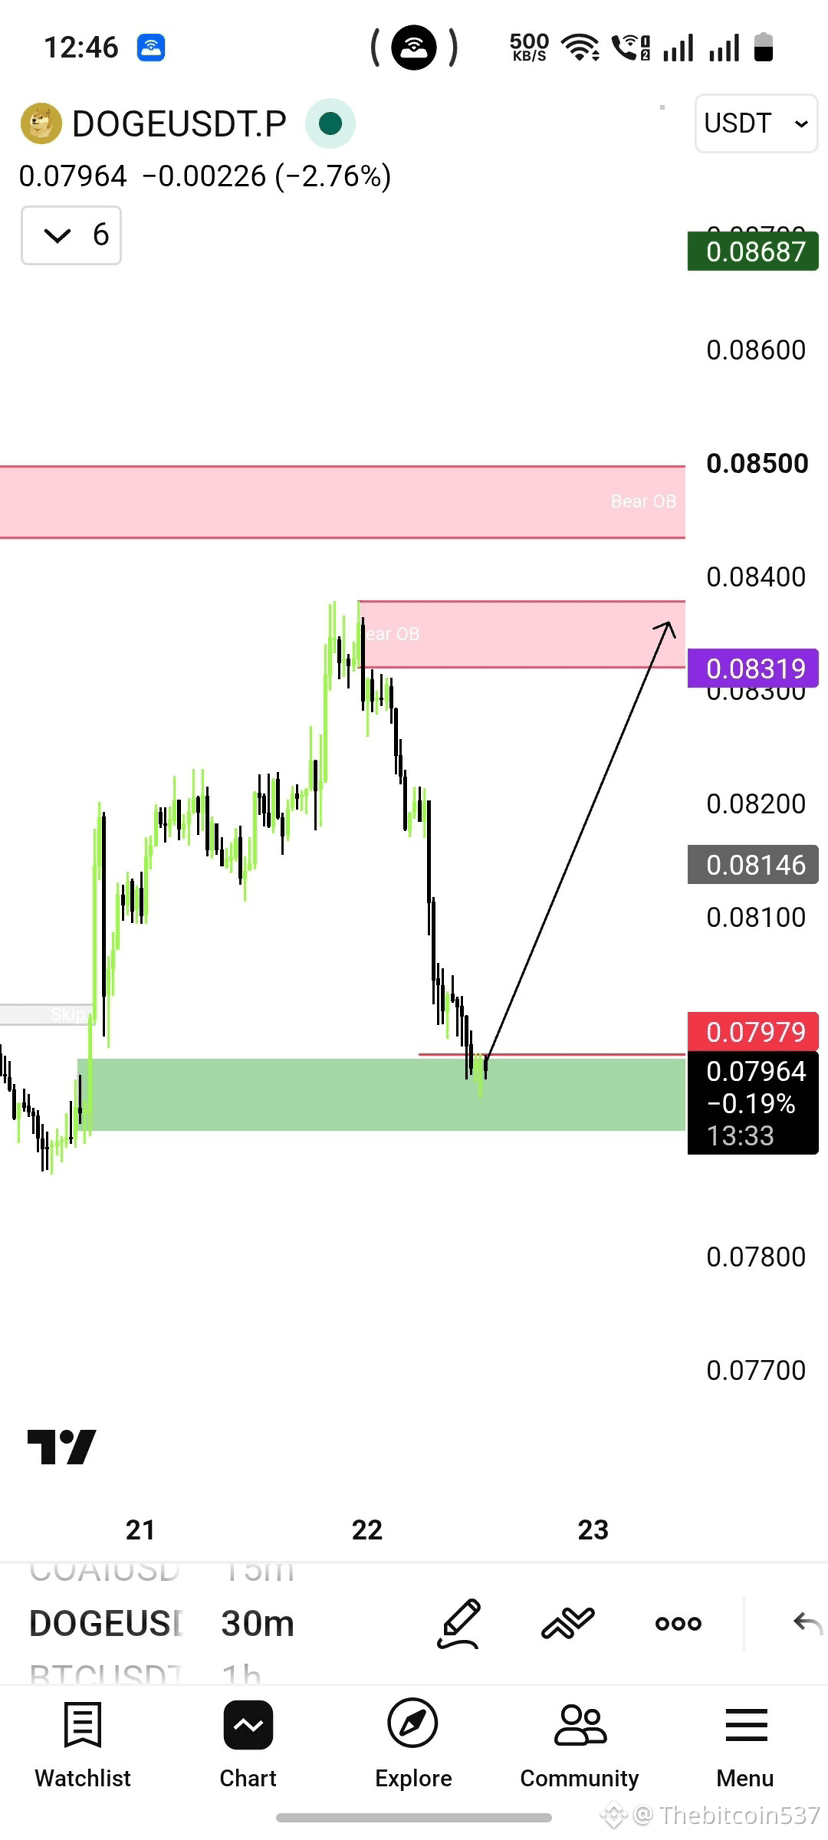
$DOGE Plan to long with confirmation.
Reason:- Bullish Structure break then came in Demand/OB area.
#EarningsSeason #BitcoinDropsBelow$84K
$DOGE
$DOGE Plan to long with confirmation.
Reason:- Bullish Structure break then came in Demand/OB area.
#EarningsSeason #BitcoinDropsBelow$84K
$DOGE Plan to long with confirmation.
Reason:- Bullish Structure break then came in Demand/OB area.
#EarningsSeason #BitcoinDropsBelow$84K
162
·
--
Жоғары (өспелі)
$ETH
{future}(ETHUSDT)
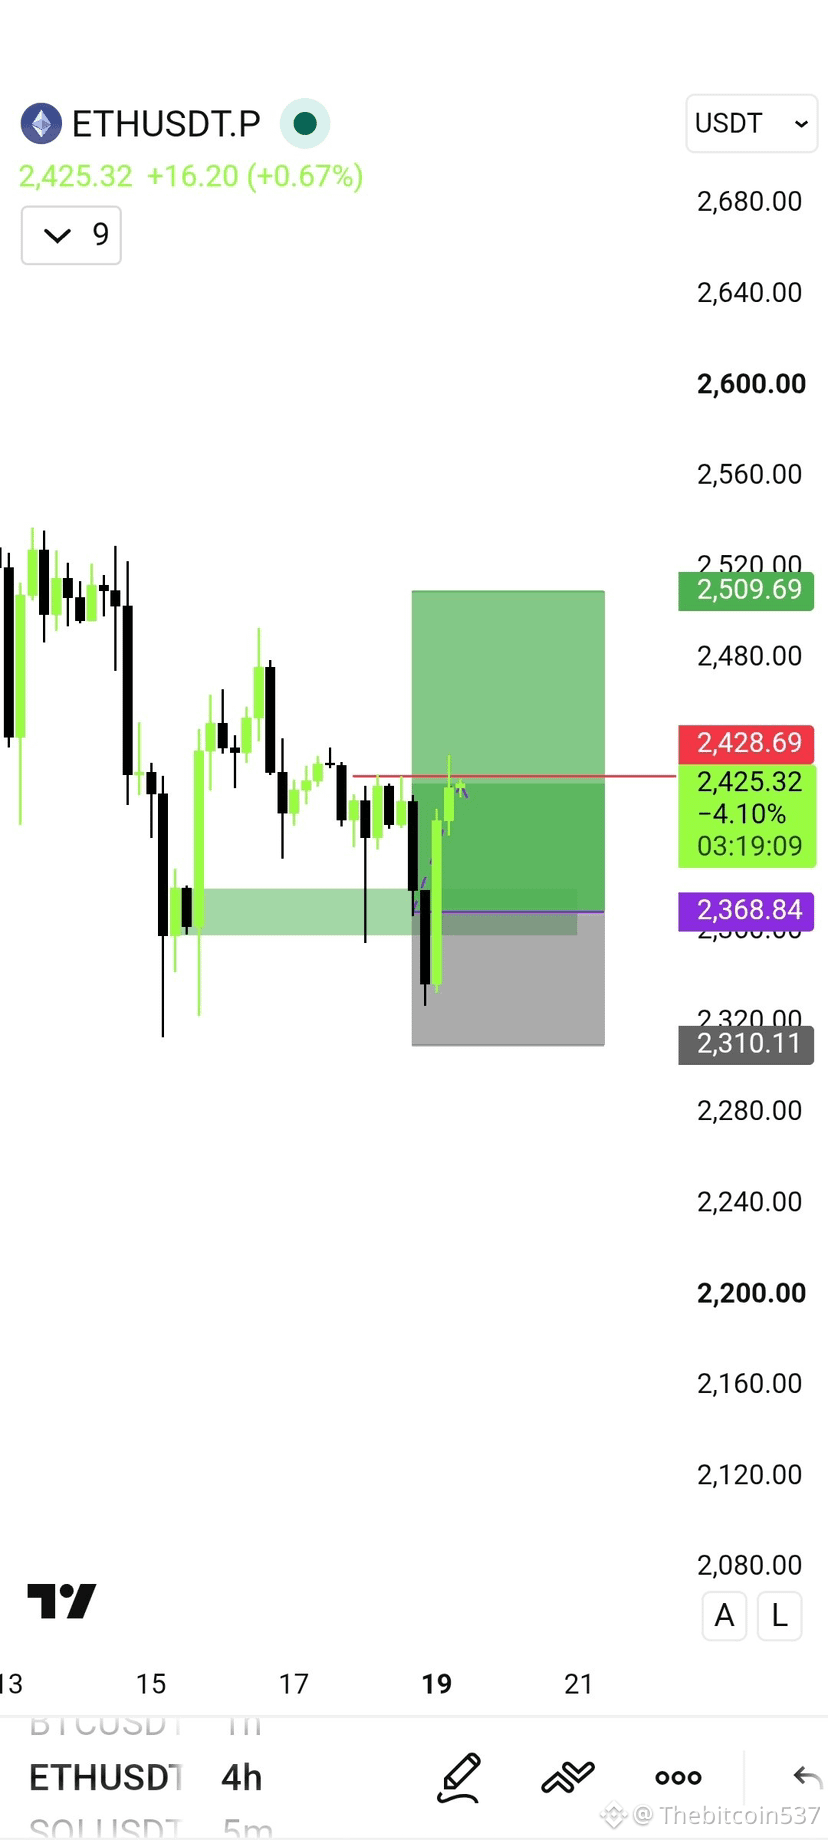
1Rup. Take TP1 and move SL at entry. Follow for more
#
$ETH
1Rup. Take TP1 and move SL at entry. Follow for more
#
1Rup. Take TP1 and move SL at entry. Follow for more
#
Thebitcoin537
·
--
Жоғары (өспелі)$ETH
$ETH on 4H timeframe 📊
Let's see how it goes 😉.
Manage your risk and Take TP1 at 1:1 while moving SL at entry 🛡️
$ETH on 4H timeframe 📊
Let's see how it goes 😉.
Manage your risk and Take TP1 at 1:1 while moving SL at entry 🛡️
98
·
--
Жоғары (өспелі)
$ETH
{future}(ETHUSDT)
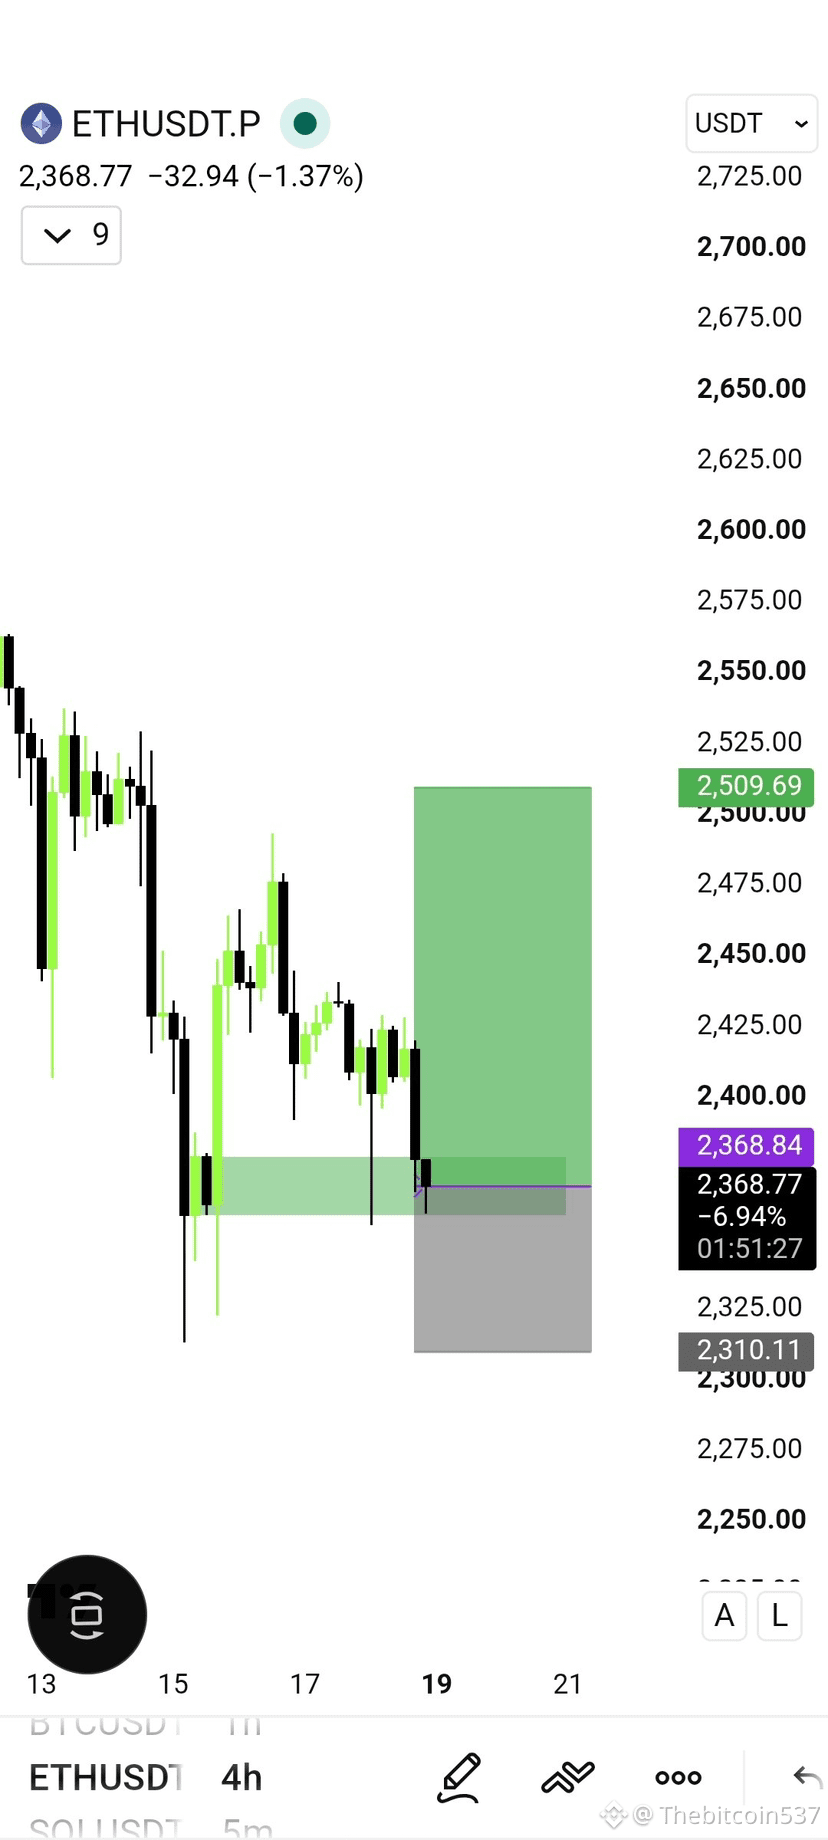
$ETH on 4H timeframe 📊
Let's see how it goes 😉.
Manage your risk and Take TP1 at 1:1 while moving SL at entry 🛡️
$ETH
$ETH on 4H timeframe 📊
Let's see how it goes 😉.
Manage your risk and Take TP1 at 1:1 while moving SL at entry 🛡️
$ETH on 4H timeframe 📊
Let's see how it goes 😉.
Manage your risk and Take TP1 at 1:1 while moving SL at entry 🛡️
1
162
·
--
Жоғары (өспелі)
$XRP
{future}(XRPUSDT)
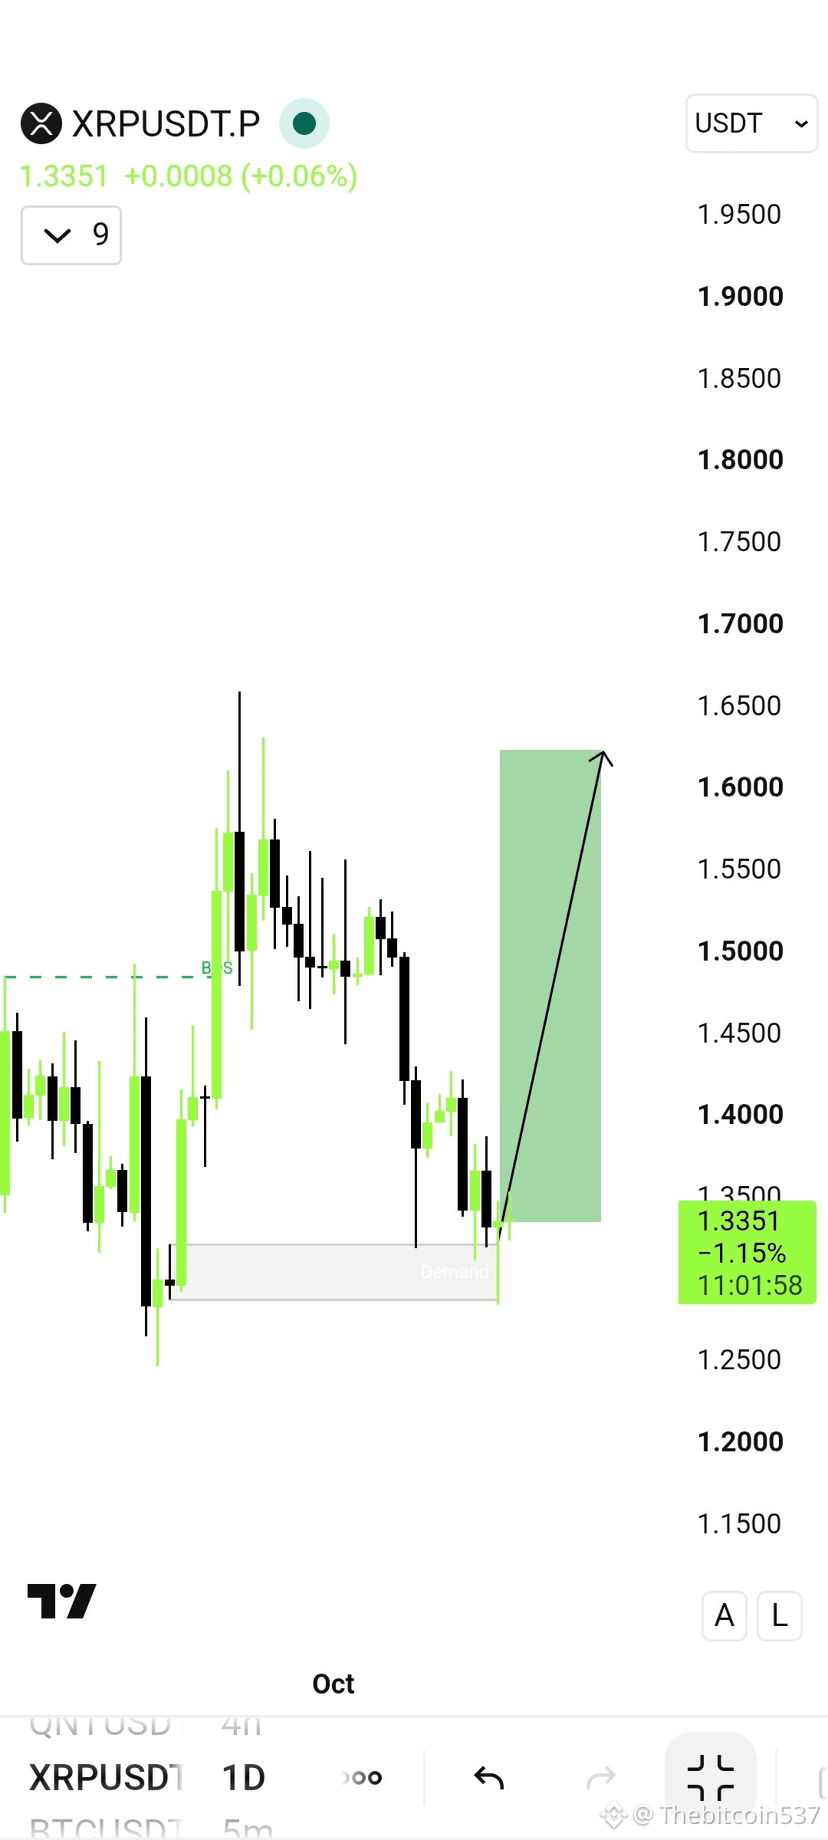
$XRP 1D. 📊
Price tapped 1D Demand Zone, let's wait for proper confirmation then can take Swing LONG. 📈
#Xrp🔥🔥
$XRP
$XRP 1D. 📊
Price tapped 1D Demand Zone, let's wait for proper confirmation then can take Swing LONG. 📈
#Xrp🔥🔥
$XRP 1D. 📊
Price tapped 1D Demand Zone, let's wait for proper confirmation then can take Swing LONG. 📈
#Xrp🔥🔥
1
142
·
--
Жоғары (өспелі)
$PEPE
{spot}(PEPEUSDT)
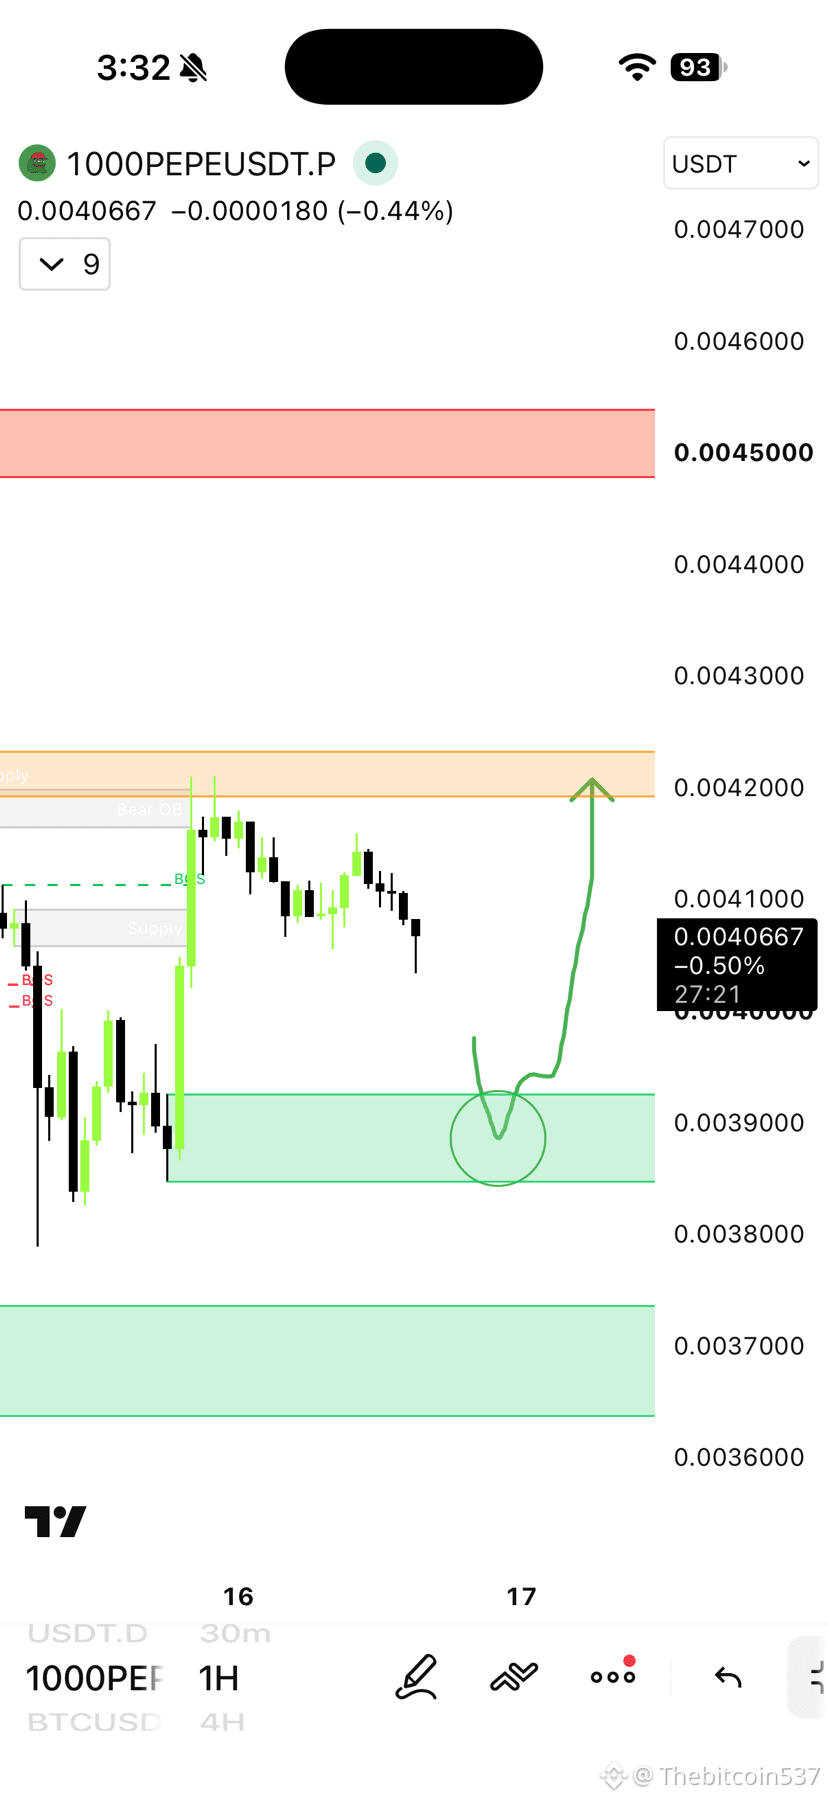
1000PEPE Long Plan from marked OB area. 👀 Watch long confirmation in circled area when price comes at then take LONG. 📈
$PEPE
1000PEPE Long Plan from marked OB area. 👀 Watch long confirmation in circled area when price comes at then take LONG. 📈
1000PEPE Long Plan from marked OB area. 👀 Watch long confirmation in circled area when price comes at then take LONG. 📈
375
·
--
Жоғары (өспелі)
📊 CRYPTO MARKET UPDATE — 16 Oct
🟡 Update from yesterday: $80K got swept — and bought back hard.
🟠 BTC — $81,977
Yesterday we said: $80,000 is the last big support.
BTC broke below it to $79,732 — then buyers stepped in and closed the day at $82,195, green.
That came on the heaviest volume of the week, with a long wick below. That's a sweep of the $80K stops, not a breakdown.
First real sign of buyers in 10 days.
But the trend is still down: lower highs at $84,000 haven't changed.
Hold $80K = bounce toward $84,000. Lose $79,700 = the sweep failed, $76–78K next.
🔷 ETH — $2,450
Same story. Swept below the September low to $2,313, then reclaimed and closed at $2,441.
Now back above $2,400. The $2,357 September low held on the close.
💵 USDT Dominance — 6.71% 🔻
Spiked to 6.94% yesterday — the highest of this whole selloff — then reversed. Panic peaked and faded.
👑 BTC Dominance — 60.3% 🔻
Slightly down from 60.4%. Alts stopped bleeding harder than BTC.
🪙 Altcoins (TOTAL3) — $787B
Wicked to $762B, bounced back. Same sweep-and-recover as BTC.
📌 Bottom line:
Every chart did the same thing: swept the low, got bought, closed higher.
Stablecoin dominance spiked and reversed in the same candle — that's what a capitulation flush usually looks like.
👉 This is the first spot in two weeks where a bounce makes sense. But it's a bounce inside a downtrend until BTC reclaims $84,000.
Don't go all-in — sellers still own the highs.
⚠️ NFA — manage your risk.
$BTC $ETH
{future}(ETHUSDT)
#BitcoinRecoversTo$82K
📊 CRYPTO MARKET UPDATE — 16 Oct
🟡 Update from yesterday: $80K got swept — and bought back hard.
🟠 BTC — $81,977
Yesterday we said: $80,000 is the last big support.
BTC broke below it to $79,732 — then buyers stepped in and closed the day at $82,195, green.
That came on the heaviest volume of the week, with a long wick below. That's a sweep of the $80K stops, not a breakdown.
First real sign of buyers in 10 days.
But the trend is still down: lower highs at $84,000 haven't changed.
Hold $80K = bounce toward $84,000. Lose $79,700 = the sweep failed, $76–78K next.
🔷 ETH — $2,450
Same story. Swept below the September low to $2,313, then reclaimed and closed at $2,441.
Now back above $2,400. The $2,357 September low held on the close.
💵 USDT Dominance — 6.71% 🔻
Spiked to 6.94% yesterday — the highest of this whole selloff — then reversed. Panic peaked and faded.
👑 BTC Dominance — 60.3% 🔻
Slightly down from 60.4%. Alts stopped bleeding harder than BTC.
🪙 Altcoins (TOTAL3) — $787B
Wicked to $762B, bounced back. Same sweep-and-recover as BTC.
📌 Bottom line:
Every chart did the same thing: swept the low, got bought, closed higher.
Stablecoin dominance spiked and reversed in the same candle — that's what a capitulation flush usually looks like.
👉 This is the first spot in two weeks where a bounce makes sense. But it's a bounce inside a downtrend until BTC reclaims $84,000.
Don't go all-in — sellers still own the highs.
⚠️ NFA — manage your risk.
$BTC $ETH
#BitcoinRecoversTo$82K
136
·
--
Жоғары (өспелі)
Thebitcoin537
·
--
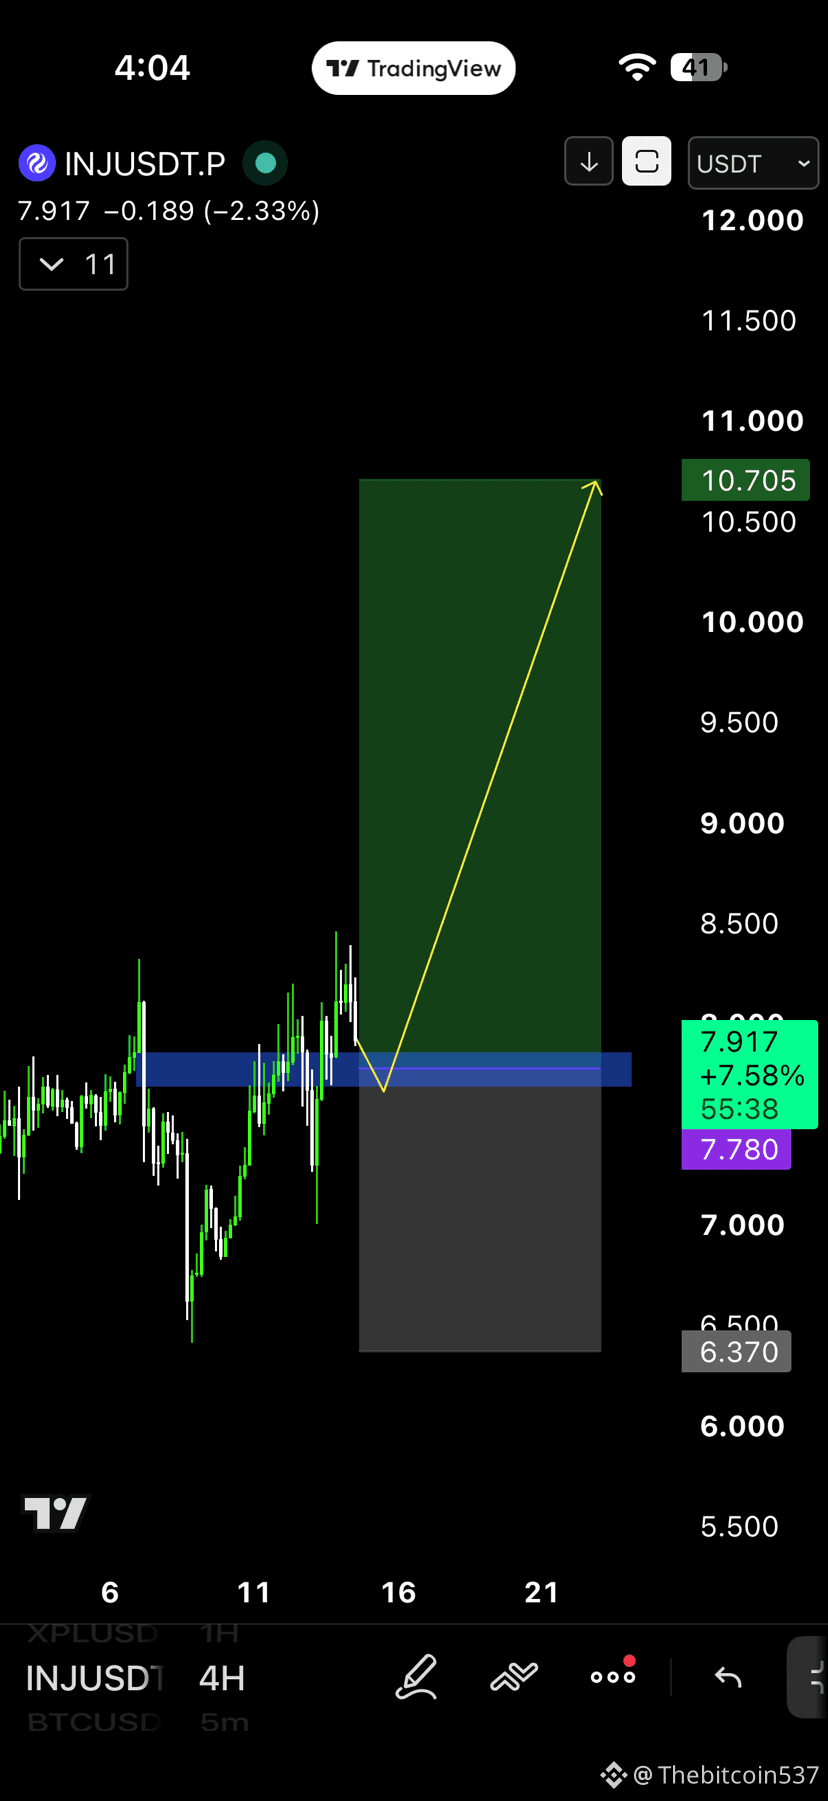
Жоғары (өспелі)$INJ
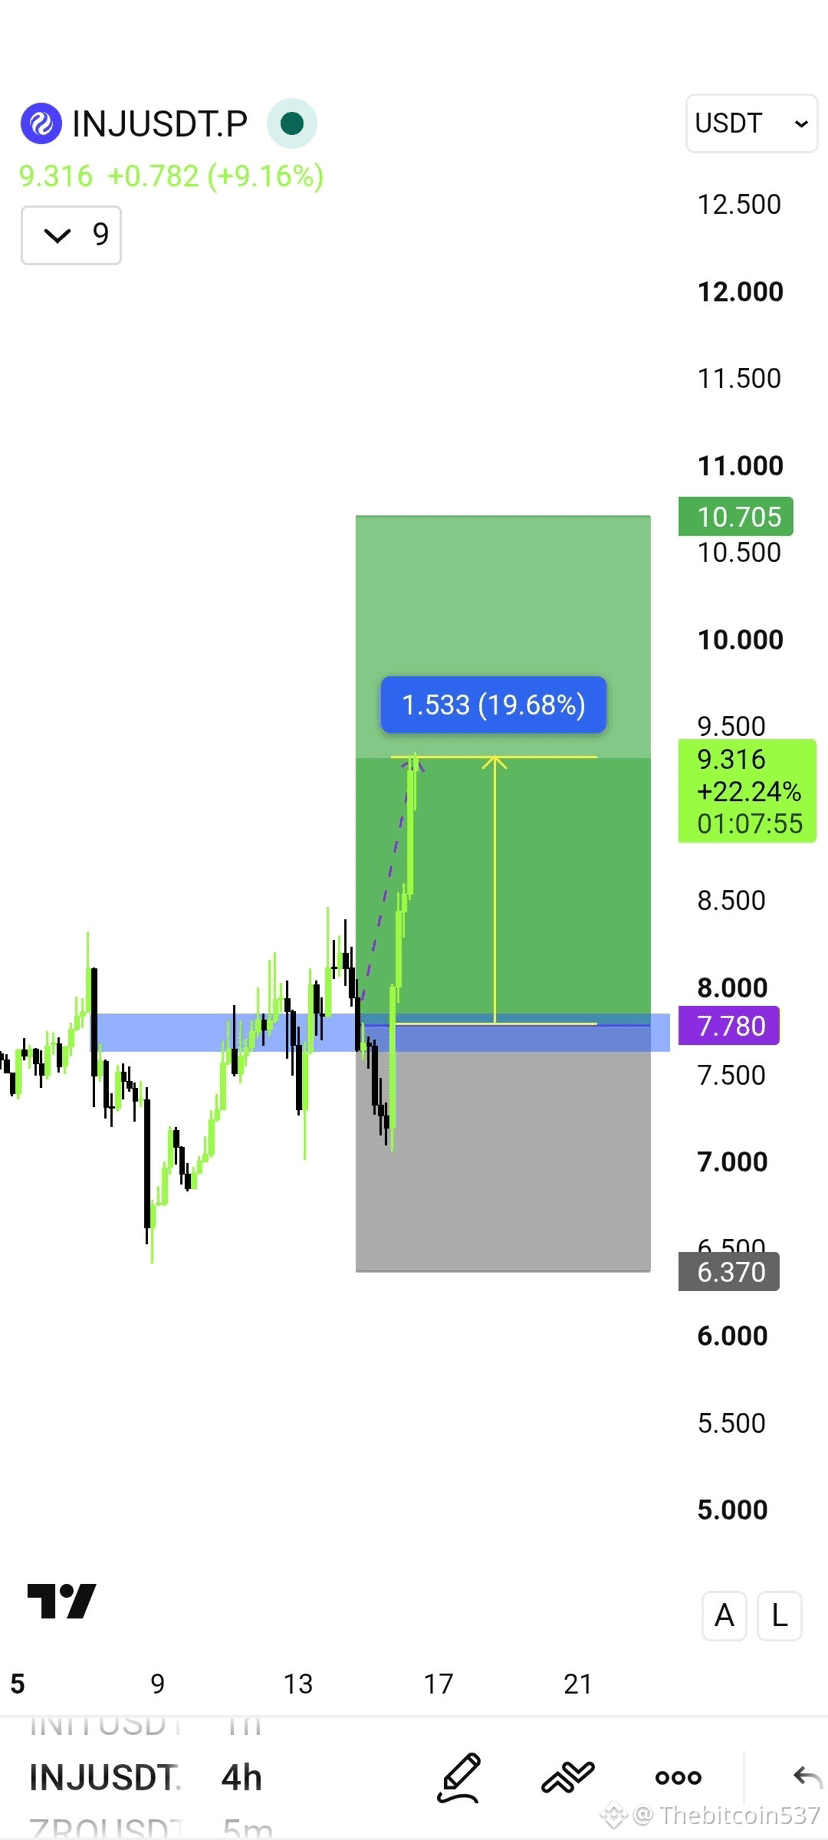
$INJ 4H limit LONG plan. 📈
$INJ 4H limit LONG plan. 📈
169
·
--
Жоғары (өспелі)
It did 1.5R then closed BE.
It did 1.5R then closed BE.
Thebitcoin537
·
--
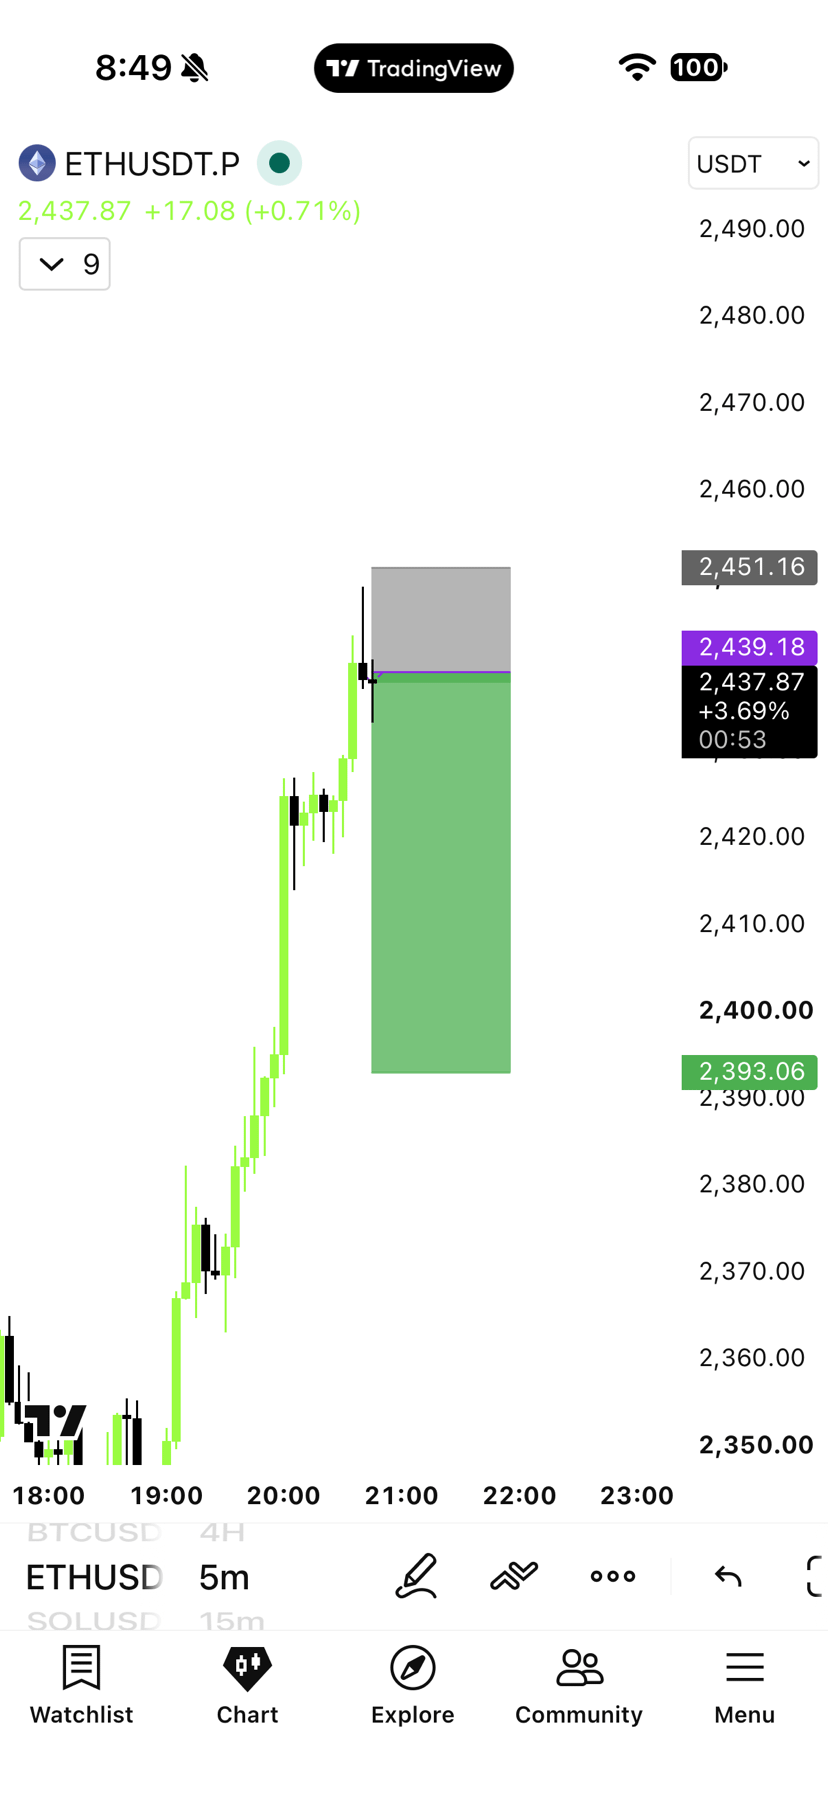
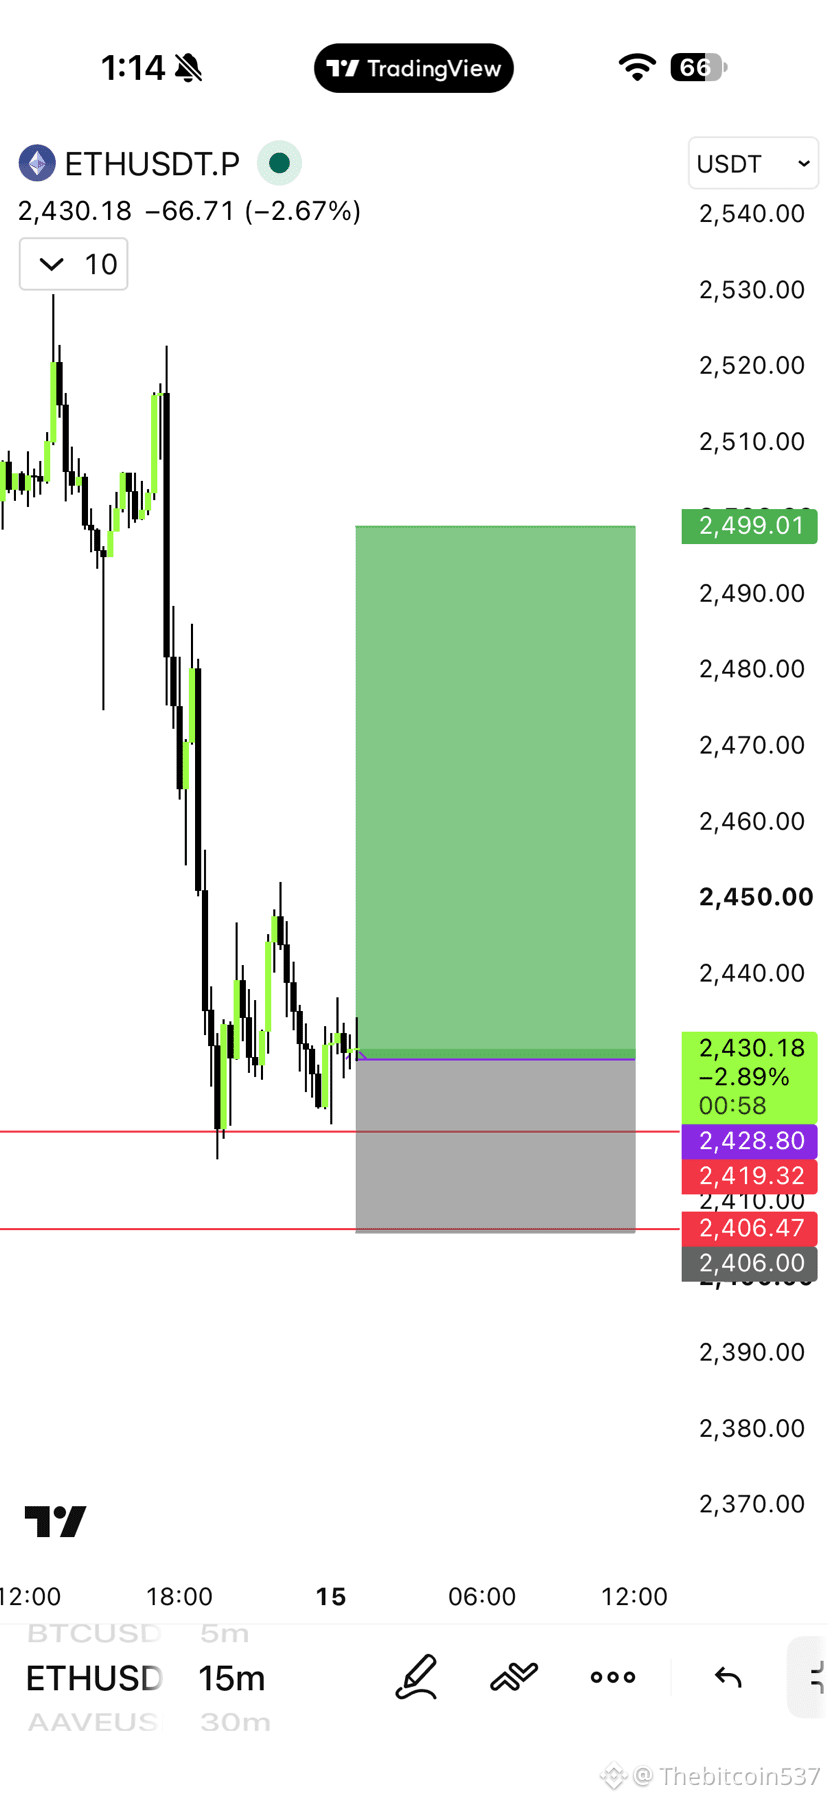
Төмен (кемімелі)$ETH
Short for 3R Take profit.
Short for 3R Take profit.
87
·
--
Жоғары (өспелі)
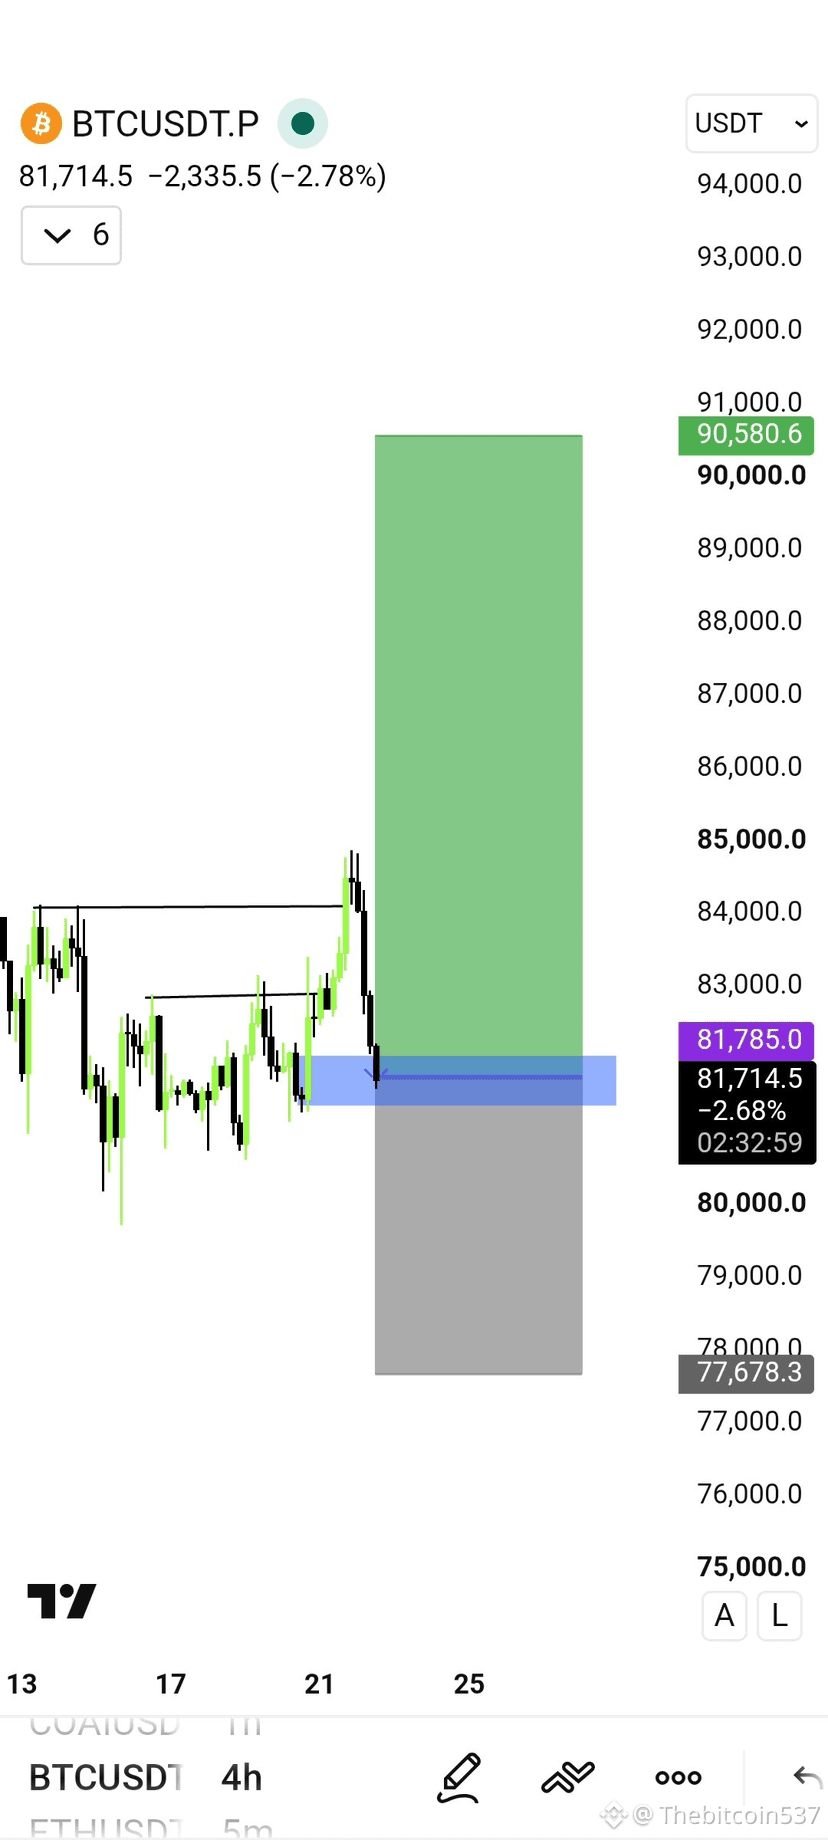
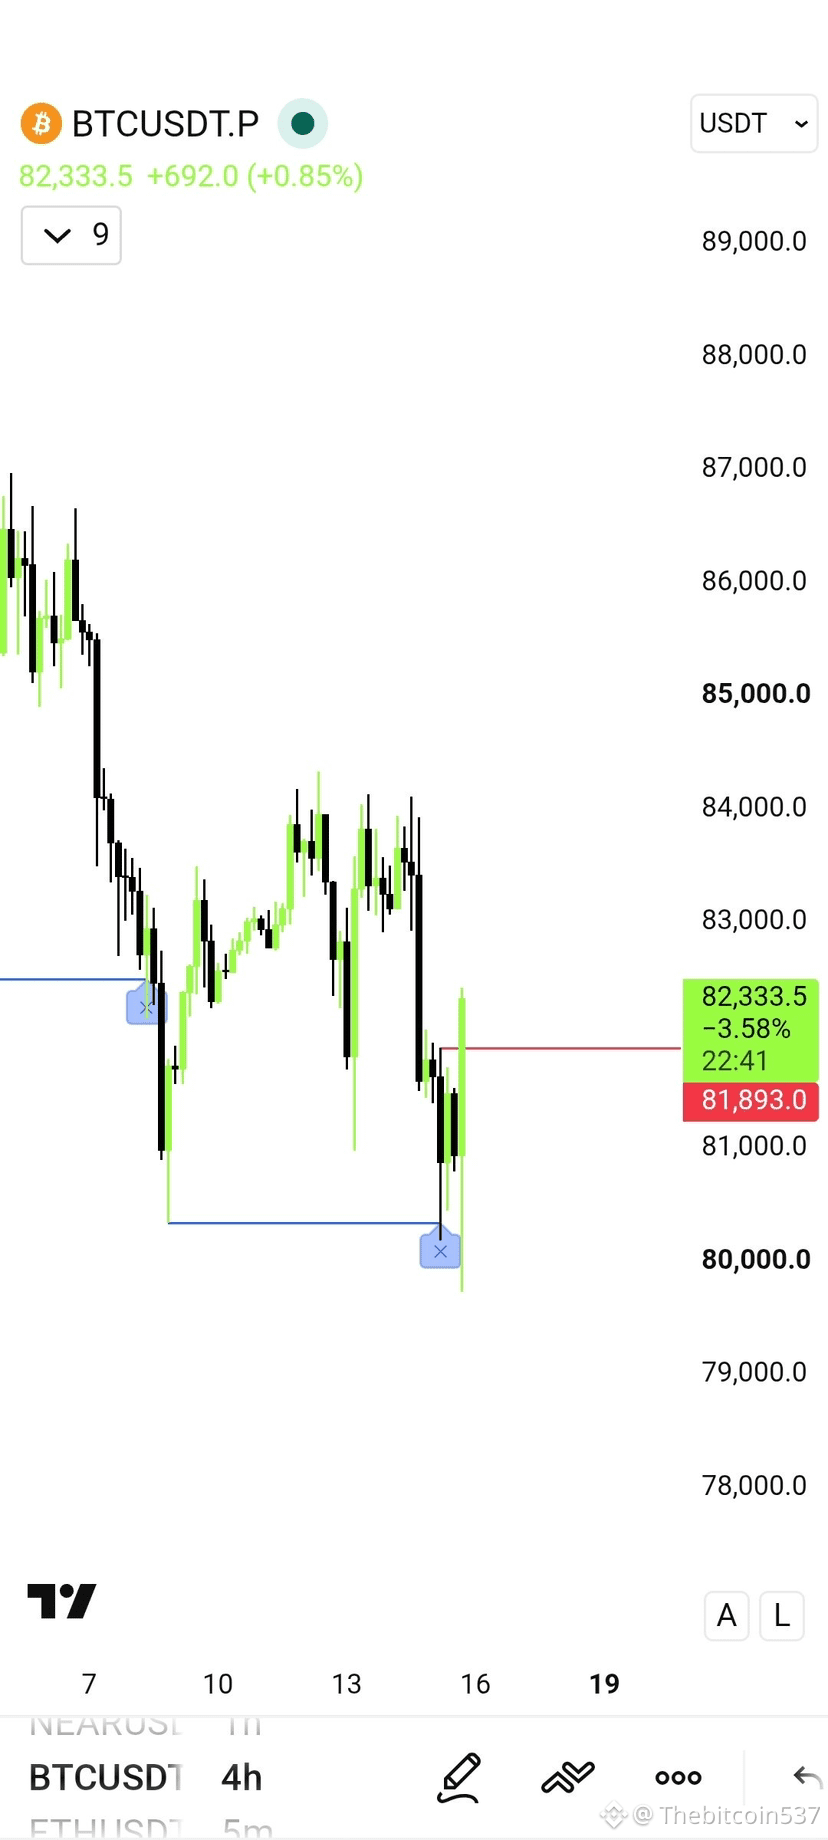
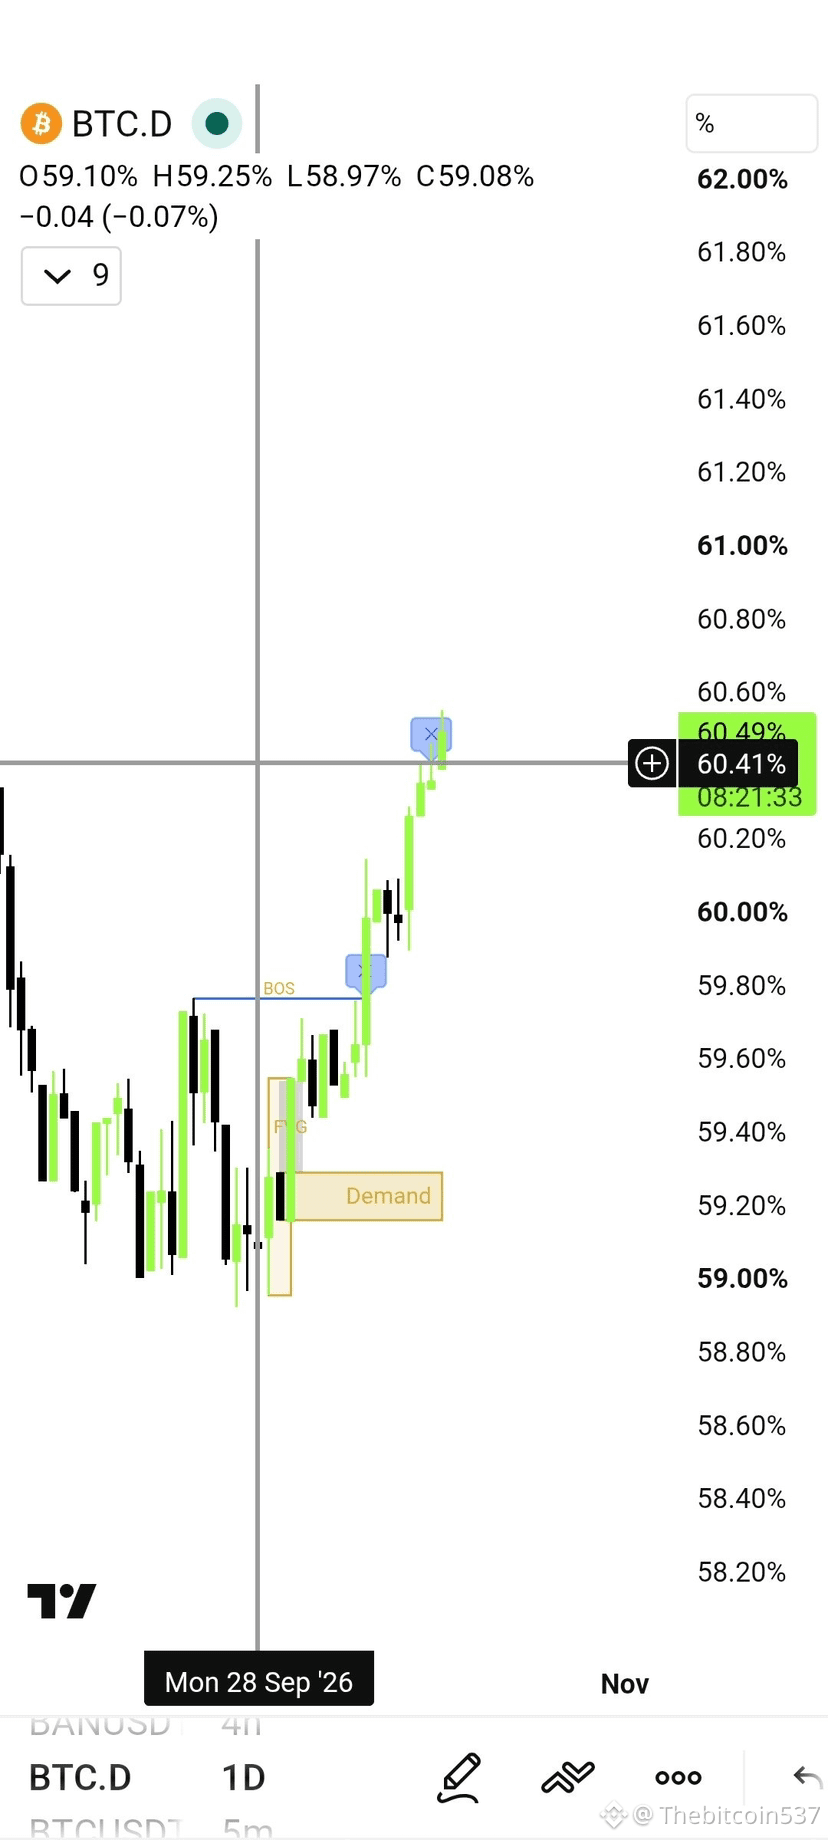
$BTC 📈 4H candle closing above the marked red line (81893) and also BTC.D 1D Candle closing below 60.41% can set the Alts pump from tomorrow till Tuesday. 🚀
Note:- These conditions must be fulfilled to be bullish. $BTC
{future}(BTCUSDT)
$BTC 📈 4H candle closing above the marked red line (81893) and also BTC.D 1D Candle closing below 60.41% can set the Alts pump from tomorrow till Tuesday. 🚀
Note:- These conditions must be fulfilled to be bullish. $BTC
Note:- These conditions must be fulfilled to be bullish. $BTC
155
·
--
Төмен (кемімелі)
1
1
214
·
--
Жоғары (өспелі)
1
1
332
·
--
Жоғары (өспелі)
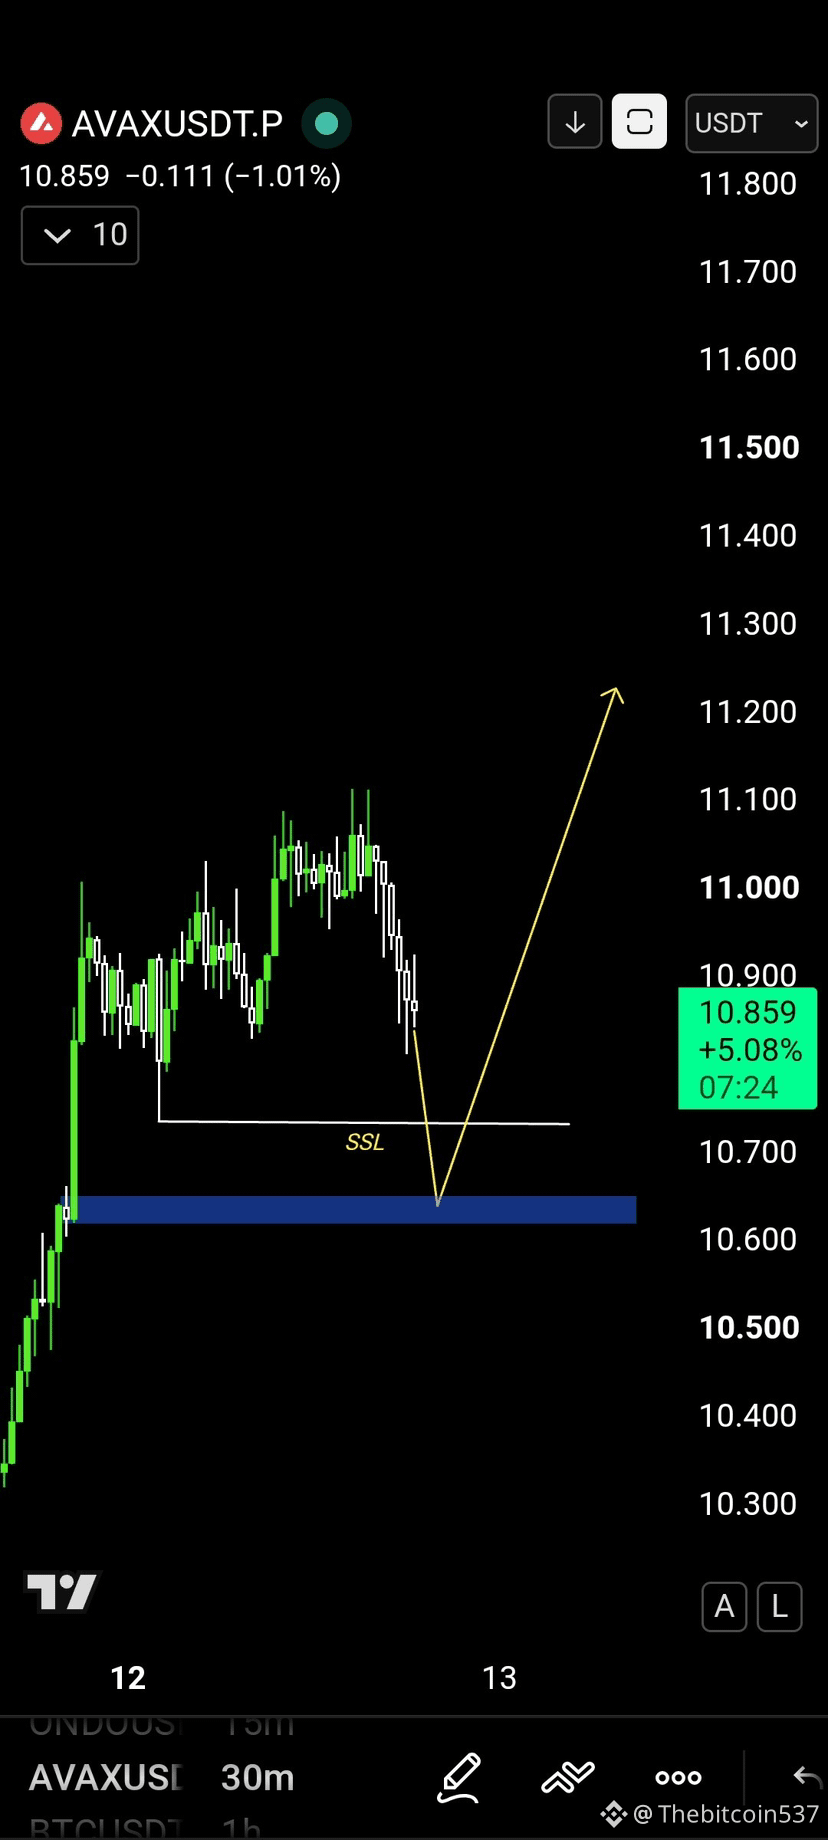
$AVAX
{future}(AVAXUSDT)
Reason:- Demand zone + FVG + SSL.
$AVAX
Reason:- Demand zone + FVG + SSL.
Reason:- Demand zone + FVG + SSL.
162
·
--
Жоғары (өспелі)
$VVV
{future}(VVVUSDT)
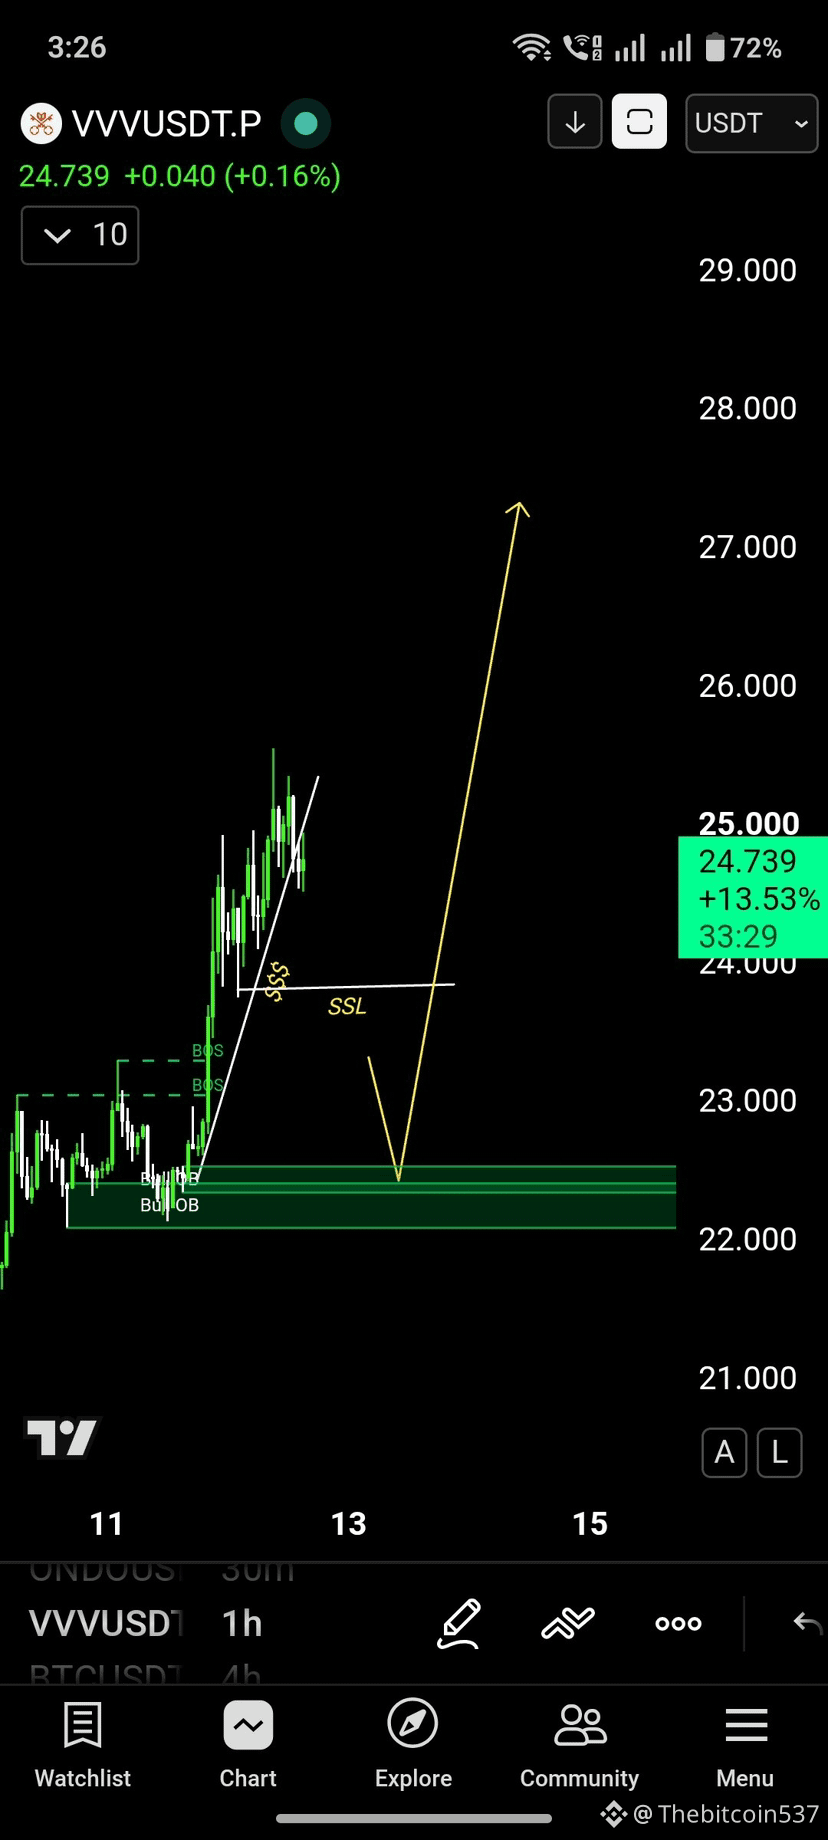
$VVV 4H Update and Trade plan 📊
Currently, the price is showing good momentum after the downtrend. It did MSS. I have found (by using indicator) an OB+FVG area where we can look for LONG 📈, expecting price to fill it because there is trendline liquidity and also Sell side Liquidity.
#BitcoinReclaims$84K #BitcoinOptionsVolatilityHitsFiveYearLow #FSBWarnsCrossBorderStablecoinRulesRemainUnderdeveloped #TokenizedStockMarketCapHitsRecord$3.9B
$VVV
$VVV 4H Update and Trade plan 📊
Currently, the price is showing good momentum after the downtrend. It did MSS. I have found (by using indicator) an OB+FVG area where we can look for LONG 📈, expecting price to fill it because there is trendline liquidity and also Sell side Liquidity.
#BitcoinReclaims$84K #BitcoinOptionsVolatilityHitsFiveYearLow #FSBWarnsCrossBorderStablecoinRulesRemainUnderdeveloped #TokenizedStockMarketCapHitsRecord$3.9B
97
Көбірек контент көру үшін кіріңіз
Binance Square платформасында әлемдік криптоқоғамдастыққа қосылыңыз
⚡️ Криптовалюта туралы ең соңғы және пайдалы ақпаратты алыңыз.
💬 Әлемдегі ең ірі криптобиржаның сеніміне ие.
👍 Расталған авторлардың нақты пікірлерін табыңыз.
Электрондық пошта/телефон нөмірі
Трендтегі тақырыптар
BinancePick
2.8M рет көрілді
147,996 адам талқылап жатыр
Join #EarningsSeason: Predict Earnings on Binance Pick, Share Your Take on Binance Square!
Binance Square Official
·403 лайк
·340.9k рет көрілді
EarningsSeason
5.1M рет көрілді
25,270 адам талқылап жатыр
AnthropicTTMRevenueGrewAbout1200%
3,125 рет көрілді
140 адам талқылап жатыр