
The_ Observer
9 Жариялаулар

The_ Observer
Хабарлау
Пайдаланушыны блоктау
Independent Crypto Analyst | Technical Analysis & Market Insights. Observing Market Trends, Data over hype and Understanding markets.
0 Жазылым
0 Жазылушылар
1 лайк басылған
Жазбалар
·
--
Жоғары (өспелі)
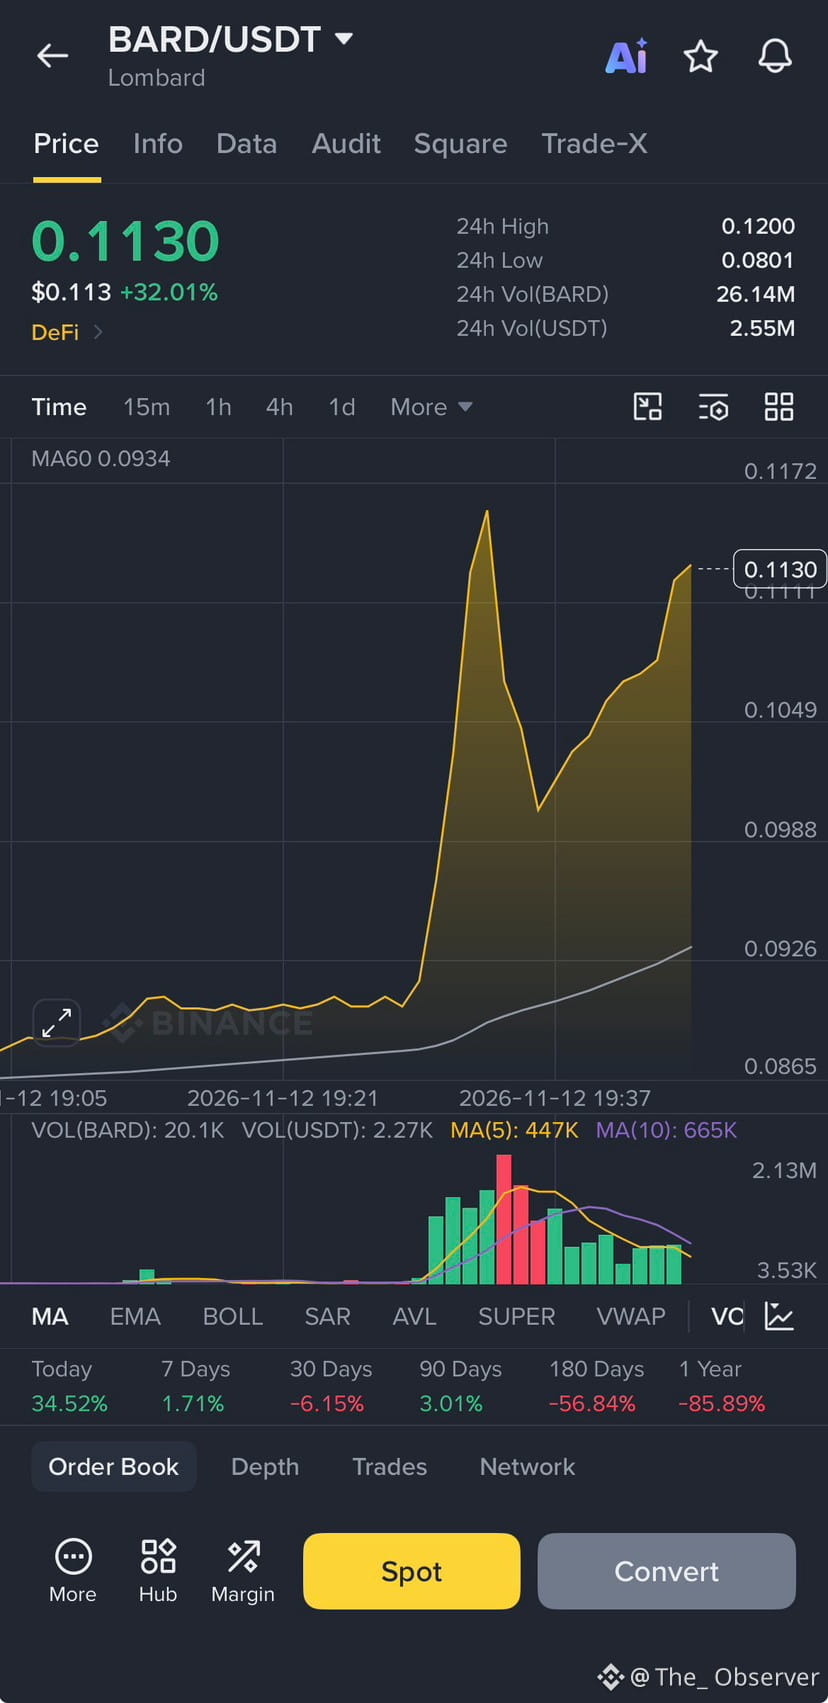
$BARD is absolutely flying, up +32% to $0.1130! 🚀📊
Looking at the chart, the technicals are clear: This is currently a BULLISH structure 🟢. Why? We’ve seen a massive volume spike alongside a sharp breakout, completely outpacing the MA60 (currently at $0.0934). The buyers are clearly in control right now. 🔥
Here’s what I’m watching closely:
🛡️ Key Support: 0.1200 (the 24h high). Bulls need to break and hold this level to confirm the next leg up.
Scenarios:
📈 Bullish: A retest and bounce off $0.093 sends us back to challenge $0.1200.
📉 Bearish: A high-volume breakdown below $0.093 invalidates the setup and likely triggers a deeper retracement.
Outlook: Short-term momentum is undeniably strong, but remember—after a vertical 32% pump, expect volatility. Don't chase blindly; let the price come to your levels. 🎯💯
What’s your next move on $BARD ? Let me know below! 👇💬 #Crypto #DeFi #BARD
$BARD is absolutely flying, up +32% to $0.1130! 🚀📊
Looking at the chart, the technicals are clear: This is currently a BULLISH structure 🟢. Why? We’ve seen a massive volume spike alongside a sharp breakout, completely outpacing the MA60 (currently at $0.0934). The buyers are clearly in control right now. 🔥
Here’s what I’m watching closely:
🛡️ Key Support: 0.1200 (the 24h high). Bulls need to break and hold this level to confirm the next leg up.
Scenarios:
📈 Bullish: A retest and bounce off $0.093 sends us back to challenge $0.1200.
📉 Bearish: A high-volume breakdown below $0.093 invalidates the setup and likely triggers a deeper retracement.
Outlook: Short-term momentum is undeniably strong, but remember—after a vertical 32% pump, expect volatility. Don't chase blindly; let the price come to your levels. 🎯💯
What’s your next move on $BARD ? Let me know below! 👇💬 #Crypto #DeFi #BARD
Looking at the chart, the technicals are clear: This is currently a BULLISH structure 🟢. Why? We’ve seen a massive volume spike alongside a sharp breakout, completely outpacing the MA60 (currently at $0.0934). The buyers are clearly in control right now. 🔥
Here’s what I’m watching closely:
🛡️ Key Support: 0.1200 (the 24h high). Bulls need to break and hold this level to confirm the next leg up.
Scenarios:
📈 Bullish: A retest and bounce off $0.093 sends us back to challenge $0.1200.
📉 Bearish: A high-volume breakdown below $0.093 invalidates the setup and likely triggers a deeper retracement.
Outlook: Short-term momentum is undeniably strong, but remember—after a vertical 32% pump, expect volatility. Don't chase blindly; let the price come to your levels. 🎯💯
What’s your next move on $BARD ? Let me know below! 👇💬 #Crypto #DeFi #BARD
272
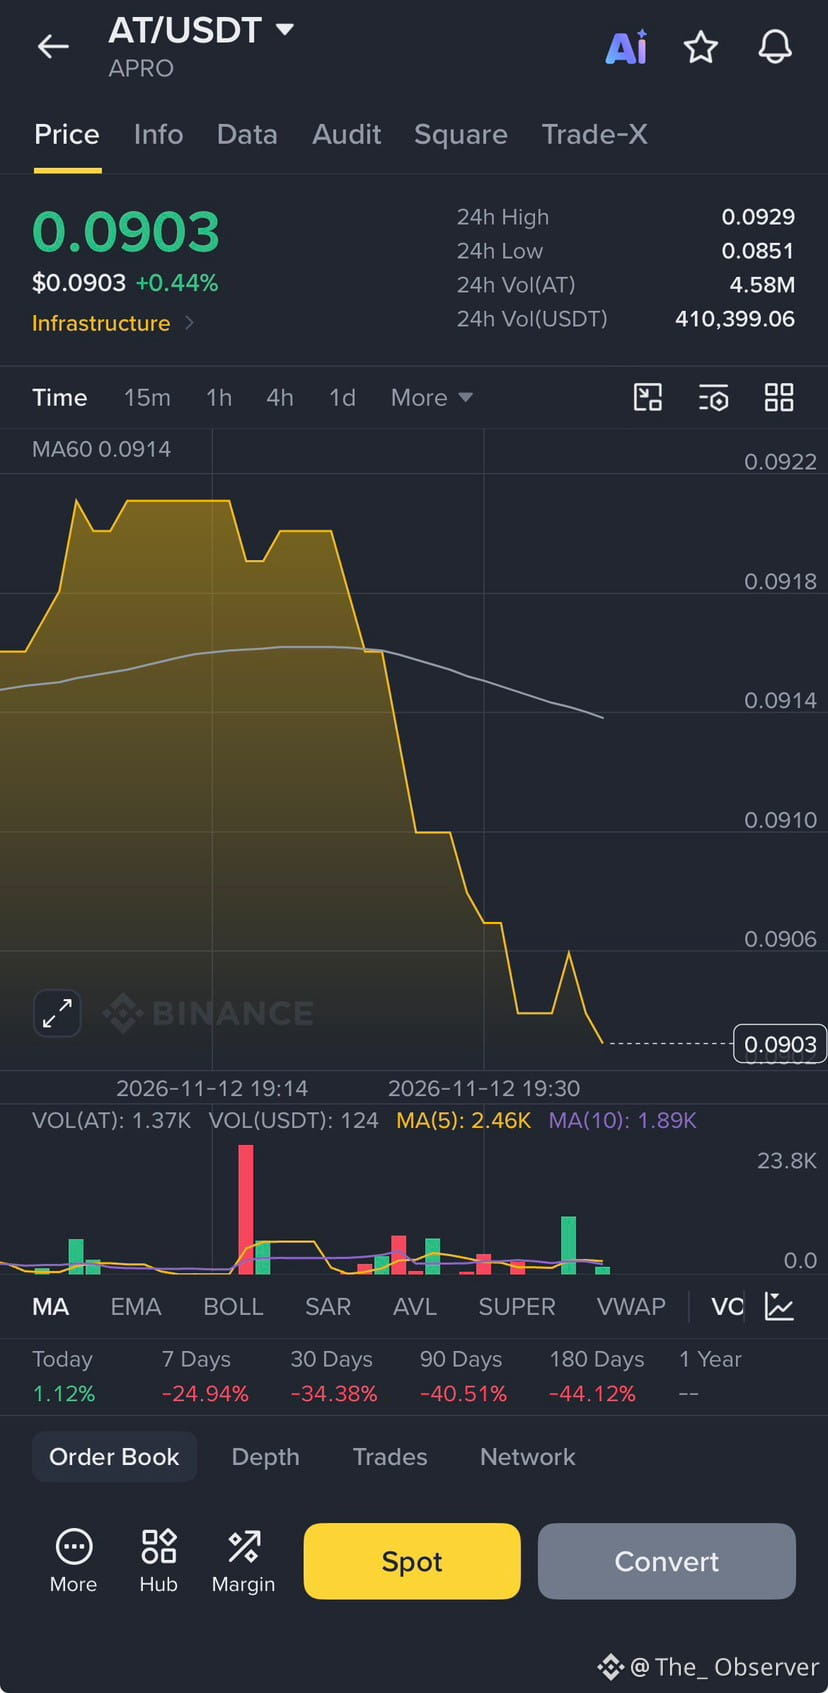
📉 $AT / USDT Chart Breakdown: Reality Check! 🚨
Let’s cut the noise and look at what the chart is actually telling us. 🧐 I keep it 100% real with you guys—no hopium, just the facts.
Right now, the verdict is clear: THIS CHART IS BEARISH 🔴
Why?
Just look at that structure. We had a sharp rejection from the highs and a brutal stair-step downtrend. The price is currently sitting at 0.0903, completely unable to reclaim the MA60 (0.0914). The macro performance is also weighing heavily, showing a painful -34.38% over the last 30 days. The trend is firmly in the bears' control. 🐻
📊 Key Levels to Watch:
• Resistance (The Ceiling) 🧱: 0.0914 (MA60) is the immediate wall. If bulls can’t break and hold above this, any pump is just a trap. Next major resistance is up at 0.0929 (24h High).
• Support (The Floor) 🛡️: The immediate floor is right here at the current level (0.0903). If this gives way, we are likely looking for new local lows.
🔮 Scenarios:
• 🟢 Bullish Case: We need a massive volume spike to flip that MA60 into support. If buyers step in aggressively, a relief bounce toward 0.0918+ is possible. But right now, momentum is lacking.
• 🔴 Bearish Case: Continued rejection at the MA60 and a breakdown below 0.0900. Look at the volume profile—sellers are still active. A flush to the 0.0851 (24h Low) area is a very realistic scenario if this current support fails.
💡 Overall Outlook:
The trend is your friend, and right now, the friend is pointing down. 📉 Protect your capital, wait for confirmation, and don't try to catch a falling knife without a solid plan.
Are you buying this dip or waiting for a trend reversal? Let me know your thoughts below! 👇💬
#Crypto #AT #TechnicalAnalysis #Binance #Trading #BearMarket 🚀📊
📉 $AT / USDT Chart Breakdown: Reality Check! 🚨
Let’s cut the noise and look at what the chart is actually telling us. 🧐 I keep it 100% real with you guys—no hopium, just the facts.
Right now, the verdict is clear: THIS CHART IS BEARISH 🔴
Why?
Just look at that structure. We had a sharp rejection from the highs and a brutal stair-step downtrend. The price is currently sitting at 0.0903, completely unable to reclaim the MA60 (0.0914). The macro performance is also weighing heavily, showing a painful -34.38% over the last 30 days. The trend is firmly in the bears' control. 🐻
📊 Key Levels to Watch:
• Resistance (The Ceiling) 🧱: 0.0914 (MA60) is the immediate wall. If bulls can’t break and hold above this, any pump is just a trap. Next major resistance is up at 0.0929 (24h High).
• Support (The Floor) 🛡️: The immediate floor is right here at the current level (0.0903). If this gives way, we are likely looking for new local lows.
🔮 Scenarios:
• 🟢 Bullish Case: We need a massive volume spike to flip that MA60 into support. If buyers step in aggressively, a relief bounce toward 0.0918+ is possible. But right now, momentum is lacking.
• 🔴 Bearish Case: Continued rejection at the MA60 and a breakdown below 0.0900. Look at the volume profile—sellers are still active. A flush to the 0.0851 (24h Low) area is a very realistic scenario if this current support fails.
💡 Overall Outlook:
The trend is your friend, and right now, the friend is pointing down. 📉 Protect your capital, wait for confirmation, and don't try to catch a falling knife without a solid plan.
Are you buying this dip or waiting for a trend reversal? Let me know your thoughts below! 👇💬
#Crypto #AT #TechnicalAnalysis #Binance #Trading #BearMarket 🚀📊
Let’s cut the noise and look at what the chart is actually telling us. 🧐 I keep it 100% real with you guys—no hopium, just the facts.
Right now, the verdict is clear: THIS CHART IS BEARISH 🔴
Why?
Just look at that structure. We had a sharp rejection from the highs and a brutal stair-step downtrend. The price is currently sitting at 0.0903, completely unable to reclaim the MA60 (0.0914). The macro performance is also weighing heavily, showing a painful -34.38% over the last 30 days. The trend is firmly in the bears' control. 🐻
📊 Key Levels to Watch:
• Resistance (The Ceiling) 🧱: 0.0914 (MA60) is the immediate wall. If bulls can’t break and hold above this, any pump is just a trap. Next major resistance is up at 0.0929 (24h High).
• Support (The Floor) 🛡️: The immediate floor is right here at the current level (0.0903). If this gives way, we are likely looking for new local lows.
🔮 Scenarios:
• 🟢 Bullish Case: We need a massive volume spike to flip that MA60 into support. If buyers step in aggressively, a relief bounce toward 0.0918+ is possible. But right now, momentum is lacking.
• 🔴 Bearish Case: Continued rejection at the MA60 and a breakdown below 0.0900. Look at the volume profile—sellers are still active. A flush to the 0.0851 (24h Low) area is a very realistic scenario if this current support fails.
💡 Overall Outlook:
The trend is your friend, and right now, the friend is pointing down. 📉 Protect your capital, wait for confirmation, and don't try to catch a falling knife without a solid plan.
Are you buying this dip or waiting for a trend reversal? Let me know your thoughts below! 👇💬
#Crypto #AT #TechnicalAnalysis #Binance #Trading #BearMarket 🚀📊
46
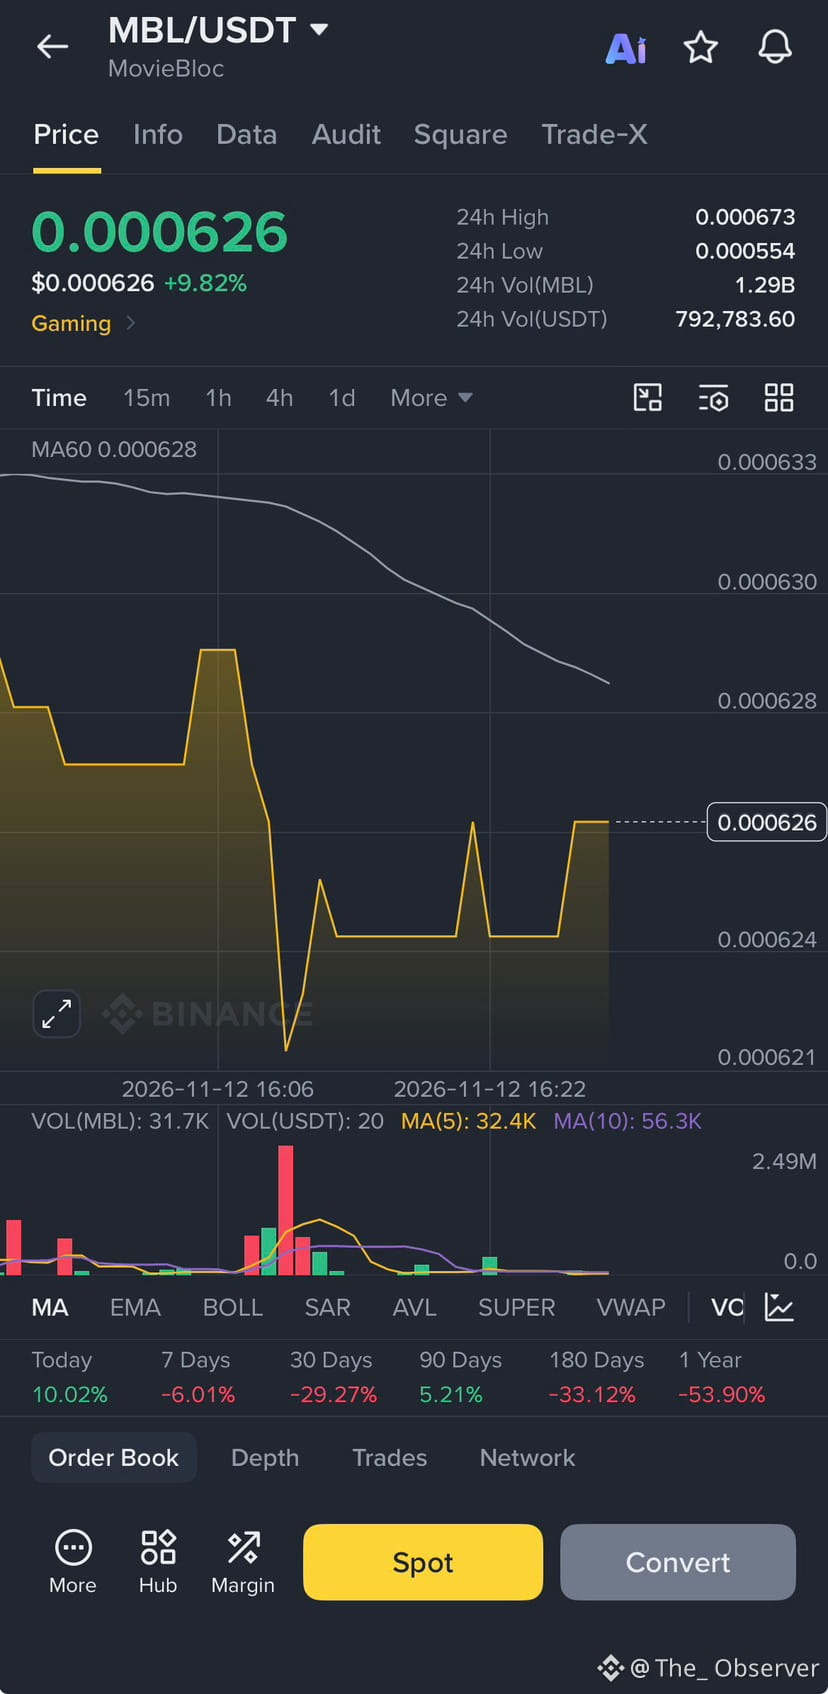
🎬 $MBL is pumping +9.82%! 🚀 Dead Cat Bounce or Real Reversal? 🤔👀
We’ve got some serious green on the screen today! 🟢 0.000626** (+9.82%), catching a massive short-term bid! 🔥 But as always, let's zoom out and look at the actual structure on this 4H chart before we get too excited. 🔍📊
While today's green candle is impressive, we are currently slamming right into a major technical wall. 🧱 Notice the grey line? That’s the MA60 at $0.000628. The price has run straight up and stalled right underneath it! 🛑
Here is my technical breakdown: 🎯📝
🟡 Overall Verdict: BEARISH MACRO / SHORT-TERM RELIEF RALLY 🐻
Why? The broader trend (look at the 30d and 180d stats: -29% and -33%) is deeply bearish. 📉 This current move looks like a violent relief bounce after a heavy sell-off, rather than a confirmed trend reversal. The price is struggling to break the MA60 resistance, showing the bears are still defending this zone. 🐻🛡️
📊 Key Levels to Watch: 👀
• Immediate Resistance: 🚧 0.000633 (The top of the chart). We must close a 4H candle above this to flip bullish! 🟢
• Immediate Support: 🛡️ $0.000621 (The recent structural bottom on this timeframe).
• Major Support: 🕳️ $0.000554 (The 24h low).
⚖️ What’s Next? (Scenarios) 🔮
• 🟢 Bullish Breakout: If buyers step in with heavy volume and we break the MA60 (0.000673**. 🚀📈
• 🔴 Bearish Rejection: If the MA60 holds as resistance, expect a retracement. We will likely see a pullback to test the local support at $0.000621. A break below that, and we are likely heading back to retest the recent lows. 📉🩸
⚠️ The Volume Warning: 🚨 Look at the volume bars at the bottom! Aside from one massive red spike earlier, the volume for this current green move is relatively light. Don't get trapped chasing a low-liquidity pump!
Are we breaking out, or is this a bull trap? 🪤 Let me hear your thoughts in the comments! 👇
#MBL #MovieBloc #CryptoGaming #TechnicalAnalysis #Altcoins #CryptoMarket #Binance #CryptoTrading
🎬 $MBL is pumping +9.82%! 🚀 Dead Cat Bounce or Real Reversal? 🤔👀
We’ve got some serious green on the screen today! 🟢 0.000626** (+9.82%), catching a massive short-term bid! 🔥 But as always, let's zoom out and look at the actual structure on this 4H chart before we get too excited. 🔍📊
While today's green candle is impressive, we are currently slamming right into a major technical wall. 🧱 Notice the grey line? That’s the MA60 at $0.000628. The price has run straight up and stalled right underneath it! 🛑
Here is my technical breakdown: 🎯📝
🟡 Overall Verdict: BEARISH MACRO / SHORT-TERM RELIEF RALLY 🐻
Why? The broader trend (look at the 30d and 180d stats: -29% and -33%) is deeply bearish. 📉 This current move looks like a violent relief bounce after a heavy sell-off, rather than a confirmed trend reversal. The price is struggling to break the MA60 resistance, showing the bears are still defending this zone. 🐻🛡️
📊 Key Levels to Watch: 👀
• Immediate Resistance: 🚧 0.000633 (The top of the chart). We must close a 4H candle above this to flip bullish! 🟢
• Immediate Support: 🛡️ $0.000621 (The recent structural bottom on this timeframe).
• Major Support: 🕳️ $0.000554 (The 24h low).
⚖️ What’s Next? (Scenarios) 🔮
• 🟢 Bullish Breakout: If buyers step in with heavy volume and we break the MA60 (0.000673**. 🚀📈
• 🔴 Bearish Rejection: If the MA60 holds as resistance, expect a retracement. We will likely see a pullback to test the local support at $0.000621. A break below that, and we are likely heading back to retest the recent lows. 📉🩸
⚠️ The Volume Warning: 🚨 Look at the volume bars at the bottom! Aside from one massive red spike earlier, the volume for this current green move is relatively light. Don't get trapped chasing a low-liquidity pump!
Are we breaking out, or is this a bull trap? 🪤 Let me hear your thoughts in the comments! 👇
#MBL #MovieBloc #CryptoGaming #TechnicalAnalysis #Altcoins #CryptoMarket #Binance #CryptoTrading
We’ve got some serious green on the screen today! 🟢 0.000626** (+9.82%), catching a massive short-term bid! 🔥 But as always, let's zoom out and look at the actual structure on this 4H chart before we get too excited. 🔍📊
While today's green candle is impressive, we are currently slamming right into a major technical wall. 🧱 Notice the grey line? That’s the MA60 at $0.000628. The price has run straight up and stalled right underneath it! 🛑
Here is my technical breakdown: 🎯📝
🟡 Overall Verdict: BEARISH MACRO / SHORT-TERM RELIEF RALLY 🐻
Why? The broader trend (look at the 30d and 180d stats: -29% and -33%) is deeply bearish. 📉 This current move looks like a violent relief bounce after a heavy sell-off, rather than a confirmed trend reversal. The price is struggling to break the MA60 resistance, showing the bears are still defending this zone. 🐻🛡️
📊 Key Levels to Watch: 👀
• Immediate Resistance: 🚧 0.000633 (The top of the chart). We must close a 4H candle above this to flip bullish! 🟢
• Immediate Support: 🛡️ $0.000621 (The recent structural bottom on this timeframe).
• Major Support: 🕳️ $0.000554 (The 24h low).
⚖️ What’s Next? (Scenarios) 🔮
• 🟢 Bullish Breakout: If buyers step in with heavy volume and we break the MA60 (0.000673**. 🚀📈
• 🔴 Bearish Rejection: If the MA60 holds as resistance, expect a retracement. We will likely see a pullback to test the local support at $0.000621. A break below that, and we are likely heading back to retest the recent lows. 📉🩸
⚠️ The Volume Warning: 🚨 Look at the volume bars at the bottom! Aside from one massive red spike earlier, the volume for this current green move is relatively light. Don't get trapped chasing a low-liquidity pump!
Are we breaking out, or is this a bull trap? 🪤 Let me hear your thoughts in the comments! 👇
#MBL #MovieBloc #CryptoGaming #TechnicalAnalysis #Altcoins #CryptoMarket #Binance #CryptoTrading
15
·
--
Төмен (кемімелі)
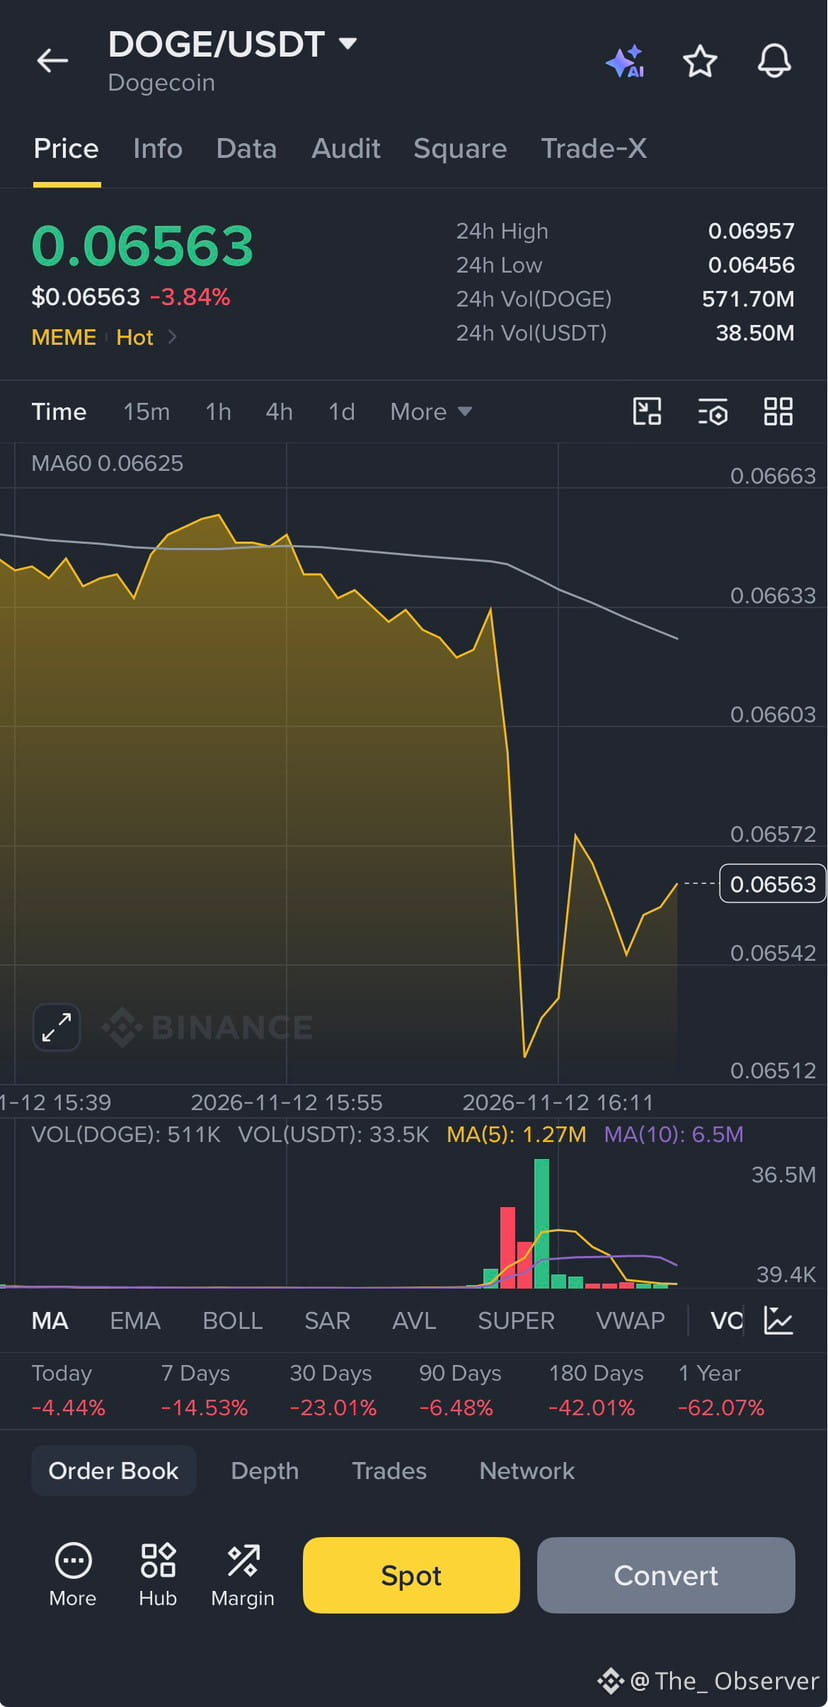
📉 $DOGE Reality Check: The Bears Are in Control! 🐻
Let’s cut through the noise and look at what the chart is actually telling us. I’m looking at the 15m timeframe, and the momentum is heavy. $DOGE is currently sitting at $0.06563, down nearly 3.84% on the day.
Look at that sharp plunge! Price completely broke down, slicing right through the MA60 (currently at $0.06625). The structure is heavily pressured, and sellers are clearly dominating the short-term trend. 🩸
Here is my technical breakdown: 🎯
🔴 Overall Verdict: BEARISH
Why? The 15m chart shows a clear breakdown of consolidation, price is trading well below the moving average, and we are seeing heavy red volume during the drops. The broader macro stats (down 42% over 180 days) confirm the long-term pain, but short-term, it’s a sell-off.
📉 Key Levels to Watch:
• Immediate Support: $0.06512 (The recent wick low). If this floor breaks, we are likely looking at new local lows. 📉
• Immediate Resistance: 0.0663.
⚖️ What’s Next? (Scenarios)
• 🟢 Bullish Relief: Bulls must reclaim the MA60 ($0.06625) with strong volume to invalidate this bearish setup. If they do, we could test the $0.0670 area.
• 🔴 Bearish Continuation: If this current bounce fails and we lose the $0.0651 support, the bears will likely push the price lower to find fresh liquidity.
Keep your risk management tight, set your alerts, and don't catch a falling knife without a plan. 🛡️
What are you guys seeing? Are you buying this dip or waiting for confirmation? Let me know in the comments! 👇💬
#DOGE #Dogecoin #CryptoAnalysis #TechnicalAnalysis #DayTrading #Binance #CryptoMarket #ChartOfTheDay 📊🚀
📉 $DOGE Reality Check: The Bears Are in Control! 🐻
Let’s cut through the noise and look at what the chart is actually telling us. I’m looking at the 15m timeframe, and the momentum is heavy. $DOGE is currently sitting at $0.06563, down nearly 3.84% on the day.
Look at that sharp plunge! Price completely broke down, slicing right through the MA60 (currently at $0.06625). The structure is heavily pressured, and sellers are clearly dominating the short-term trend. 🩸
Here is my technical breakdown: 🎯
🔴 Overall Verdict: BEARISH
Why? The 15m chart shows a clear breakdown of consolidation, price is trading well below the moving average, and we are seeing heavy red volume during the drops. The broader macro stats (down 42% over 180 days) confirm the long-term pain, but short-term, it’s a sell-off.
📉 Key Levels to Watch:
• Immediate Support: $0.06512 (The recent wick low). If this floor breaks, we are likely looking at new local lows. 📉
• Immediate Resistance: 0.0663.
⚖️ What’s Next? (Scenarios)
• 🟢 Bullish Relief: Bulls must reclaim the MA60 ($0.06625) with strong volume to invalidate this bearish setup. If they do, we could test the $0.0670 area.
• 🔴 Bearish Continuation: If this current bounce fails and we lose the $0.0651 support, the bears will likely push the price lower to find fresh liquidity.
Keep your risk management tight, set your alerts, and don't catch a falling knife without a plan. 🛡️
What are you guys seeing? Are you buying this dip or waiting for confirmation? Let me know in the comments! 👇💬
#DOGE #Dogecoin #CryptoAnalysis #TechnicalAnalysis #DayTrading #Binance #CryptoMarket #ChartOfTheDay 📊🚀
Let’s cut through the noise and look at what the chart is actually telling us. I’m looking at the 15m timeframe, and the momentum is heavy. $DOGE is currently sitting at $0.06563, down nearly 3.84% on the day.
Look at that sharp plunge! Price completely broke down, slicing right through the MA60 (currently at $0.06625). The structure is heavily pressured, and sellers are clearly dominating the short-term trend. 🩸
Here is my technical breakdown: 🎯
🔴 Overall Verdict: BEARISH
Why? The 15m chart shows a clear breakdown of consolidation, price is trading well below the moving average, and we are seeing heavy red volume during the drops. The broader macro stats (down 42% over 180 days) confirm the long-term pain, but short-term, it’s a sell-off.
📉 Key Levels to Watch:
• Immediate Support: $0.06512 (The recent wick low). If this floor breaks, we are likely looking at new local lows. 📉
• Immediate Resistance: 0.0663.
⚖️ What’s Next? (Scenarios)
• 🟢 Bullish Relief: Bulls must reclaim the MA60 ($0.06625) with strong volume to invalidate this bearish setup. If they do, we could test the $0.0670 area.
• 🔴 Bearish Continuation: If this current bounce fails and we lose the $0.0651 support, the bears will likely push the price lower to find fresh liquidity.
Keep your risk management tight, set your alerts, and don't catch a falling knife without a plan. 🛡️
What are you guys seeing? Are you buying this dip or waiting for confirmation? Let me know in the comments! 👇💬
#DOGE #Dogecoin #CryptoAnalysis #TechnicalAnalysis #DayTrading #Binance #CryptoMarket #ChartOfTheDay 📊🚀
83
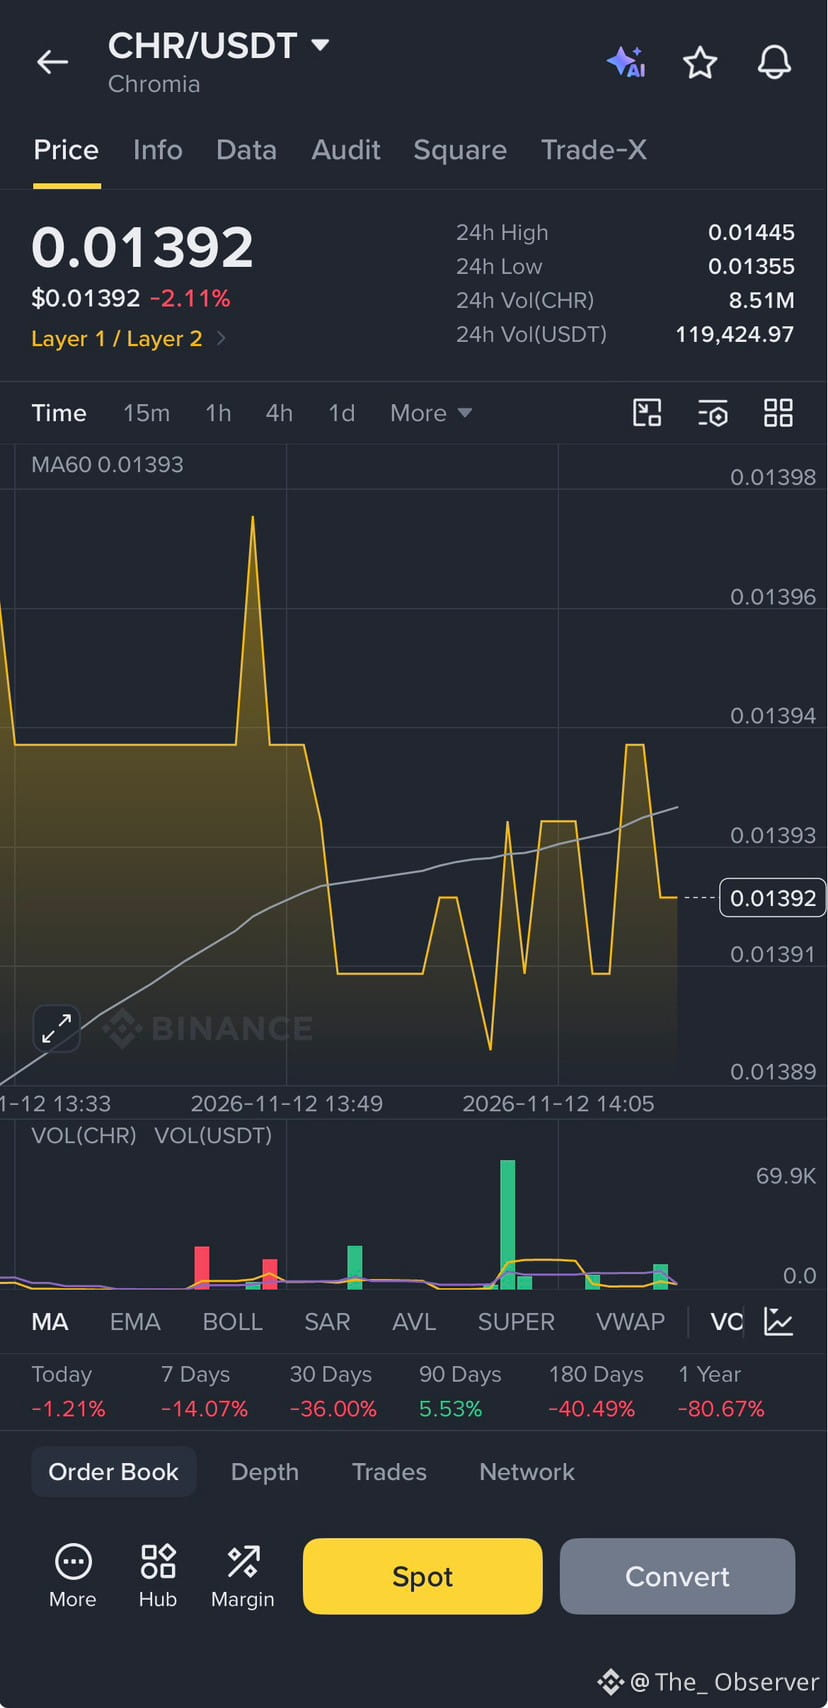
🚀📊 $CHR /USDT: Is a Recovery Coming? 👀🔥
$CHR is currently trading around 0.01392 USDT, down approximately 2.11% 📉. Looking at the chart, price has been moving sideways after a small drop, with buyers trying to defend the 0.01389–0.01391 support zone. 🛡️
👀 Here are the levels I’m watching:
🟢 Support: 0.01389–0.01391. Buyers have stepped in around this area several times.
🔴 Resistance: 0.01393–0.01394. The MA60 is sitting around 0.01393, making this an important level for bulls to reclaim.
🚀 If buyers manage to push above 0.01394 with stronger volume, we could see a move towards 0.01397–0.01398.
⚠️ However, if CHR loses 0.01389, selling pressure could increase, and we may see another move lower.
🧠 My personal take: I’m not ready to call this a bullish reversal just yet. I want to see buyers show real strength and confirm the move with volume. Patience is important in markets like this. 🎯📈
💬 What’s your opinion? Are we about to see a recovery, or should we prepare for another dip? 👇🔥
Let’s discuss! 🚀🤝
⚠️ Not financial advice. Always manage your risk. 💯
🚀📊 $CHR /USDT: Is a Recovery Coming? 👀🔥
$CHR is currently trading around 0.01392 USDT, down approximately 2.11% 📉. Looking at the chart, price has been moving sideways after a small drop, with buyers trying to defend the 0.01389–0.01391 support zone. 🛡️
👀 Here are the levels I’m watching:
🟢 Support: 0.01389–0.01391. Buyers have stepped in around this area several times.
🔴 Resistance: 0.01393–0.01394. The MA60 is sitting around 0.01393, making this an important level for bulls to reclaim.
🚀 If buyers manage to push above 0.01394 with stronger volume, we could see a move towards 0.01397–0.01398.
⚠️ However, if CHR loses 0.01389, selling pressure could increase, and we may see another move lower.
🧠 My personal take: I’m not ready to call this a bullish reversal just yet. I want to see buyers show real strength and confirm the move with volume. Patience is important in markets like this. 🎯📈
💬 What’s your opinion? Are we about to see a recovery, or should we prepare for another dip? 👇🔥
Let’s discuss! 🚀🤝
⚠️ Not financial advice. Always manage your risk. 💯
$CHR is currently trading around 0.01392 USDT, down approximately 2.11% 📉. Looking at the chart, price has been moving sideways after a small drop, with buyers trying to defend the 0.01389–0.01391 support zone. 🛡️
👀 Here are the levels I’m watching:
🟢 Support: 0.01389–0.01391. Buyers have stepped in around this area several times.
🔴 Resistance: 0.01393–0.01394. The MA60 is sitting around 0.01393, making this an important level for bulls to reclaim.
🚀 If buyers manage to push above 0.01394 with stronger volume, we could see a move towards 0.01397–0.01398.
⚠️ However, if CHR loses 0.01389, selling pressure could increase, and we may see another move lower.
🧠 My personal take: I’m not ready to call this a bullish reversal just yet. I want to see buyers show real strength and confirm the move with volume. Patience is important in markets like this. 🎯📈
💬 What’s your opinion? Are we about to see a recovery, or should we prepare for another dip? 👇🔥
Let’s discuss! 🚀🤝
⚠️ Not financial advice. Always manage your risk. 💯
83
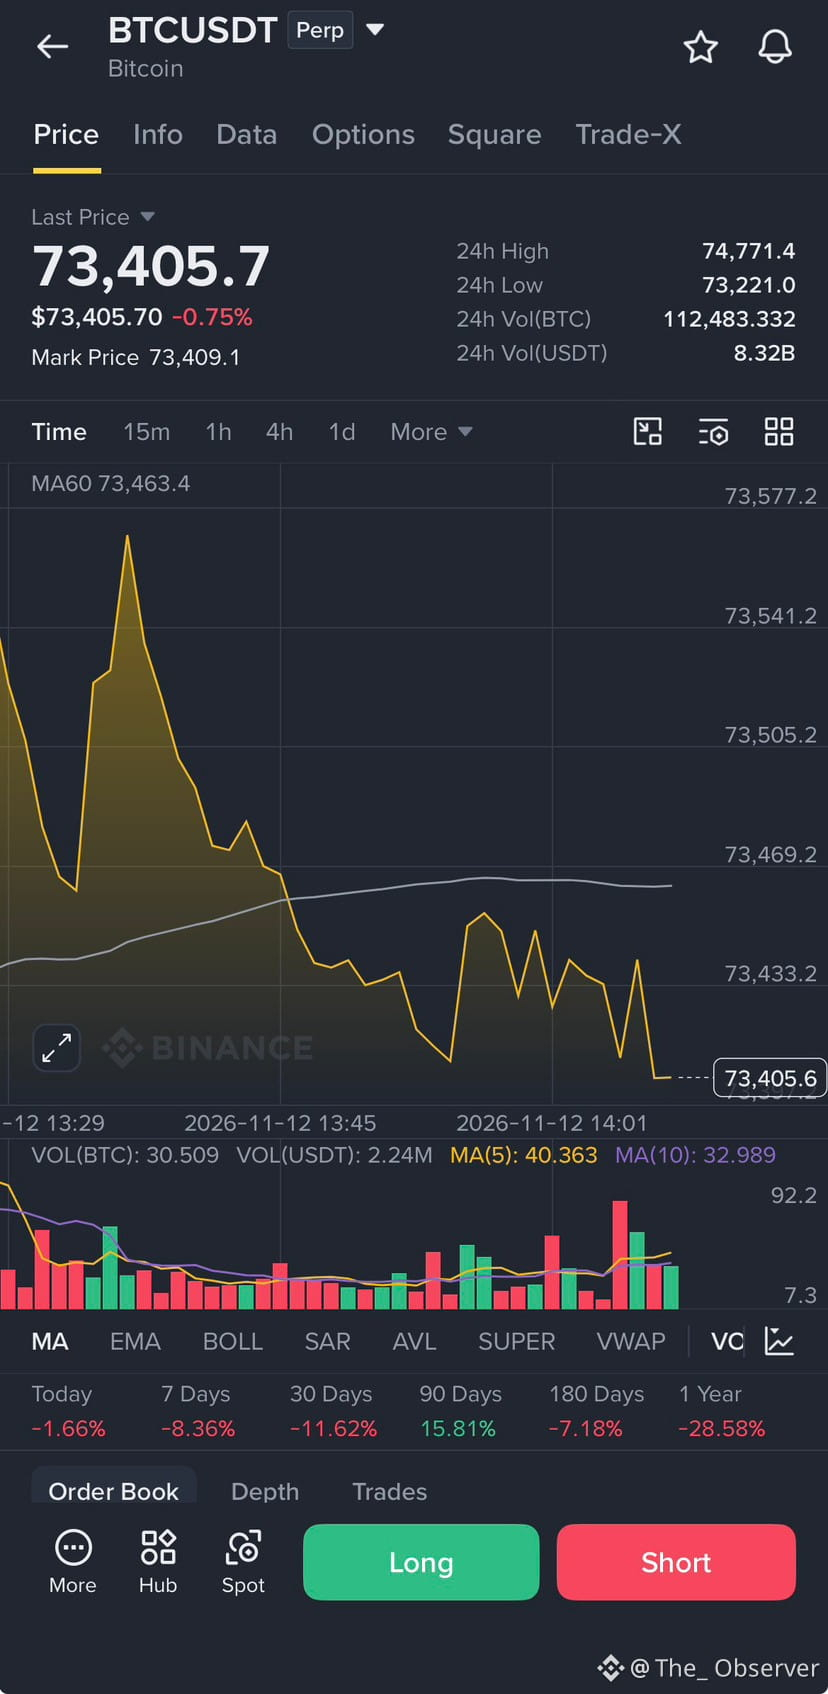
🚨🔥 $BTC /USDT ALERT: DANGER ZONE OR GOLDEN BOUNCE? 🩸📉🐻
Look at this chart! 👀 $BTC is bleeding today, down -0.75% and hovering around 73,405. 💸 The bears are heavily in control right now! 🐻💪 We are seeing a clear downtrend structure forming on this timeframe! 📉
📊 My Analysis: 🧠
The price is aggressively rejected from the highs! 💥 We are currently trading well below our MA60 (73,463), which is acting as a massive dynamic resistance! 🧱🛑 The volume is showing heavy selling pressure, and the trend is looking weak! 🔴📉 If we lose the 24h low of 73,221, expect a rapid flush! 🌊🚨
🎯 The Trade Setup: 🎯💼
• Direction: SHORT 📉🔴
• Entry Zone: Current price (73,405) or a retest of MA60! 🎯🔄
• Target 1: 73,221 (24h Low) 🥇💸
• Target 2: 73,000 (Psychological support) 🚀🌑
• Stop Loss (SL): 73,580 (Above MA60 resistance) 🛑🛡️
💡 Pro Tip: ⚠️🧠
Do not catch a falling knife blindly! 🙅♂️❌ Wait for a lower high or a bearish rejection candle near 73,460 before entering your short! 🤞📊 Protect your capital! 🛡️💰
Are you shorting this breakdown or waiting for a bounce? 🤔👇 Let me know below! 📉💬
Disclaimer: Not financial advice. Always DYOR. ⚠️📚
#BTC #Bitcoin #Crypto #TechnicalAnalysis #Trading #BearMarket #Binance 🚀🔥💎🙌📉
🚨🔥 $BTC /USDT ALERT: DANGER ZONE OR GOLDEN BOUNCE? 🩸📉🐻
Look at this chart! 👀 $BTC is bleeding today, down -0.75% and hovering around 73,405. 💸 The bears are heavily in control right now! 🐻💪 We are seeing a clear downtrend structure forming on this timeframe! 📉
📊 My Analysis: 🧠
The price is aggressively rejected from the highs! 💥 We are currently trading well below our MA60 (73,463), which is acting as a massive dynamic resistance! 🧱🛑 The volume is showing heavy selling pressure, and the trend is looking weak! 🔴📉 If we lose the 24h low of 73,221, expect a rapid flush! 🌊🚨
🎯 The Trade Setup: 🎯💼
• Direction: SHORT 📉🔴
• Entry Zone: Current price (73,405) or a retest of MA60! 🎯🔄
• Target 1: 73,221 (24h Low) 🥇💸
• Target 2: 73,000 (Psychological support) 🚀🌑
• Stop Loss (SL): 73,580 (Above MA60 resistance) 🛑🛡️
💡 Pro Tip: ⚠️🧠
Do not catch a falling knife blindly! 🙅♂️❌ Wait for a lower high or a bearish rejection candle near 73,460 before entering your short! 🤞📊 Protect your capital! 🛡️💰
Are you shorting this breakdown or waiting for a bounce? 🤔👇 Let me know below! 📉💬
Disclaimer: Not financial advice. Always DYOR. ⚠️📚
#BTC #Bitcoin #Crypto #TechnicalAnalysis #Trading #BearMarket #Binance 🚀🔥💎🙌📉
Look at this chart! 👀 $BTC is bleeding today, down -0.75% and hovering around 73,405. 💸 The bears are heavily in control right now! 🐻💪 We are seeing a clear downtrend structure forming on this timeframe! 📉
📊 My Analysis: 🧠
The price is aggressively rejected from the highs! 💥 We are currently trading well below our MA60 (73,463), which is acting as a massive dynamic resistance! 🧱🛑 The volume is showing heavy selling pressure, and the trend is looking weak! 🔴📉 If we lose the 24h low of 73,221, expect a rapid flush! 🌊🚨
🎯 The Trade Setup: 🎯💼
• Direction: SHORT 📉🔴
• Entry Zone: Current price (73,405) or a retest of MA60! 🎯🔄
• Target 1: 73,221 (24h Low) 🥇💸
• Target 2: 73,000 (Psychological support) 🚀🌑
• Stop Loss (SL): 73,580 (Above MA60 resistance) 🛑🛡️
💡 Pro Tip: ⚠️🧠
Do not catch a falling knife blindly! 🙅♂️❌ Wait for a lower high or a bearish rejection candle near 73,460 before entering your short! 🤞📊 Protect your capital! 🛡️💰
Are you shorting this breakdown or waiting for a bounce? 🤔👇 Let me know below! 📉💬
Disclaimer: Not financial advice. Always DYOR. ⚠️📚
#BTC #Bitcoin #Crypto #TechnicalAnalysis #Trading #BearMarket #Binance 🚀🔥💎🙌📉
54
·
--
Жоғары (өспелі)
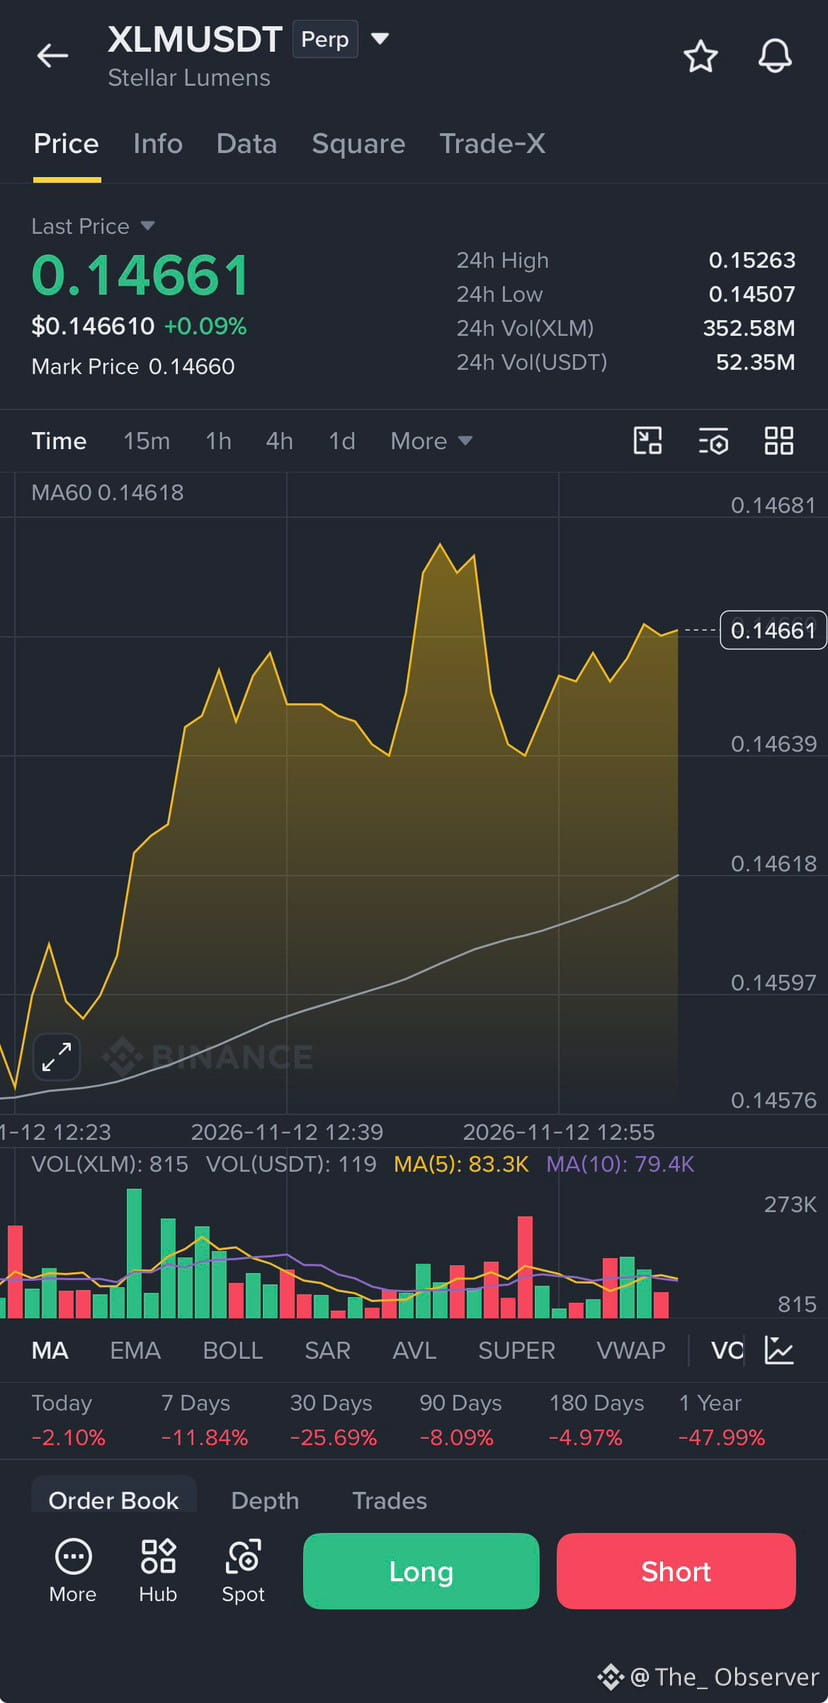
🚨 $XLM /USDT PERP: ARE YOU READY FOR THE BREAKOUT? 🚨
‼️Attention traders! ‼️
Let’s dissect this $XLM chart. We are looking at a tight 15m timeframe, but don't let the short-term noise fool you. The price is currently sitting at $0.14661, showing a slight +0.09% uptick, but the real story is in the structure.
Look closely at the chart: we have a clear ascending support line forming, and the price is aggressively testing the resistance near the 24h high ($0.15263). The MA60 at $0.14618 is acting as a solid floor. Volume is starting to creep in, and the higher lows are screaming bullish momentum. Yes, the longer-term metrics (30d -25%) look bloody, but this is a prime setup for a short-term squeeze!
My Verdict? I am going LONG. 🟢🚀
Trade Setup:
🎯 Entry: $0.1465 - $0.1466
🛑 Stop Loss: $0.1450 (Safe below the moving average)
💰 Take Profit 1: $0.1485
💰 Take Profit 2: $0.1505 (Major resistance)
Don't chase the pump; catch the setup. Price is respecting the trendline perfectly. Manage your risk, use low leverage, and let the market do the work.
Are you riding this wave with me, or are you fading the rally? Drop your thoughts below! 👇📉📈
#XLM #CryptoTrading #BinanceFutures #LongSetup #StellarLumens #TradingAnalysis
🚨 $XLM /USDT PERP: ARE YOU READY FOR THE BREAKOUT? 🚨
‼️Attention traders! ‼️
Let’s dissect this $XLM chart. We are looking at a tight 15m timeframe, but don't let the short-term noise fool you. The price is currently sitting at $0.14661, showing a slight +0.09% uptick, but the real story is in the structure.
Look closely at the chart: we have a clear ascending support line forming, and the price is aggressively testing the resistance near the 24h high ($0.15263). The MA60 at $0.14618 is acting as a solid floor. Volume is starting to creep in, and the higher lows are screaming bullish momentum. Yes, the longer-term metrics (30d -25%) look bloody, but this is a prime setup for a short-term squeeze!
My Verdict? I am going LONG. 🟢🚀
Trade Setup:
🎯 Entry: $0.1465 - $0.1466
🛑 Stop Loss: $0.1450 (Safe below the moving average)
💰 Take Profit 1: $0.1485
💰 Take Profit 2: $0.1505 (Major resistance)
Don't chase the pump; catch the setup. Price is respecting the trendline perfectly. Manage your risk, use low leverage, and let the market do the work.
Are you riding this wave with me, or are you fading the rally? Drop your thoughts below! 👇📉📈
#XLM #CryptoTrading #BinanceFutures #LongSetup #StellarLumens #TradingAnalysis
‼️Attention traders! ‼️
Let’s dissect this $XLM chart. We are looking at a tight 15m timeframe, but don't let the short-term noise fool you. The price is currently sitting at $0.14661, showing a slight +0.09% uptick, but the real story is in the structure.
Look closely at the chart: we have a clear ascending support line forming, and the price is aggressively testing the resistance near the 24h high ($0.15263). The MA60 at $0.14618 is acting as a solid floor. Volume is starting to creep in, and the higher lows are screaming bullish momentum. Yes, the longer-term metrics (30d -25%) look bloody, but this is a prime setup for a short-term squeeze!
My Verdict? I am going LONG. 🟢🚀
Trade Setup:
🎯 Entry: $0.1465 - $0.1466
🛑 Stop Loss: $0.1450 (Safe below the moving average)
💰 Take Profit 1: $0.1485
💰 Take Profit 2: $0.1505 (Major resistance)
Don't chase the pump; catch the setup. Price is respecting the trendline perfectly. Manage your risk, use low leverage, and let the market do the work.
Are you riding this wave with me, or are you fading the rally? Drop your thoughts below! 👇📉📈
#XLM #CryptoTrading #BinanceFutures #LongSetup #StellarLumens #TradingAnalysis
1
286
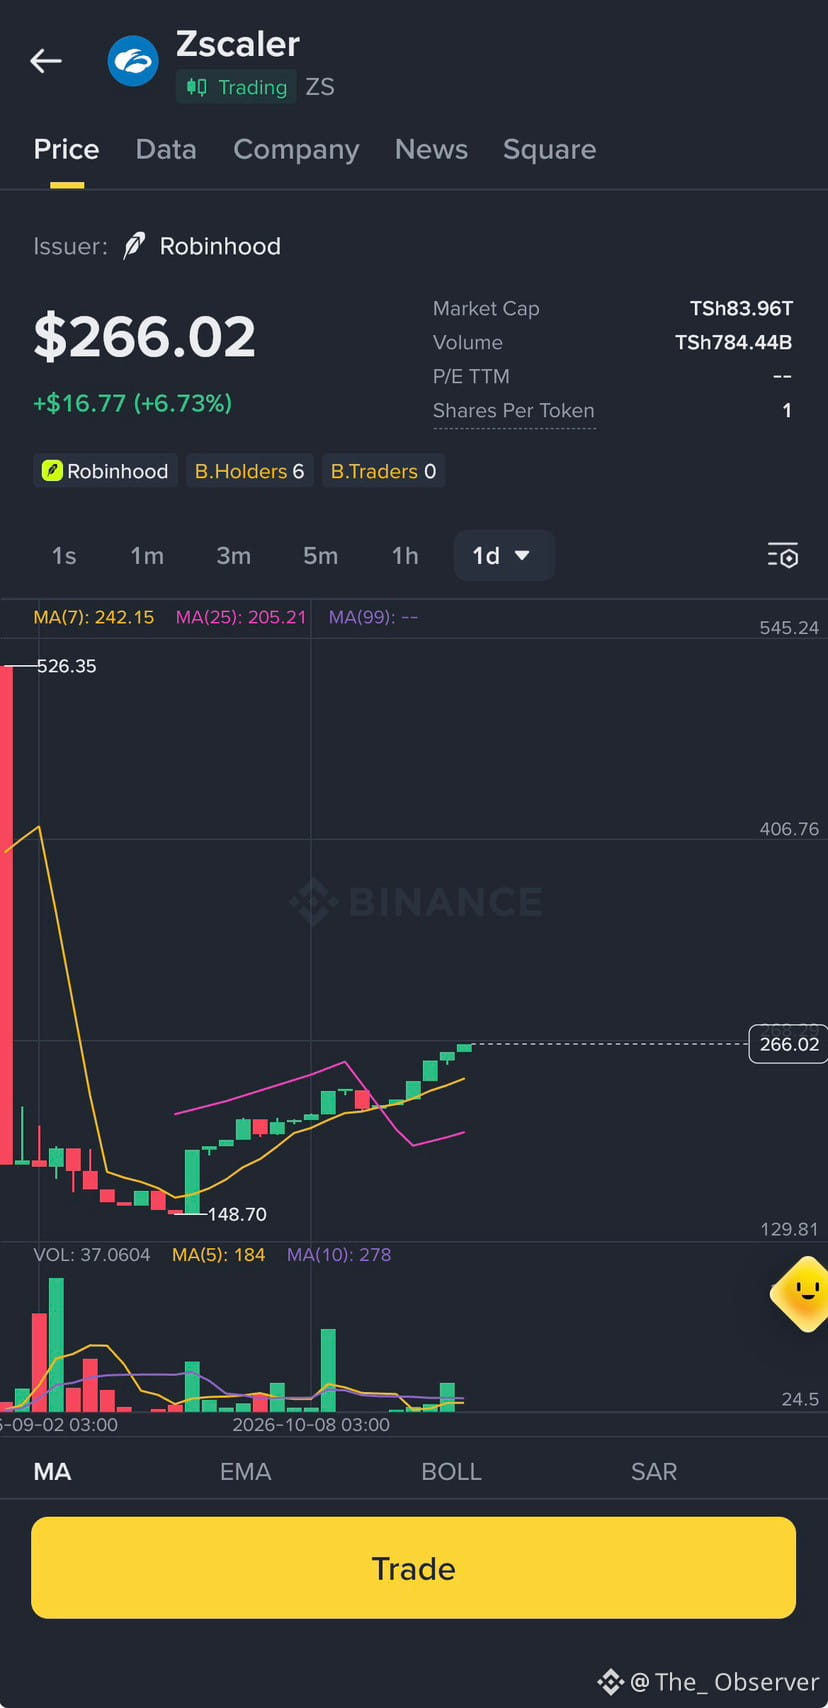
🚀🔥 CHART ALERT: IS $ZS READY FOR A MASSIVE REVERSAL?! 🔥🚀
Hey traders! 👋 I was just scanning the Binance charts and this $ZS (266.02** (+6.73% today). Let’s break down this wild ride! 🧠📊
👀 THE TECHNICALS:
Look at this chart! 🩸 We saw a brutal drop from the 526.35 top, crashing all the way down to a major bottom at 148.70. But wait... look at what's happening now! 👀 The price is finally waking up and printing green candles! 🟢💪
• 🟡 MA(7): 242.15 (Price is well above it!)
• 🩷 MA(25): 205.21
The short-term moving average has crossed UP above the longer one! 📈 This is a classic bullish crossover signal after a massive downtrend. The bulls are officially back in town! 🐂🔥
⚖️ MY VERDICT: LONG! 🟢🚀
We are clearly seeing a momentum shift to the upside! 💯
🎯 MY GAME PLAN:
I don't chase pumps, but this setup is sweet! 🍬 I'm looking for a slight dip to enter a LONG around the 260 zone. 🎯 My first major target is a push toward the $300+ psychological level! 💰 Tight stop-loss below the recent swing low. 🛡️
Are you buying this bounce? 👀 Drop your thoughts below! 👇💬 LIKE & SHARE if you love these setups! ❤️🔁
⚠️ Not financial advice. Stocks are volatile, always DYOR! 🛡️💎🙌
🚀🔥 CHART ALERT: IS $ZS READY FOR A MASSIVE REVERSAL?! 🔥🚀
Hey traders! 👋 I was just scanning the Binance charts and this $ZS (266.02** (+6.73% today). Let’s break down this wild ride! 🧠📊
👀 THE TECHNICALS:
Look at this chart! 🩸 We saw a brutal drop from the 526.35 top, crashing all the way down to a major bottom at 148.70. But wait... look at what's happening now! 👀 The price is finally waking up and printing green candles! 🟢💪
• 🟡 MA(7): 242.15 (Price is well above it!)
• 🩷 MA(25): 205.21
The short-term moving average has crossed UP above the longer one! 📈 This is a classic bullish crossover signal after a massive downtrend. The bulls are officially back in town! 🐂🔥
⚖️ MY VERDICT: LONG! 🟢🚀
We are clearly seeing a momentum shift to the upside! 💯
🎯 MY GAME PLAN:
I don't chase pumps, but this setup is sweet! 🍬 I'm looking for a slight dip to enter a LONG around the 260 zone. 🎯 My first major target is a push toward the $300+ psychological level! 💰 Tight stop-loss below the recent swing low. 🛡️
Are you buying this bounce? 👀 Drop your thoughts below! 👇💬 LIKE & SHARE if you love these setups! ❤️🔁
⚠️ Not financial advice. Stocks are volatile, always DYOR! 🛡️💎🙌
Hey traders! 👋 I was just scanning the Binance charts and this $ZS (266.02** (+6.73% today). Let’s break down this wild ride! 🧠📊
👀 THE TECHNICALS:
Look at this chart! 🩸 We saw a brutal drop from the 526.35 top, crashing all the way down to a major bottom at 148.70. But wait... look at what's happening now! 👀 The price is finally waking up and printing green candles! 🟢💪
• 🟡 MA(7): 242.15 (Price is well above it!)
• 🩷 MA(25): 205.21
The short-term moving average has crossed UP above the longer one! 📈 This is a classic bullish crossover signal after a massive downtrend. The bulls are officially back in town! 🐂🔥
⚖️ MY VERDICT: LONG! 🟢🚀
We are clearly seeing a momentum shift to the upside! 💯
🎯 MY GAME PLAN:
I don't chase pumps, but this setup is sweet! 🍬 I'm looking for a slight dip to enter a LONG around the 260 zone. 🎯 My first major target is a push toward the $300+ psychological level! 💰 Tight stop-loss below the recent swing low. 🛡️
Are you buying this bounce? 👀 Drop your thoughts below! 👇💬 LIKE & SHARE if you love these setups! ❤️🔁
⚠️ Not financial advice. Stocks are volatile, always DYOR! 🛡️💎🙌
78
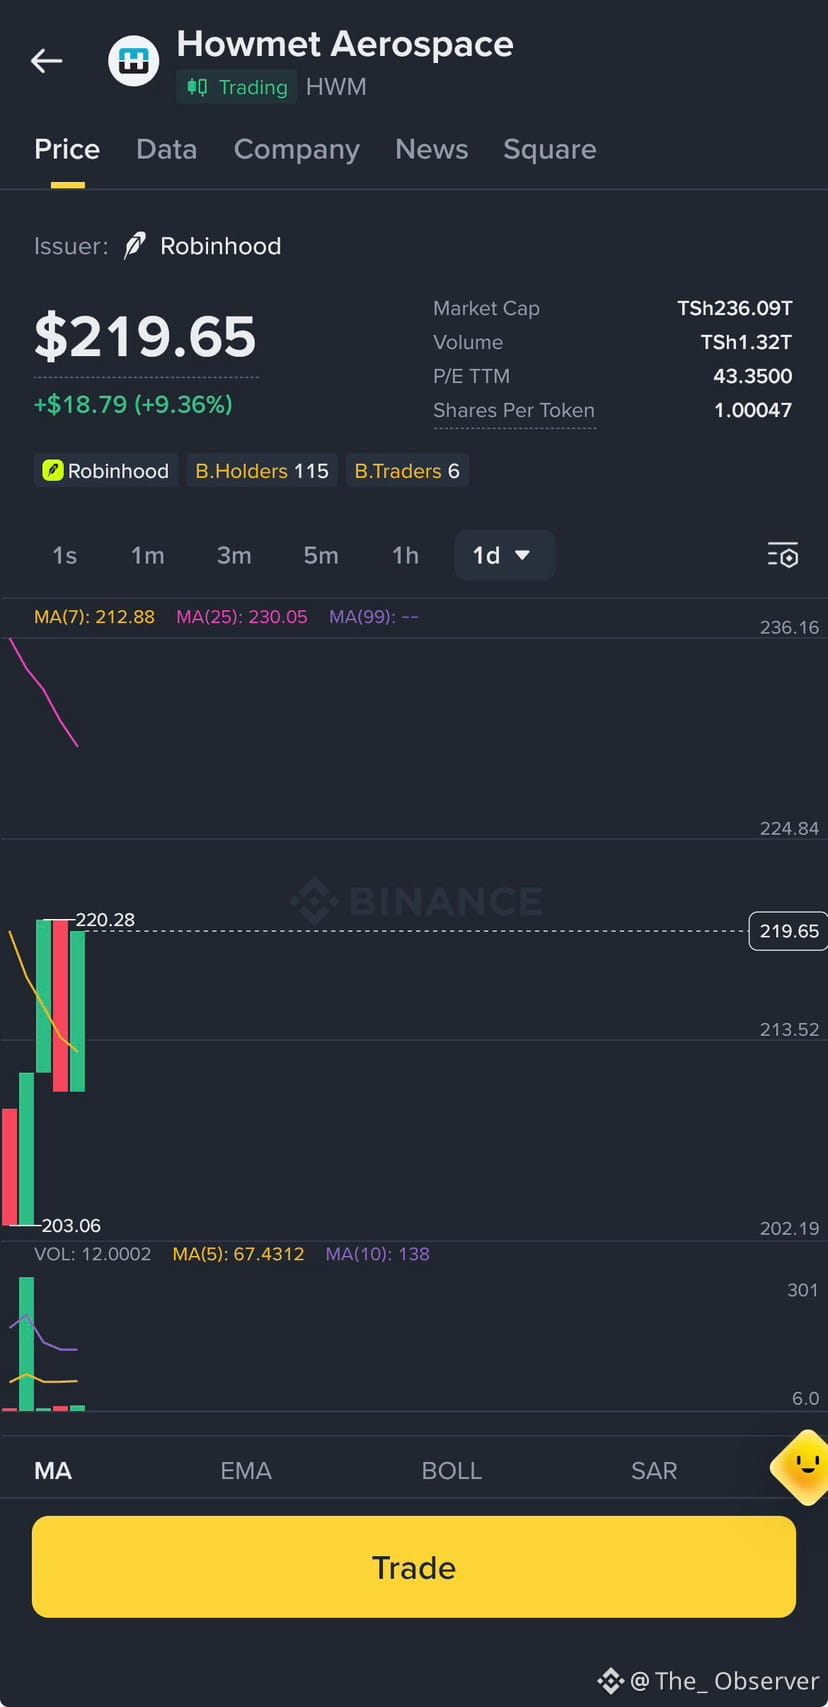
🚨 TRADING ALERT: Is Howmet Aerospace ($HWM.US ) about to break out? 🚀
I was scanning the charts, and 219.65**, up nearly +9.36%! Here is my raw, unfiltered breakdown of this 1D chart. 🧠🔍
📊 The Technicals:
Look at the structure. We have a massive, strong green volume bar pushing the price up. However, we are facing immediate resistance. The price is caught between the MA(7) at 212.88 (acting as support) and the MA(25) at 230.05 (acting as heavy resistance). We are currently testing the upper boundary of this consolidation.
⚖️ SHORT or LONG?
I am leaning LONG, but with a strict plan. 🟢
The momentum is clearly bullish, and that volume spike shows serious buyer interest. I am not buying blindly at the top of this candle.
🎯 My Plan:
I will wait for a slight pullback or consolidation. If the price holds above the MA(7) around 230 MA(25) level. Stop loss goes just below today's opening range to protect capital. 🛡️
What’s your take on $HWM.US Are you buying the momentum or waiting for a pullback? Let me know below! 👇🔥
Disclaimer: Not financial advice. Always DYOR.
🚨 TRADING ALERT: Is Howmet Aerospace ($HWM.US ) about to break out? 🚀
I was scanning the charts, and 219.65**, up nearly +9.36%! Here is my raw, unfiltered breakdown of this 1D chart. 🧠🔍
📊 The Technicals:
Look at the structure. We have a massive, strong green volume bar pushing the price up. However, we are facing immediate resistance. The price is caught between the MA(7) at 212.88 (acting as support) and the MA(25) at 230.05 (acting as heavy resistance). We are currently testing the upper boundary of this consolidation.
⚖️ SHORT or LONG?
I am leaning LONG, but with a strict plan. 🟢
The momentum is clearly bullish, and that volume spike shows serious buyer interest. I am not buying blindly at the top of this candle.
🎯 My Plan:
I will wait for a slight pullback or consolidation. If the price holds above the MA(7) around 230 MA(25) level. Stop loss goes just below today's opening range to protect capital. 🛡️
What’s your take on $HWM.US Are you buying the momentum or waiting for a pullback? Let me know below! 👇🔥
Disclaimer: Not financial advice. Always DYOR.
I was scanning the charts, and 219.65**, up nearly +9.36%! Here is my raw, unfiltered breakdown of this 1D chart. 🧠🔍
📊 The Technicals:
Look at the structure. We have a massive, strong green volume bar pushing the price up. However, we are facing immediate resistance. The price is caught between the MA(7) at 212.88 (acting as support) and the MA(25) at 230.05 (acting as heavy resistance). We are currently testing the upper boundary of this consolidation.
⚖️ SHORT or LONG?
I am leaning LONG, but with a strict plan. 🟢
The momentum is clearly bullish, and that volume spike shows serious buyer interest. I am not buying blindly at the top of this candle.
🎯 My Plan:
I will wait for a slight pullback or consolidation. If the price holds above the MA(7) around 230 MA(25) level. Stop loss goes just below today's opening range to protect capital. 🛡️
What’s your take on $HWM.US Are you buying the momentum or waiting for a pullback? Let me know below! 👇🔥
Disclaimer: Not financial advice. Always DYOR.
HWMUS-0,40%
98
Көбірек контент көру үшін кіріңіз
Binance Square платформасында әлемдік криптоқоғамдастыққа қосылыңыз
⚡️ Криптовалюта туралы ең соңғы және пайдалы ақпаратты алыңыз.
💬 Әлемдегі ең ірі криптобиржаның сеніміне ие.
👍 Расталған авторлардың нақты пікірлерін табыңыз.
Электрондық пошта/телефон нөмірі
Трендтегі тақырыптар
HuangExitNvidiaStrategyInFocus
98,281 рет көрілді
1,067 адам талқылап жатыр
STOCKS | Nvidia’s Jensen Huang Resigns, Colette Kress Named as Interim CEO
Binance News
·25 лайк
·36.6k рет көрілді
AnthropicRejectsIPODelayValuationinQuestion
703,885 рет көрілді
5,318 адам талқылап жатыр
BitMineReports$6.3BNetLossForFiscal2026
12,751 рет көрілді
130 адам талқылап жатыр