
LEVEL OF RIVAN
4 Жариялаулар

LEVEL OF RIVAN
Хабарлау
Пайдаланушыны блоктау
0 Жазылым
0 Жазылушылар
0 лайк басылған
Жазбалар
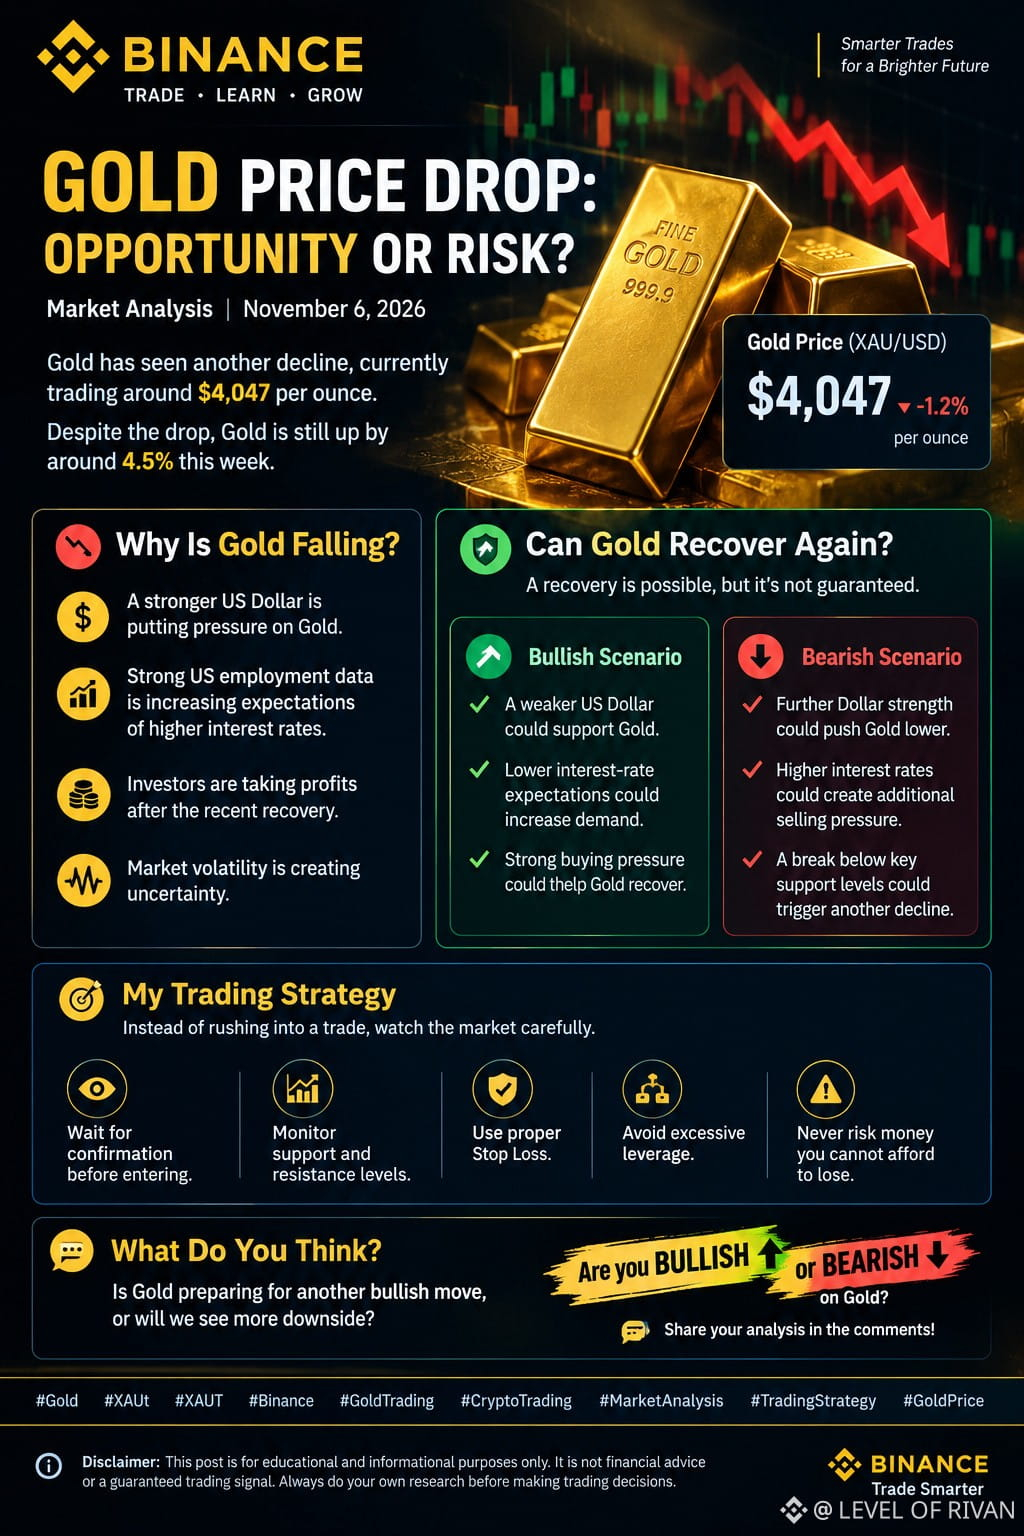
🥇 GOLD PRICE DROP: Is This a Buying Opportunity or Another Correction? 📉📈
$XAU Gold Market Analysis | November 6, 2026
Gold has experienced another significant price decline, creating uncertainty among traders. But does this mean the bullish trend is over, or could Gold recover again?
Let's look at the bigger picture.
📊 Current Gold Market Situation
{future}(XAUUSDT)
Gold is trading around $4,047 per ounce, following today's decline.
Despite this short-term correction, Gold has gained approximately 4.5% over the week.
🔍 Why Is Gold Falling?
Some important factors behind the recent decline:
A stronger US Dollar is putting pressure on Gold.
Strong US employment data is increasing expectations of higher interest rates.
Investors are taking profits after the recent recovery.
Market volatility is creating uncertainty.
🚀 Can Gold Recover Again?
A recovery is possible, but it is not guaranteed.
Bullish Scenario 🟢
A weaker US Dollar could support Gold.
Lower interest-rate expectations could increase demand.
Strong buying pressure could help Gold recover.
Bearish Scenario 🔴
Further Dollar strength could push Gold lower.
Higher interest rates could create additional selling pressure.
A break below important support levels could trigger another decline.
🎯 My Trading Strategy
Instead of rushing into a trade, watch the market carefully.
Wait for confirmation before entering.
Monitor support and resistance.
Use proper Stop Loss.
Avoid excessive leverage.
Never risk money you cannot afford to lose.
💬 What Do You Think?
Is Gold preparing for another bullish move, or will we see more downside?
Are you BULLISH 🟢 or BEARISH 🔴 on Gold?
Share your analysis in the comments!
#Gold #JobsReportRaisesHikeOdds #CanUSStocksReboundAfterNonfarmPayrolls? #BinanceReopensWithdrawalsForMoreAssets
claimer: This post is for educational and informational purposes only. It is not financial advice or a guaranteed trading signal. Always do your own research before making trading decisions.
🥇 GOLD PRICE DROP: Is This a Buying Opportunity or Another Correction? 📉📈
$XAU Gold Market Analysis | November 6, 2026
Gold has experienced another significant price decline, creating uncertainty among traders. But does this mean the bullish trend is over, or could Gold recover again?
Let's look at the bigger picture.
📊 Current Gold Market Situation
Gold is trading around $4,047 per ounce, following today's decline.
Despite this short-term correction, Gold has gained approximately 4.5% over the week.
🔍 Why Is Gold Falling?
Some important factors behind the recent decline:
A stronger US Dollar is putting pressure on Gold.
Strong US employment data is increasing expectations of higher interest rates.
Investors are taking profits after the recent recovery.
Market volatility is creating uncertainty.
🚀 Can Gold Recover Again?
A recovery is possible, but it is not guaranteed.
Bullish Scenario 🟢
A weaker US Dollar could support Gold.
Lower interest-rate expectations could increase demand.
Strong buying pressure could help Gold recover.
Bearish Scenario 🔴
Further Dollar strength could push Gold lower.
Higher interest rates could create additional selling pressure.
A break below important support levels could trigger another decline.
🎯 My Trading Strategy
Instead of rushing into a trade, watch the market carefully.
Wait for confirmation before entering.
Monitor support and resistance.
Use proper Stop Loss.
Avoid excessive leverage.
Never risk money you cannot afford to lose.
💬 What Do You Think?
Is Gold preparing for another bullish move, or will we see more downside?
Are you BULLISH 🟢 or BEARISH 🔴 on Gold?
Share your analysis in the comments!
#Gold #JobsReportRaisesHikeOdds #CanUSStocksReboundAfterNonfarmPayrolls? #BinanceReopensWithdrawalsForMoreAssets
claimer: This post is for educational and informational purposes only. It is not financial advice or a guaranteed trading signal. Always do your own research before making trading decisions.
$XAU Gold Market Analysis | November 6, 2026
Gold has experienced another significant price decline, creating uncertainty among traders. But does this mean the bullish trend is over, or could Gold recover again?
Let's look at the bigger picture.
📊 Current Gold Market Situation
Gold is trading around $4,047 per ounce, following today's decline.
Despite this short-term correction, Gold has gained approximately 4.5% over the week.
🔍 Why Is Gold Falling?
Some important factors behind the recent decline:
A stronger US Dollar is putting pressure on Gold.
Strong US employment data is increasing expectations of higher interest rates.
Investors are taking profits after the recent recovery.
Market volatility is creating uncertainty.
🚀 Can Gold Recover Again?
A recovery is possible, but it is not guaranteed.
Bullish Scenario 🟢
A weaker US Dollar could support Gold.
Lower interest-rate expectations could increase demand.
Strong buying pressure could help Gold recover.
Bearish Scenario 🔴
Further Dollar strength could push Gold lower.
Higher interest rates could create additional selling pressure.
A break below important support levels could trigger another decline.
🎯 My Trading Strategy
Instead of rushing into a trade, watch the market carefully.
Wait for confirmation before entering.
Monitor support and resistance.
Use proper Stop Loss.
Avoid excessive leverage.
Never risk money you cannot afford to lose.
💬 What Do You Think?
Is Gold preparing for another bullish move, or will we see more downside?
Are you BULLISH 🟢 or BEARISH 🔴 on Gold?
Share your analysis in the comments!
#Gold #JobsReportRaisesHikeOdds #CanUSStocksReboundAfterNonfarmPayrolls? #BinanceReopensWithdrawalsForMoreAssets
claimer: This post is for educational and informational purposes only. It is not financial advice or a guaranteed trading signal. Always do your own research before making trading decisions.
151
🚀 ETHEREUM (ETH): IS A BIG MOVE COMING SOON?
$ETH
Ethereum continues to be one of the most watched cryptocurrencies in the market. With its powerful blockchain ecosystem and strong position in the crypto industry, ETH remains on traders' radar.
{spot}(ETHUSDT)
📊 WHAT SHOULD TRADERS WATCH?
🔥 Price action and market momentum
📈 Trading volume and breakout signals
🎯 Key support and resistance zones
🐋 Market activity and investor sentiment
THE BIG QUESTION 👀
Is Ethereum preparing for another bullish move, or could sellers take control of the market?
Keep $ETH on your watchlist, check the chart, and share your trading perspective!
👇 BULLISH OR BEARISH ON ETH?
#BinanceReopensWithdrawalsForMoreAssets #AnthropicIPOValuationDoubts #SouthKoreaDelaysCryptoTaxationUntil2029 #HongKongPlansTaxIncentivesCoveringDigitalAssets
🚀 ETHEREUM (ETH): IS A BIG MOVE COMING SOON?
$ETH
Ethereum continues to be one of the most watched cryptocurrencies in the market. With its powerful blockchain ecosystem and strong position in the crypto industry, ETH remains on traders' radar.
📊 WHAT SHOULD TRADERS WATCH?
🔥 Price action and market momentum
📈 Trading volume and breakout signals
🎯 Key support and resistance zones
🐋 Market activity and investor sentiment
THE BIG QUESTION 👀
Is Ethereum preparing for another bullish move, or could sellers take control of the market?
Keep $ETH on your watchlist, check the chart, and share your trading perspective!
👇 BULLISH OR BEARISH ON ETH?
#BinanceReopensWithdrawalsForMoreAssets #AnthropicIPOValuationDoubts #SouthKoreaDelaysCryptoTaxationUntil2029 #HongKongPlansTaxIncentivesCoveringDigitalAssets
$ETH
Ethereum continues to be one of the most watched cryptocurrencies in the market. With its powerful blockchain ecosystem and strong position in the crypto industry, ETH remains on traders' radar.
📊 WHAT SHOULD TRADERS WATCH?
🔥 Price action and market momentum
📈 Trading volume and breakout signals
🎯 Key support and resistance zones
🐋 Market activity and investor sentiment
THE BIG QUESTION 👀
Is Ethereum preparing for another bullish move, or could sellers take control of the market?
Keep $ETH on your watchlist, check the chart, and share your trading perspective!
👇 BULLISH OR BEARISH ON ETH?
#BinanceReopensWithdrawalsForMoreAssets #AnthropicIPOValuationDoubts #SouthKoreaDelaysCryptoTaxationUntil2029 #HongKongPlansTaxIncentivesCoveringDigitalAssets

81
🚀 SOLANA (SOL) PRICE ANALYSIS – NOVEMBER 6, 2026
Is Solana Ready for a Strong Recovery?
Solana ($SOL ) is currently facing selling pressure, with the overall daily market trend remaining bearish. However, the oversold RSI suggests that a short-term recovery could be possible if buyers return with strong volume.
📊 MARKET OVERVIEW
{spot}(SOLUSDT)
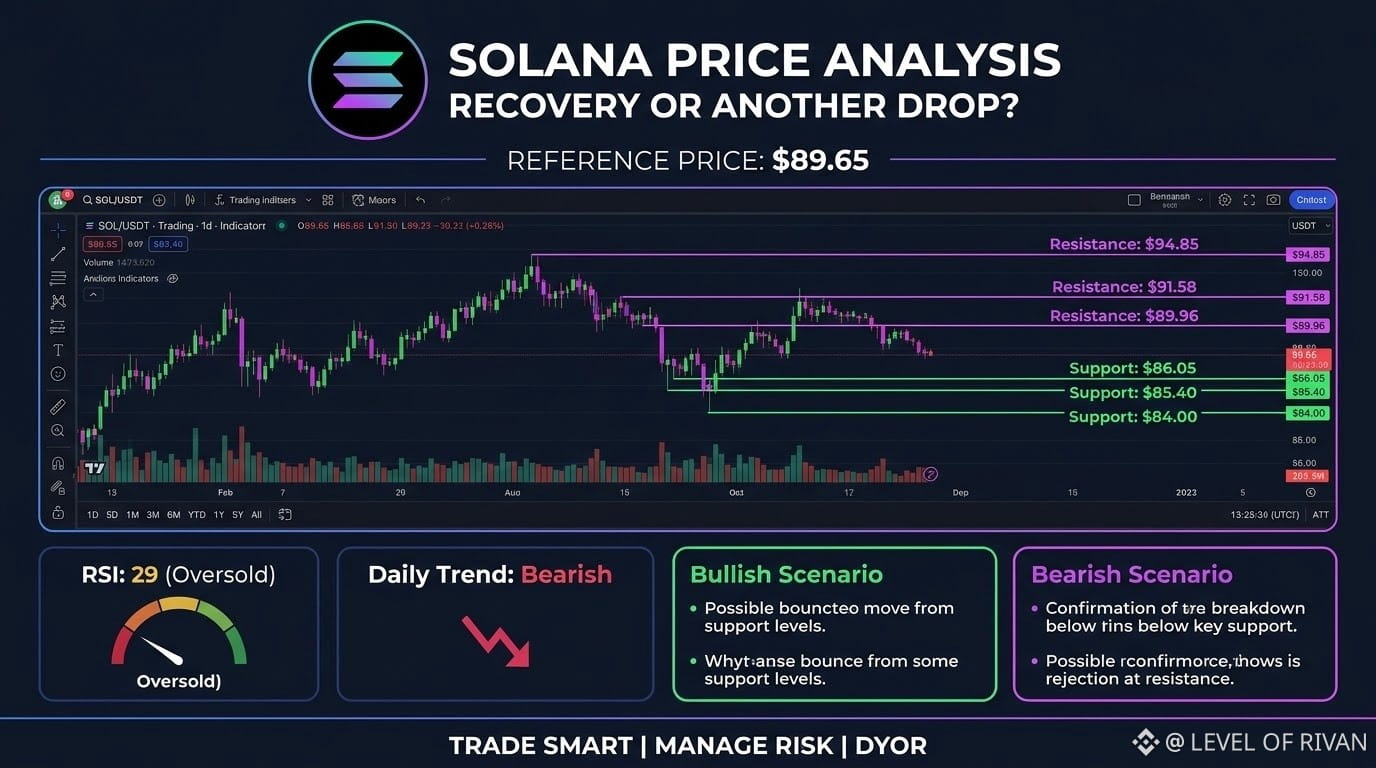
SOL Reference Price: $89.65
Daily Trend: Bearish
RSI: 29 (Oversold)
🟢 SUPPORT ZONES
The first important support is around $86.05, followed by $85.40 and $84.00. If buyers defend these levels, SOL could attempt a recovery.
🔴 RESISTANCE ZONES
SOL faces resistance around $89.96. A successful breakout could open the way towards $91.58 and $94.85.
📈 BULLISH OUTLOOK
If SOL breaks above $89.96 with strong buying volume, bullish momentum could return. Traders should watch for confirmation before entering a position.
📉 BEARISH OUTLOOK
If SOL falls below $86.05, selling pressure could increase, potentially pushing the price towards $84.00.
🔥 MY FINAL VIEW
Solana remains an interesting cryptocurrency to watch. The current trend is bearish, but an oversold RSI makes a short-term bounce possible. I would wait for a clear breakout or support confirmation before making a trading decision.
💬 YOUR OPINION MATTERS!
What is your prediction for SOL?
🚀 BULLISH – SOL will recover
📉 BEARISH – SOL will drop further
Share your thoughts in the comments!
#Solana #SOL #BinanceSquare #BinanceReopensWithdrawalsForMoreAssets #AnthropicIPOValuationDoubts
⚠️ Disclaimer: This analysis is for educational purposes only and is not financial advice. Always manage your risk and do your own research.
🚀 SOLANA (SOL) PRICE ANALYSIS – NOVEMBER 6, 2026
Is Solana Ready for a Strong Recovery?
Solana ($SOL ) is currently facing selling pressure, with the overall daily market trend remaining bearish. However, the oversold RSI suggests that a short-term recovery could be possible if buyers return with strong volume.
📊 MARKET OVERVIEW
SOL Reference Price: $89.65
Daily Trend: Bearish
RSI: 29 (Oversold)
🟢 SUPPORT ZONES
The first important support is around $86.05, followed by $85.40 and $84.00. If buyers defend these levels, SOL could attempt a recovery.
🔴 RESISTANCE ZONES
SOL faces resistance around $89.96. A successful breakout could open the way towards $91.58 and $94.85.
📈 BULLISH OUTLOOK
If SOL breaks above $89.96 with strong buying volume, bullish momentum could return. Traders should watch for confirmation before entering a position.
📉 BEARISH OUTLOOK
If SOL falls below $86.05, selling pressure could increase, potentially pushing the price towards $84.00.
🔥 MY FINAL VIEW
Solana remains an interesting cryptocurrency to watch. The current trend is bearish, but an oversold RSI makes a short-term bounce possible. I would wait for a clear breakout or support confirmation before making a trading decision.
💬 YOUR OPINION MATTERS!
What is your prediction for SOL?
🚀 BULLISH – SOL will recover
📉 BEARISH – SOL will drop further
Share your thoughts in the comments!
#Solana #SOL #BinanceSquare #BinanceReopensWithdrawalsForMoreAssets #AnthropicIPOValuationDoubts
⚠️ Disclaimer: This analysis is for educational purposes only and is not financial advice. Always manage your risk and do your own research.
Is Solana Ready for a Strong Recovery?
Solana ($SOL ) is currently facing selling pressure, with the overall daily market trend remaining bearish. However, the oversold RSI suggests that a short-term recovery could be possible if buyers return with strong volume.
📊 MARKET OVERVIEW
SOL Reference Price: $89.65
Daily Trend: Bearish
RSI: 29 (Oversold)
🟢 SUPPORT ZONES
The first important support is around $86.05, followed by $85.40 and $84.00. If buyers defend these levels, SOL could attempt a recovery.
🔴 RESISTANCE ZONES
SOL faces resistance around $89.96. A successful breakout could open the way towards $91.58 and $94.85.
📈 BULLISH OUTLOOK
If SOL breaks above $89.96 with strong buying volume, bullish momentum could return. Traders should watch for confirmation before entering a position.
📉 BEARISH OUTLOOK
If SOL falls below $86.05, selling pressure could increase, potentially pushing the price towards $84.00.
🔥 MY FINAL VIEW
Solana remains an interesting cryptocurrency to watch. The current trend is bearish, but an oversold RSI makes a short-term bounce possible. I would wait for a clear breakout or support confirmation before making a trading decision.
💬 YOUR OPINION MATTERS!
What is your prediction for SOL?
🚀 BULLISH – SOL will recover
📉 BEARISH – SOL will drop further
Share your thoughts in the comments!
#Solana #SOL #BinanceSquare #BinanceReopensWithdrawalsForMoreAssets #AnthropicIPOValuationDoubts
⚠️ Disclaimer: This analysis is for educational purposes only and is not financial advice. Always manage your risk and do your own research.
108
Binance Latest Crypto Market Analysis
📊 Binance Crypto Market Analysis
November 5, 2026 · Market snapshot
Coin | Price (USD) | 24h Change
• ($BTC ) | $80,518 | +4.74%
• ($ETH ) | $2,419 | +6.96%
• ($BNB ) | $718 | +3.57%
• Source: FutureAITechX
🔍 Market outlook: Cautiously bullish
• Bitcoin: Strong recovery, with $80,000 as an important level to watch.
{spot}(BTCUSDT)
• Ethereum: Outperforming BTC today, showing stronger short-term momentum.
{spot}(ETHUSDT)
• BNB: Recovering after recent Binance-related concerns; watch the $720–$730 resistance zone.
{spot}(BNBUSDT)
My view: The market is showing positive momentum, but confirmation is important before entering a trade. Avoid chasing sudden green candles. #BinanceReopensWithdrawalsForMoreAssets
#Binance98PercentReplenished #USStocksSlipandCryptoMarketUnderBroadPressure #BTC #ETH
⚠️ This is market analysis, not financial advice. Crypto trading involves significant risk.
Binance Latest Crypto Market Analysis
📊 Binance Crypto Market Analysis
November 5, 2026 · Market snapshot
Coin | Price (USD) | 24h Change
• ($BTC ) | $80,518 | +4.74%
• ($ETH ) | $2,419 | +6.96%
• ($BNB ) | $718 | +3.57%
• Source: FutureAITechX
🔍 Market outlook: Cautiously bullish
• Bitcoin: Strong recovery, with $80,000 as an important level to watch.
• Ethereum: Outperforming BTC today, showing stronger short-term momentum.
• BNB: Recovering after recent Binance-related concerns; watch the $720–$730 resistance zone.
My view: The market is showing positive momentum, but confirmation is important before entering a trade. Avoid chasing sudden green candles. #BinanceReopensWithdrawalsForMoreAssets
#Binance98PercentReplenished #USStocksSlipandCryptoMarketUnderBroadPressure #BTC #ETH
⚠️ This is market analysis, not financial advice. Crypto trading involves significant risk.
📊 Binance Crypto Market Analysis
November 5, 2026 · Market snapshot
Coin | Price (USD) | 24h Change
• ($BTC ) | $80,518 | +4.74%
• ($ETH ) | $2,419 | +6.96%
• ($BNB ) | $718 | +3.57%
• Source: FutureAITechX
🔍 Market outlook: Cautiously bullish
• Bitcoin: Strong recovery, with $80,000 as an important level to watch.
• Ethereum: Outperforming BTC today, showing stronger short-term momentum.
• BNB: Recovering after recent Binance-related concerns; watch the $720–$730 resistance zone.
My view: The market is showing positive momentum, but confirmation is important before entering a trade. Avoid chasing sudden green candles. #BinanceReopensWithdrawalsForMoreAssets
#Binance98PercentReplenished #USStocksSlipandCryptoMarketUnderBroadPressure #BTC #ETH
⚠️ This is market analysis, not financial advice. Crypto trading involves significant risk.


154
Көбірек контент көру үшін кіріңіз
Binance Square платформасында әлемдік криптоқоғамдастыққа қосылыңыз
⚡️ Криптовалюта туралы ең соңғы және пайдалы ақпаратты алыңыз.
💬 Әлемдегі ең ірі криптобиржаның сеніміне ие.
👍 Расталған авторлардың нақты пікірлерін табыңыз.
Электрондық пошта/телефон нөмірі
Трендтегі тақырыптар
JobsReportRaisesHikeOdds
600,412 рет көрілді
3,766 адам талқылап жатыр
TradFi News | US Adds 165,000 Jobs in October, More Than Double the 65,000 Forecast, as Unemployment Falls to 4.1%
Binance News
·44 лайк
·24.4k рет көрілді
CPITestsDecemberRateOutlook
198,357 рет көрілді
1,416 адам талқылап жатыр
US Data Center Rules May Constrain AI Expansion
84,043 рет көрілді
239 адам талқылап жатыр