
Santiago Corder xKqg
181 Жариялаулар
Santiago Corder xKqg
Хабарлау
Пайдаланушыны блоктау
24 hours trading support and investment 📊📊📊
Ашық сауда
Жиі сауда жасайтын трейдер
3.9 жыл
325 Жазылым
313 Жазылушылар
271 лайк басылған
Жазбалар
Портфолио
PINNED
‼️ DON'T PANIC, WHAT'S HAPPENING RIGHT NOW IS VERY NORMAL ‼️‼️‼️
💲Hello folks,
💲As you can see, the entire market is experiencing a downturn, especially BTC, and almost all markets are following suit.
There are only two reasons for this concerning today.
💲Firstly, the tension between Iran and Israel has prompted many people to sell their assets, especially in the Middle East region. Additionally, the Bitcoin halving event is contributing to the market volatility.
Historically, Bitcoin has experienced a drop of 25-40% before the halving, followed by a surge and reaching an all-time high price after the halving. Therefore, if you are already holding any coins, DO NOT BELL#FET . Instead, wait for the surge. After the halving, everything should return to normal, and we can expect to see all coins pumping (with exceptions, of course). So, DON'T PANIC AND WAIT.
💲In case you are considering investing, NOW IS THE RIGHT TIME to do it. However, remember that in spot trading, PATIENCE is key, and NEVER sell at a loss. HOLD and WAIT, BUY in the DIPS, and SELL with profits. That's how everything works in spot trading.
💲STAY STRONG AND SAFE.
💲Follow for more information and signals
@Prime_Crypto_Outlet #TwinsTulip #BullorBear
$BTC #BinanceLaunchpool #bitcoinhalving
‼️ DON'T PANIC, WHAT'S HAPPENING RIGHT NOW IS VERY NORMAL ‼️‼️‼️
💲Hello folks,
💲As you can see, the entire market is experiencing a downturn, especially BTC, and almost all markets are following suit.
There are only two reasons for this concerning today.
💲Firstly, the tension between Iran and Israel has prompted many people to sell their assets, especially in the Middle East region. Additionally, the Bitcoin halving event is contributing to the market volatility.
Historically, Bitcoin has experienced a drop of 25-40% before the halving, followed by a surge and reaching an all-time high price after the halving. Therefore, if you are already holding any coins, DO NOT BELL#FET . Instead, wait for the surge. After the halving, everything should return to normal, and we can expect to see all coins pumping (with exceptions, of course). So, DON'T PANIC AND WAIT.
💲In case you are considering investing, NOW IS THE RIGHT TIME to do it. However, remember that in spot trading, PATIENCE is key, and NEVER sell at a loss. HOLD and WAIT, BUY in the DIPS, and SELL with profits. That's how everything works in spot trading.
💲STAY STRONG AND SAFE.
💲Follow for more information and signals
@Twin Tulips #TwinsTulip #BullorBear
$BTC #BinanceLaunchpool #bitcoinhalving
💲Hello folks,
💲As you can see, the entire market is experiencing a downturn, especially BTC, and almost all markets are following suit.
There are only two reasons for this concerning today.
💲Firstly, the tension between Iran and Israel has prompted many people to sell their assets, especially in the Middle East region. Additionally, the Bitcoin halving event is contributing to the market volatility.
Historically, Bitcoin has experienced a drop of 25-40% before the halving, followed by a surge and reaching an all-time high price after the halving. Therefore, if you are already holding any coins, DO NOT BELL#FET . Instead, wait for the surge. After the halving, everything should return to normal, and we can expect to see all coins pumping (with exceptions, of course). So, DON'T PANIC AND WAIT.
💲In case you are considering investing, NOW IS THE RIGHT TIME to do it. However, remember that in spot trading, PATIENCE is key, and NEVER sell at a loss. HOLD and WAIT, BUY in the DIPS, and SELL with profits. That's how everything works in spot trading.
💲STAY STRONG AND SAFE.
💲Follow for more information and signals
@Twin Tulips #TwinsTulip #BullorBear
$BTC #BinanceLaunchpool #bitcoinhalving


2
3
7k
PINNED
$BTC
I accidentally realized something extremely important:
Cycle 14 days before Halving 2024 " SAME " 99% of 2020 cycle (see photo below).
2024 before Halving BTC reached ATH, so if 2024 is the same as 2020 and 2 weeks earlier, => So if I'm not mistaken, we have entered the Bullrun and reached 85k before Halving
It's exactly the same, just a little bit earlier about 2 weeks
#BinanceSquareVietnam #BullorBear #BinanceLaunchpool $BNB #SHIB $XRP #Memecoins
If post is helpful give me a tip
$BTC
I accidentally realized something extremely important:
Cycle 14 days before Halving 2024 " SAME " 99% of 2020 cycle (see photo below).
2024 before Halving BTC reached ATH, so if 2024 is the same as 2020 and 2 weeks earlier, => So if I'm not mistaken, we have entered the Bullrun and reached 85k before Halving
It's exactly the same, just a little bit earlier about 2 weeks
#BinanceSquareVietnam #BullorBear #BinanceLaunchpool $BNB #SHIB $XRP #Memecoins
If post is helpful give me a tip
I accidentally realized something extremely important:
Cycle 14 days before Halving 2024 " SAME " 99% of 2020 cycle (see photo below).
2024 before Halving BTC reached ATH, so if 2024 is the same as 2020 and 2 weeks earlier, => So if I'm not mistaken, we have entered the Bullrun and reached 85k before Halving
It's exactly the same, just a little bit earlier about 2 weeks
#BinanceSquareVietnam #BullorBear #BinanceLaunchpool $BNB #SHIB $XRP #Memecoins
If post is helpful give me a tip


3
3
25.5k
🚀 $EDEN MOMENTUM IS IN CONTROL (1H)
"The breakout already happened… now the market is hunting liquidity above."
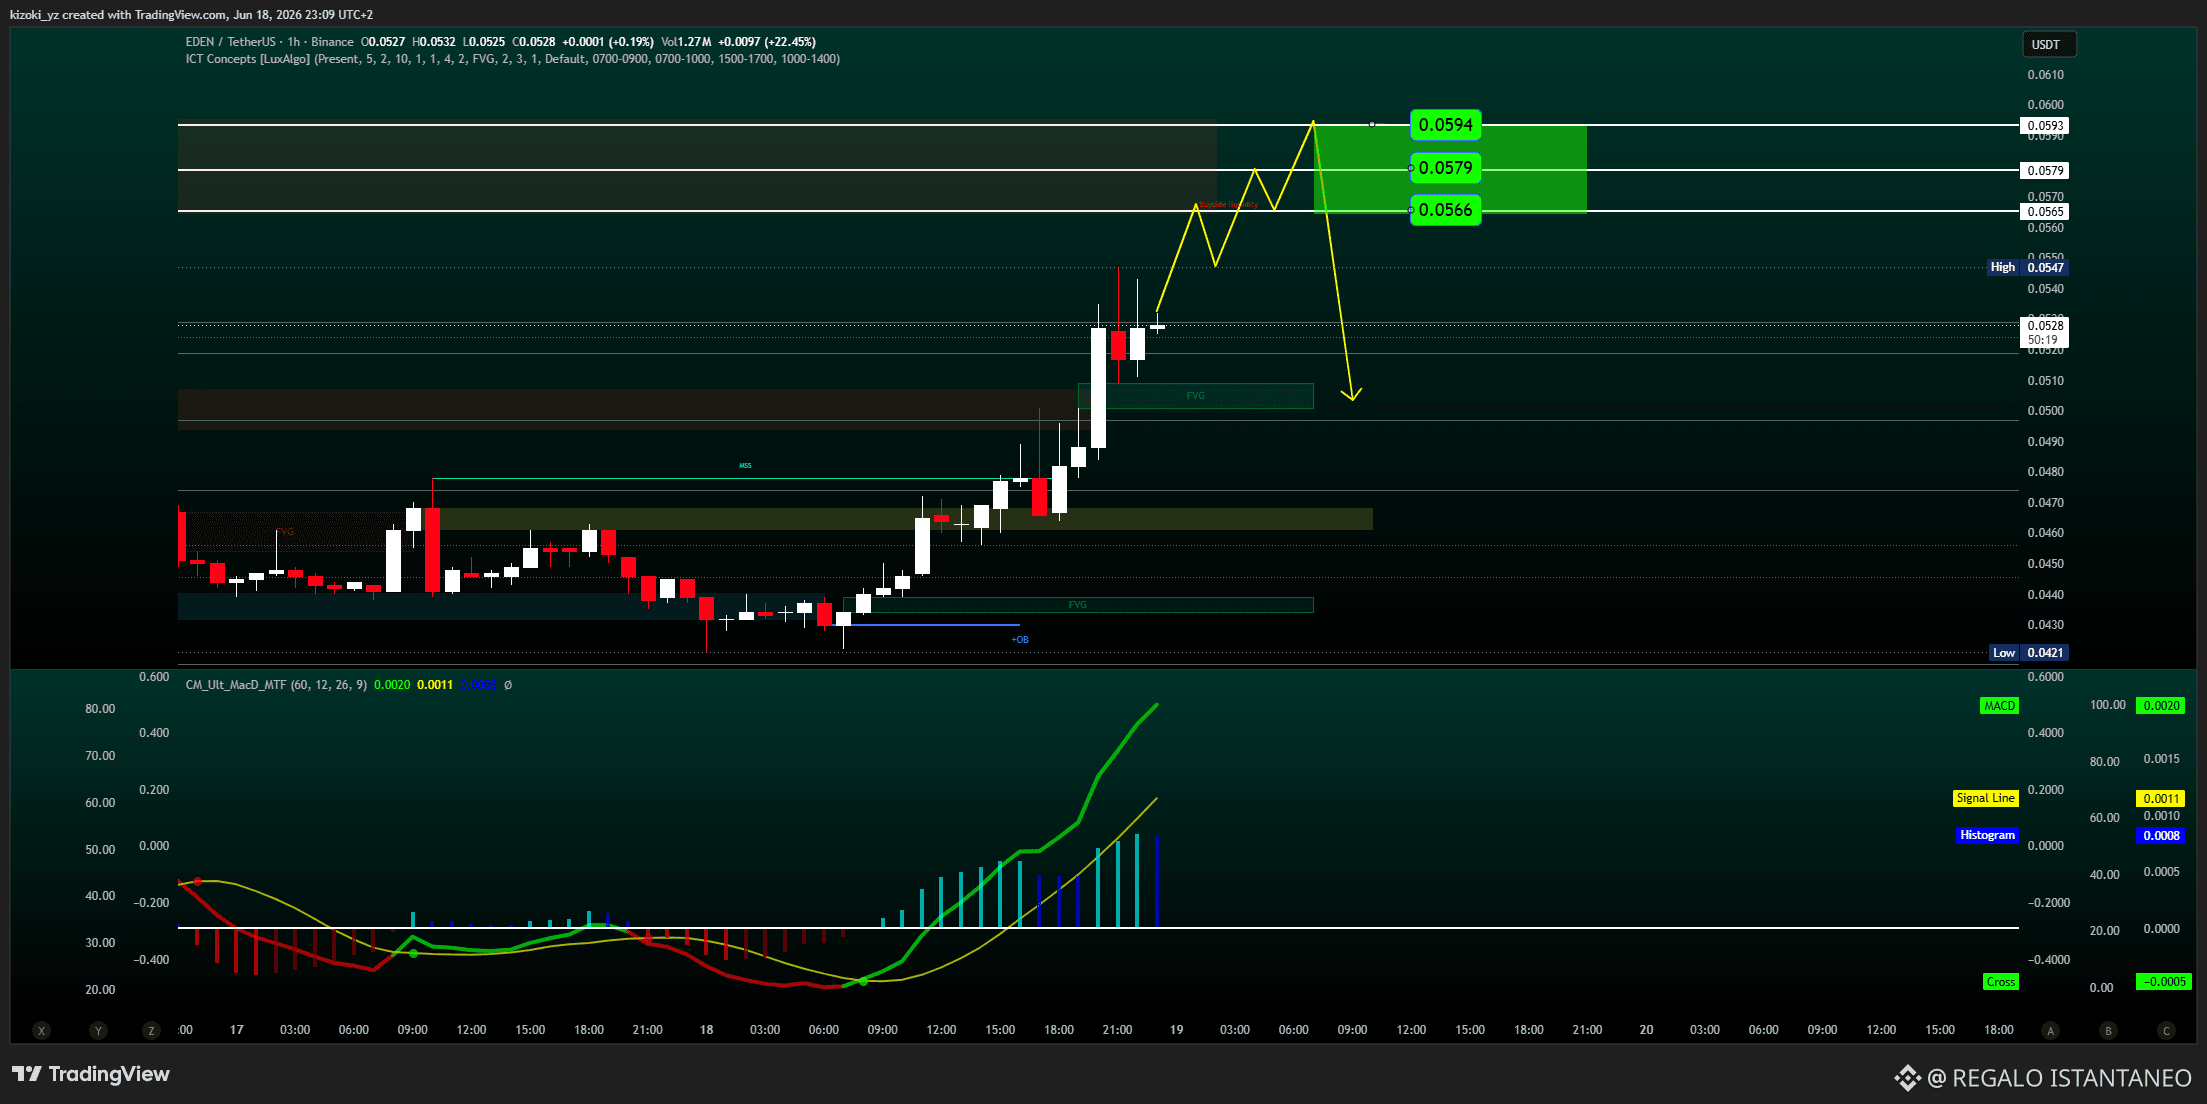
After a period of consolidation and sideways action, EDEN has successfully broken out of its previous range with force, not just through a standard breakout, but via a clear impulsive wave that has completely changed the market's rhythm. The buyers are not just defending the price, they're currently driving the movement, which is evident from the accelerating price action and the increasing momentum behind each upward push.
Notably, this rise is still supported by indicators, as the MACD continues to show a clear positive divergence with a steep upward tilt, signaling that the inflow of capital into the market is still backing the trend and hasn’t reached full exhaustion yet.
🔥 What’s happening now isn't a peak... it's an expansion phase
The market seems to have exited the accumulation phase and entered a phase of searching for liquidity above the recent highs. In such cases, price often moves in successive waves targeting higher supply zones before real profit-taking begins.
📈 The clear path ahead for buyers:
🎯 0.0566 → First target zone
🎯 0.0579 → Medium resistance zone
🎯 0.0594 → Main target and most significant supply area
🚨 Watch these levels on $EDEN /USDT 👇
🚀 $EDEN MOMENTUM IS IN CONTROL (1H)
"The breakout already happened… now the market is hunting liquidity above."
After a period of consolidation and sideways action, EDEN has successfully broken out of its previous range with force, not just through a standard breakout, but via a clear impulsive wave that has completely changed the market's rhythm. The buyers are not just defending the price, they're currently driving the movement, which is evident from the accelerating price action and the increasing momentum behind each upward push.
Notably, this rise is still supported by indicators, as the MACD continues to show a clear positive divergence with a steep upward tilt, signaling that the inflow of capital into the market is still backing the trend and hasn’t reached full exhaustion yet.
🔥 What’s happening now isn't a peak... it's an expansion phase
The market seems to have exited the accumulation phase and entered a phase of searching for liquidity above the recent highs. In such cases, price often moves in successive waves targeting higher supply zones before real profit-taking begins.
📈 The clear path ahead for buyers:
🎯 0.0566 → First target zone
🎯 0.0579 → Medium resistance zone
🎯 0.0594 → Main target and most significant supply area
🚨 Watch these levels on $EDEN /USDT 👇
"The breakout already happened… now the market is hunting liquidity above."
After a period of consolidation and sideways action, EDEN has successfully broken out of its previous range with force, not just through a standard breakout, but via a clear impulsive wave that has completely changed the market's rhythm. The buyers are not just defending the price, they're currently driving the movement, which is evident from the accelerating price action and the increasing momentum behind each upward push.
Notably, this rise is still supported by indicators, as the MACD continues to show a clear positive divergence with a steep upward tilt, signaling that the inflow of capital into the market is still backing the trend and hasn’t reached full exhaustion yet.
🔥 What’s happening now isn't a peak... it's an expansion phase
The market seems to have exited the accumulation phase and entered a phase of searching for liquidity above the recent highs. In such cases, price often moves in successive waves targeting higher supply zones before real profit-taking begins.
📈 The clear path ahead for buyers:
🎯 0.0566 → First target zone
🎯 0.0579 → Medium resistance zone
🎯 0.0594 → Main target and most significant supply area
🚨 Watch these levels on $EDEN /USDT 👇
1
170
#OPG One thing that stood out while using Open Gradient was how often verification became part of the workflow instead of something sitting in the background. Most AI products optimize for speed. Open Gradient seems willing to trade some of that speed for visibility.
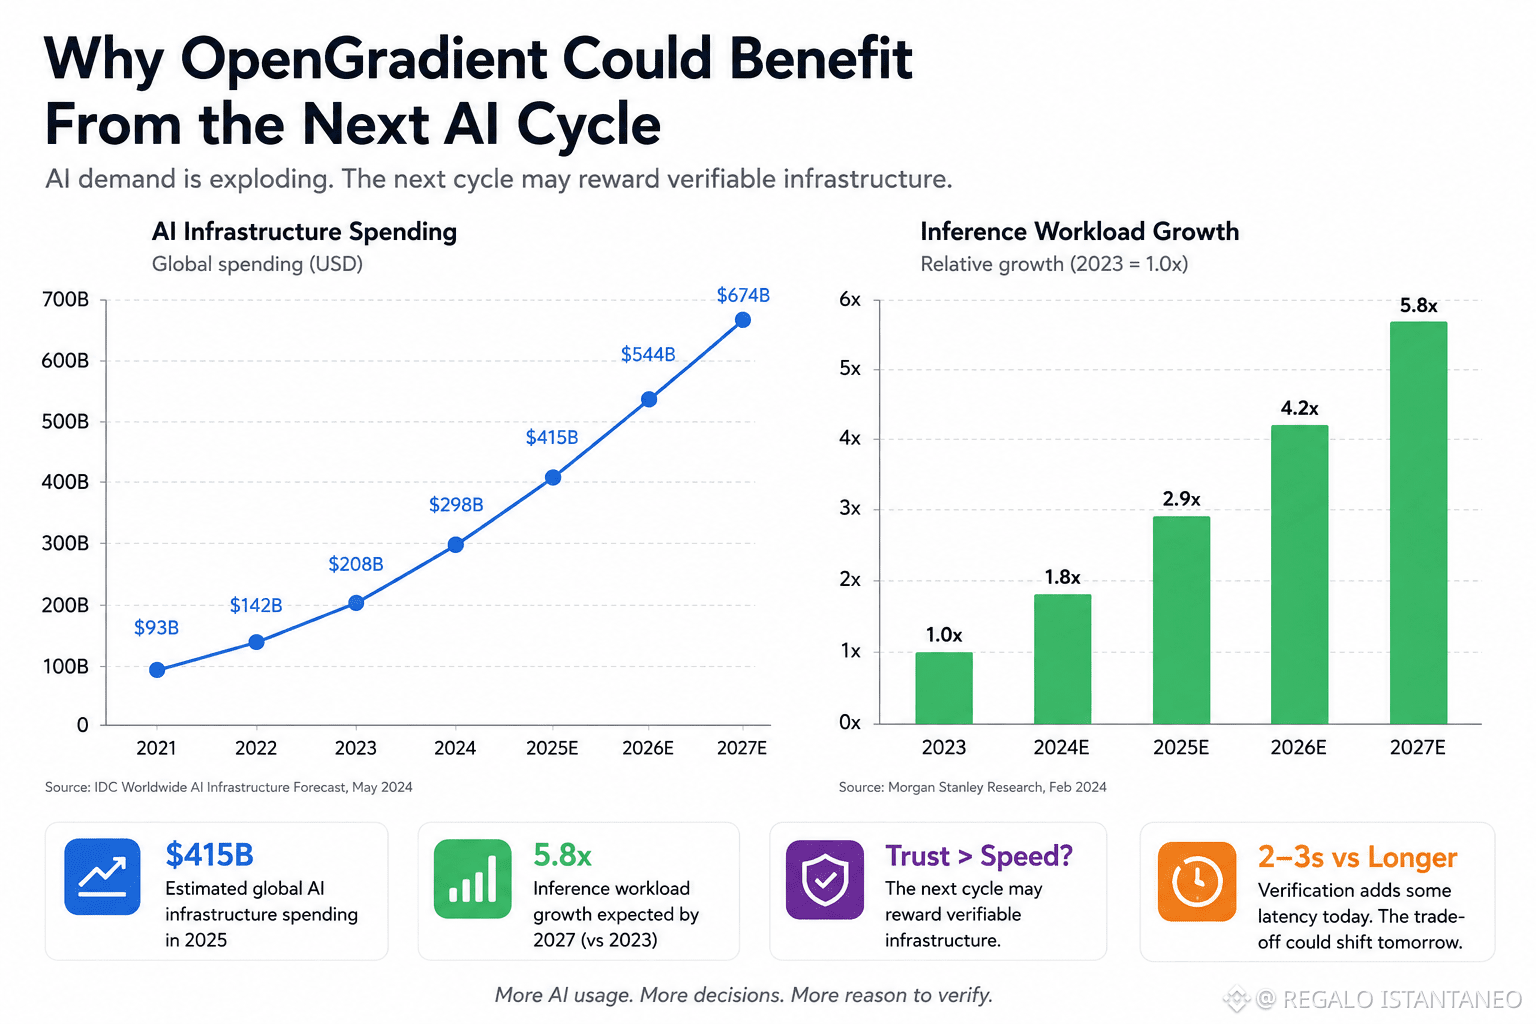
In a few test runs, response generation wasn't always the fastest path compared to centralized alternatives. Sometimes the difference felt noticeable. A task that might be completed in 2–3 seconds elsewhere could take longer depending on network conditions. Normally that would be a drawback.
The interesting part is that AI demand keeps growing. Industry estimates suggest global AI infrastructure spending is already measured in the hundreds of billions of dollars annually, while inference workloads continue expanding at a rapid pace. As usage scales, questions around who processed a request, where it was processed, and whether the execution can be verified become more relevant.
That's where OpenGradient could benefit from the next AI cycle.
The last cycle rewarded raw capability. The next one may reward trust layers around capability. Not because users suddenly care about decentralization, but because larger volumes of AI-generated decisions create pressure for accountability.
I'm still not convinced verification alone becomes a deciding factor. Most users abandon products that feel slow, regardless of architecture. But if AI adoption keeps accelerating and verification remains lightweight enough, the balance between speed and trust might shift more than people expect.
Not seeing that fully happen yet, though.
#opg
$OPG
#OPG One thing that stood out while using Open Gradient was how often verification became part of the workflow instead of something sitting in the background. Most AI products optimize for speed. Open Gradient seems willing to trade some of that speed for visibility.
In a few test runs, response generation wasn't always the fastest path compared to centralized alternatives. Sometimes the difference felt noticeable. A task that might be completed in 2–3 seconds elsewhere could take longer depending on network conditions. Normally that would be a drawback.
The interesting part is that AI demand keeps growing. Industry estimates suggest global AI infrastructure spending is already measured in the hundreds of billions of dollars annually, while inference workloads continue expanding at a rapid pace. As usage scales, questions around who processed a request, where it was processed, and whether the execution can be verified become more relevant.
That's where OpenGradient could benefit from the next AI cycle.
The last cycle rewarded raw capability. The next one may reward trust layers around capability. Not because users suddenly care about decentralization, but because larger volumes of AI-generated decisions create pressure for accountability.
I'm still not convinced verification alone becomes a deciding factor. Most users abandon products that feel slow, regardless of architecture. But if AI adoption keeps accelerating and verification remains lightweight enough, the balance between speed and trust might shift more than people expect.
Not seeing that fully happen yet, though.
#opg
$OPG
In a few test runs, response generation wasn't always the fastest path compared to centralized alternatives. Sometimes the difference felt noticeable. A task that might be completed in 2–3 seconds elsewhere could take longer depending on network conditions. Normally that would be a drawback.
The interesting part is that AI demand keeps growing. Industry estimates suggest global AI infrastructure spending is already measured in the hundreds of billions of dollars annually, while inference workloads continue expanding at a rapid pace. As usage scales, questions around who processed a request, where it was processed, and whether the execution can be verified become more relevant.
That's where OpenGradient could benefit from the next AI cycle.
The last cycle rewarded raw capability. The next one may reward trust layers around capability. Not because users suddenly care about decentralization, but because larger volumes of AI-generated decisions create pressure for accountability.
I'm still not convinced verification alone becomes a deciding factor. Most users abandon products that feel slow, regardless of architecture. But if AI adoption keeps accelerating and verification remains lightweight enough, the balance between speed and trust might shift more than people expect.
Not seeing that fully happen yet, though.
#opg
$OPG
53
·
--
Жоғары (өспелі)
🚨🚨 🚨 BREAKING: #SaudiSupertankersBeginCrossingStraimuz — Oil Flows Are BACK! 🛢️🚢
Huge news from the world’s most critical chokepoint: Saudi supertankers loaded with millions of barrels are now crossing the Strait of Hormuz again after the recent US-Iran deal!
This is the first major movement in months. The route that carries ~20% of global oil supply was heavily disrupted — now traffic is resuming fast.
What this means:
Massive supply relief incoming Ties directly into IEA’s forecast of 5M bpd oil overhang by 2027 Bearish pressure on crude prices ahead Cheaper energy = potential macro boost for risk assets like Crypto
From blockade to full flow — energy markets just got a major de-risking. Lower oil prices could mean cheaper electricity, better margins for miners, and more liquidity.
Is this the start of a sustained oil glut? Or will demand catch up?
Drop your price predictions for $OIL and $BTC below 👇
#Oil #Hormuz #Saudiaramco #energy
$BTC
🚨🚨 🚨 BREAKING: #SaudiSupertankersBeginCrossingStraimuz — Oil Flows Are BACK! 🛢️🚢
Huge news from the world’s most critical chokepoint: Saudi supertankers loaded with millions of barrels are now crossing the Strait of Hormuz again after the recent US-Iran deal!
This is the first major movement in months. The route that carries ~20% of global oil supply was heavily disrupted — now traffic is resuming fast.
What this means:
Massive supply relief incoming Ties directly into IEA’s forecast of 5M bpd oil overhang by 2027 Bearish pressure on crude prices ahead Cheaper energy = potential macro boost for risk assets like Crypto
From blockade to full flow — energy markets just got a major de-risking. Lower oil prices could mean cheaper electricity, better margins for miners, and more liquidity.
Is this the start of a sustained oil glut? Or will demand catch up?
Drop your price predictions for $OIL and $BTC below 👇
#Oil #Hormuz #Saudiaramco #energy
$BTC
Huge news from the world’s most critical chokepoint: Saudi supertankers loaded with millions of barrels are now crossing the Strait of Hormuz again after the recent US-Iran deal!
This is the first major movement in months. The route that carries ~20% of global oil supply was heavily disrupted — now traffic is resuming fast.
What this means:
Massive supply relief incoming Ties directly into IEA’s forecast of 5M bpd oil overhang by 2027 Bearish pressure on crude prices ahead Cheaper energy = potential macro boost for risk assets like Crypto
From blockade to full flow — energy markets just got a major de-risking. Lower oil prices could mean cheaper electricity, better margins for miners, and more liquidity.
Is this the start of a sustained oil glut? Or will demand catch up?
Drop your price predictions for $OIL and $BTC below 👇
#Oil #Hormuz #Saudiaramco #energy
$BTC
73
·
--
Төмен (кемімелі)
🚨 $BTC
BTC
73,833.99
-0.07%
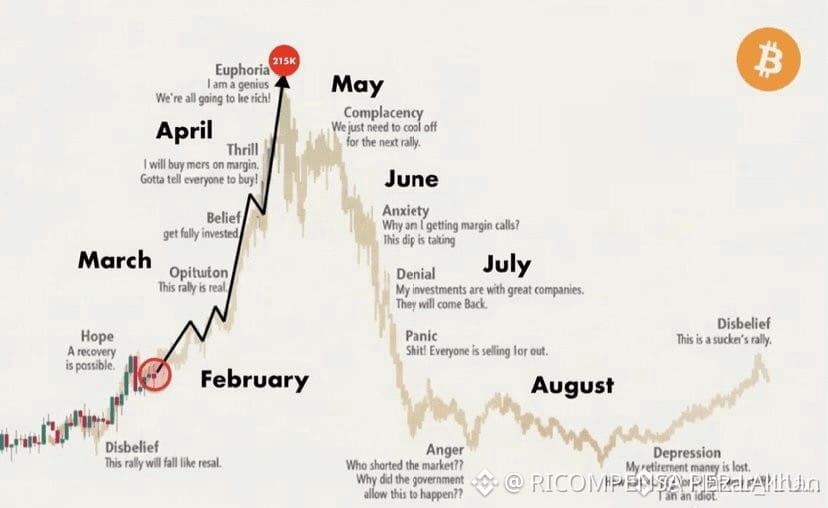
2026 BULL RUN OUTLOOK
📅 Key projected phases:
- Feb → Bear trap
- Mar → Breakout
- Apr → Altseason
- May → New ATH near $215K
- Jun → Bull trap
- Jul → Liquidation cascade
- Aug → Bear market begins
Experienced analysts who have successfully called major tops and bottoms for over a decade are warning traders to pay attention. Past warnings about October tops proved accurate — history may repeat itself.
💡 Strategy tip: Watch BTC closely, manage risk, and don’t get caught FOMOing. 🚀
#bitcoin #CryptoMarket #BTC
🚨 $BTC
BTC
73,833.99
-0.07%
2026 BULL RUN OUTLOOK
📅 Key projected phases:
- Feb → Bear trap
- Mar → Breakout
- Apr → Altseason
- May → New ATH near $215K
- Jun → Bull trap
- Jul → Liquidation cascade
- Aug → Bear market begins
Experienced analysts who have successfully called major tops and bottoms for over a decade are warning traders to pay attention. Past warnings about October tops proved accurate — history may repeat itself.
💡 Strategy tip: Watch BTC closely, manage risk, and don’t get caught FOMOing. 🚀
#bitcoin #CryptoMarket #BTC
BTC
73,833.99
-0.07%
2026 BULL RUN OUTLOOK
📅 Key projected phases:
- Feb → Bear trap
- Mar → Breakout
- Apr → Altseason
- May → New ATH near $215K
- Jun → Bull trap
- Jul → Liquidation cascade
- Aug → Bear market begins
Experienced analysts who have successfully called major tops and bottoms for over a decade are warning traders to pay attention. Past warnings about October tops proved accurate — history may repeat itself.
💡 Strategy tip: Watch BTC closely, manage risk, and don’t get caught FOMOing. 🚀
#bitcoin #CryptoMarket #BTC
17
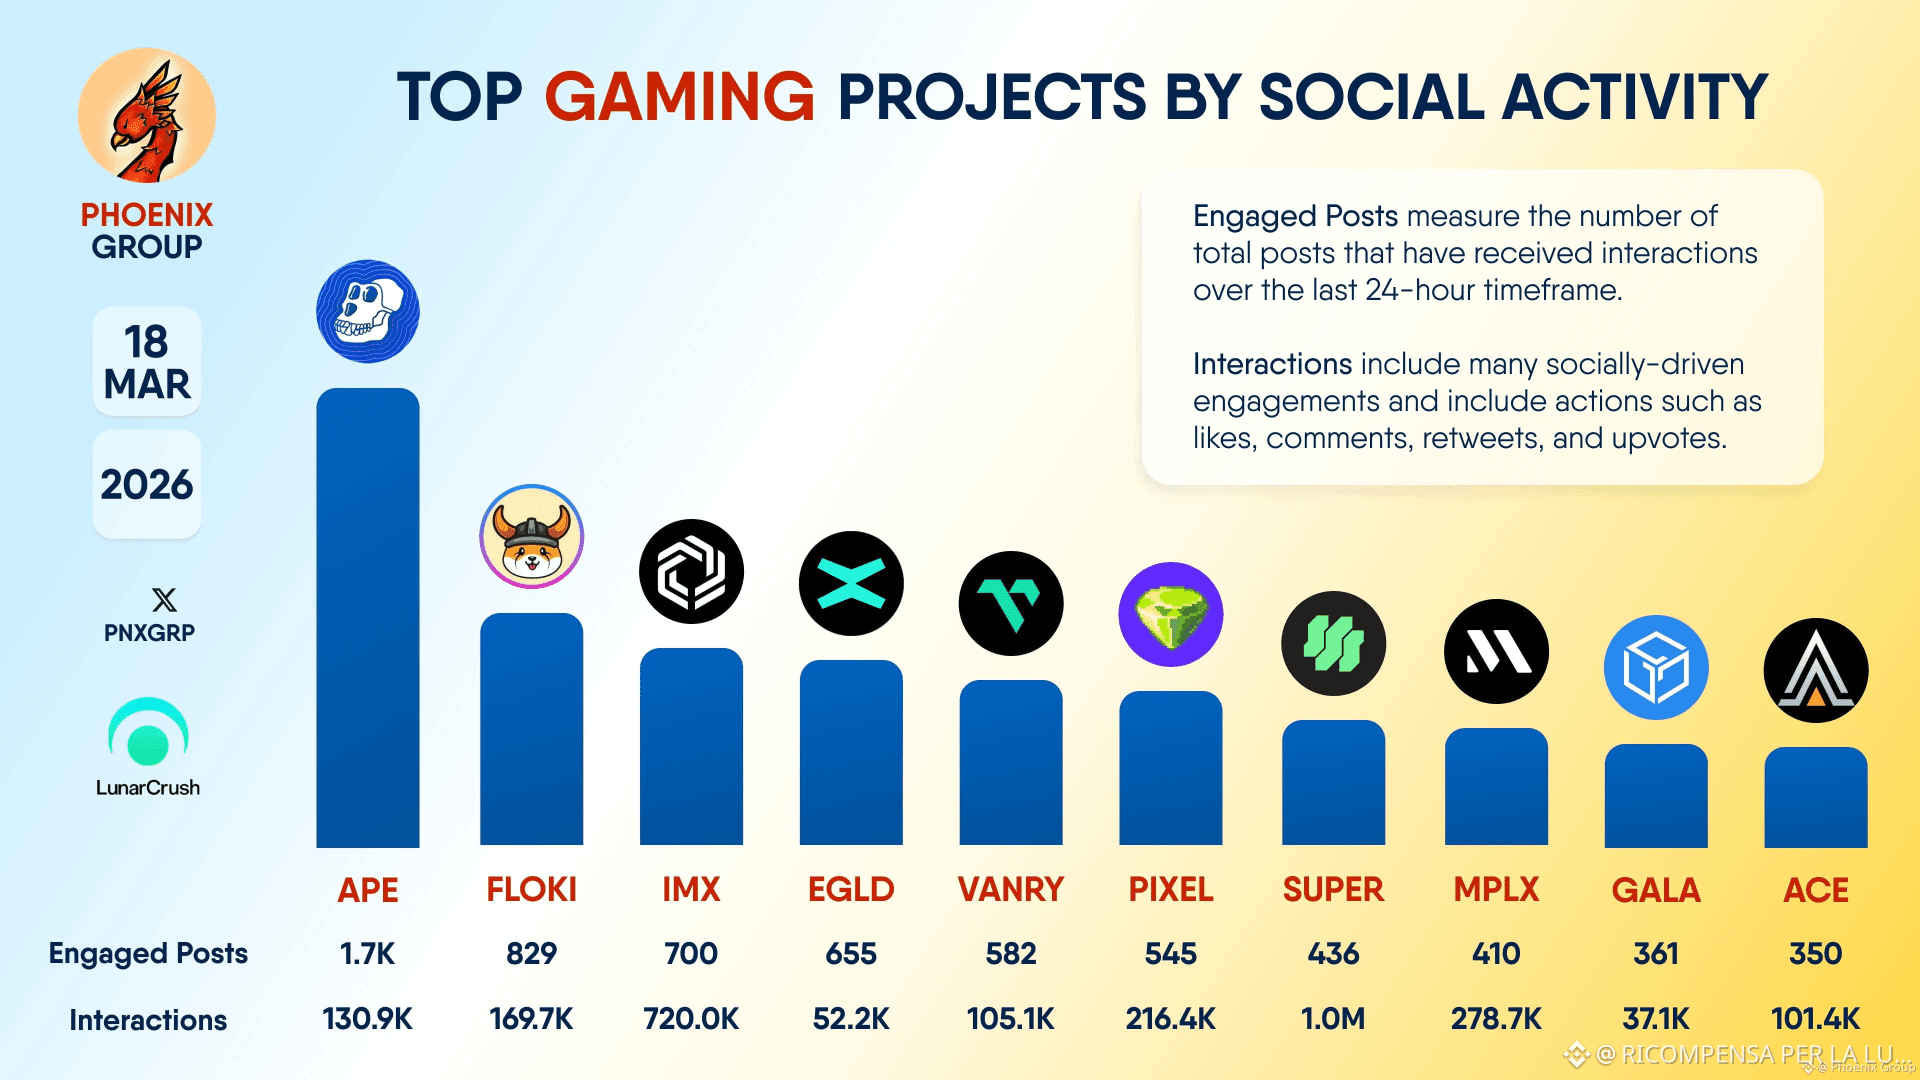
TOP #GAMING PROJECTS BY SOCIAL ACTIVITY
$ACE $FLOKI #MIX $EGLD $PIXEL #SUPER/USDT $MPLX $GALA $ACE#YZiLabsInvestsInRoboForce
TOP #GAMING PROJECTS BY SOCIAL ACTIVITY
$ACE $FLOKI #MIX $EGLD $PIXEL #SUPER/USDT $MPLX $GALA $ACE #YZiLabsInvestsInRoboForce
$ACE $FLOKI #MIX $EGLD $PIXEL #SUPER/USDT $MPLX $GALA $ACE #YZiLabsInvestsInRoboForce
7
·
--
Төмен (кемімелі)
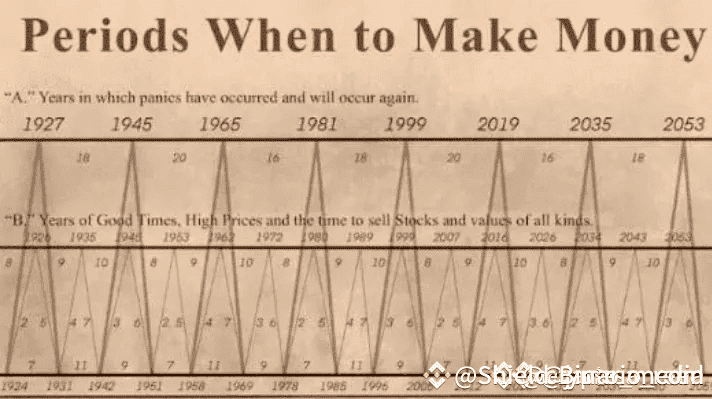
A 150-Year-Old Chart Could Predict the Next Crypto Boom
Forget AI forecasts . This farmer from 1875 might’ve nailed it.
The Benner Cycle has predicted past market moves, and here’s what it’s saying now:
📍 2023: Quiet accumulation
📍 2024–25: Hype season
📍 2026: Peak — time to sell
Markets just dipped… is the cycle breaking, or just getting started?
#VoteToListOnBinance #BinanceSafetyInsights #CPI&JoblessClaimsWatch #SecureYourAssets #BinanceLaunchpoolWCT
{spot}(BTCUSDT)
A 150-Year-Old Chart Could Predict the Next Crypto Boom
Forget AI forecasts . This farmer from 1875 might’ve nailed it.
The Benner Cycle has predicted past market moves, and here’s what it’s saying now:
📍 2023: Quiet accumulation
📍 2024–25: Hype season
📍 2026: Peak — time to sell
Markets just dipped… is the cycle breaking, or just getting started?
#VoteToListOnBinance #BinanceSafetyInsights #CPI&JoblessClaimsWatch #SecureYourAssets #BinanceLaunchpoolWCT
Forget AI forecasts . This farmer from 1875 might’ve nailed it.
The Benner Cycle has predicted past market moves, and here’s what it’s saying now:
📍 2023: Quiet accumulation
📍 2024–25: Hype season
📍 2026: Peak — time to sell
Markets just dipped… is the cycle breaking, or just getting started?
#VoteToListOnBinance #BinanceSafetyInsights #CPI&JoblessClaimsWatch #SecureYourAssets #BinanceLaunchpoolWCT
3
149
·
--
Жоғары (өспелі)
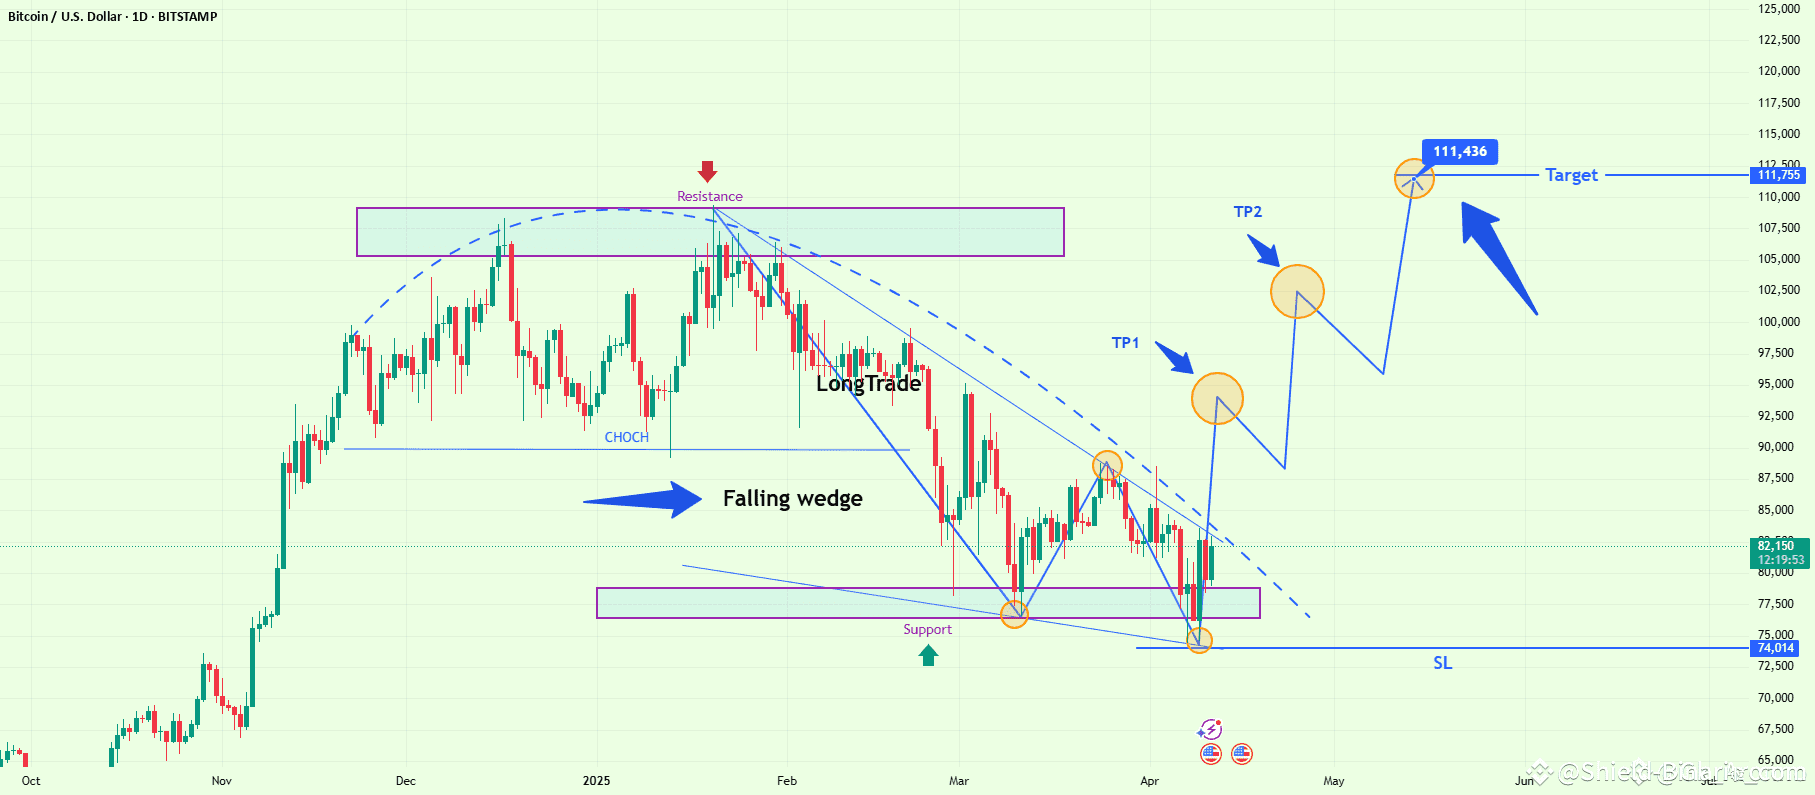
BTC Breakout from Falling Wedge – Targeting $111K
$BTC
{spot}(BTCUSDT)
BTC
82658
+4.41%
BTCUSDT
Perp
82,631.5
+4.36%
Bitcoin recently experienced a corrective phase following a strong uptrend that topped near $115,000. After facing rejection at this level, price action shifted into a downward structure, forming a falling wedge pattern, which is typically considered a bullish reversal signal.
🔷 Pattern Formation: Falling Wedge
The chart reveals a clearly defined falling wedge (marked by two converging descending trendlines).
Price action respected the wedge boundaries multiple times, confirming the pattern's validity.
The wedge started forming after the CHoCH (Change of Character), indicating a structural shift from bullish to bearish.
The pattern ended with a bullish breakout, suggesting the return of upward momentum.
🟩 Key Technical Zones:
Resistance Zone: $111,000 – $115,000
Previously tested multiple times; a major supply zone.
Support Zone: $74,000 – $75,000
This area held as support three times, forming a triple bottom, reinforcing its strength.
Breakout Point: ~ $80,000
Price broke above the descending resistance trendline of the wedge.
📌 Trade Setup Overview:
✅ Entry:
Ideal long entry after the breakout from the wedge, confirmed with bullish momentum and daily candle close above resistance.
🎯 Targets:
TP1: ~$90,000 — minor resistance area and psychological level.
TP2: ~$100,000 — significant level, aligns with previous structural highs.
Final Target: $111,755 — retest of the macro resistance zone from the previous peak.
🛡 Stop Loss (SL):
Placed below the strong support at $74,014, just outside the pattern structure.
This provides a favorable risk-to-reward ratio and protects against a false breakout.
📈 Structure and Price Flow:
The projection (marked with blue arrows and yellow circles) outlines a typical Elliott-style impulse:
Breakout
Minor pullback
Continuation to TP1 and TP2
Final wave targeting previous highs
🔎 Additional Insights:
Volume (not shown): A breakout from a wedge is typically confirmed by an increase
BTC Breakout from Falling Wedge – Targeting $111K
$BTC
BTC
82658
+4.41%
BTCUSDT
Perp
82,631.5
+4.36%
Bitcoin recently experienced a corrective phase following a strong uptrend that topped near $115,000. After facing rejection at this level, price action shifted into a downward structure, forming a falling wedge pattern, which is typically considered a bullish reversal signal.
🔷 Pattern Formation: Falling Wedge
The chart reveals a clearly defined falling wedge (marked by two converging descending trendlines).
Price action respected the wedge boundaries multiple times, confirming the pattern's validity.
The wedge started forming after the CHoCH (Change of Character), indicating a structural shift from bullish to bearish.
The pattern ended with a bullish breakout, suggesting the return of upward momentum.
🟩 Key Technical Zones:
Resistance Zone: $111,000 – $115,000
Previously tested multiple times; a major supply zone.
Support Zone: $74,000 – $75,000
This area held as support three times, forming a triple bottom, reinforcing its strength.
Breakout Point: ~ $80,000
Price broke above the descending resistance trendline of the wedge.
📌 Trade Setup Overview:
✅ Entry:
Ideal long entry after the breakout from the wedge, confirmed with bullish momentum and daily candle close above resistance.
🎯 Targets:
TP1: ~$90,000 — minor resistance area and psychological level.
TP2: ~$100,000 — significant level, aligns with previous structural highs.
Final Target: $111,755 — retest of the macro resistance zone from the previous peak.
🛡 Stop Loss (SL):
Placed below the strong support at $74,014, just outside the pattern structure.
This provides a favorable risk-to-reward ratio and protects against a false breakout.
📈 Structure and Price Flow:
The projection (marked with blue arrows and yellow circles) outlines a typical Elliott-style impulse:
Breakout
Minor pullback
Continuation to TP1 and TP2
Final wave targeting previous highs
🔎 Additional Insights:
Volume (not shown): A breakout from a wedge is typically confirmed by an increase
$BTC
BTC
82658
+4.41%
BTCUSDT
Perp
82,631.5
+4.36%
Bitcoin recently experienced a corrective phase following a strong uptrend that topped near $115,000. After facing rejection at this level, price action shifted into a downward structure, forming a falling wedge pattern, which is typically considered a bullish reversal signal.
🔷 Pattern Formation: Falling Wedge
The chart reveals a clearly defined falling wedge (marked by two converging descending trendlines).
Price action respected the wedge boundaries multiple times, confirming the pattern's validity.
The wedge started forming after the CHoCH (Change of Character), indicating a structural shift from bullish to bearish.
The pattern ended with a bullish breakout, suggesting the return of upward momentum.
🟩 Key Technical Zones:
Resistance Zone: $111,000 – $115,000
Previously tested multiple times; a major supply zone.
Support Zone: $74,000 – $75,000
This area held as support three times, forming a triple bottom, reinforcing its strength.
Breakout Point: ~ $80,000
Price broke above the descending resistance trendline of the wedge.
📌 Trade Setup Overview:
✅ Entry:
Ideal long entry after the breakout from the wedge, confirmed with bullish momentum and daily candle close above resistance.
🎯 Targets:
TP1: ~$90,000 — minor resistance area and psychological level.
TP2: ~$100,000 — significant level, aligns with previous structural highs.
Final Target: $111,755 — retest of the macro resistance zone from the previous peak.
🛡 Stop Loss (SL):
Placed below the strong support at $74,014, just outside the pattern structure.
This provides a favorable risk-to-reward ratio and protects against a false breakout.
📈 Structure and Price Flow:
The projection (marked with blue arrows and yellow circles) outlines a typical Elliott-style impulse:
Breakout
Minor pullback
Continuation to TP1 and TP2
Final wave targeting previous highs
🔎 Additional Insights:
Volume (not shown): A breakout from a wedge is typically confirmed by an increase
1
889
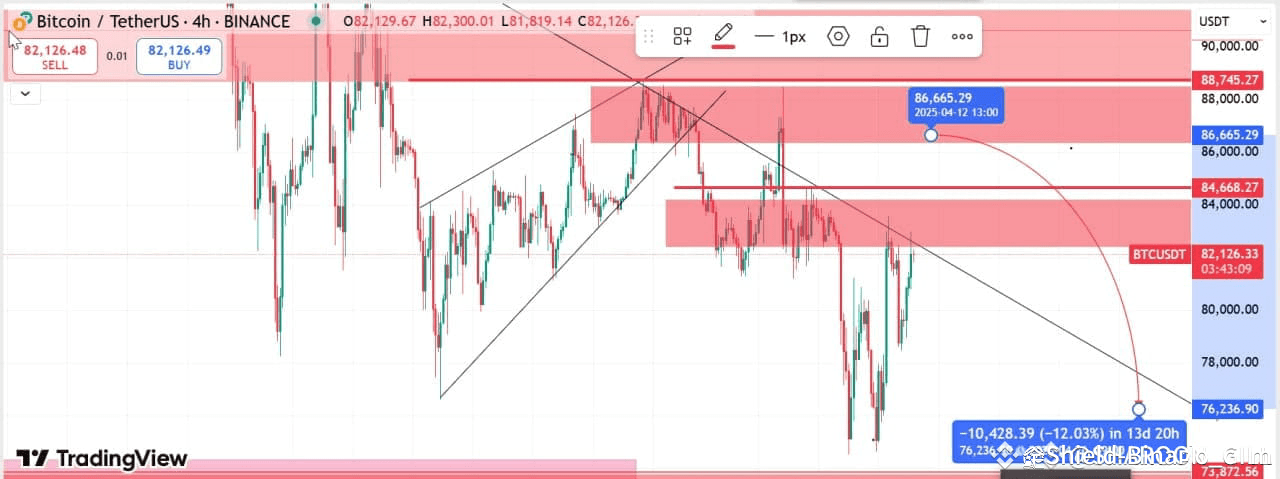
🚨 Market Update:** We're currently testing a key 4H resistance zone. However, I'm avoiding shorts here due to:
- **CPI News Risk** (potential volatility spike)
- **Weekend Gap Risk** (liquidity constraints)
- **Unfavorable R/R** (resistance area lacks an optimal risk/reward setup) #VoteToListOnBinance #BinanceLaunchpoolWCT #BinanceVoteToDelist #CPI&JoblessClaimsWatch
**Priority #1:** Protect capital. Opportunities are endless—but only if we stay patient and selective. $BTC
{spot}(BTCUSDT)
🚨 Market Update:** We're currently testing a key 4H resistance zone. However, I'm avoiding shorts here due to:
- **CPI News Risk** (potential volatility spike)
- **Weekend Gap Risk** (liquidity constraints)
- **Unfavorable R/R** (resistance area lacks an optimal risk/reward setup) #VoteToListOnBinance #BinanceLaunchpoolWCT #BinanceVoteToDelist #CPI&JoblessClaimsWatch
**Priority #1:** Protect capital. Opportunities are endless—but only if we stay patient and selective. $BTC
- **CPI News Risk** (potential volatility spike)
- **Weekend Gap Risk** (liquidity constraints)
- **Unfavorable R/R** (resistance area lacks an optimal risk/reward setup) #VoteToListOnBinance #BinanceLaunchpoolWCT #BinanceVoteToDelist #CPI&JoblessClaimsWatch
**Priority #1:** Protect capital. Opportunities are endless—but only if we stay patient and selective. $BTC
2
121
·
--
Жоғары (өспелі)
{spot}(BTCUSDT)
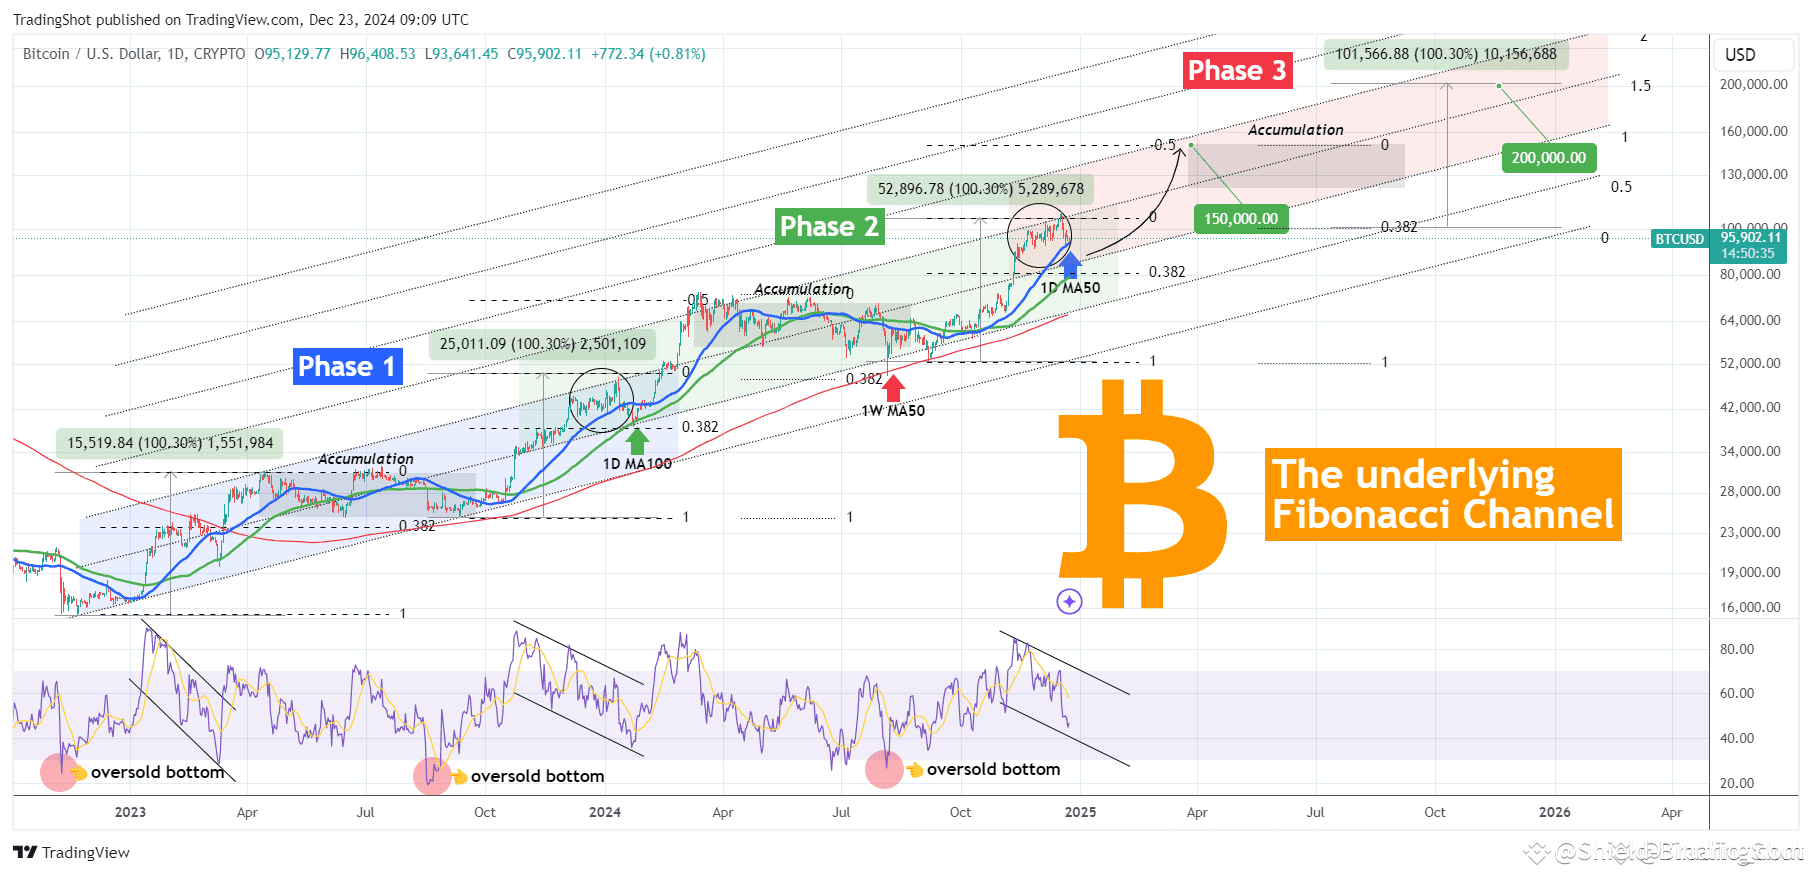
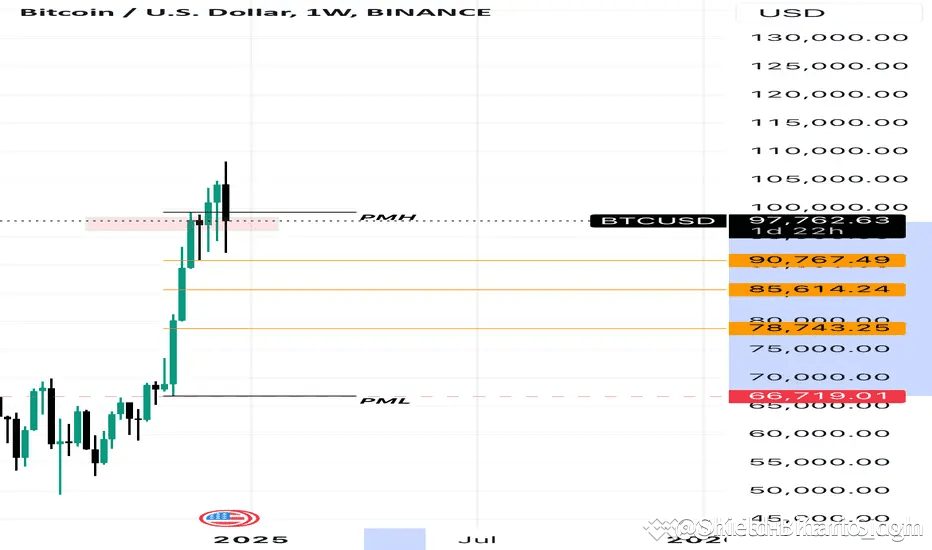
Bitcoin (BTCUSD) touched its 1D MA50 (blue trend-line) for the first time in more than 2 months (since October 11) and is rebounding. The first presence of short-term buyers was actually felt on Friday, when the price came close to the MA50 again and rebounded aggressively. This is a natural technical reaction during such aggressive uptrends.The key Support level during BTC Bull Cycles however is the 1W MA50 (red trend-line), which has been supporting since March 2023 and was successfully tested (and held) twice on August 05 and September 06, the last of which was technically the start of the current Bullish Leg. The Fibonacci Channel Up Bullish Legs are technically part of Channels and this time is no different as Bitcoin has been trading on a Fibonacci Channel Up since the very bottom of the last Bear Cycle in November 21 2021.As you can see, we have classified the price action on this pattern in Phases, each of whom trades within one range upwards, which is why the Fibonacci Channel succeeds at accurately displaying BTC's current logarithmic rise during this Cycle. The Phases and the high symmetry Phase 1 (blue Channel) traded within the Fib 0.0 - 1.0 range, Phase 2 (green Channel) within the Fib 0.5 - 1.5 range and we expect a 3rd one, Phase 3 (red Channel) to trade within the Fib 1.0 - 2.0 range.
Bitcoin (BTCUSD) touched its 1D MA50 (blue trend-line) for the first time in more than 2 months (since October 11) and is rebounding. The first presence of short-term buyers was actually felt on Friday, when the price came close to the MA50 again and rebounded aggressively. This is a natural technical reaction during such aggressive uptrends.The key Support level during BTC Bull Cycles however is the 1W MA50 (red trend-line), which has been supporting since March 2023 and was successfully tested (and held) twice on August 05 and September 06, the last of which was technically the start of the current Bullish Leg. The Fibonacci Channel Up Bullish Legs are technically part of Channels and this time is no different as Bitcoin has been trading on a Fibonacci Channel Up since the very bottom of the last Bear Cycle in November 21 2021.As you can see, we have classified the price action on this pattern in Phases, each of whom trades within one range upwards, which is why the Fibonacci Channel succeeds at accurately displaying BTC's current logarithmic rise during this Cycle. The Phases and the high symmetry Phase 1 (blue Channel) traded within the Fib 0.0 - 1.0 range, Phase 2 (green Channel) within the Fib 0.5 - 1.5 range and we expect a 3rd one, Phase 3 (red Channel) to trade within the Fib 1.0 - 2.0 range.
2
331
Crypto is possible to crash 20/30% minimum very soon! Big players gonna dump it rebuying will be from the key levels I have marked. I’m strongly bearish!!!
Note:- remember crypto will crash 💯
$BTC
{spot}(BTCUSDT)
Crypto is possible to crash 20/30% minimum very soon! Big players gonna dump it rebuying will be from the key levels I have marked. I’m strongly bearish!!!
Note:- remember crypto will crash 💯
$BTC
Note:- remember crypto will crash 💯
$BTC
1
5
$ALT
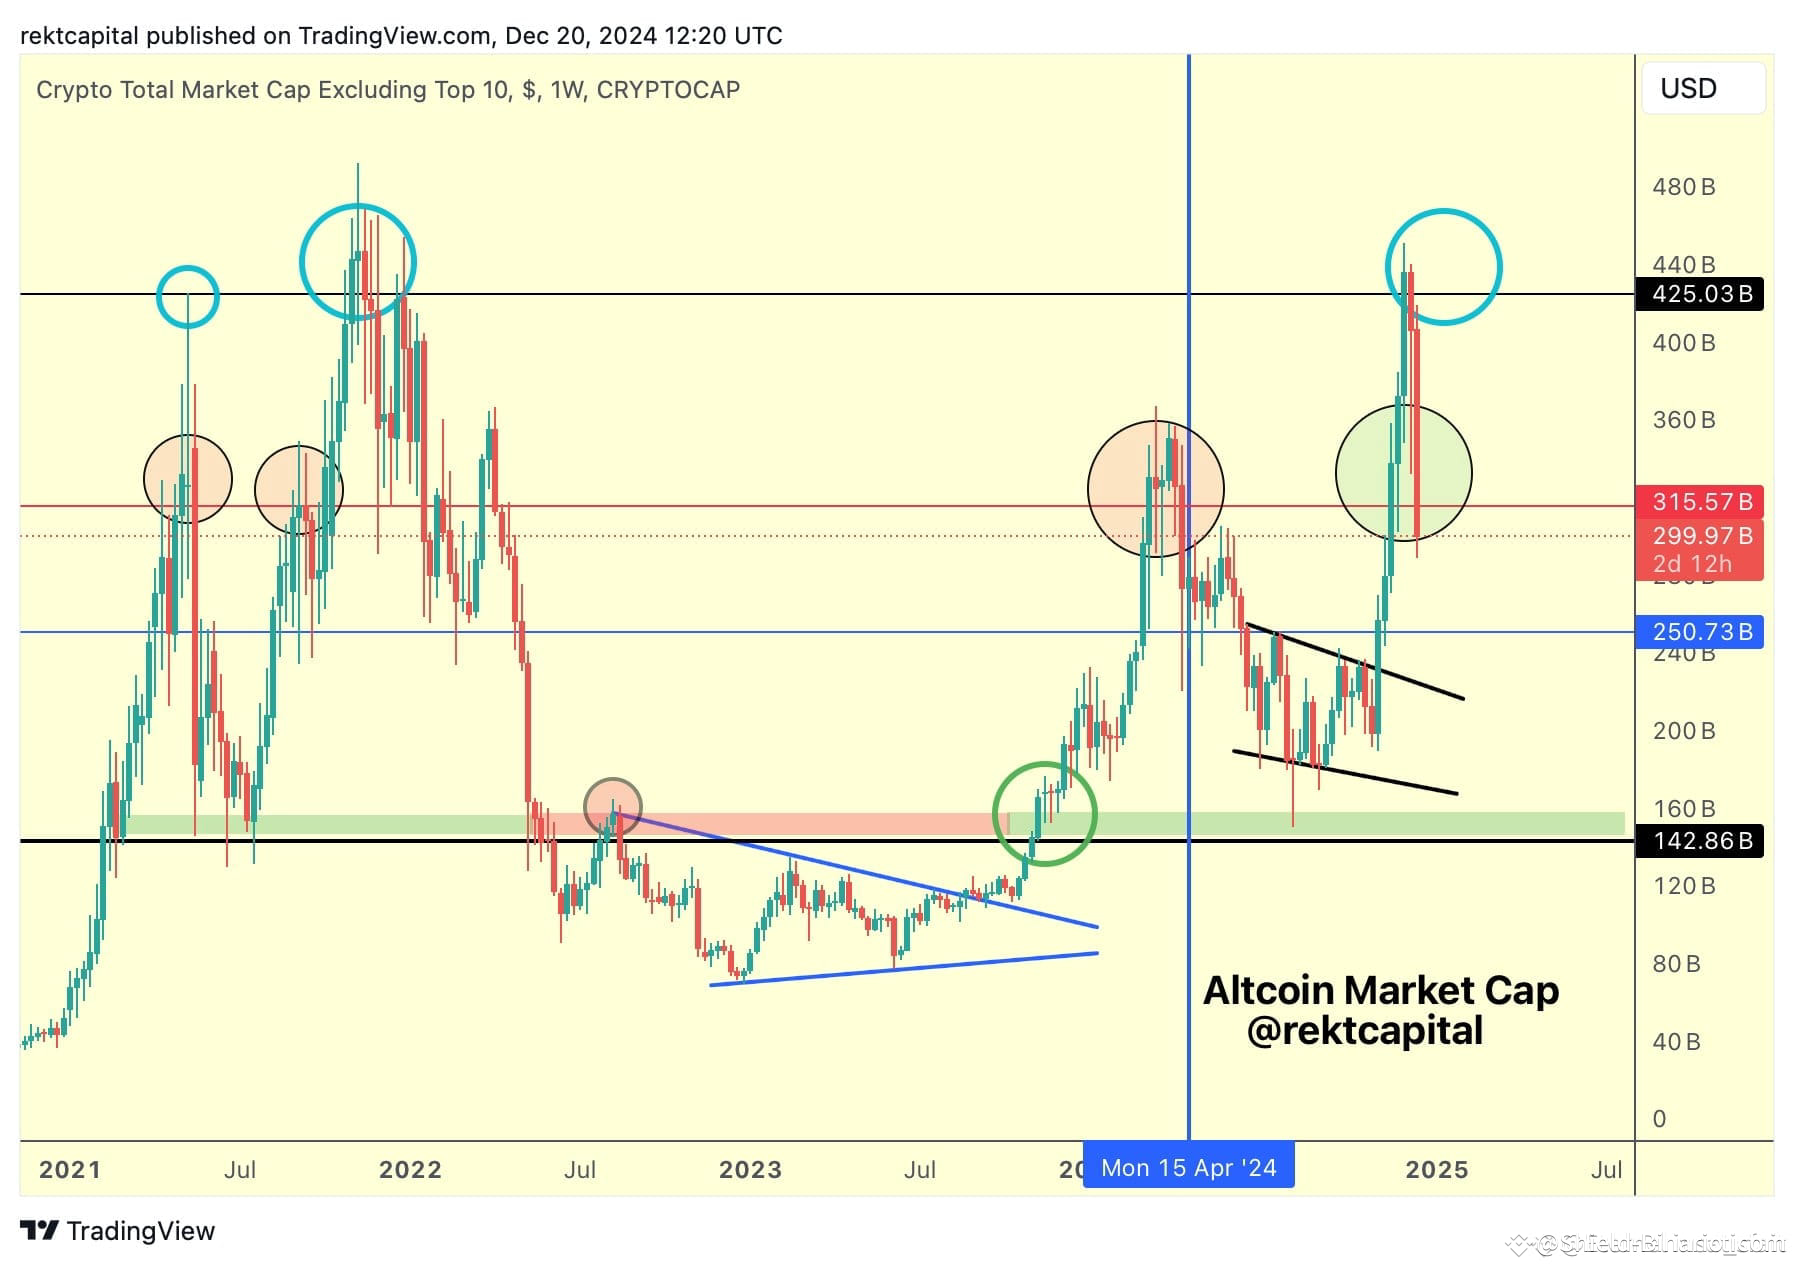
The Altcoin Market Cap retrace continues
However, it is still a much shallower retrace compared to previous corrections originating at the $425bn mark
The entire purpose of this pullback is to demonstrate that the $425bn resistance (black) is weakening as a point of rejection
Once this retrace is over, Altcoin Market Cap may very well break to new ATHs in the next uptrend
Altcoin Market Cap breaks out to new All Time Highs in every cycle
#BTC #Crypto #Bitcoin
$ALT
The Altcoin Market Cap retrace continues
However, it is still a much shallower retrace compared to previous corrections originating at the $425bn mark
The entire purpose of this pullback is to demonstrate that the $425bn resistance (black) is weakening as a point of rejection
Once this retrace is over, Altcoin Market Cap may very well break to new ATHs in the next uptrend
Altcoin Market Cap breaks out to new All Time Highs in every cycle
#BTC #Crypto #Bitcoin
The Altcoin Market Cap retrace continues
However, it is still a much shallower retrace compared to previous corrections originating at the $425bn mark
The entire purpose of this pullback is to demonstrate that the $425bn resistance (black) is weakening as a point of rejection
Once this retrace is over, Altcoin Market Cap may very well break to new ATHs in the next uptrend
Altcoin Market Cap breaks out to new All Time Highs in every cycle
#BTC #Crypto #Bitcoin
1
8
·
--
Төмен (кемімелі)
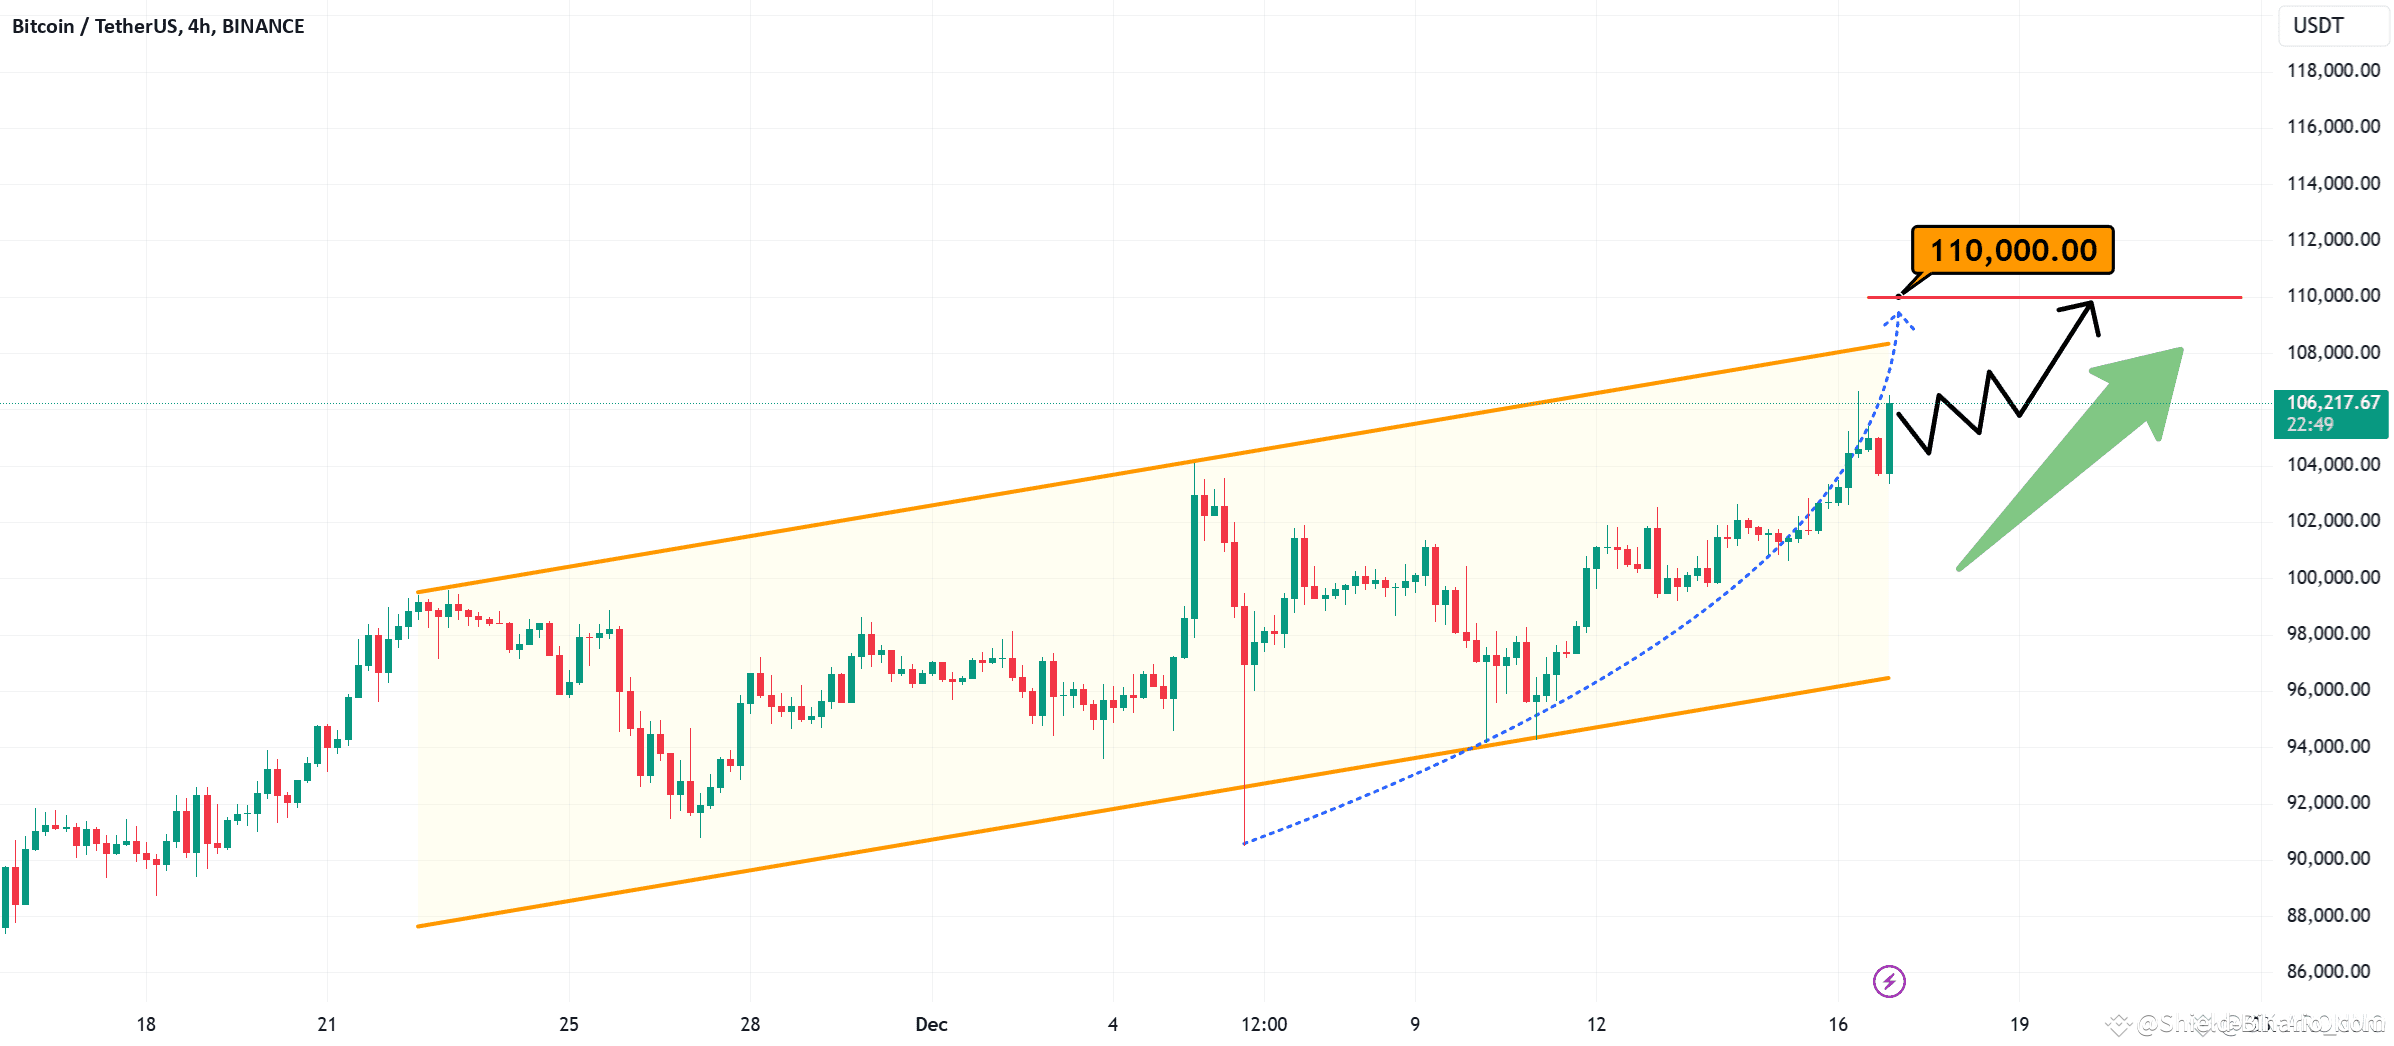
BTC continued to grow, so, I close this trade. Bitcoin exited from the triangle and reached the new ATH. So, I expect that BTC will make a correction to 101K. Bitcoin can make small move up and then drop to support line.
But from previous concept looking at the chart, we can see how the price a few moments ago started to decline and fell to the buyer zone, breaking the support level, where it some time traded. Later it tried to grow, but failed and quickly fell back to the buyer zone, after which made a strong upward impulse, breaking 95500 with 102200 levels. Next, the price grew more and then dropped to 90500 points, after which backed up and started to trades inside the triangle pattern. In this pattern, BTC almost rose to its current support level and then started to decline. In a short time, the price fell to the 95500 support level, and even lower, to support line of the triangle, which is coincided with the buyer zone. Then BTC bounced up and rose to the 102200 level, after which made little correction and then continued to move up. Some time later, the price reached the 102200 level again, broke it and now BTC trades inside the support area, very close to the resistance line of the triangle. So, for this case, I think BTC can make a small movement up and then continue to fall to the support line of the triangle pattern, breaking the support level. That's why I set my TP at 98900 points, which coincided with this line. Please share this idea with your friends and click Boost 🚀
{spot}(BTCUSDT)
#PENGUOpening #MarketNewHype #BinanceAirdropsCATandPENGU #FullMarketBullRun #BTCNewATH
BTC continued to grow, so, I close this trade. Bitcoin exited from the triangle and reached the new ATH. So, I expect that BTC will make a correction to 101K. Bitcoin can make small move up and then drop to support line.
But from previous concept looking at the chart, we can see how the price a few moments ago started to decline and fell to the buyer zone, breaking the support level, where it some time traded. Later it tried to grow, but failed and quickly fell back to the buyer zone, after which made a strong upward impulse, breaking 95500 with 102200 levels. Next, the price grew more and then dropped to 90500 points, after which backed up and started to trades inside the triangle pattern. In this pattern, BTC almost rose to its current support level and then started to decline. In a short time, the price fell to the 95500 support level, and even lower, to support line of the triangle, which is coincided with the buyer zone. Then BTC bounced up and rose to the 102200 level, after which made little correction and then continued to move up. Some time later, the price reached the 102200 level again, broke it and now BTC trades inside the support area, very close to the resistance line of the triangle. So, for this case, I think BTC can make a small movement up and then continue to fall to the support line of the triangle pattern, breaking the support level. That's why I set my TP at 98900 points, which coincided with this line. Please share this idea with your friends and click Boost 🚀
#PENGUOpening #MarketNewHype #BinanceAirdropsCATandPENGU #FullMarketBullRun #BTCNewATH
But from previous concept looking at the chart, we can see how the price a few moments ago started to decline and fell to the buyer zone, breaking the support level, where it some time traded. Later it tried to grow, but failed and quickly fell back to the buyer zone, after which made a strong upward impulse, breaking 95500 with 102200 levels. Next, the price grew more and then dropped to 90500 points, after which backed up and started to trades inside the triangle pattern. In this pattern, BTC almost rose to its current support level and then started to decline. In a short time, the price fell to the 95500 support level, and even lower, to support line of the triangle, which is coincided with the buyer zone. Then BTC bounced up and rose to the 102200 level, after which made little correction and then continued to move up. Some time later, the price reached the 102200 level again, broke it and now BTC trades inside the support area, very close to the resistance line of the triangle. So, for this case, I think BTC can make a small movement up and then continue to fall to the support line of the triangle pattern, breaking the support level. That's why I set my TP at 98900 points, which coincided with this line. Please share this idea with your friends and click Boost 🚀
#PENGUOpening #MarketNewHype #BinanceAirdropsCATandPENGU #FullMarketBullRun #BTCNewATH
2
11
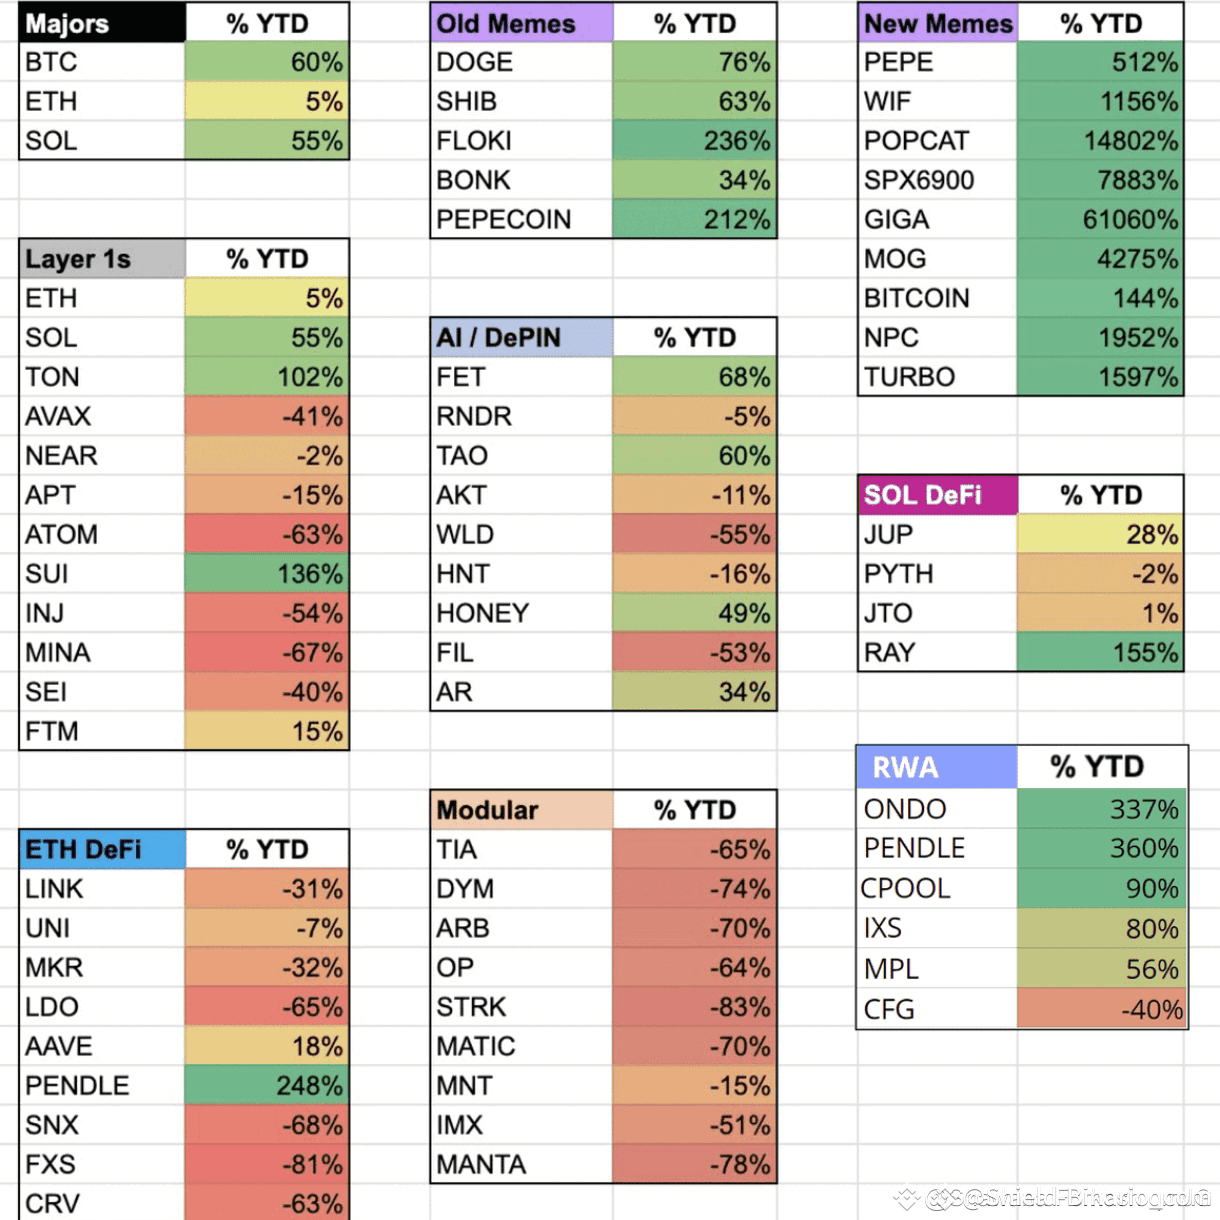
You have to prepare for the sharp correction that is coming, either you sell your entire portfolio if you bought high, or if you have a bear market portfolio in which you made excellent purchases at good prices, leave only the currencies safer and that have more profit, those that can go through a 60% correction without losing all profit, come back next year after the big correction, at that moment buy coins from good projects with good fundamentals and good asymmetry at much lower prices lows and then you can surf the altcoinseason more relaxed (if it actually happens) as we are about to have a third world war assumed with more players and a major global financial crisis is at the door.
Disclaimer: Includes third-party opinions. No financial advice. May include sponsored content.
{spot}(BTCUSDT)
#MarketNewHype #CryptoUsersHit18M #BinanceLaunchpoolVANA #BinanceLaunchpoolVANA $BTC
You have to prepare for the sharp correction that is coming, either you sell your entire portfolio if you bought high, or if you have a bear market portfolio in which you made excellent purchases at good prices, leave only the currencies safer and that have more profit, those that can go through a 60% correction without losing all profit, come back next year after the big correction, at that moment buy coins from good projects with good fundamentals and good asymmetry at much lower prices lows and then you can surf the altcoinseason more relaxed (if it actually happens) as we are about to have a third world war assumed with more players and a major global financial crisis is at the door.
Disclaimer: Includes third-party opinions. No financial advice. May include sponsored content.
#MarketNewHype #CryptoUsersHit18M #BinanceLaunchpoolVANA #BinanceLaunchpoolVANA $BTC
Disclaimer: Includes third-party opinions. No financial advice. May include sponsored content.
#MarketNewHype #CryptoUsersHit18M #BinanceLaunchpoolVANA #BinanceLaunchpoolVANA $BTC
2
2
4.7k
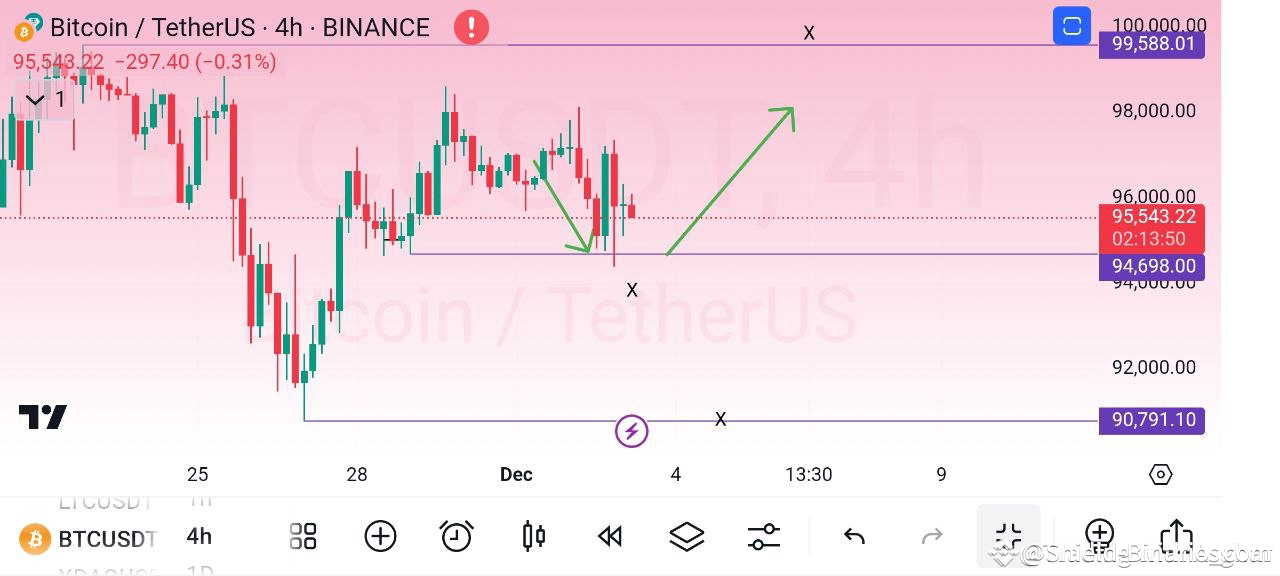
$BTC Update 🚨
Liquidity hunts
94.6k
Must hold here -for upside 99588
if fails to hold this current level the price will raid to 90791$
{spot}(BTCUSDT)
#ETHOnTheRise #XRPTrends #ThanksgivingBTCMoves #BinanceBNSOLPYTH #BitwiseFiles10ETFs
$BTC Update 🚨
Liquidity hunts
94.6k
Must hold here -for upside 99588
if fails to hold this current level the price will raid to 90791$
#ETHOnTheRise #XRPTrends #ThanksgivingBTCMoves #BinanceBNSOLPYTH #BitwiseFiles10ETFs
Liquidity hunts
94.6k
Must hold here -for upside 99588
if fails to hold this current level the price will raid to 90791$
#ETHOnTheRise #XRPTrends #ThanksgivingBTCMoves #BinanceBNSOLPYTH #BitwiseFiles10ETFs
3
10
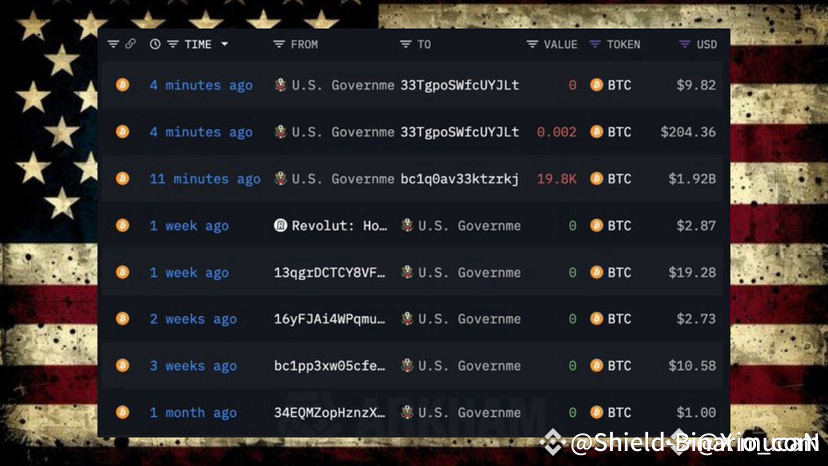
U.S. GOVERNMENT JUST MOVED BILLIONS IN BTC!
The U.S. just moved $1.92B in Bitcoin – no small flex, and the market’s gonna feel it.
You know how this goes – whenever the gov steps in, everyone starts paying attention.
Are they loading up for a future pump, or just cleaning house?
Either way, big moves mean big energy.
Source: Mario Nawfal #MicrosoftBTCInvestmentVote #ETHOnTheRise #XRPReclaimsTop3 #ThanksgivingBTCMoves #AIAndGameFiBoom
U.S. GOVERNMENT JUST MOVED BILLIONS IN BTC!
The U.S. just moved $1.92B in Bitcoin – no small flex, and the market’s gonna feel it.
You know how this goes – whenever the gov steps in, everyone starts paying attention.
Are they loading up for a future pump, or just cleaning house?
Either way, big moves mean big energy.
Source: Mario Nawfal #MicrosoftBTCInvestmentVote #ETHOnTheRise #XRPReclaimsTop3 #ThanksgivingBTCMoves #AIAndGameFiBoom
The U.S. just moved $1.92B in Bitcoin – no small flex, and the market’s gonna feel it.
You know how this goes – whenever the gov steps in, everyone starts paying attention.
Are they loading up for a future pump, or just cleaning house?
Either way, big moves mean big energy.
Source: Mario Nawfal #MicrosoftBTCInvestmentVote #ETHOnTheRise #XRPReclaimsTop3 #ThanksgivingBTCMoves #AIAndGameFiBoom
1
15
{spot}(BTCUSDT)
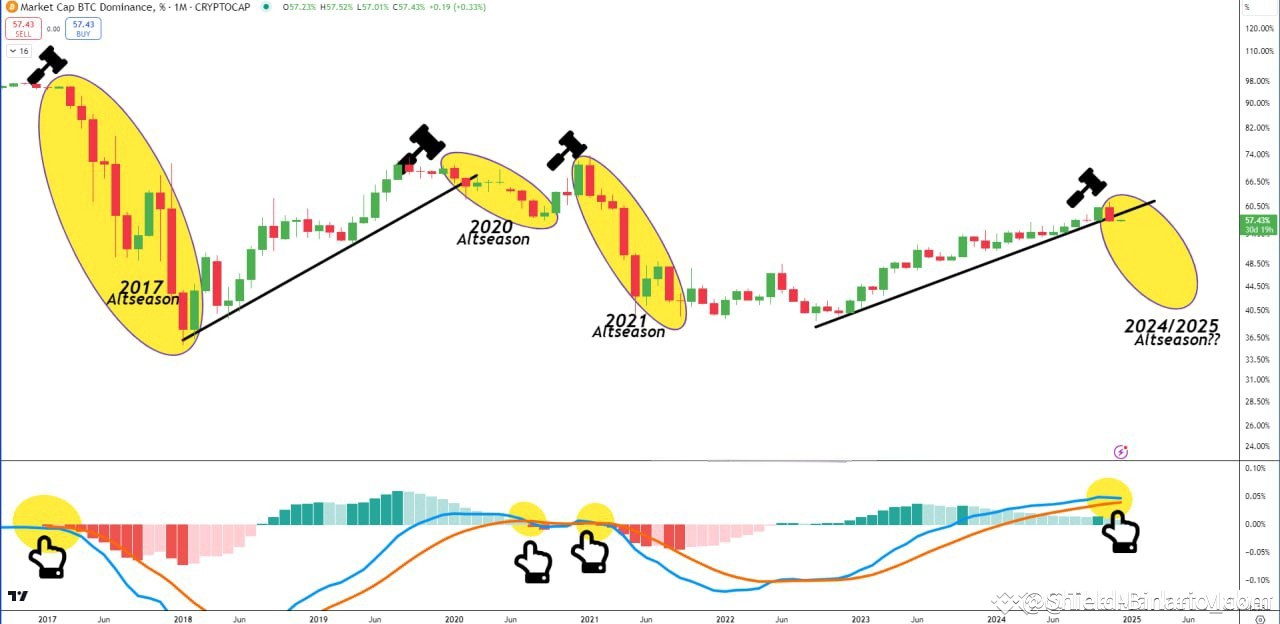
Bitcoin dominance has finally broken below its 2-year trendline on the monthly chart. This could be the beginning of an altcoin season.
The key confirmation to watch for is a bearish MACD cross on the 3-week timeframe.#AIAndGameFiBoom #XRPTrends #ThanksgivingBTCMoves #BinanceBNSOLPYTH #BSCOnTheRise
Bitcoin dominance has finally broken below its 2-year trendline on the monthly chart. This could be the beginning of an altcoin season.
The key confirmation to watch for is a bearish MACD cross on the 3-week timeframe.#AIAndGameFiBoom #XRPTrends #ThanksgivingBTCMoves #BinanceBNSOLPYTH #BSCOnTheRise
The key confirmation to watch for is a bearish MACD cross on the 3-week timeframe.#AIAndGameFiBoom #XRPTrends #ThanksgivingBTCMoves #BinanceBNSOLPYTH #BSCOnTheRise
3
9
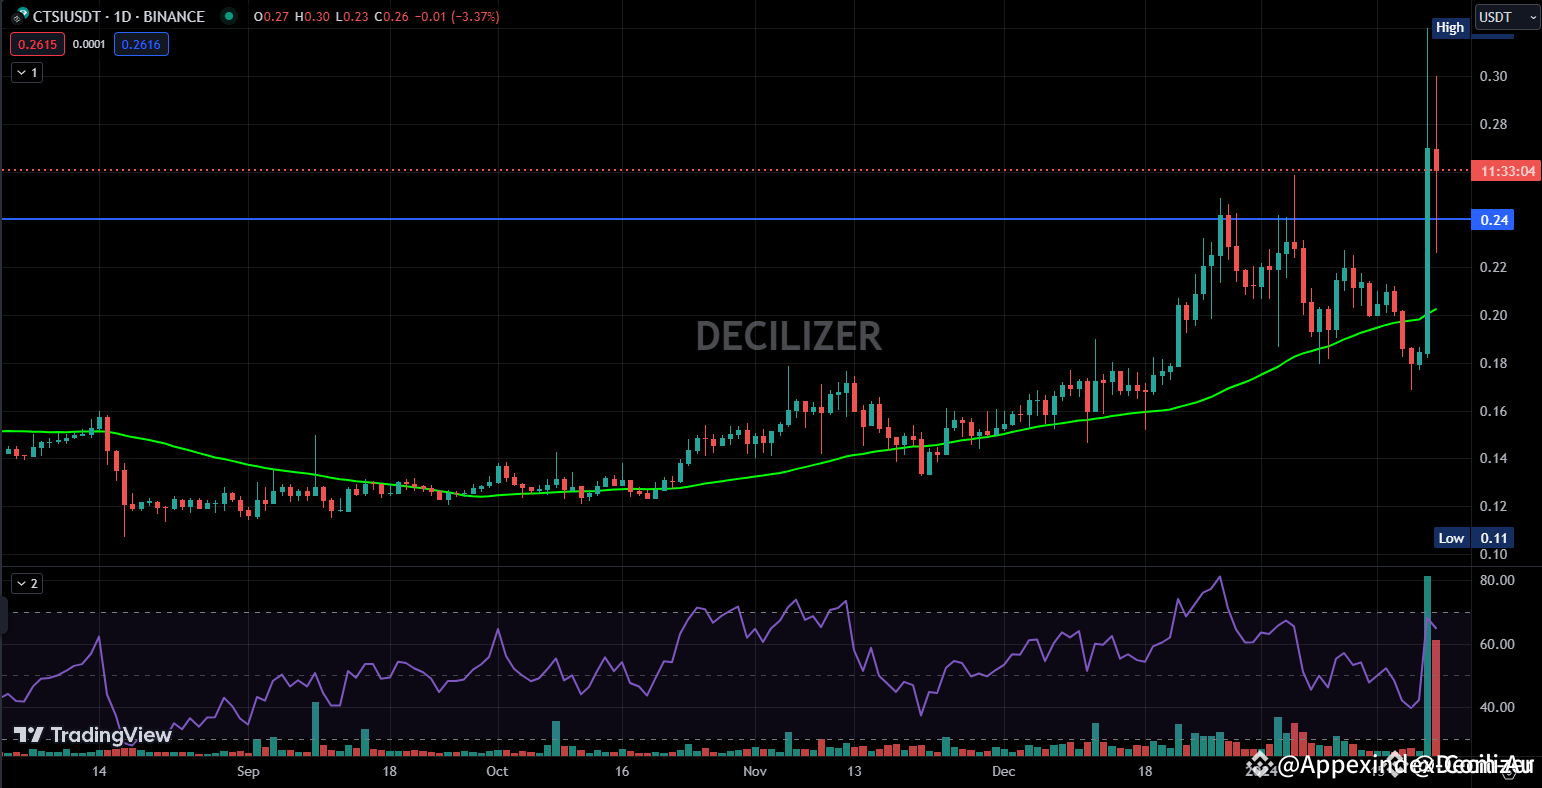
With $0.10 as support, $CTSI targets $0.28, driven by volume growth and $BTC market leadership. This bullish setup remains favorable. Bitcoin dominance offers a holistic perspective on potential market breakouts impacting
{spot}(CTSIUSDT)
’s future trajectory.
With $0.10 as support, $CTSI targets $0.28, driven by volume growth and $BTC market leadership. This bullish setup remains favorable. Bitcoin dominance offers a holistic perspective on potential market breakouts impacting
’s future trajectory.
’s future trajectory.
3
11
Көбірек контент көру үшін кіріңіз
Binance Square платформасында әлемдік криптоқоғамдастыққа қосылыңыз
⚡️ Криптовалюта туралы ең соңғы және пайдалы ақпаратты алыңыз.
💬 Әлемдегі ең ірі криптобиржаның сеніміне ие.
👍 Расталған авторлардың нақты пікірлерін табыңыз.
Электрондық пошта/телефон нөмірі
Трендтегі тақырыптар
BinanceReopensWithdrawalsForMoreAssets
618,804 рет көрілді
2,966 адам талқылап жатыр
Security Incident | Recovery Update #8: Withdrawals for More Assets to Reopen (2026-11-05)
Binance Announcement
·152 лайк
·460.9k рет көрілді
BTCRebounds80K
133,421 рет көрілді
1,282 адам талқылап жатыр
Binance98PercentReplenished
69,400 рет көрілді
893 адам талқылап жатыр