


Peter_Parker0
 «Square расталған» белгісі
Crypto trader|Market sniper Spot & Futures| TA wizard | Risk-first Altcoin gems|Bullish vibes only #CryptoTrading $BTC|Twitter|Cryptocobain032 KITE:659646
Ашық сауда
Жиі сауда жасайтын трейдер
2.6 жыл
740 Жазылым
45.8K+ Жазылушылар
49.0K+ лайк басылған
Жазбалар
Портфолио
Барлығы
Баға ұсыныстары
Видеолар
Тікелей эфир


Bullish — Break above $0.50
81%
Bearish — Drop toward $0.44
13%
Consolidation around $0.48
6%
16 дауыс • Дауыс беру жабық
AI Agents 🤖
61%
Blockchain Technology 🔗
0%
Autonomous Payments 💸
8%
Human-AI Collaboration 🚀
31%
13 дауыс • Дауыс беру жабық

Crypto_Cobain
·
--
The more I look into @Nillion , the more I think its most interesting opportunity is not simply storing sensitive data, but making that data useful without exposing it.
That distinction matters.
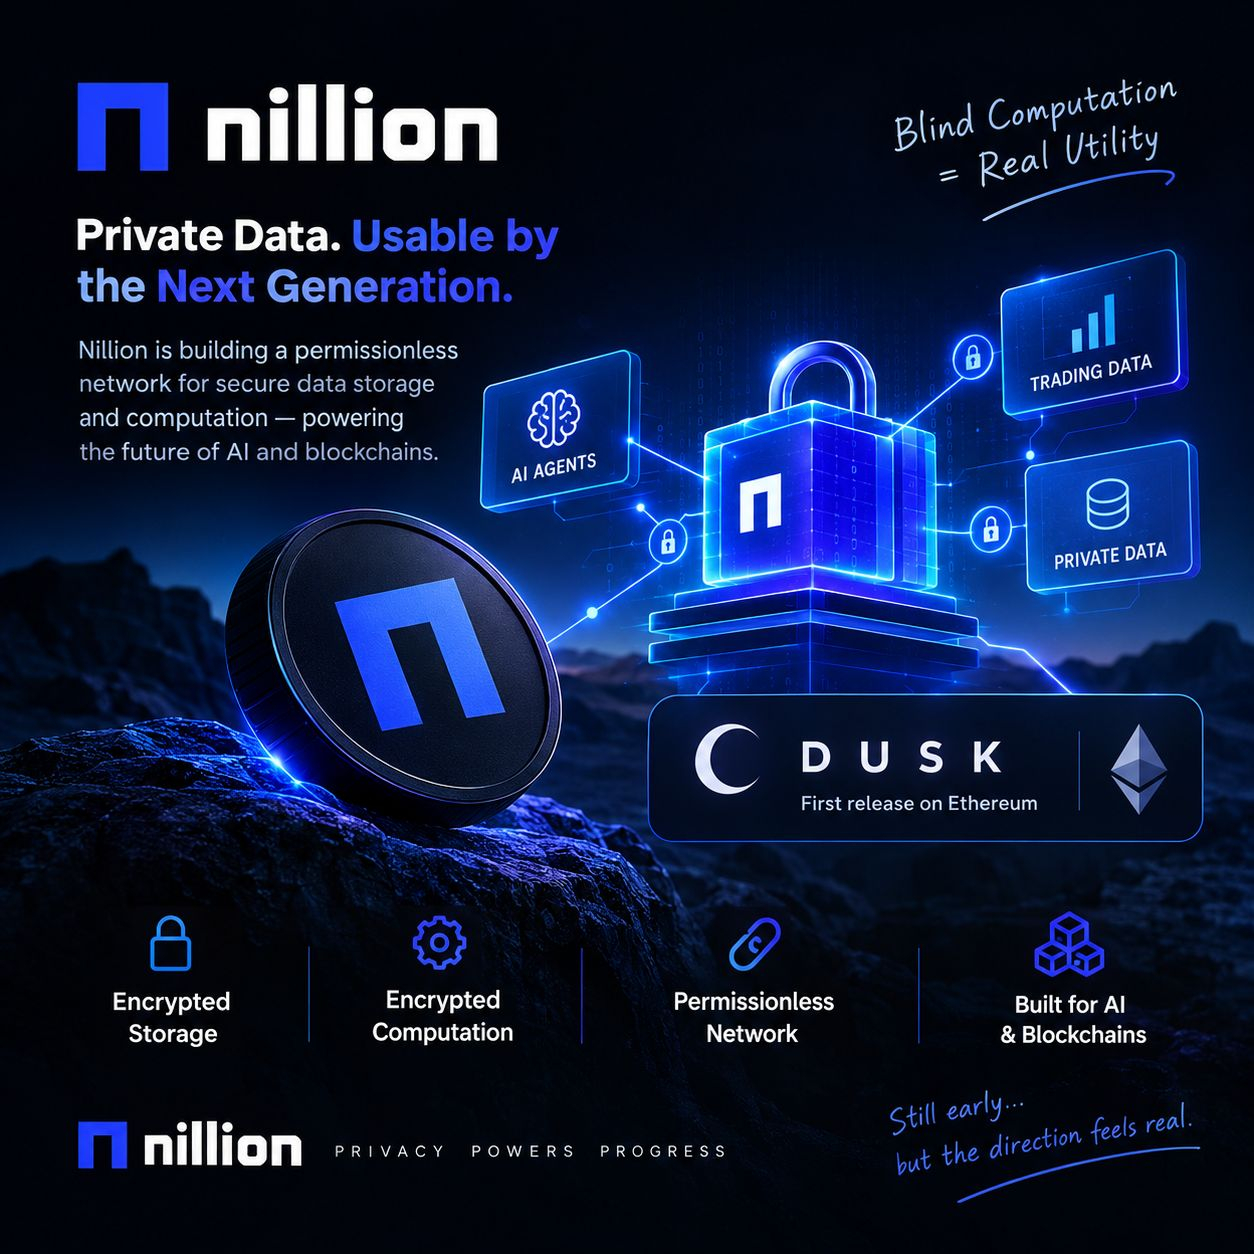
Blockchains are transparent by design, which creates a difficult problem when AI agents, financial applications, or trading systems need to work with private information. Nillion’s approach to blind computation aims to let applications store and process encrypted data without revealing the underlying information. To me, this is a meaningful direction because privacy becomes much more valuable when data can actually be used, rather than just hidden.
What caught my attention even more is the relationship between Nillion’s broader privacy infrastructure and DUSK, its first release on Ethereum. If this becomes a practical way to bring privacy-focused capabilities into existing blockchain ecosystems, it could open doors for applications that cannot comfortably operate with fully exposed data.
But I’m not ready to call it a proven breakthrough yet. Technical capability alone does not guarantee adoption. I still want to see measurable developer activity, real applications using blind computation, evidence of sustained demand, and clear information about how the ecosystem will generate lasting value.
The bigger question is whether Nillion can turn its privacy technology into something developers genuinely need, rather than something that merely sounds impressive.
With DUSK live on Ethereum mainnet and the Nillion 7-era roadmap ahead, I’m watching for concrete evidence of real-world usage, especially which new capabilities developers can actually build and deploy. What developments have other researchers found most convincing so far?
#NIL #nil $NIL @Nillion
That distinction matters.
Blockchains are transparent by design, which creates a difficult problem when AI agents, financial applications, or trading systems need to work with private information. Nillion’s approach to blind computation aims to let applications store and process encrypted data without revealing the underlying information. To me, this is a meaningful direction because privacy becomes much more valuable when data can actually be used, rather than just hidden.
What caught my attention even more is the relationship between Nillion’s broader privacy infrastructure and DUSK, its first release on Ethereum. If this becomes a practical way to bring privacy-focused capabilities into existing blockchain ecosystems, it could open doors for applications that cannot comfortably operate with fully exposed data.
But I’m not ready to call it a proven breakthrough yet. Technical capability alone does not guarantee adoption. I still want to see measurable developer activity, real applications using blind computation, evidence of sustained demand, and clear information about how the ecosystem will generate lasting value.
The bigger question is whether Nillion can turn its privacy technology into something developers genuinely need, rather than something that merely sounds impressive.
With DUSK live on Ethereum mainnet and the Nillion 7-era roadmap ahead, I’m watching for concrete evidence of real-world usage, especially which new capabilities developers can actually build and deploy. What developments have other researchers found most convincing so far?
#NIL #nil $NIL @Nillion
Crypto_Cobain
·
--
The more I look into @Nillion , the more I think its most interesting opportunity is not simply storing sensitive data, but making that data useful without exposing it.
That distinction matters.
Blockchains are transparent by design, which creates a difficult problem when AI agents, financial applications, or trading systems need to work with private information. Nillion’s approach to blind computation aims to let applications store and process encrypted data without revealing the underlying information. To me, this is a meaningful direction because privacy becomes much more valuable when data can actually be used, rather than just hidden.
What caught my attention even more is the relationship between Nillion’s broader privacy infrastructure and DUSK, its first release on Ethereum. If this becomes a practical way to bring privacy-focused capabilities into existing blockchain ecosystems, it could open doors for applications that cannot comfortably operate with fully exposed data.
But I’m not ready to call it a proven breakthrough yet. Technical capability alone does not guarantee adoption. I still want to see measurable developer activity, real applications using blind computation, evidence of sustained demand, and clear information about how the ecosystem will generate lasting value.
The bigger question is whether Nillion can turn its privacy technology into something developers genuinely need, rather than something that merely sounds impressive.
With DUSK live on Ethereum mainnet and the Nillion 7-era roadmap ahead, I’m watching for concrete evidence of real-world usage, especially which new capabilities developers can actually build and deploy. What developments have other researchers found most convincing so far?
#NIL #nil $NIL @Nillion
That distinction matters.
Blockchains are transparent by design, which creates a difficult problem when AI agents, financial applications, or trading systems need to work with private information. Nillion’s approach to blind computation aims to let applications store and process encrypted data without revealing the underlying information. To me, this is a meaningful direction because privacy becomes much more valuable when data can actually be used, rather than just hidden.
What caught my attention even more is the relationship between Nillion’s broader privacy infrastructure and DUSK, its first release on Ethereum. If this becomes a practical way to bring privacy-focused capabilities into existing blockchain ecosystems, it could open doors for applications that cannot comfortably operate with fully exposed data.
But I’m not ready to call it a proven breakthrough yet. Technical capability alone does not guarantee adoption. I still want to see measurable developer activity, real applications using blind computation, evidence of sustained demand, and clear information about how the ecosystem will generate lasting value.
The bigger question is whether Nillion can turn its privacy technology into something developers genuinely need, rather than something that merely sounds impressive.
With DUSK live on Ethereum mainnet and the Nillion 7-era roadmap ahead, I’m watching for concrete evidence of real-world usage, especially which new capabilities developers can actually build and deploy. What developments have other researchers found most convincing so far?
#NIL #nil $NIL @Nillion
Көбірек контент көру үшін кіріңіз