

itsNothing but every thing
42 Жариялаулар

itsNothing but every thing
Хабарлау
Пайдаланушыны блоктау
earn with binance
Ашық сауда
Кездейсоқ трейдер
2.6 жыл
70 Жазылым
38 Жазылушылар
27 лайк басылған
Жазбалар
Портфолио
Барлығы
Баға ұсыныстары
Is the King of Understanding making a move again? This trend is even more resilient than his hairstyle!
Just a moment ago, I was worried $TRUMP would pull back, but instead it reversed with a big bullish candle to slap that worry in the face! 😂
This isn’t a candlestick chart, it’s clearly the King of Understanding’s "approval rating" curve!
Starting at 1.966: Thought it was the bottom, but it was just the starting line.
Rising to 2.096: Thought it was the peak, but it turned out to be a gas station.
Now at 2.060: Taking a little breather, but ready to keep the music playing and the dance going?
Looking at this bullish moving average alignment, it feels like the main force is shouting: "Make Crypto Great Again!" 🇺🇸
This kind of Meme coin is all about the thrill; brothers who were afraid of heights and didn’t jump in earlier, are you now kicking yourselves?
Don’t ask for a target price, just say "Let the bullets fly a little longer#TrendingPredictions #TRUMP $TRUMP
{spot}(TRUMPUSDT)
Is the King of Understanding making a move again? This trend is even more resilient than his hairstyle!
Just a moment ago, I was worried $TRUMP would pull back, but instead it reversed with a big bullish candle to slap that worry in the face! 😂
This isn’t a candlestick chart, it’s clearly the King of Understanding’s "approval rating" curve!
Starting at 1.966: Thought it was the bottom, but it was just the starting line.
Rising to 2.096: Thought it was the peak, but it turned out to be a gas station.
Now at 2.060: Taking a little breather, but ready to keep the music playing and the dance going?
Looking at this bullish moving average alignment, it feels like the main force is shouting: "Make Crypto Great Again!" 🇺🇸
This kind of Meme coin is all about the thrill; brothers who were afraid of heights and didn’t jump in earlier, are you now kicking yourselves?
Don’t ask for a target price, just say "Let the bullets fly a little longer#TrendingPredictions #TRUMP $TRUMP
Just a moment ago, I was worried $TRUMP would pull back, but instead it reversed with a big bullish candle to slap that worry in the face! 😂
This isn’t a candlestick chart, it’s clearly the King of Understanding’s "approval rating" curve!
Starting at 1.966: Thought it was the bottom, but it was just the starting line.
Rising to 2.096: Thought it was the peak, but it turned out to be a gas station.
Now at 2.060: Taking a little breather, but ready to keep the music playing and the dance going?
Looking at this bullish moving average alignment, it feels like the main force is shouting: "Make Crypto Great Again!" 🇺🇸
This kind of Meme coin is all about the thrill; brothers who were afraid of heights and didn’t jump in earlier, are you now kicking yourselves?
Don’t ask for a target price, just say "Let the bullets fly a little longer#TrendingPredictions #TRUMP $TRUMP
318
{future}(BTCUSDT)
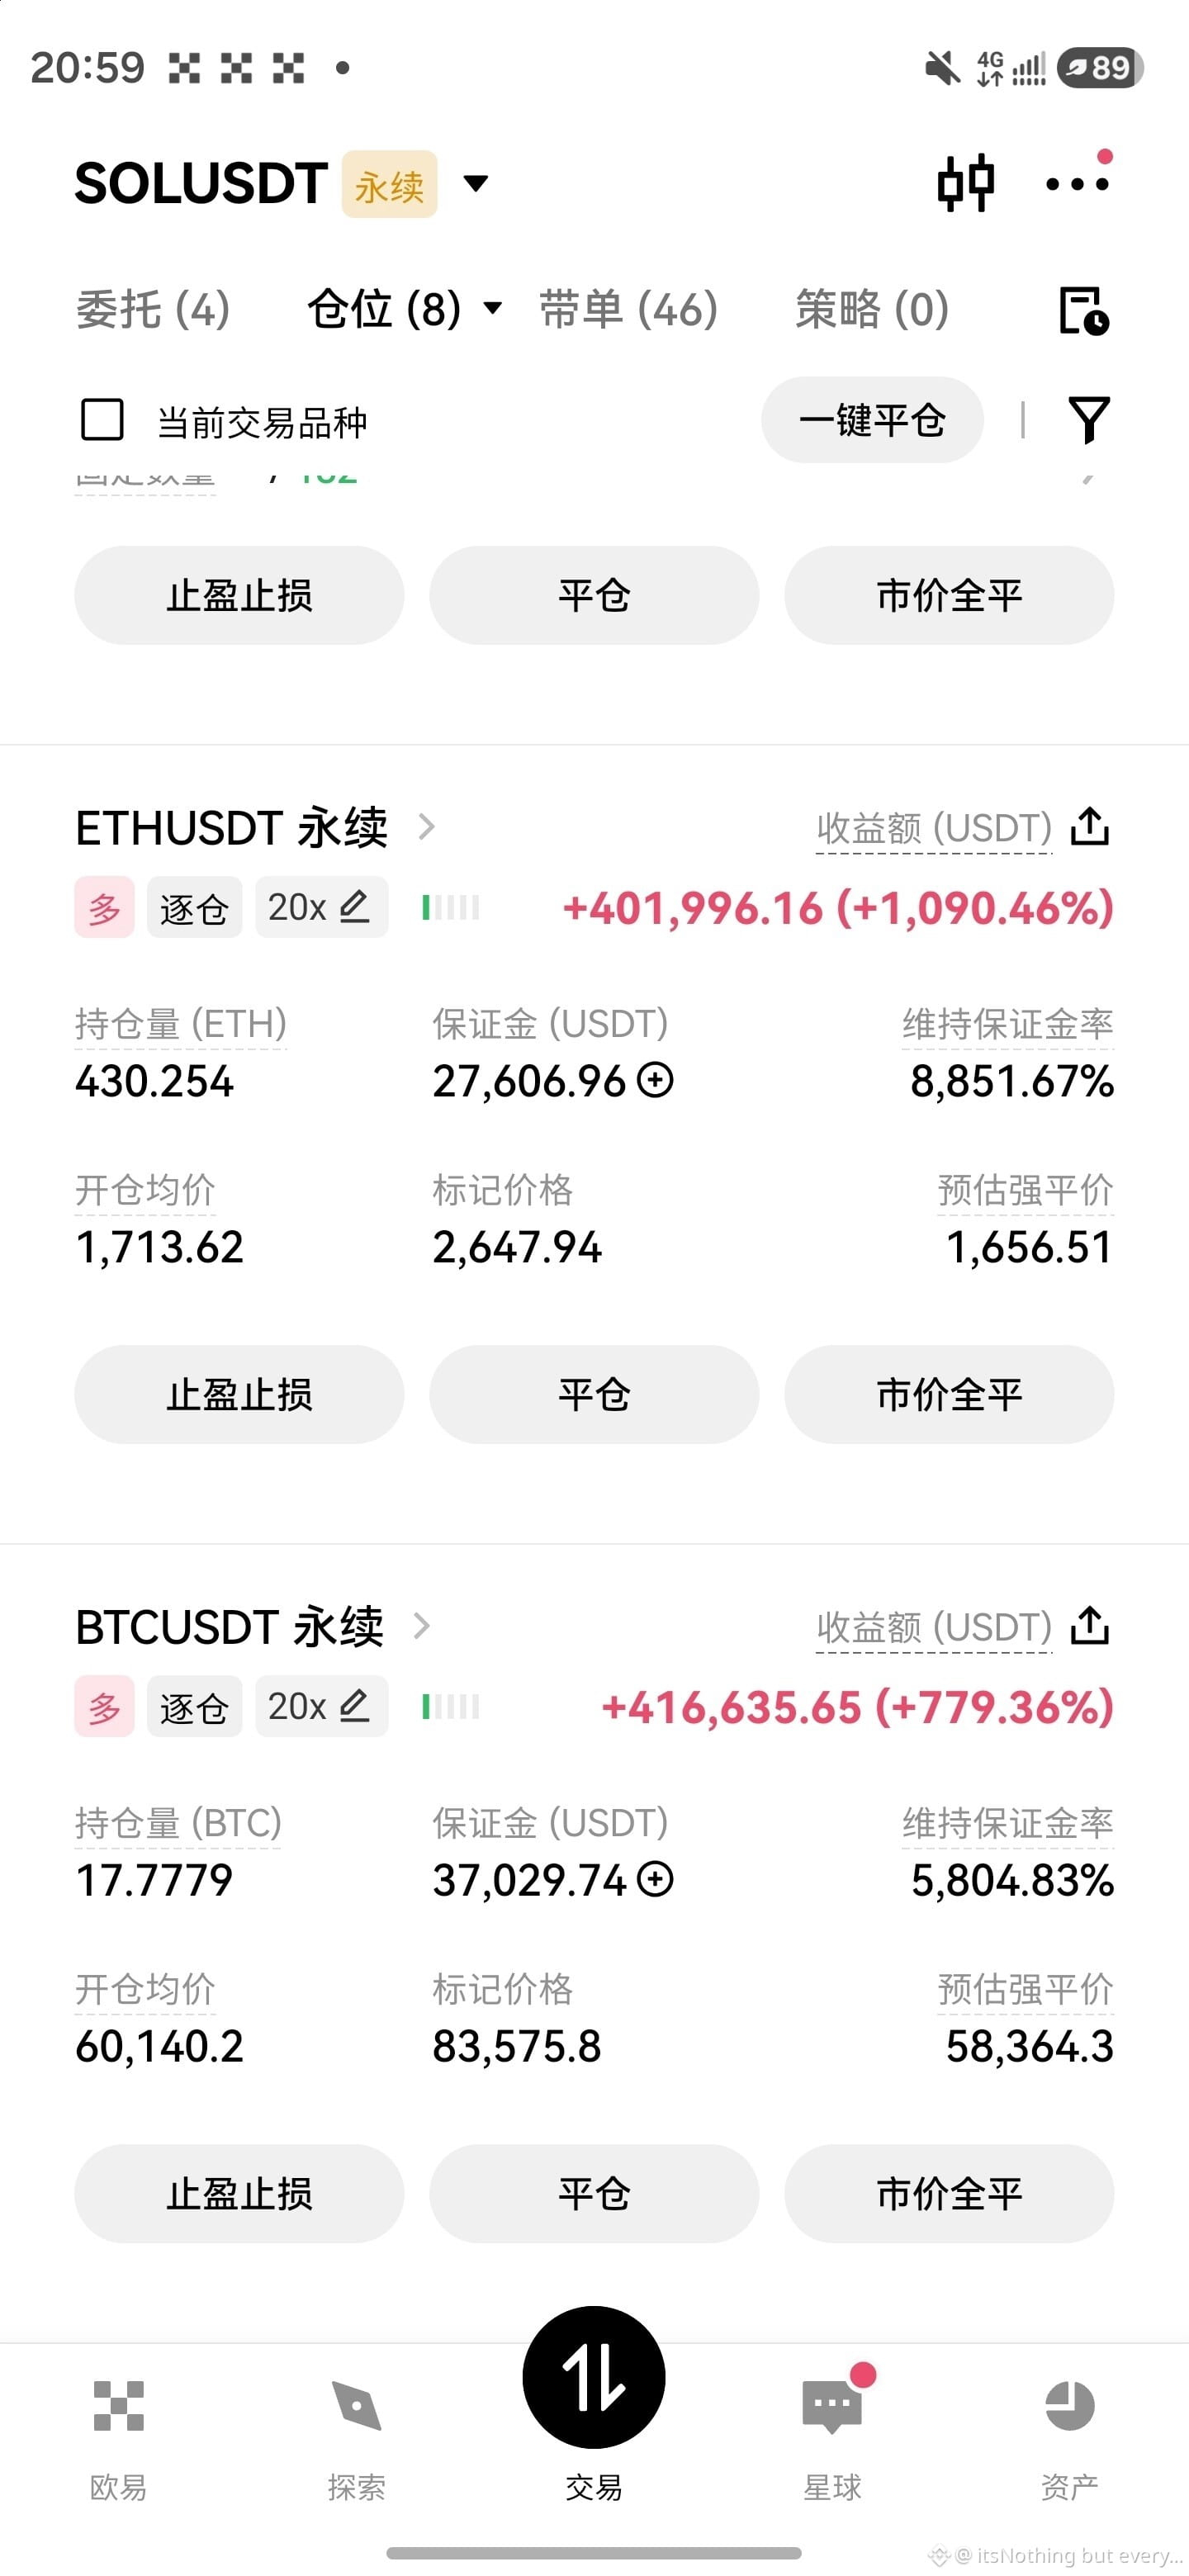
#BitcoinFallsBelow$83,000 Someone asked me what to do if Bitcoin drops to 60000 and Ethereum drops to 1700 on these two trades? I said this is a good thing because it means you can add to your position $BTC $ETH
#BitcoinFallsBelow$83,000 Someone asked me what to do if Bitcoin drops to 60000 and Ethereum drops to 1700 on these two trades? I said this is a good thing because it means you can add to your position $BTC $ETH
132
The second truth: That big bullish candlestick wiped out at least half of the short positions.
But just having a “story” can’t explain such a big rise.
Look up the data from September 1st.
ARB surged 30% in one day, futures trading volume was $8.14 million, a 700% spike. Open interest surged 62% to 157 million. Liquidation data: $3.15 million worth of positions were forcibly closed, of which $2.2 million were shorts.
To translate: the shorts got crushed. Their forced buy-ins were the main fuel pushing the price up.
Why were there so many shorts?
Because ARB had been falling for two years. From 2.4 down to 0.07, a 97% drop. Anyone shorting ARB above 0.10 had been making money for the past few months. Shorts developed muscle memory: ARB is trash, if it rises, short it. $ETH $BTC $ARB
{spot}(ETHUSDT)
The second truth: That big bullish candlestick wiped out at least half of the short positions.
But just having a “story” can’t explain such a big rise.
Look up the data from September 1st.
ARB surged 30% in one day, futures trading volume was $8.14 million, a 700% spike. Open interest surged 62% to 157 million. Liquidation data: $3.15 million worth of positions were forcibly closed, of which $2.2 million were shorts.
To translate: the shorts got crushed. Their forced buy-ins were the main fuel pushing the price up.
Why were there so many shorts?
Because ARB had been falling for two years. From 2.4 down to 0.07, a 97% drop. Anyone shorting ARB above 0.10 had been making money for the past few months. Shorts developed muscle memory: ARB is trash, if it rises, short it. $ETH $BTC $ARB
But just having a “story” can’t explain such a big rise.
Look up the data from September 1st.
ARB surged 30% in one day, futures trading volume was $8.14 million, a 700% spike. Open interest surged 62% to 157 million. Liquidation data: $3.15 million worth of positions were forcibly closed, of which $2.2 million were shorts.
To translate: the shorts got crushed. Their forced buy-ins were the main fuel pushing the price up.
Why were there so many shorts?
Because ARB had been falling for two years. From 2.4 down to 0.07, a 97% drop. Anyone shorting ARB above 0.10 had been making money for the past few months. Shorts developed muscle memory: ARB is trash, if it rises, short it. $ETH $BTC $ARB
1
236
·
--
Жоғары (өспелі)
#dusk $DUSK @Dusk_Foundation 📉 Conservative / Low-Growth Forecasts
CoinCodex: Forecasts DUSK could trade roughly between $0.03 and $0.063 in 2026, with an average around ~$0.046. �
CoinCodex
DigitalCoinPrice: Projects a range around $0.16–$0.19 average by end of 2026. �
DigitalCoinPrice
CoinDataFlow: Suggests likely range between $0.017 and $0.052 in 2026. �
CoinDataFlow
📊 Moderate Growth Scenarios
DigitalCoinPrice (alternate recent estimate): Another forecast from DigitalCoinPrice shows for 2026: $0.0704–$0.0916 as a possible range. �
DigitalCoinPrice
Coin Arbitrage Bot: Forecasted DUSK trading roughly between $0.04 and $0.105 over 2026, averaging around $0.07–$0.09. �
coinarbitragebot.com
#dusk $DUSK @Dusk 📉 Conservative / Low-Growth Forecasts
CoinCodex: Forecasts DUSK could trade roughly between $0.03 and $0.063 in 2026, with an average around ~$0.046. �
CoinCodex
DigitalCoinPrice: Projects a range around $0.16–$0.19 average by end of 2026. �
DigitalCoinPrice
CoinDataFlow: Suggests likely range between $0.017 and $0.052 in 2026. �
CoinDataFlow
📊 Moderate Growth Scenarios
DigitalCoinPrice (alternate recent estimate): Another forecast from DigitalCoinPrice shows for 2026: $0.0704–$0.0916 as a possible range. �
DigitalCoinPrice
Coin Arbitrage Bot: Forecasted DUSK trading roughly between $0.04 and $0.105 over 2026, averaging around $0.07–$0.09. �
coinarbitragebot.com
CoinCodex: Forecasts DUSK could trade roughly between $0.03 and $0.063 in 2026, with an average around ~$0.046. �
CoinCodex
DigitalCoinPrice: Projects a range around $0.16–$0.19 average by end of 2026. �
DigitalCoinPrice
CoinDataFlow: Suggests likely range between $0.017 and $0.052 in 2026. �
CoinDataFlow
📊 Moderate Growth Scenarios
DigitalCoinPrice (alternate recent estimate): Another forecast from DigitalCoinPrice shows for 2026: $0.0704–$0.0916 as a possible range. �
DigitalCoinPrice
Coin Arbitrage Bot: Forecasted DUSK trading roughly between $0.04 and $0.105 over 2026, averaging around $0.07–$0.09. �
coinarbitragebot.com
#dusk $DUSK @Dusk_Foundation 📉 Conservative / Low-Growth Forecasts
CoinCodex: Forecasts DUSK could trade roughly between $0.03 and $0.063 in 2026, with an average around ~$0.046. �
CoinCodex
DigitalCoinPrice: Projects a range around $0.16–$0.19 average by end of 2026. �
DigitalCoinPrice
CoinDataFlow: Suggests likely range between $0.017 and $0.052 in 2026. �
CoinDataFlow
📊 Moderate Growth Scenarios
DigitalCoinPrice (alternate recent estimate): Another forecast from DigitalCoinPrice shows for 2026: $0.0704–$0.0916 as a possible range. �
DigitalCoinPrice
Coin Arbitrage Bot: Forecasted DUSK trading roughly between $0.04 and $0.105 over 2026, averaging around $0.07–$0.09. �
coinarbitragebot.com
#dusk $DUSK @Dusk 📉 Conservative / Low-Growth Forecasts
CoinCodex: Forecasts DUSK could trade roughly between $0.03 and $0.063 in 2026, with an average around ~$0.046. �
CoinCodex
DigitalCoinPrice: Projects a range around $0.16–$0.19 average by end of 2026. �
DigitalCoinPrice
CoinDataFlow: Suggests likely range between $0.017 and $0.052 in 2026. �
CoinDataFlow
📊 Moderate Growth Scenarios
DigitalCoinPrice (alternate recent estimate): Another forecast from DigitalCoinPrice shows for 2026: $0.0704–$0.0916 as a possible range. �
DigitalCoinPrice
Coin Arbitrage Bot: Forecasted DUSK trading roughly between $0.04 and $0.105 over 2026, averaging around $0.07–$0.09. �
coinarbitragebot.com
CoinCodex: Forecasts DUSK could trade roughly between $0.03 and $0.063 in 2026, with an average around ~$0.046. �
CoinCodex
DigitalCoinPrice: Projects a range around $0.16–$0.19 average by end of 2026. �
DigitalCoinPrice
CoinDataFlow: Suggests likely range between $0.017 and $0.052 in 2026. �
CoinDataFlow
📊 Moderate Growth Scenarios
DigitalCoinPrice (alternate recent estimate): Another forecast from DigitalCoinPrice shows for 2026: $0.0704–$0.0916 as a possible range. �
DigitalCoinPrice
Coin Arbitrage Bot: Forecasted DUSK trading roughly between $0.04 and $0.105 over 2026, averaging around $0.07–$0.09. �
coinarbitragebot.com
1
·
--
Жоғары (өспелі)
#dusk $DUSK 📉 Conservative / Low-Growth Forecasts
CoinCodex: Forecasts DUSK could trade roughly between $0.03 and $0.063 in 2026, with an average around ~$0.046. �
CoinCodex
DigitalCoinPrice: Projects a range around $0.16–$0.19 average by end of 2026. �
DigitalCoinPrice
CoinDataFlow: Suggests likely range between $0.017 and $0.052 in 2026. �
CoinDataFlow
📊 Moderate Growth Scenarios
DigitalCoinPrice (alternate recent estimate): Another forecast from DigitalCoinPrice shows for 2026: $0.0704–$0.0916 as a possible range. �
DigitalCoinPrice
Coin Arbitrage Bot: Forecasted DUSK trading roughly between $0.04 and $0.105 over 2026, averaging around $0.07–$0.09. �
coinarbitragebot.com
#dusk $DUSK 📉 Conservative / Low-Growth Forecasts
CoinCodex: Forecasts DUSK could trade roughly between $0.03 and $0.063 in 2026, with an average around ~$0.046. �
CoinCodex
DigitalCoinPrice: Projects a range around $0.16–$0.19 average by end of 2026. �
DigitalCoinPrice
CoinDataFlow: Suggests likely range between $0.017 and $0.052 in 2026. �
CoinDataFlow
📊 Moderate Growth Scenarios
DigitalCoinPrice (alternate recent estimate): Another forecast from DigitalCoinPrice shows for 2026: $0.0704–$0.0916 as a possible range. �
DigitalCoinPrice
Coin Arbitrage Bot: Forecasted DUSK trading roughly between $0.04 and $0.105 over 2026, averaging around $0.07–$0.09. �
coinarbitragebot.com
CoinCodex: Forecasts DUSK could trade roughly between $0.03 and $0.063 in 2026, with an average around ~$0.046. �
CoinCodex
DigitalCoinPrice: Projects a range around $0.16–$0.19 average by end of 2026. �
DigitalCoinPrice
CoinDataFlow: Suggests likely range between $0.017 and $0.052 in 2026. �
CoinDataFlow
📊 Moderate Growth Scenarios
DigitalCoinPrice (alternate recent estimate): Another forecast from DigitalCoinPrice shows for 2026: $0.0704–$0.0916 as a possible range. �
DigitalCoinPrice
Coin Arbitrage Bot: Forecasted DUSK trading roughly between $0.04 and $0.105 over 2026, averaging around $0.07–$0.09. �
coinarbitragebot.com
12
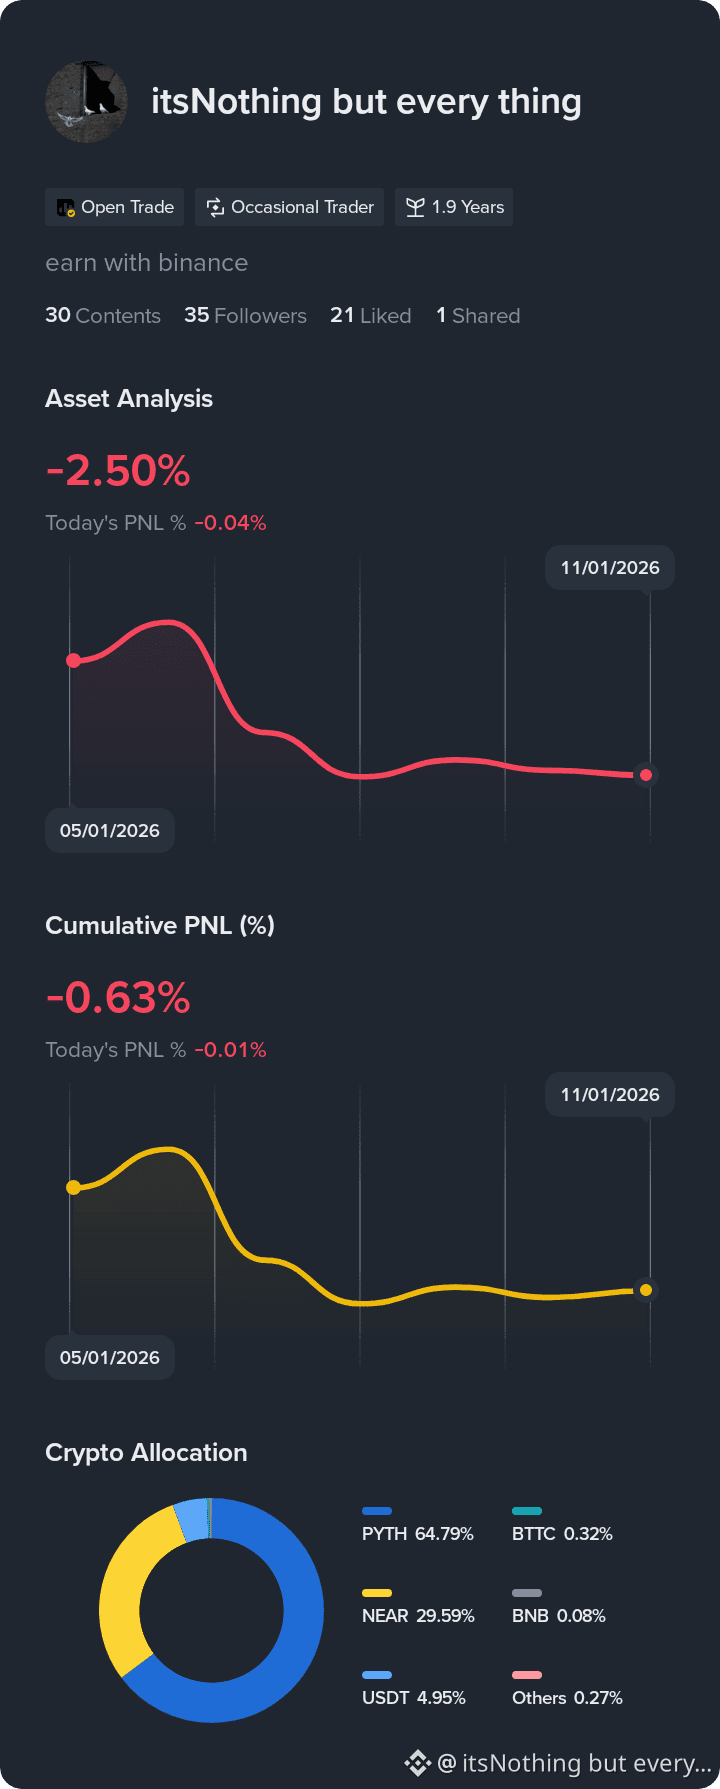
See my returns and portfolio breakdown. Follow for investment tips
See my returns and portfolio breakdown. Follow for investment tips
1
2026 forecost Sol2026 Forecast#BinanceHODLerBREV #BTCVSGOLD #solana
Bullish projections: Some models estimate SOL could rise to $300+ by 2026 in a strong crypto market. �
coinpriceforecast.com
More conservative models: Others forecast a range closer to $148–$160 average in 2026. �
DigitalCoinPrice
Extreme bull case (long-term fundamental): If institutional adoption and network growth accelerate strongly, some analysts see a much higher path (though less likely). 📌 Summary — Solana Price Outlook
Time Frame
Possible Range (USD)
Notes
2026
~$150–$300+
Depends on market strength
2027–2028
~$180–$400+
Bullish adoption case higher
2030
~$250–$900+
Strong growth scenario
Longer term
Potential $1,000+
Very optimistic scenario#solana
{future}(SOLUSDT)
2026 forecost Sol
2026 Forecast#BinanceHODLerBREV #BTCVSGOLD #solana
Bullish projections: Some models estimate SOL could rise to $300+ by 2026 in a strong crypto market. �
coinpriceforecast.com
More conservative models: Others forecast a range closer to $148–$160 average in 2026. �
DigitalCoinPrice
Extreme bull case (long-term fundamental): If institutional adoption and network growth accelerate strongly, some analysts see a much higher path (though less likely). 📌 Summary — Solana Price Outlook
Time Frame
Possible Range (USD)
Notes
2026
~$150–$300+
Depends on market strength
2027–2028
~$180–$400+
Bullish adoption case higher
2030
~$250–$900+
Strong growth scenario
Longer term
Potential $1,000+
Very optimistic scenario#solana
Bullish projections: Some models estimate SOL could rise to $300+ by 2026 in a strong crypto market. �
coinpriceforecast.com
More conservative models: Others forecast a range closer to $148–$160 average in 2026. �
DigitalCoinPrice
Extreme bull case (long-term fundamental): If institutional adoption and network growth accelerate strongly, some analysts see a much higher path (though less likely). 📌 Summary — Solana Price Outlook
Time Frame
Possible Range (USD)
Notes
2026
~$150–$300+
Depends on market strength
2027–2028
~$180–$400+
Bullish adoption case higher
2030
~$250–$900+
Strong growth scenario
Longer term
Potential $1,000+
Very optimistic scenario#solana
3
2
115
666
666

crypto大山
·
--
过去一年,AI + 区块链的热度没断过,但真能落地、有技术含量的项目,屈指可数。
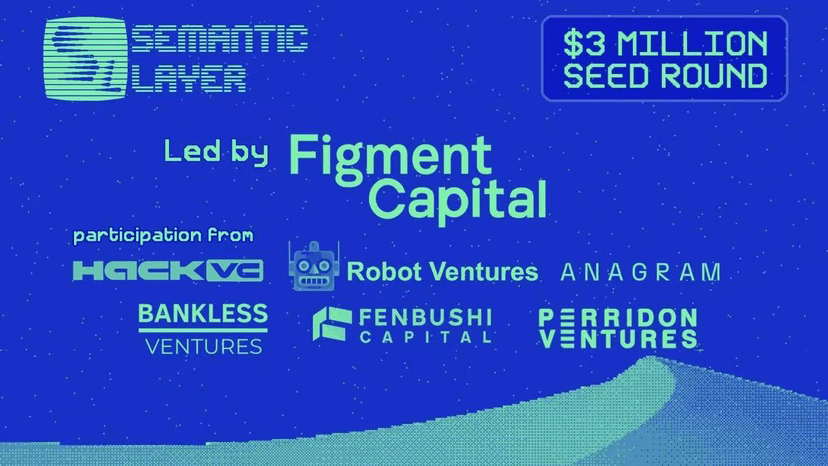
Semantic Layer 就是那种看起来“安静”,但底层逻辑已经走在前面的项目。
他们在重建一个新层级——
让智能体(Agents)能像人一样行动:能支付、能执行、还能赚取收益。
整个系统的核心,是一个叫 $42 的代币。
它不是单纯的币,而是网络的“动力源”。
节点要质押 $42 才能运作,AI 与应用用 $42 支付算力与执行费用
它还是代理之间订单流的结算介质,也是网络治理的投票凭证。
所以在 Semantic Layer 的世界里,AI是经济系统的一部分。
所有这些,都基于 x402 协议 ——
一个让机器也能像人一样完成支付、验证、结算的标准(参考 HTTP 402)。
想看更详细的底层逻辑,这篇可以看看:
👉 https://www.semanticlayer.io/blog/15
Semantic Layer 就是那种看起来“安静”,但底层逻辑已经走在前面的项目。
他们在重建一个新层级——
让智能体(Agents)能像人一样行动:能支付、能执行、还能赚取收益。
整个系统的核心,是一个叫 $42 的代币。
它不是单纯的币,而是网络的“动力源”。
节点要质押 $42 才能运作,AI 与应用用 $42 支付算力与执行费用
它还是代理之间订单流的结算介质,也是网络治理的投票凭证。
所以在 Semantic Layer 的世界里,AI是经济系统的一部分。
所有这些,都基于 x402 协议 ——
一个让机器也能像人一样完成支付、验证、结算的标准(参考 HTTP 402)。
想看更详细的底层逻辑,这篇可以看看:
👉 https://www.semanticlayer.io/blog/15

commonusdt #commonusdt
{future}(COMMONUSDT)
Here are some thoughts (not financial advice) on the token COMMON (the pair “COMMON / USDT”) — noting that this is a high-risk, very volatile crypto asset, and much of the data is still limited.
---
✅ What we do know
COMMON is set to be listed on the exchange Binance (via its “Alpha” platform) on October 27, 2025, and that the perpetual contract COMMON/USDT with up to 50× leverage will launch then.
Also, exchange KuCoin will list the COMMONUSDT perpetual contract on October 27 at 13:05 UTC with up to 50× leverage.
Similarly, exchange BingX announced they will open COMMONUSDT for both standard futures and perpetual futures starting Oct 27.
This means liquidity and trading access are being established — which can be a catalyst for price movement (both up and down).
---
⚠️ Risks & unknowns
Launches with high leverage (50×) often lead to large price swings and heavy liquidations. As KuCoin warns: “Trading of futures is a high-risk activity” with potential for large losses.
As of now I found no strong data on COMMON’s fundamentals: tokenomics, use case, adoption, team, roadmap etc (at least not in the sources I checked). Without that, it’s harder to argue for long-term value beyond speculative/trading interest.
When a token is newly listed on major exchanges with futures contracts, there’s sometimes a “pump + dump” behavior. Given the leverage and hype, the downside risk is substantial.
---
📊 My prediction (hypothesis)
Here’s how I see potential scenarios playing out for COMMON/USDT:
Short term (next few days/weeks):
With the listing announcement, there could be an initial surge in price due to hype, new traders entering, and the leverage futures opening. If many go long, it could spike; but if many get liquidated, you might see sharp downward corrections.
Possible outcome: Price rises maybe 50-100% (or more) from current baseline (if momentum is strong) but equally it could drop sharply by 30-50% if sentiment reverses.
Medium term (1-3 months):
If COMMON can show actual usage, growing ecosystem, exchange-flow (volume) and possibly partnerships, it has a chance to stabilise at a higher level than pre-listing. If not, it may drift down as initial hype fades.
Hypothesis: If fundamentals prove decent → it might hold a “new baseline” at say 20-40% above current level. If fundamentals weak → it might fall back to or below initial listing price.
Long term (6-12 months and beyond):
A lot depends on deeper factors: What is COMMON’s utility? Will projects build on it? Is there locked-in tokenomics, scarcity, real demand? If yes → it could appreciate meaningfully; if no → it might end up being a speculative one-hit token and fade.
Prediction: Best case: 2x-5x from listing price over 12 months if all goes well. Worst case: majority loss for those who bought at the high, maybe 70-90% drawdown if sentiment fails.
---
🔍 My current “fair assessment”
If I were to pick a likely scenario (given limited info): I’d expect an initial spike, maybe 2-3x above baseline shortly after listing, followed by a volatile period, and then either consolidation somewhere 1.2-1.8x above baseline OR a slide back toward baseline or below depending on fundamental follow-through.
From a risk perspective: If you buy now, only enter with money you can afford to lose. The “leveraged futures” angle suggests many participants are playing for a short-term trade, which adds risk.
It would be wise to wait and see some volume / user adoption / on-chain metrics emerge before committing large amounts.
---
If you like, I can check on-chain data, token metrics, supply & distribution for COMMON and we can try to estimate a more specific price target range (with assumptions) for you. Would that be helpful?
commonusdt
#commonusdt
Here are some thoughts (not financial advice) on the token COMMON (the pair “COMMON / USDT”) — noting that this is a high-risk, very volatile crypto asset, and much of the data is still limited.
---
✅ What we do know
COMMON is set to be listed on the exchange Binance (via its “Alpha” platform) on October 27, 2025, and that the perpetual contract COMMON/USDT with up to 50× leverage will launch then.
Also, exchange KuCoin will list the COMMONUSDT perpetual contract on October 27 at 13:05 UTC with up to 50× leverage.
Similarly, exchange BingX announced they will open COMMONUSDT for both standard futures and perpetual futures starting Oct 27.
This means liquidity and trading access are being established — which can be a catalyst for price movement (both up and down).
---
⚠️ Risks & unknowns
Launches with high leverage (50×) often lead to large price swings and heavy liquidations. As KuCoin warns: “Trading of futures is a high-risk activity” with potential for large losses.
As of now I found no strong data on COMMON’s fundamentals: tokenomics, use case, adoption, team, roadmap etc (at least not in the sources I checked). Without that, it’s harder to argue for long-term value beyond speculative/trading interest.
When a token is newly listed on major exchanges with futures contracts, there’s sometimes a “pump + dump” behavior. Given the leverage and hype, the downside risk is substantial.
---
📊 My prediction (hypothesis)
Here’s how I see potential scenarios playing out for COMMON/USDT:
Short term (next few days/weeks):
With the listing announcement, there could be an initial surge in price due to hype, new traders entering, and the leverage futures opening. If many go long, it could spike; but if many get liquidated, you might see sharp downward corrections.
Possible outcome: Price rises maybe 50-100% (or more) from current baseline (if momentum is strong) but equally it could drop sharply by 30-50% if sentiment reverses.
Medium term (1-3 months):
If COMMON can show actual usage, growing ecosystem, exchange-flow (volume) and possibly partnerships, it has a chance to stabilise at a higher level than pre-listing. If not, it may drift down as initial hype fades.
Hypothesis: If fundamentals prove decent → it might hold a “new baseline” at say 20-40% above current level. If fundamentals weak → it might fall back to or below initial listing price.
Long term (6-12 months and beyond):
A lot depends on deeper factors: What is COMMON’s utility? Will projects build on it? Is there locked-in tokenomics, scarcity, real demand? If yes → it could appreciate meaningfully; if no → it might end up being a speculative one-hit token and fade.
Prediction: Best case: 2x-5x from listing price over 12 months if all goes well. Worst case: majority loss for those who bought at the high, maybe 70-90% drawdown if sentiment fails.
---
🔍 My current “fair assessment”
If I were to pick a likely scenario (given limited info): I’d expect an initial spike, maybe 2-3x above baseline shortly after listing, followed by a volatile period, and then either consolidation somewhere 1.2-1.8x above baseline OR a slide back toward baseline or below depending on fundamental follow-through.
From a risk perspective: If you buy now, only enter with money you can afford to lose. The “leveraged futures” angle suggests many participants are playing for a short-term trade, which adds risk.
It would be wise to wait and see some volume / user adoption / on-chain metrics emerge before committing large amounts.
---
If you like, I can check on-chain data, token metrics, supply & distribution for COMMON and we can try to estimate a more specific price target range (with assumptions) for you. Would that be helpful?
Here are some thoughts (not financial advice) on the token COMMON (the pair “COMMON / USDT”) — noting that this is a high-risk, very volatile crypto asset, and much of the data is still limited.
---
✅ What we do know
COMMON is set to be listed on the exchange Binance (via its “Alpha” platform) on October 27, 2025, and that the perpetual contract COMMON/USDT with up to 50× leverage will launch then.
Also, exchange KuCoin will list the COMMONUSDT perpetual contract on October 27 at 13:05 UTC with up to 50× leverage.
Similarly, exchange BingX announced they will open COMMONUSDT for both standard futures and perpetual futures starting Oct 27.
This means liquidity and trading access are being established — which can be a catalyst for price movement (both up and down).
---
⚠️ Risks & unknowns
Launches with high leverage (50×) often lead to large price swings and heavy liquidations. As KuCoin warns: “Trading of futures is a high-risk activity” with potential for large losses.
As of now I found no strong data on COMMON’s fundamentals: tokenomics, use case, adoption, team, roadmap etc (at least not in the sources I checked). Without that, it’s harder to argue for long-term value beyond speculative/trading interest.
When a token is newly listed on major exchanges with futures contracts, there’s sometimes a “pump + dump” behavior. Given the leverage and hype, the downside risk is substantial.
---
📊 My prediction (hypothesis)
Here’s how I see potential scenarios playing out for COMMON/USDT:
Short term (next few days/weeks):
With the listing announcement, there could be an initial surge in price due to hype, new traders entering, and the leverage futures opening. If many go long, it could spike; but if many get liquidated, you might see sharp downward corrections.
Possible outcome: Price rises maybe 50-100% (or more) from current baseline (if momentum is strong) but equally it could drop sharply by 30-50% if sentiment reverses.
Medium term (1-3 months):
If COMMON can show actual usage, growing ecosystem, exchange-flow (volume) and possibly partnerships, it has a chance to stabilise at a higher level than pre-listing. If not, it may drift down as initial hype fades.
Hypothesis: If fundamentals prove decent → it might hold a “new baseline” at say 20-40% above current level. If fundamentals weak → it might fall back to or below initial listing price.
Long term (6-12 months and beyond):
A lot depends on deeper factors: What is COMMON’s utility? Will projects build on it? Is there locked-in tokenomics, scarcity, real demand? If yes → it could appreciate meaningfully; if no → it might end up being a speculative one-hit token and fade.
Prediction: Best case: 2x-5x from listing price over 12 months if all goes well. Worst case: majority loss for those who bought at the high, maybe 70-90% drawdown if sentiment fails.
---
🔍 My current “fair assessment”
If I were to pick a likely scenario (given limited info): I’d expect an initial spike, maybe 2-3x above baseline shortly after listing, followed by a volatile period, and then either consolidation somewhere 1.2-1.8x above baseline OR a slide back toward baseline or below depending on fundamental follow-through.
From a risk perspective: If you buy now, only enter with money you can afford to lose. The “leveraged futures” angle suggests many participants are playing for a short-term trade, which adds risk.
It would be wise to wait and see some volume / user adoption / on-chain metrics emerge before committing large amounts.
---
If you like, I can check on-chain data, token metrics, supply & distribution for COMMON and we can try to estimate a more specific price target range (with assumptions) for you. Would that be helpful?
548
huma
huma

Square-Creators-000000005652
·
--
⚡ 5,000,000 $HUMA almost gone!
Move fast, click here [👉 [YOUR LINK]](https://app.binance.com/%75%6E%69-%71%72/%35%38%6B%53%62%39%44%75**)
📌 Pinned Comment:
“Claimed! 👏 Tell your squad before the rewards vanish!”
$ZKC $LINEA
Move fast, click here [👉 [YOUR LINK]](https://app.binance.com/%75%6E%69-%71%72/%35%38%6B%53%62%39%44%75**)
📌 Pinned Comment:
“Claimed! 👏 Tell your squad before the rewards vanish!”
$ZKC $LINEA

·
--
Жоғары (өспелі)
$SOL
{spot}(SOLUSDT)
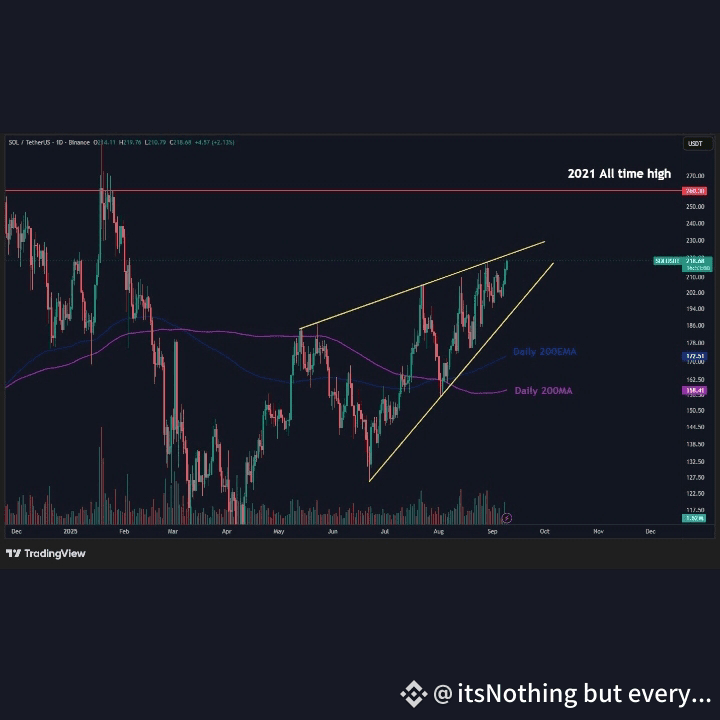
#L Still slowly grinding higher within this rising wedge structure.
As long as this trends higher on these lower timeframes I think it will eventually make that move back to the 2021 highs.
But as we speak, it is against resistance so we'll have to wait and see how it reacts here first.
#BTC & 💎 $ETH remain choppy so expecting SOL to roughly follow those two although it has been outperforming recently.
$SOL
#L Still slowly grinding higher within this rising wedge structure.
As long as this trends higher on these lower timeframes I think it will eventually make that move back to the 2021 highs.
But as we speak, it is against resistance so we'll have to wait and see how it reacts here first.
#BTC & 💎 $ETH remain choppy so expecting SOL to roughly follow those two although it has been outperforming recently.
#L Still slowly grinding higher within this rising wedge structure.
As long as this trends higher on these lower timeframes I think it will eventually make that move back to the 2021 highs.
But as we speak, it is against resistance so we'll have to wait and see how it reacts here first.
#BTC & 💎 $ETH remain choppy so expecting SOL to roughly follow those two although it has been outperforming recently.
1
117
Көбірек контент көру үшін кіріңіз
Binance Square платформасында әлемдік криптоқоғамдастыққа қосылыңыз
⚡️ Криптовалюта туралы ең соңғы және пайдалы ақпаратты алыңыз.
💬 Әлемдегі ең ірі криптобиржаның сеніміне ие.
👍 Расталған авторлардың нақты пікірлерін табыңыз.
Электрондық пошта/телефон нөмірі
Трендтегі тақырыптар
QNTRises39%
5,300 рет көрілді
378 адам талқылап жатыр
#qntrises39%
🚀 $QNT PUMPS +39% ON HUGE INSTITUTIONAL NEWS! 💥
QNT is surging past $100 after massive momentum in institutional adoption! 🔥
$QNT
📰 The Big News Driving the Rally:
Quant Network's Overledger infrastructure is leading the push for tokenized deposits and digital banking solutions. With enterprise volume up over 553%, QNT has surged from $70 to over $100 in just hours! 📊📈
🟡 Binance Updates You Need to Know:
Funding Account Migration: Binance is officially migrating user crypto balances from Funding Accounts to Spot Accounts.
"Stocks Account" Rebrand: Funding Accounts will be renamed to Stocks Account, reserved for stock & stock-options trading settlement using 6 major assets (USD, USDC, USDT, USD1, U, BNB).
Action Required: Check your Binance app for the "One-Click Migration" feature to move your crypto to Spot Accounts before automatic batch transfers begin!
🤔 Is QNT set to smash $110 next, or are we consolidating here? Drop your price predictions below! 👇
#QNT #Quant #BinanceUpdates #CryptoNews
Lily星星
·1 лайк
·1.7k рет көрілді
EthereumBreaksAbove$2700
772 рет көрілді
52 адам талқылап жатыр
BitgetBreachForgedRequestsNotStolenKeys
4,260 рет көрілді
298 адам талқылап жатыр