

GR347 J03
69 Жариялаулар

GR347 J03
Хабарлау
Пайдаланушыны блоктау
67 Жазылым
52 Жазылушылар
57 лайк басылған
Жазбалар
Барлығы
Баға ұсыныстары
·
--
$INJ 🔥 INJ/USDT — Is Injective Waking Up Again?
INJ is showing an interesting change in structure after spending a long period near its lows.
📊 What the charts are showing:
* Monthly: INJ has fallen significantly from its previous ATH around $53, but price has been building a base after the long decline.
* Weekly: Price recently pushed above the $7–8 area, with increasing volume.
* Daily: Strong move from around $4 → $8+, followed by consolidation near the highs.
* 4H: Price is holding around $8, after reaching a recent high of $8.687.
* Volume: Recent upward moves came with noticeably higher volume, which is worth watching.
👀 Key levels to watch:
$8.69 — recent resistance/high
$8.00 — current psychological level
$7.20 — nearby 4H support
$6.36 — deeper support
$5.52 — major lower support zone
The big question now is whether INJ can hold above the breakout area and build another higher high, or whether this move needs a deeper pullback first.
I’m watching price + volume + 4H structure rather than chasing the move.
INJ is definitely one to keep on the radar. 👀
Not financial advice. Always DYOR.
#INJ #Injective #INJUSDT #Crypto #BinanceFeed #Altcoins #Trading #DYOR
$INJ 🔥 INJ/USDT — Is Injective Waking Up Again?
INJ is showing an interesting change in structure after spending a long period near its lows.
📊 What the charts are showing:
* Monthly: INJ has fallen significantly from its previous ATH around $53, but price has been building a base after the long decline.
* Weekly: Price recently pushed above the $7–8 area, with increasing volume.
* Daily: Strong move from around $4 → $8+, followed by consolidation near the highs.
* 4H: Price is holding around $8, after reaching a recent high of $8.687.
* Volume: Recent upward moves came with noticeably higher volume, which is worth watching.
👀 Key levels to watch:
$8.69 — recent resistance/high
$8.00 — current psychological level
$7.20 — nearby 4H support
$6.36 — deeper support
$5.52 — major lower support zone
The big question now is whether INJ can hold above the breakout area and build another higher high, or whether this move needs a deeper pullback first.
I’m watching price + volume + 4H structure rather than chasing the move.
INJ is definitely one to keep on the radar. 👀
Not financial advice. Always DYOR.
#INJ #Injective #INJUSDT #Crypto #BinanceFeed #Altcoins #Trading #DYOR
INJ is showing an interesting change in structure after spending a long period near its lows.
📊 What the charts are showing:
* Monthly: INJ has fallen significantly from its previous ATH around $53, but price has been building a base after the long decline.
* Weekly: Price recently pushed above the $7–8 area, with increasing volume.
* Daily: Strong move from around $4 → $8+, followed by consolidation near the highs.
* 4H: Price is holding around $8, after reaching a recent high of $8.687.
* Volume: Recent upward moves came with noticeably higher volume, which is worth watching.
👀 Key levels to watch:
$8.69 — recent resistance/high
$8.00 — current psychological level
$7.20 — nearby 4H support
$6.36 — deeper support
$5.52 — major lower support zone
The big question now is whether INJ can hold above the breakout area and build another higher high, or whether this move needs a deeper pullback first.
I’m watching price + volume + 4H structure rather than chasing the move.
INJ is definitely one to keep on the radar. 👀
Not financial advice. Always DYOR.
#INJ #Injective #INJUSDT #Crypto #BinanceFeed #Altcoins #Trading #DYOR

2
331
·
--
$LUNC 🔥 LUNC/USDT LONG-TERM OUTLOOK
LUNC is currently around $0.000055, consolidating after a long-term decline.
Key levels to watch:
🟢 Support: $0.000045–$0.000050
🟡 Resistance: $0.000058–$0.000064
🔵 Next major resistance: ~$0.000086
🚀 Historical resistance: ~$0.000123
A sustained breakout above $0.000060–$0.000064 with strong volume could signal improving market structure. Losing the $0.000045–$0.000049 zone would weaken the current setup.
Long term, LUNC’s potential depends not only on price but also on burns, network activity, development, staking and demand.
Patience + confirmation > FOMO. 📊🔥
#LUNC #TerraClassic #LUNCUSDT #Crypto #Binance #Altcoins #TechnicalAnalysis
$LUNC 🔥 LUNC/USDT LONG-TERM OUTLOOK
LUNC is currently around $0.000055, consolidating after a long-term decline.
Key levels to watch:
🟢 Support: $0.000045–$0.000050
🟡 Resistance: $0.000058–$0.000064
🔵 Next major resistance: ~$0.000086
🚀 Historical resistance: ~$0.000123
A sustained breakout above $0.000060–$0.000064 with strong volume could signal improving market structure. Losing the $0.000045–$0.000049 zone would weaken the current setup.
Long term, LUNC’s potential depends not only on price but also on burns, network activity, development, staking and demand.
Patience + confirmation > FOMO. 📊🔥
#LUNC #TerraClassic #LUNCUSDT #Crypto #Binance #Altcoins #TechnicalAnalysis
LUNC is currently around $0.000055, consolidating after a long-term decline.
Key levels to watch:
🟢 Support: $0.000045–$0.000050
🟡 Resistance: $0.000058–$0.000064
🔵 Next major resistance: ~$0.000086
🚀 Historical resistance: ~$0.000123
A sustained breakout above $0.000060–$0.000064 with strong volume could signal improving market structure. Losing the $0.000045–$0.000049 zone would weaken the current setup.
Long term, LUNC’s potential depends not only on price but also on burns, network activity, development, staking and demand.
Patience + confirmation > FOMO. 📊🔥
#LUNC #TerraClassic #LUNCUSDT #Crypto #Binance #Altcoins #TechnicalAnalysis
1
9
1.1k
·
--

Мақала
$LUNC LUNC/USDT LONG-TERM ANALYSIS — IS TERRA CLASSIC BUILDING A NEW BASE?$LUNC LUNC/USDT LONG-TERM ANALYSIS — IS TERRA CLASSIC BUILDING A NEW BASE?
LUNC price on the chart: ~$0.00005496
24H range: ~$0.00005257 – $0.00005584
Chart timeframes: 1H / 4H / 1D / 1W
Terra Classic ($LUNC) remains one of the most heavily watched recovery assets in the market because its long-term story combines massive historical supply, ongoing burns, community governance, staking and continued development.
The charts show an interesting structure: after a prolonged decline from the 2022–23 highs, LUNC has spent a considerable period building a broad base around the $0.000045–$0.000060 area.
🔎 1H — Short-term structure
The 1H chart shows a recovery from approximately $0.00004667 toward $0.00005791.
Current price around $0.000055 is sitting close to the upper portion of this recent range.
Important levels:
Resistance: $0.0000579–$0.0000585
Next resistance: ~$0.0000600
Major 4H resistance: ~$0.0000640
Support: ~$0.0000530
Major support: ~$0.0000490–$0.0000500
Lower support: ~$0.0000460
A sustained move above ~$0.000058–$0.000060 would change the short-term structure significantly, while losing ~$0.000053 could send price back toward the lower part of the range.
📈 4H — The key battlefield
The 4H chart is particularly important.
LUNC has repeatedly traded between roughly $0.000049 and $0.000057, with the recent move pushing toward the upper boundary.
The major level to watch is approximately:
$0.0000640
That corresponds to the marked 4H high in your chart.
If LUNC can establish multiple 4H closes above this area with increasing volume, the market structure would become considerably stronger.
On the other hand, rejection around $0.000058–$0.000064 would indicate that sellers are still defending the upper range.
📅 1D — The bigger picture
The daily chart gives the most interesting long-term perspective.
LUNC previously reached approximately $0.00012300 on the chart before entering a prolonged decline.
Since then, price has formed a much lower trading range and is currently attempting to build a base around $0.000045–$0.000060.
Therefore, the major daily levels I would watch are:
Support zone
$0.000045–$0.000050
Intermediate resistance
$0.000060–$0.000064
Major resistance
~$0.000086–$0.000087
Major historical resistance
~$0.000123
A recovery toward $0.000086–$0.000123 would require considerably stronger demand than the market is currently showing. It should therefore be treated as a future technical scenario rather than a forecast.
🗓️ 1W — The real long-term picture
The weekly chart puts everything into perspective.
LUNC experienced an extraordinary historical collapse and subsequently entered a multi-year downtrend. The chart now shows a very long period of consolidation.
The important observation is that price has been holding substantially above the ~$0.00001588 low marked on the weekly chart while establishing a much higher trading region.
The weekly structure therefore needs to be watched in terms of higher lows, increasing volume and eventual resistance breakouts, rather than focusing only on the number of zeros.
The major weekly resistance zones visible on your chart are approximately:
$0.000064 → $0.000123 → $0.000262 → $0.000401 → $0.000540
These are not guaranteed targets. They are historical/chart-derived areas where sellers could potentially become active.
🔥 TOKENOMICS ARE IMPORTANT FOR THE LONG-TERM THESIS
The LUNC story isn’t purely technical.
Terra Classic’s current ecosystem uses LUNC for staking, governance and network fees.
Supply reduction is another major part of the community’s long-term strategy. Current independent tracking shows hundreds of billions of LUNC have been burned, while Binance has historically contributed through its LUNC trading-fee burn mechanism.
However, there is an important distinction:
Burning reduces supply, but burns alone do not guarantee price appreciation.
For a sustainable long-term recovery, reduced supply would ideally be accompanied by:
Greater network usage
Developer activity
More applications
Staking participation
Stronger liquidity
Sustainable transaction activity
Continued governance development
Terra Classic’s governance system allows bonded LUNC holders to participate in proposals and network decisions through on-chain voting.
🧩 LONG-TERM SCENARIOS
🟢 Scenario 1 — Range breaks upward
If LUNC can break and hold above:
$0.000058 → $0.000060 → $0.000064
with strong volume, the next major areas on the historical chart become approximately:
$0.000086 → $0.000123
This would represent a substantial structural improvement.
🟡 Scenario 2 — Extended accumulation
LUNC could continue moving sideways between approximately:
$0.000045–$0.000064
for an extended period.
This wouldn’t necessarily invalidate the long-term structure. It would simply mean the market is still searching for sufficient demand to establish a new trend.
🔴 Scenario 3 — Support failure
A decisive breakdown below the $0.000045–$0.000049 region would weaken the current base structure and could expose the lower historical levels shown on the weekly chart.
That is why the support region is arguably just as important as the breakout levels.
🧠 MY KEY TAKEAWAY
The most interesting thing about LUNC right now isn’t whether it can suddenly reach an enormous price.
The more important question is:
Can LUNC turn its multi-year accumulation zone into a sustainable long-term uptrend?
For that to happen, I would watch four things closely:
1️⃣ Price structure
Higher highs + higher lows on the weekly chart.
2️⃣ Volume
Breakouts accompanied by meaningful volume are more significant than low-volume moves.
3️⃣ Supply reduction
Continued burns can gradually reduce supply, but the pace matters relative to the remaining supply. Current network data still shows LUNC supply in the trillions.
4️⃣ Real ecosystem activity
Long-term value depends on whether Terra Classic can maintain meaningful network usage, development and governance—not simply community speculation.
🚨 IMPORTANT
LUNC remains a high-volatility, highly speculative cryptocurrency. The historical collapse means its long-term chart should not be interpreted like that of a conventional asset. Even if the technical structure improves, there is no guarantee that historical resistance levels will be recovered.
This is technical/educational analysis, not financial advice.
📌 Binance Feed caption
LUNC LONG-TERM WATCH 👀🔥
LUNC is currently trading around $0.000055, sitting inside a major multi-year consolidation area.
The levels I’m watching are:
🟢 Support: $0.000045–$0.000050
🟡 Resistance: $0.000058–$0.000064
🔵 Major resistance: ~$0.000086
🔴 Historical resistance: ~$0.000123
The key isn’t simply the number of zeros. The real long-term question is whether LUNC can combine supply reduction + network activity + development + governance + increasing demand into a sustainable trend.
A confirmed breakout above the $0.000060–$0.000064 region would be technically significant. A loss of the $0.000045–$0.000049 area would weaken the current base.
Patience + volume + confirmation > FOMO.
What matters most for LUNC’s next major move: breakout or continued accumulation?
#LUNC #TerraClassic #Crypto #Binance #Altcoins #CryptoAnalysis #LUNCUSDT #TechnicalAnalysis #CryptoTrading
$LUNC LUNC/USDT LONG-TERM ANALYSIS — IS TERRA CLASSIC BUILDING A NEW BASE?
$LUNC LUNC/USDT LONG-TERM ANALYSIS — IS TERRA CLASSIC BUILDING A NEW BASE?
LUNC price on the chart: ~$0.00005496
24H range: ~$0.00005257 – $0.00005584
Chart timeframes: 1H / 4H / 1D / 1W
Terra Classic ($LUNC ) remains one of the most heavily watched recovery assets in the market because its long-term story combines massive historical supply, ongoing burns, community governance, staking and continued development.
The charts show an interesting structure: after a prolonged decline from the 2022–23 highs, LUNC has spent a considerable period building a broad base around the $0.000045–$0.000060 area.
🔎 1H — Short-term structure
The 1H chart shows a recovery from approximately $0.00004667 toward $0.00005791.
Current price around $0.000055 is sitting close to the upper portion of this recent range.
Important levels:
Resistance: $0.0000579–$0.0000585
Next resistance: ~$0.0000600
Major 4H resistance: ~$0.0000640
Support: ~$0.0000530
Major support: ~$0.0000490–$0.0000500
Lower support: ~$0.0000460
A sustained move above ~$0.000058–$0.000060 would change the short-term structure significantly, while losing ~$0.000053 could send price back toward the lower part of the range.
📈 4H — The key battlefield
The 4H chart is particularly important.
LUNC has repeatedly traded between roughly $0.000049 and $0.000057, with the recent move pushing toward the upper boundary.
The major level to watch is approximately:
$0.0000640
That corresponds to the marked 4H high in your chart.
If LUNC can establish multiple 4H closes above this area with increasing volume, the market structure would become considerably stronger.
On the other hand, rejection around $0.000058–$0.000064 would indicate that sellers are still defending the upper range.
📅 1D — The bigger picture
The daily chart gives the most interesting long-term perspective.
LUNC previously reached approximately $0.00012300 on the chart before entering a prolonged decline.
Since then, price has formed a much lower trading range and is currently attempting to build a base around $0.000045–$0.000060.
Therefore, the major daily levels I would watch are:
Support zone
$0.000045–$0.000050
Intermediate resistance
$0.000060–$0.000064
Major resistance
~$0.000086–$0.000087
Major historical resistance
~$0.000123
A recovery toward $0.000086–$0.000123 would require considerably stronger demand than the market is currently showing. It should therefore be treated as a future technical scenario rather than a forecast.
🗓️ 1W — The real long-term picture
The weekly chart puts everything into perspective.
LUNC experienced an extraordinary historical collapse and subsequently entered a multi-year downtrend. The chart now shows a very long period of consolidation.
The important observation is that price has been holding substantially above the ~$0.00001588 low marked on the weekly chart while establishing a much higher trading region.
The weekly structure therefore needs to be watched in terms of higher lows, increasing volume and eventual resistance breakouts, rather than focusing only on the number of zeros.
The major weekly resistance zones visible on your chart are approximately:
$0.000064 → $0.000123 → $0.000262 → $0.000401 → $0.000540
These are not guaranteed targets. They are historical/chart-derived areas where sellers could potentially become active.
🔥 TOKENOMICS ARE IMPORTANT FOR THE LONG-TERM THESIS
The LUNC story isn’t purely technical.
Terra Classic’s current ecosystem uses LUNC for staking, governance and network fees.
Supply reduction is another major part of the community’s long-term strategy. Current independent tracking shows hundreds of billions of LUNC have been burned, while Binance has historically contributed through its LUNC trading-fee burn mechanism.
However, there is an important distinction:
Burning reduces supply, but burns alone do not guarantee price appreciation.
For a sustainable long-term recovery, reduced supply would ideally be accompanied by:
Greater network usage
Developer activity
More applications
Staking participation
Stronger liquidity
Sustainable transaction activity
Continued governance development
Terra Classic’s governance system allows bonded LUNC holders to participate in proposals and network decisions through on-chain voting.
🧩 LONG-TERM SCENARIOS
🟢 Scenario 1 — Range breaks upward
If LUNC can break and hold above:
$0.000058 → $0.000060 → $0.000064
with strong volume, the next major areas on the historical chart become approximately:
$0.000086 → $0.000123
This would represent a substantial structural improvement.
🟡 Scenario 2 — Extended accumulation
LUNC could continue moving sideways between approximately:
$0.000045–$0.000064
for an extended period.
This wouldn’t necessarily invalidate the long-term structure. It would simply mean the market is still searching for sufficient demand to establish a new trend.
🔴 Scenario 3 — Support failure
A decisive breakdown below the $0.000045–$0.000049 region would weaken the current base structure and could expose the lower historical levels shown on the weekly chart.
That is why the support region is arguably just as important as the breakout levels.
🧠 MY KEY TAKEAWAY
The most interesting thing about LUNC right now isn’t whether it can suddenly reach an enormous price.
The more important question is:
Can LUNC turn its multi-year accumulation zone into a sustainable long-term uptrend?
For that to happen, I would watch four things closely:
1️⃣ Price structure
Higher highs + higher lows on the weekly chart.
2️⃣ Volume
Breakouts accompanied by meaningful volume are more significant than low-volume moves.
3️⃣ Supply reduction
Continued burns can gradually reduce supply, but the pace matters relative to the remaining supply. Current network data still shows LUNC supply in the trillions.
4️⃣ Real ecosystem activity
Long-term value depends on whether Terra Classic can maintain meaningful network usage, development and governance—not simply community speculation.
🚨 IMPORTANT
LUNC remains a high-volatility, highly speculative cryptocurrency. The historical collapse means its long-term chart should not be interpreted like that of a conventional asset. Even if the technical structure improves, there is no guarantee that historical resistance levels will be recovered.
This is technical/educational analysis, not financial advice.
📌 Binance Feed caption
LUNC LONG-TERM WATCH 👀🔥
LUNC is currently trading around $0.000055, sitting inside a major multi-year consolidation area.
The levels I’m watching are:
🟢 Support: $0.000045–$0.000050
🟡 Resistance: $0.000058–$0.000064
🔵 Major resistance: ~$0.000086
🔴 Historical resistance: ~$0.000123
The key isn’t simply the number of zeros. The real long-term question is whether LUNC can combine supply reduction + network activity + development + governance + increasing demand into a sustainable trend.
A confirmed breakout above the $0.000060–$0.000064 region would be technically significant. A loss of the $0.000045–$0.000049 area would weaken the current base.
Patience + volume + confirmation > FOMO.
What matters most for LUNC’s next major move: breakout or continued accumulation?
#LUNC #TerraClassic #Crypto #Binance #Altcoins #CryptoAnalysis #LUNCUSDT #TechnicalAnalysis #CryptoTrading
LUNC price on the chart: ~$0.00005496
24H range: ~$0.00005257 – $0.00005584
Chart timeframes: 1H / 4H / 1D / 1W
Terra Classic ($LUNC ) remains one of the most heavily watched recovery assets in the market because its long-term story combines massive historical supply, ongoing burns, community governance, staking and continued development.
The charts show an interesting structure: after a prolonged decline from the 2022–23 highs, LUNC has spent a considerable period building a broad base around the $0.000045–$0.000060 area.
🔎 1H — Short-term structure
The 1H chart shows a recovery from approximately $0.00004667 toward $0.00005791.
Current price around $0.000055 is sitting close to the upper portion of this recent range.
Important levels:
Resistance: $0.0000579–$0.0000585
Next resistance: ~$0.0000600
Major 4H resistance: ~$0.0000640
Support: ~$0.0000530
Major support: ~$0.0000490–$0.0000500
Lower support: ~$0.0000460
A sustained move above ~$0.000058–$0.000060 would change the short-term structure significantly, while losing ~$0.000053 could send price back toward the lower part of the range.
📈 4H — The key battlefield
The 4H chart is particularly important.
LUNC has repeatedly traded between roughly $0.000049 and $0.000057, with the recent move pushing toward the upper boundary.
The major level to watch is approximately:
$0.0000640
That corresponds to the marked 4H high in your chart.
If LUNC can establish multiple 4H closes above this area with increasing volume, the market structure would become considerably stronger.
On the other hand, rejection around $0.000058–$0.000064 would indicate that sellers are still defending the upper range.
📅 1D — The bigger picture
The daily chart gives the most interesting long-term perspective.
LUNC previously reached approximately $0.00012300 on the chart before entering a prolonged decline.
Since then, price has formed a much lower trading range and is currently attempting to build a base around $0.000045–$0.000060.
Therefore, the major daily levels I would watch are:
Support zone
$0.000045–$0.000050
Intermediate resistance
$0.000060–$0.000064
Major resistance
~$0.000086–$0.000087
Major historical resistance
~$0.000123
A recovery toward $0.000086–$0.000123 would require considerably stronger demand than the market is currently showing. It should therefore be treated as a future technical scenario rather than a forecast.
🗓️ 1W — The real long-term picture
The weekly chart puts everything into perspective.
LUNC experienced an extraordinary historical collapse and subsequently entered a multi-year downtrend. The chart now shows a very long period of consolidation.
The important observation is that price has been holding substantially above the ~$0.00001588 low marked on the weekly chart while establishing a much higher trading region.
The weekly structure therefore needs to be watched in terms of higher lows, increasing volume and eventual resistance breakouts, rather than focusing only on the number of zeros.
The major weekly resistance zones visible on your chart are approximately:
$0.000064 → $0.000123 → $0.000262 → $0.000401 → $0.000540
These are not guaranteed targets. They are historical/chart-derived areas where sellers could potentially become active.
🔥 TOKENOMICS ARE IMPORTANT FOR THE LONG-TERM THESIS
The LUNC story isn’t purely technical.
Terra Classic’s current ecosystem uses LUNC for staking, governance and network fees.
Supply reduction is another major part of the community’s long-term strategy. Current independent tracking shows hundreds of billions of LUNC have been burned, while Binance has historically contributed through its LUNC trading-fee burn mechanism.
However, there is an important distinction:
Burning reduces supply, but burns alone do not guarantee price appreciation.
For a sustainable long-term recovery, reduced supply would ideally be accompanied by:
Greater network usage
Developer activity
More applications
Staking participation
Stronger liquidity
Sustainable transaction activity
Continued governance development
Terra Classic’s governance system allows bonded LUNC holders to participate in proposals and network decisions through on-chain voting.
🧩 LONG-TERM SCENARIOS
🟢 Scenario 1 — Range breaks upward
If LUNC can break and hold above:
$0.000058 → $0.000060 → $0.000064
with strong volume, the next major areas on the historical chart become approximately:
$0.000086 → $0.000123
This would represent a substantial structural improvement.
🟡 Scenario 2 — Extended accumulation
LUNC could continue moving sideways between approximately:
$0.000045–$0.000064
for an extended period.
This wouldn’t necessarily invalidate the long-term structure. It would simply mean the market is still searching for sufficient demand to establish a new trend.
🔴 Scenario 3 — Support failure
A decisive breakdown below the $0.000045–$0.000049 region would weaken the current base structure and could expose the lower historical levels shown on the weekly chart.
That is why the support region is arguably just as important as the breakout levels.
🧠 MY KEY TAKEAWAY
The most interesting thing about LUNC right now isn’t whether it can suddenly reach an enormous price.
The more important question is:
Can LUNC turn its multi-year accumulation zone into a sustainable long-term uptrend?
For that to happen, I would watch four things closely:
1️⃣ Price structure
Higher highs + higher lows on the weekly chart.
2️⃣ Volume
Breakouts accompanied by meaningful volume are more significant than low-volume moves.
3️⃣ Supply reduction
Continued burns can gradually reduce supply, but the pace matters relative to the remaining supply. Current network data still shows LUNC supply in the trillions.
4️⃣ Real ecosystem activity
Long-term value depends on whether Terra Classic can maintain meaningful network usage, development and governance—not simply community speculation.
🚨 IMPORTANT
LUNC remains a high-volatility, highly speculative cryptocurrency. The historical collapse means its long-term chart should not be interpreted like that of a conventional asset. Even if the technical structure improves, there is no guarantee that historical resistance levels will be recovered.
This is technical/educational analysis, not financial advice.
📌 Binance Feed caption
LUNC LONG-TERM WATCH 👀🔥
LUNC is currently trading around $0.000055, sitting inside a major multi-year consolidation area.
The levels I’m watching are:
🟢 Support: $0.000045–$0.000050
🟡 Resistance: $0.000058–$0.000064
🔵 Major resistance: ~$0.000086
🔴 Historical resistance: ~$0.000123
The key isn’t simply the number of zeros. The real long-term question is whether LUNC can combine supply reduction + network activity + development + governance + increasing demand into a sustainable trend.
A confirmed breakout above the $0.000060–$0.000064 region would be technically significant. A loss of the $0.000045–$0.000049 area would weaken the current base.
Patience + volume + confirmation > FOMO.
What matters most for LUNC’s next major move: breakout or continued accumulation?
#LUNC #TerraClassic #Crypto #Binance #Altcoins #CryptoAnalysis #LUNCUSDT #TechnicalAnalysis #CryptoTrading
14
1.5k
·
--
$WIF to the moon. Whales are slowly accumulating
$WIF to the moon. Whales are slowly accumulating
1
171
·
--
It’s happening in real time
It’s happening in real time


Zetoshi X
·
--
If you are unable to join my chatroom or are facing any issues, or if you want to learn more about the market, feel free to reach out to me on my Binance chat. My Binance chat is now open for everyone.
1
2
·
--
If you miss one opportunity, come join us so you won’t miss the second
If you miss one opportunity, come join us so you won’t miss the second
Zetoshi X
·
--
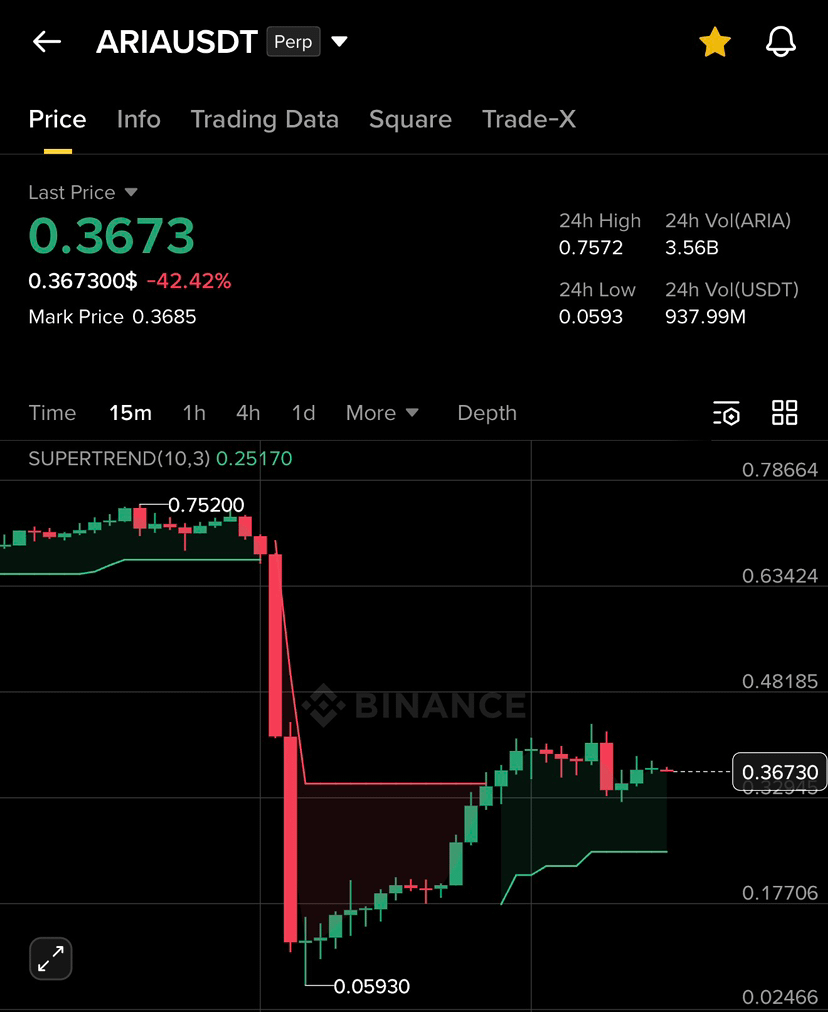
We will get one more opportunity to short this $ARIA
1
·
--
Stay sharp for active signals..
Stay sharp for active signals..
Zetoshi X
·
--
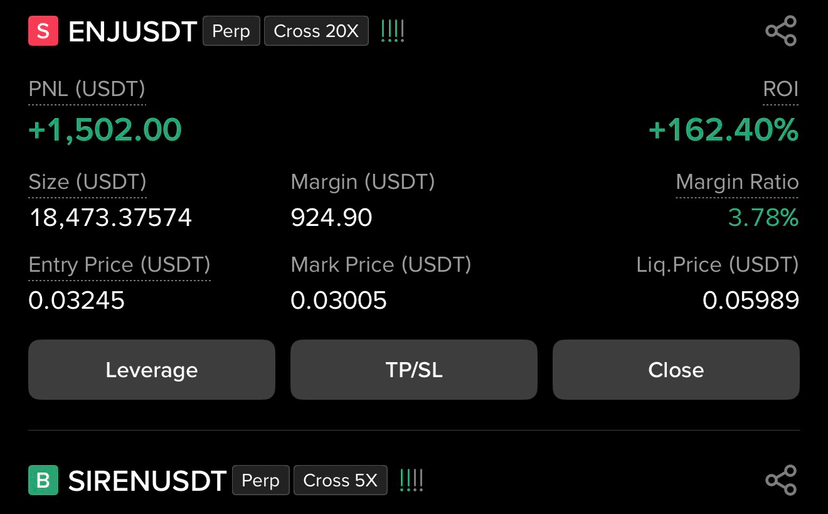
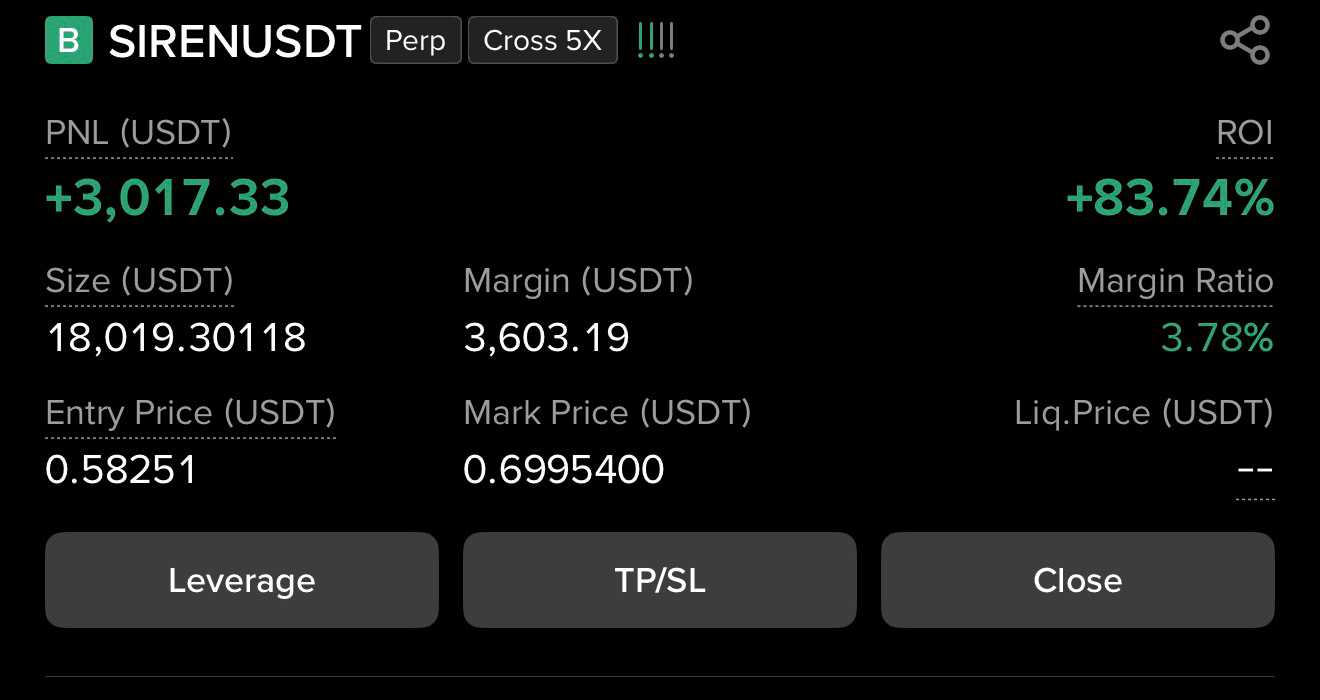
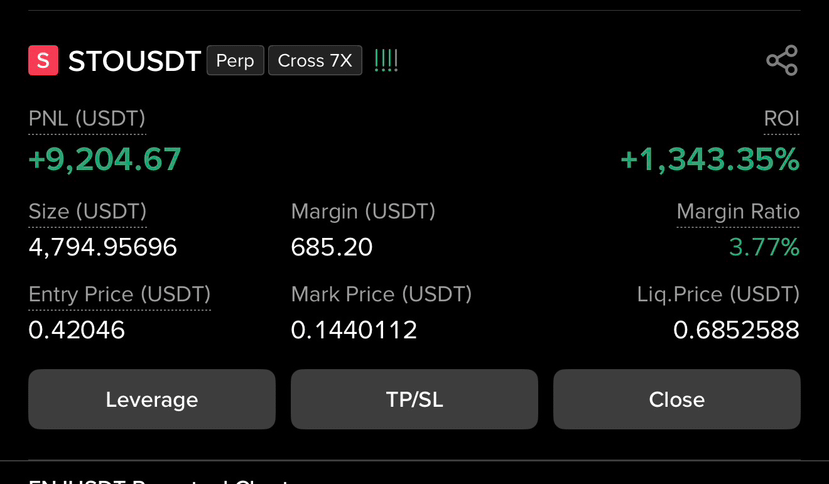
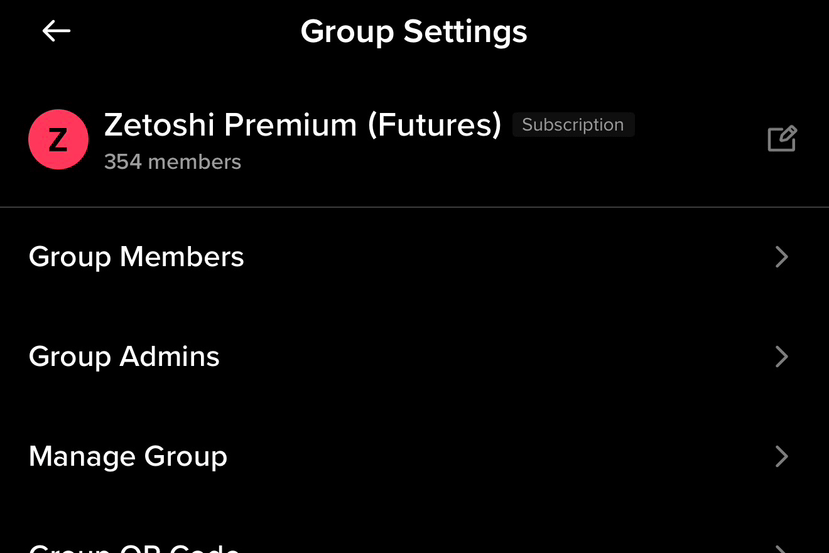
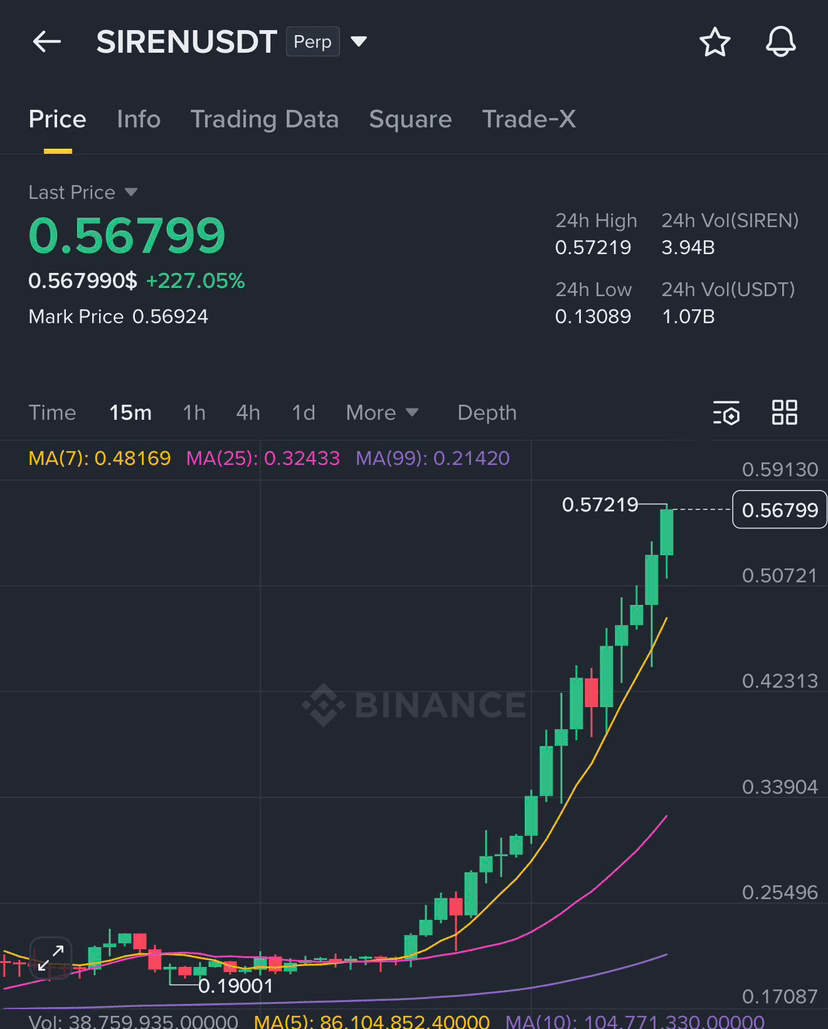
We made huge profits from , $SIREN and $ENJ — cheers guys! 🚀Take a look at how much I’ve made.
Next call coming soon on another Alpha play: $ARIA . Stay active in the chat!🤯👀
Next call coming soon on another Alpha play: $ARIA . Stay active in the chat!🤯👀
1
·
--
Share giur thoughs
Share giur thoughs
Zetoshi X
·
--
Solutions of Making profit from Binance Futures!
Guys, let me explain why many of you are losing money on manipulative tokens like $SIREN $BULLA and $JOE similar projects.
It doesn’t matter whether you’re going long or short — most traders still end up losing or getting liquidated. The reason is simple: the team or market makers are playing a game, and you’re entering in the middle of it.
You should never enter in the middle phase. Instead, try to enter either at the very beginning or near the end of a move. In the middle, prices often spike both upward and downward, which is designed to liquidate both long and short positions.
For example, imagine a token starts at $0.01 and pumps to $1. At that point, many traders think it must go down — but instead, it pushes further to $2. When traders go long again, expecting continuation, the price suddenly drops back to $1… then pumps again to $2. This cycle is how manipulation works.
Now consider another scenario: the token pumps from $0.01 to $1. You wait patiently for the right moment to short. It drops to $0.50 or $0.40, and many people think the move is over and switch to long positions. But in reality, the price continues dropping all the way back to $0.01.
The lesson is simple
Enter early in the move or near the very end — not in the middle. For example, if a token drops from $1 to $0.40, a better short entry might be around $0.40, targeting $0.10 or even back to $0.01.
Stay patient, avoid emotional trades, and don’t get trapped in the middle of manipulated moves.
It doesn’t matter whether you’re going long or short — most traders still end up losing or getting liquidated. The reason is simple: the team or market makers are playing a game, and you’re entering in the middle of it.
You should never enter in the middle phase. Instead, try to enter either at the very beginning or near the end of a move. In the middle, prices often spike both upward and downward, which is designed to liquidate both long and short positions.
For example, imagine a token starts at $0.01 and pumps to $1. At that point, many traders think it must go down — but instead, it pushes further to $2. When traders go long again, expecting continuation, the price suddenly drops back to $1… then pumps again to $2. This cycle is how manipulation works.
Now consider another scenario: the token pumps from $0.01 to $1. You wait patiently for the right moment to short. It drops to $0.50 or $0.40, and many people think the move is over and switch to long positions. But in reality, the price continues dropping all the way back to $0.01.
The lesson is simple
Enter early in the move or near the very end — not in the middle. For example, if a token drops from $1 to $0.40, a better short entry might be around $0.40, targeting $0.10 or even back to $0.01.
Stay patient, avoid emotional trades, and don’t get trapped in the middle of manipulated moves.
·
--
Come try to make some profit with us
Come try to make some profit with us
Zetoshi X
·
--
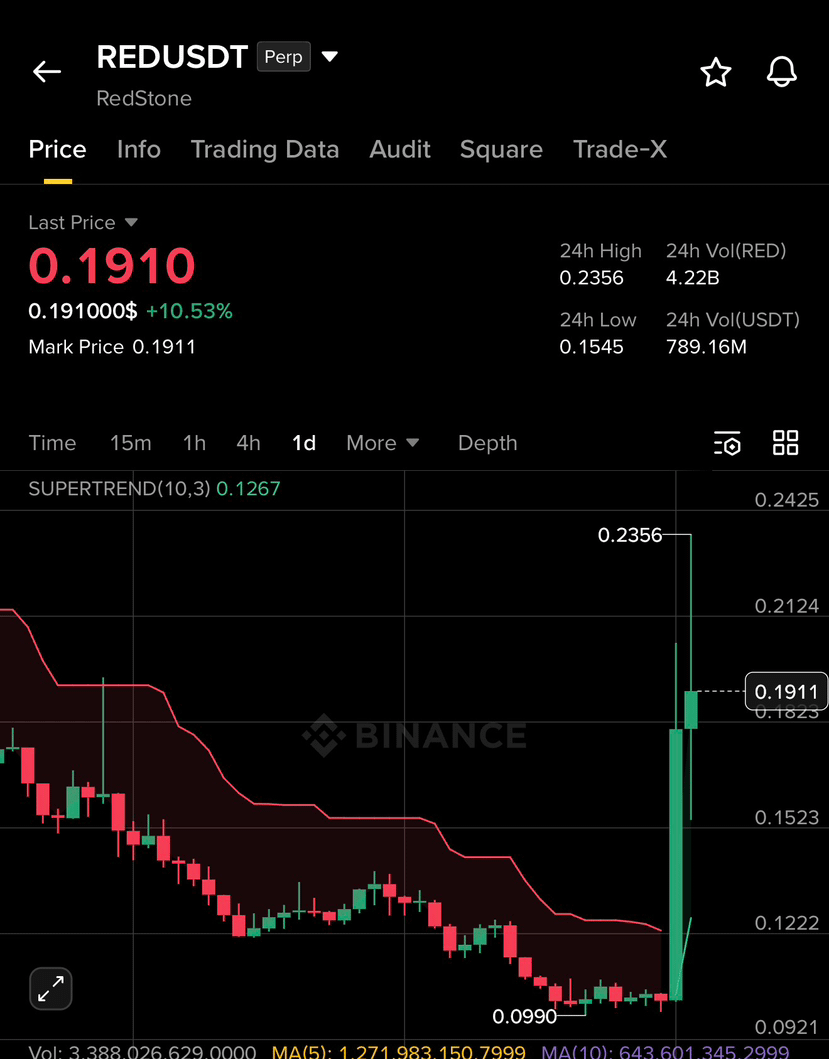
I just dropped to $RED call into my chatroom
·
--
Your thoughts on this one
Your thoughts on this one
Zetoshi X
·
--
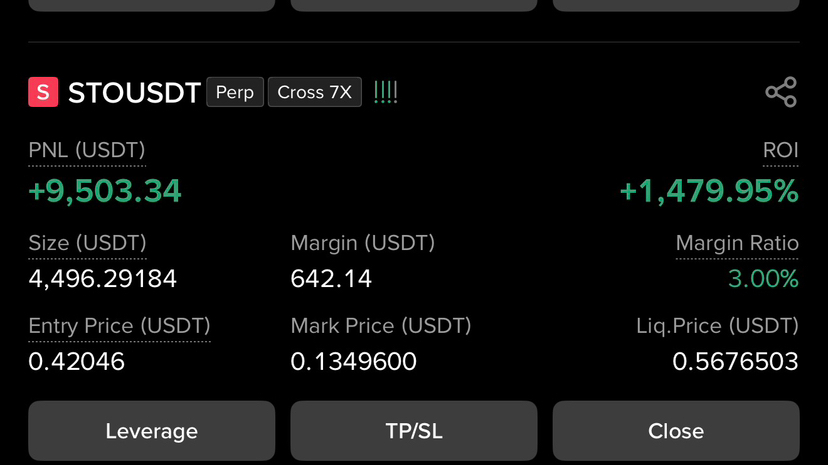
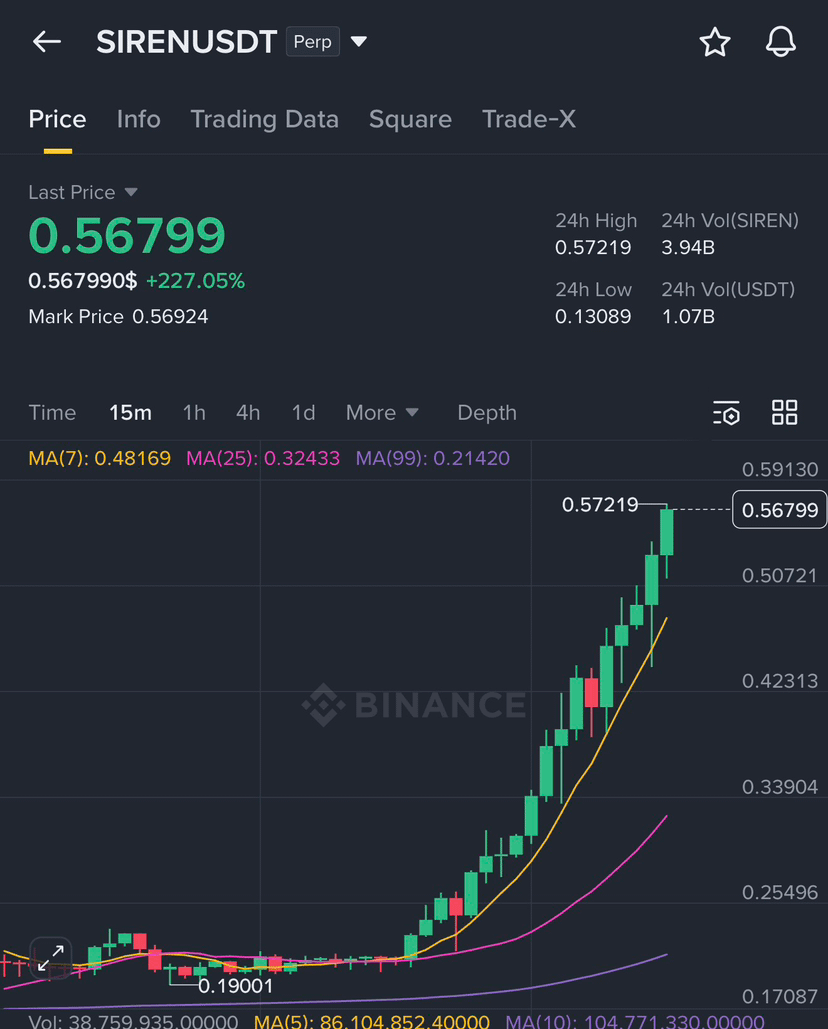
As I promised, whatever I earn from $STO I will share with someone who truly loves me. Now my $SIREN trade is live I’ll do the same for you.🥂
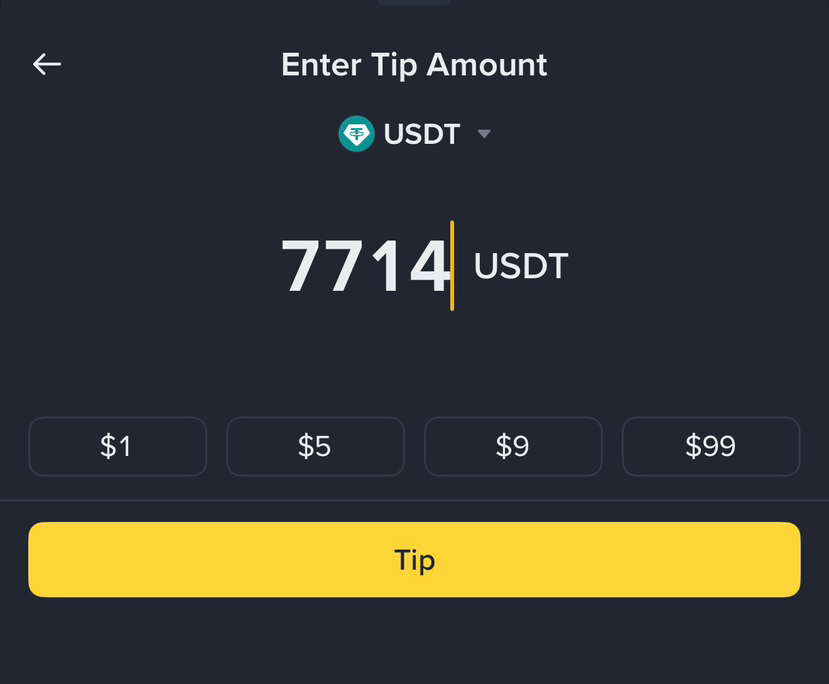
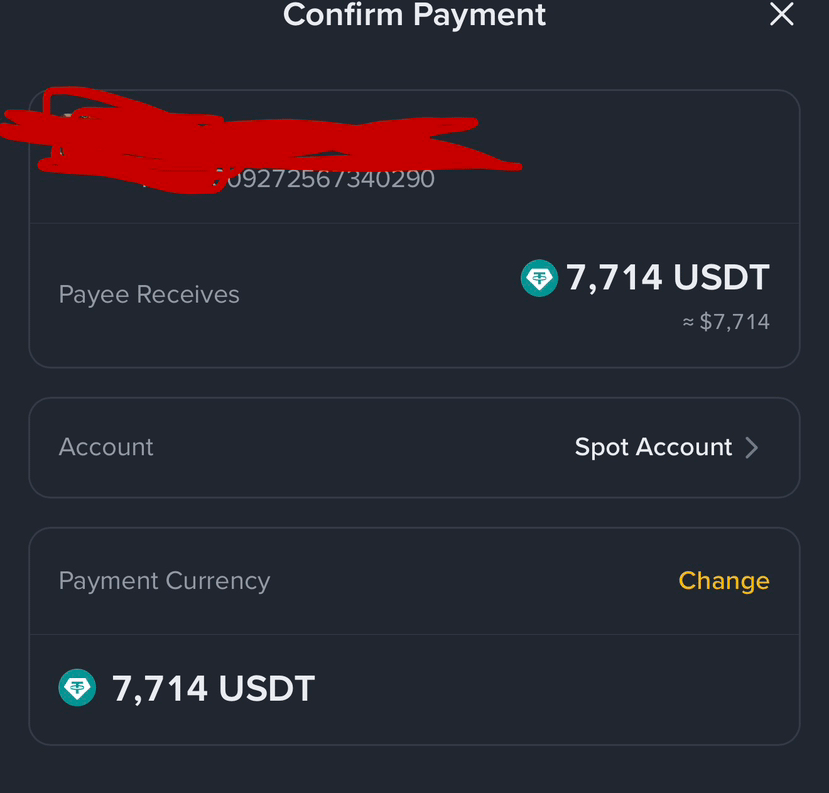
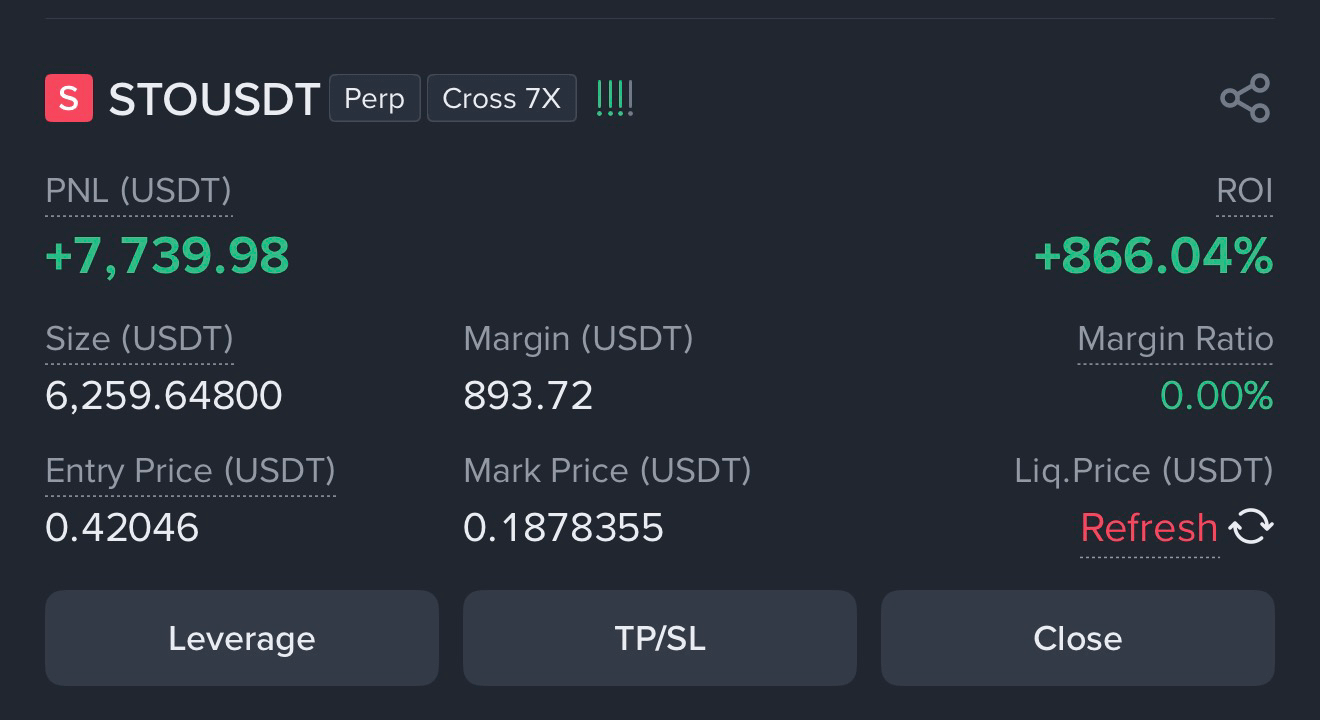
1
8

·
--
Com join the winning Kings..
Com join the winning Kings..
Zetoshi X
·
--
As we made 8K from $STO now its time to print some money on $SIREN prepare my People
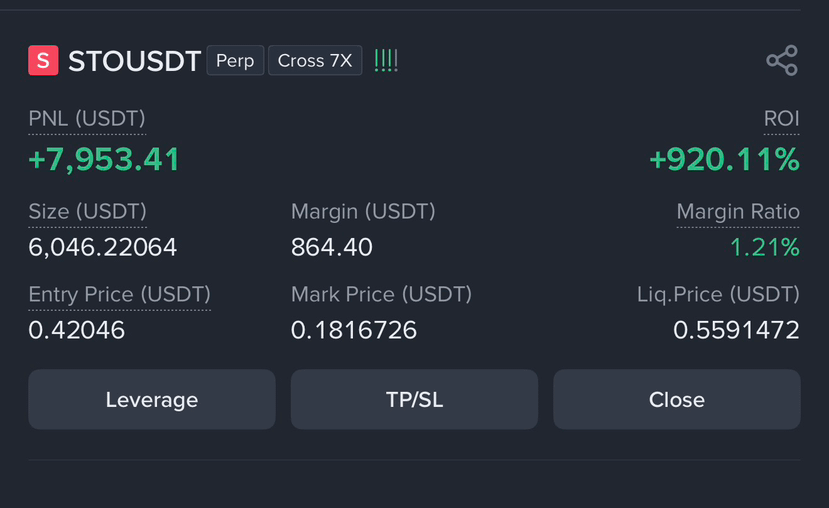
·
--
If you want a perfect future trade come this way
If you want a perfect future trade come this way
Zetoshi X
·
--
Got some news: we’re going to share a $SIREN call soon in our chatroom, just like we did when we caught it from $1.9 down to $0.1.
·
--
Мақала
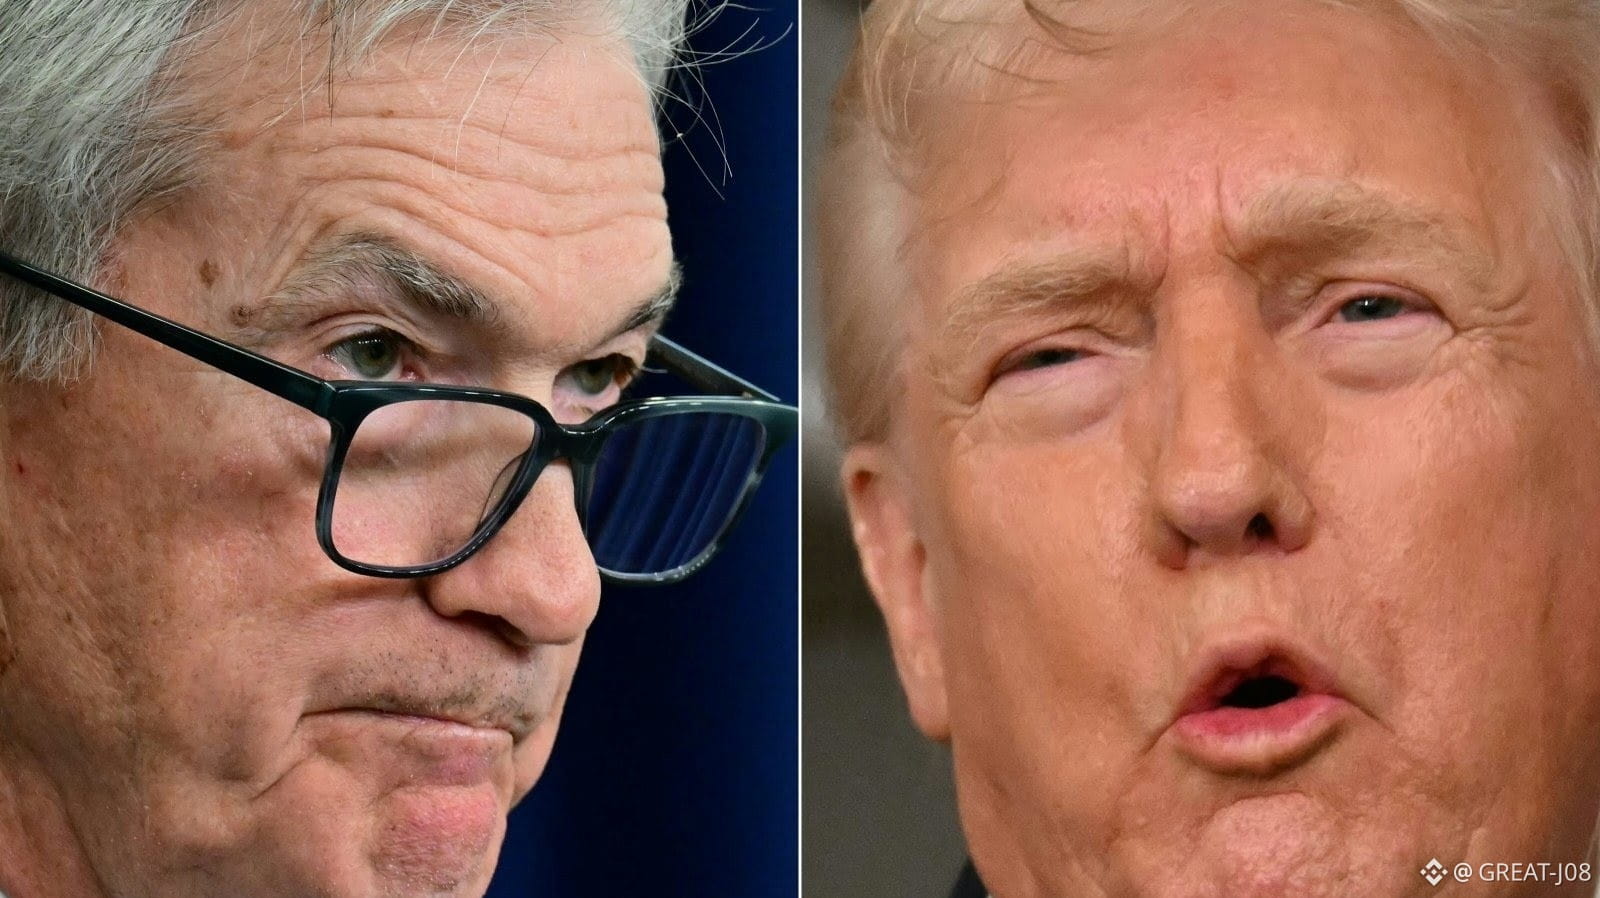
Trump says to announce his pick for Fed chair 'next week'US. President Donald Trump said on Thursday that he plans to name his choice for the next Federal Reserve (Fed) chair next week to replace Jerome Powell, whom he has frequently criticized for failing to cut interest rates more aggressively.
Trump's comments at a cabinet meeting came after months of his escalating pressure on the independent central bank, with the president on Thursday again slamming Powell as a "moron" for not slashing rates more quickly a day earlier.
Powell's term at the helm of the Fed ends in May, and Trump has been due to unveil his replacement ahead of this deadline.
As his search narrows, key contenders include former Fed official Kevin Warsh, Fed Governor Christopher Waller, Rick Rieder of BlackRock and Trump's chief economic adviser Kevin Hassett.
On Thursday, Trump said: "We're going to be announcing next week, I think, sometime."
"We're going to be announcing the head of the Fed," the U.S. leader added. "It'll be a person that will, I think, do a good job."
He renewed criticism of the bank, saying interest rates were still "too high, unacceptably high."
"We should have the lowest interest rate anywhere in the world. They should be two points and even three points lower," Trump added.
A day prior, the Fed opted to pause its series of rate cuts as policymakers await further data on the world's biggest economy, drawing Trump's ire.
He lashed out at Powell on Thursday, claiming the Fed chief was "politically biased."
Earlier Thursday, Trump wrote on his Truth Social platform that Powell had "absolutely no reason" to keep rates elevated.
In holding rates unchanged at a range between 3.50% and 3.75% on Wednesday, the central bank cited solid U.S. economic growth and a stabilization in the unemployment rate.
For now, Powell said, the aim was to let data guide the way on the future path of interest rates.
Trump has ramped up attacks on the Fed since returning to the White House last year, seeking to oust Fed Governor Lisa Cook over the summer while the Department of Justice separately launched a probe into Powell over renovation costs at the bank.
Guess what this means for #BTC
Trump says to announce his pick for Fed chair 'next week'
US. President Donald Trump said on Thursday that he plans to name his choice for the next Federal Reserve (Fed) chair next week to replace Jerome Powell, whom he has frequently criticized for failing to cut interest rates more aggressively.
Trump's comments at a cabinet meeting came after months of his escalating pressure on the independent central bank, with the president on Thursday again slamming Powell as a "moron" for not slashing rates more quickly a day earlier.
Powell's term at the helm of the Fed ends in May, and Trump has been due to unveil his replacement ahead of this deadline.
As his search narrows, key contenders include former Fed official Kevin Warsh, Fed Governor Christopher Waller, Rick Rieder of BlackRock and Trump's chief economic adviser Kevin Hassett.
On Thursday, Trump said: "We're going to be announcing next week, I think, sometime."
"We're going to be announcing the head of the Fed," the U.S. leader added. "It'll be a person that will, I think, do a good job."
He renewed criticism of the bank, saying interest rates were still "too high, unacceptably high."
"We should have the lowest interest rate anywhere in the world. They should be two points and even three points lower," Trump added.
A day prior, the Fed opted to pause its series of rate cuts as policymakers await further data on the world's biggest economy, drawing Trump's ire.
He lashed out at Powell on Thursday, claiming the Fed chief was "politically biased."
Earlier Thursday, Trump wrote on his Truth Social platform that Powell had "absolutely no reason" to keep rates elevated.
In holding rates unchanged at a range between 3.50% and 3.75% on Wednesday, the central bank cited solid U.S. economic growth and a stabilization in the unemployment rate.
For now, Powell said, the aim was to let data guide the way on the future path of interest rates.
Trump has ramped up attacks on the Fed since returning to the White House last year, seeking to oust Fed Governor Lisa Cook over the summer while the Department of Justice separately launched a probe into Powell over renovation costs at the bank.
Guess what this means for #BTC
Trump's comments at a cabinet meeting came after months of his escalating pressure on the independent central bank, with the president on Thursday again slamming Powell as a "moron" for not slashing rates more quickly a day earlier.
Powell's term at the helm of the Fed ends in May, and Trump has been due to unveil his replacement ahead of this deadline.
As his search narrows, key contenders include former Fed official Kevin Warsh, Fed Governor Christopher Waller, Rick Rieder of BlackRock and Trump's chief economic adviser Kevin Hassett.
On Thursday, Trump said: "We're going to be announcing next week, I think, sometime."
"We're going to be announcing the head of the Fed," the U.S. leader added. "It'll be a person that will, I think, do a good job."
He renewed criticism of the bank, saying interest rates were still "too high, unacceptably high."
"We should have the lowest interest rate anywhere in the world. They should be two points and even three points lower," Trump added.
A day prior, the Fed opted to pause its series of rate cuts as policymakers await further data on the world's biggest economy, drawing Trump's ire.
He lashed out at Powell on Thursday, claiming the Fed chief was "politically biased."
Earlier Thursday, Trump wrote on his Truth Social platform that Powell had "absolutely no reason" to keep rates elevated.
In holding rates unchanged at a range between 3.50% and 3.75% on Wednesday, the central bank cited solid U.S. economic growth and a stabilization in the unemployment rate.
For now, Powell said, the aim was to let data guide the way on the future path of interest rates.
Trump has ramped up attacks on the Fed since returning to the White House last year, seeking to oust Fed Governor Lisa Cook over the summer while the Department of Justice separately launched a probe into Powell over renovation costs at the bank.
Guess what this means for #BTC
1
166
·
--
@BiBi how true is this news?
@Binance BiBi how true is this news?
The Crypto Radio
·
--
Live Crypto News with @Bitcoin Bo - Jan 13th
Nigeria is tightening crypto oversight. New tax rules link crypto trades to TIN and NIN IDs, making transactions traceable and taxable.
With billions flowing through digital assets, regulators want visibility and revenue.
What does this means for Nigerian crypto users and exchanges?
#Nigeria #Bitcoin #CryptoTax
Nigeria is tightening crypto oversight. New tax rules link crypto trades to TIN and NIN IDs, making transactions traceable and taxable.
With billions flowing through digital assets, regulators want visibility and revenue.
What does this means for Nigerian crypto users and exchanges?
#Nigeria #Bitcoin #CryptoTax
1
10
·
--
#2025withBinance Start your crypto story with the @Binance Year in Review and share your highlights! #2025withBinance.
👉 Sign up with my link and get 100 USD rewards! https://www.binance.com/year-in-review/2025-with-binance?ref=441819495
#2025withBinance Start your crypto story with the @Binance Year in Review and share your highlights! #2025withBinance.
👉 Sign up with my link and get 100 USD rewards! https://www.binance.com/year-in-review/2025-with-binance?ref=441819495
👉 Sign up with my link and get 100 USD rewards! https://www.binance.com/year-in-review/2025-with-binance?ref=441819495
1
·
--
learn
learn

BeyOglu - The Analyst
·
--
How to identify the market by chart.
Fibonacci Is a Probability Tool — Not Magic:
1.Fibonacci
2.Breakout
3.Reversal
4.Elliott Wave
5.Failure Value Gap
6.Candlesticks
7.Heikin Ash
8.Moon Phases
9.Renko
10.Harmonic Patterns
11.Support and resistance
12.Dynamic S&R
13.Trend lines
14.Gann Angels
15.Momentum Indicators
16.Oscillators
17.Divergence
18.Volume
Fibonacci Is a Probability Tool — Not Magic:
1.Fibonacci
2.Breakout
3.Reversal
4.Elliott Wave
5.Failure Value Gap
6.Candlesticks
7.Heikin Ash
8.Moon Phases
9.Renko
10.Harmonic Patterns
11.Support and resistance
12.Dynamic S&R
13.Trend lines
14.Gann Angels
15.Momentum Indicators
16.Oscillators
17.Divergence
18.Volume
2
3
Көбірек контент көру үшін кіріңіз
Binance Square платформасында әлемдік криптоқоғамдастыққа қосылыңыз
⚡️ Криптовалюта туралы ең соңғы және пайдалы ақпаратты алыңыз.
💬 Әлемдегі ең ірі криптобиржаның сеніміне ие.
👍 Расталған авторлардың нақты пікірлерін табыңыз.
Электрондық пошта/телефон нөмірі
Трендтегі тақырыптар
QNTRises39%
8,672 рет көрілді
505 адам талқылап жатыр
#qntrises39%
🚀 $QNT PUMPS +39% ON HUGE INSTITUTIONAL NEWS! 💥
QNT is surging past $100 after massive momentum in institutional adoption! 🔥
$QNT
📰 The Big News Driving the Rally:
Quant Network's Overledger infrastructure is leading the push for tokenized deposits and digital banking solutions. With enterprise volume up over 553%, QNT has surged from $70 to over $100 in just hours! 📊📈
🟡 Binance Updates You Need to Know:
Funding Account Migration: Binance is officially migrating user crypto balances from Funding Accounts to Spot Accounts.
"Stocks Account" Rebrand: Funding Accounts will be renamed to Stocks Account, reserved for stock & stock-options trading settlement using 6 major assets (USD, USDC, USDT, USD1, U, BNB).
Action Required: Check your Binance app for the "One-Click Migration" feature to move your crypto to Spot Accounts before automatic batch transfers begin!
🤔 Is QNT set to smash $110 next, or are we consolidating here? Drop your price predictions below! 👇
#QNT #Quant #BinanceUpdates #CryptoNews
Lily星星
·1 лайк
·3k рет көрілді
EthereumBreaksAbove$2700
1,103 рет көрілді
61 адам талқылап жатыр
BitgetBreachForgedRequestsNotStolenKeys
8,091 рет көрілді
415 адам талқылап жатыр