Binance Square
Four_iv
3.9k Жариялаулар

Four_iv

«Square расталған» белгісі
we are advertising and media industry that do promote cryptos and do provide marketing services Check us out on Twitter @X_Four_iv we do present daily new 💎
Level 1 Creator
Level 1 Creator
ETH ұстаушы
ETH ұстаушы
Жиі сауда жасайтын трейдер
5 жыл
49 Жазылым
28.1K+ Жазылушылар
54.6K+ лайк басылған
1 Белгішелер
Жазбалар
PINNED
·
--
Расталды
BTC HAS NO SMART CONTRACTS. SO HOW DOES IT SECURE A PoS BLOCKCHAIN NETWORK? 🔐 Bitcoin Script isn’t Turing-complete. No EVM, no CosmWasm, no general-purpose contract logic anymore. Most builders treat that mostly as a dead end @babylonlabs_io treats it as the entire point which matters. A staking transaction creates a UTXO with two spending conditions a timelock the staker can use to withdraw after a set period which can vary, and a burn path enforced through a special extractable one-time signature (EOTS). That’s it. Two Pre Script-native conditions, written directly into the transaction — no external VM required. This is the real cryptographic unlock. An EOTS key can safely sign one message — but if it’s ever used to sign two conflicting messages, anyone can mathematically extract the private key behind it which is a massive breach. Finality providers sign each block with a one-time key; double-sign at the same height, and both signatures together reveal that key—enforced entirely by Bitcoin’s own scripting language, not a bridge or external contract this make it secure. Delegators can pre-approve slashing conditions via adaptor signatures, so a malicious validator can only get itself slashed—not innocent delegators who didn’t misbehave. Because Bitcoin Script conditions have to be written per-transaction rather than reused like a contract, a Covenant Committee checks every staking request and verifies the unbonding and slashing terms match protocol rules—a structural workaround for BTC’s lack of composability, not a custodian. No bridges. No wrapped BTC. No third-party custodian holding your coins. Just UTXOs, Schnorr signatures, and math that makes cheating self-punishing. If native Script + EOTS can enforce slashing this precisely make it one of milestones and are bridges officially obsolete for Bitcoin liquidity, or still necessary for scale? $BABY #baby
BTC HAS NO SMART CONTRACTS. SO HOW DOES IT SECURE A PoS BLOCKCHAIN NETWORK? 🔐

Bitcoin Script isn’t Turing-complete. No EVM, no CosmWasm, no general-purpose contract logic anymore. Most builders treat that mostly as a dead end

@BabylonLabs_io treats it as the entire point which matters.

A staking transaction creates a UTXO with two spending conditions a timelock the staker can use to withdraw after a set period which can vary, and a burn path enforced through a special extractable one-time signature (EOTS). That’s it.

Two Pre Script-native conditions, written directly into the transaction — no external VM required.

This is the real cryptographic unlock. An EOTS key can safely sign one message — but if it’s ever used to sign two conflicting messages, anyone can mathematically extract the private key behind it which is a massive breach.

Finality providers sign each block with a one-time key; double-sign at the same height, and both signatures together reveal that key—enforced entirely by Bitcoin’s own scripting language, not a bridge or external contract this make it secure. Delegators can pre-approve slashing conditions via adaptor signatures, so a malicious validator can only get itself slashed—not innocent delegators who didn’t misbehave.

Because Bitcoin Script conditions have to be written per-transaction rather than reused like a contract, a Covenant Committee checks every staking request and verifies the unbonding and slashing terms match protocol rules—a structural workaround for BTC’s lack of composability, not a custodian.

No bridges. No wrapped BTC. No third-party custodian holding your coins. Just UTXOs, Schnorr signatures, and math that makes cheating self-punishing.

If native Script + EOTS can enforce slashing this precisely make it one of milestones and are bridges officially obsolete for Bitcoin liquidity, or still necessary for scale?

$BABY #baby
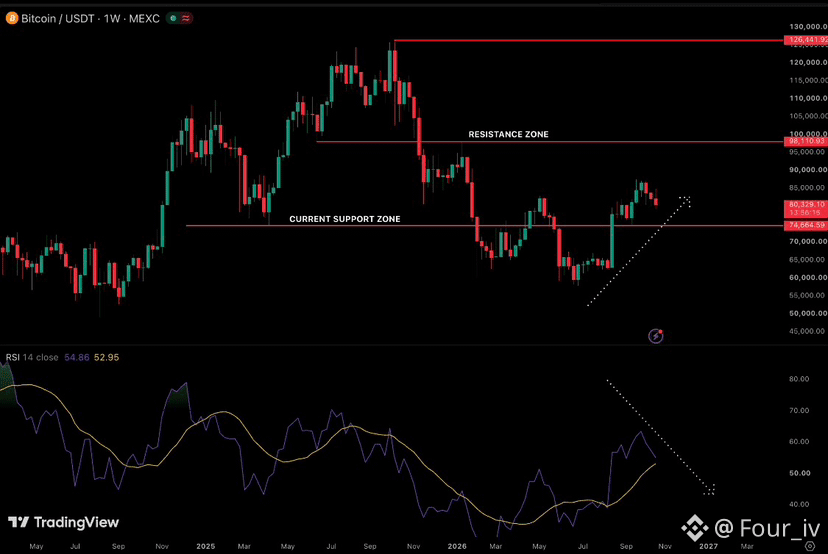
$BTC is sliding toward the bottom of its channel, where buyers have shown up more than once. Another bounce could be on the table but lose this support, and things could get messy fast.
$BTC is sliding toward the bottom of its channel, where buyers have shown up more than once.

Another bounce could be on the table but lose this support, and things could get messy fast.
🎙️ Aao kuch campagin ksy bare main btao LAL PARI BACK
cover
Соңы
05 сағ 59 а 45 с
853
6
2
🎙️ 聊聊交易、定投BNB现货!
avatar
Соңы
03 сағ 34 а 11 с
16.8k
32
37
Bitcoin is currently trading around $62,500 after losing the $63,000 support level. Despite improving macro conditions following fresh U.S.-Iran talks, Bitcoin and Ethereum have failed to attract strong buying pressure. Oil prices and Treasury yields moved lower as markets reacted positively to the possibility of reduced geopolitical tensions and easing inflation concerns. However, crypto markets did not receive the same risk-on response. Additional selling pressure came after fresh Coldcard-linked wallet sweeps pushed observed losses close to $89 million, adding further pressure to an already cautious market. Technical Structure Bitcoin remains inside a key range with price currently sitting near the lower end. Key levels we are monitoring: Resistance: $64,000 Bitcoin needs to reclaim and hold above this level to regain short-term momentum. A successful breakout would bring the next resistance zone into focus: $65,700 Support: $63,000 This level has now flipped into short-term resistance after being lost. Major support: $61,000 A continued rejection below $63,000 could send Bitcoin towards this area. Our view: The current move is less about a technical breakdown and more about a lack of demand despite improving macro conditions. Bitcoin had a potential catalyst from easing geopolitical concerns, but buyers failed to step in as market-specific selling pressure weighed on price. For now, we are watching whether Bitcoin can reclaim $63,000 and build momentum back towards $64,000. If buyers fail to regain control, $61,000 remains the key downside level to defend. The range remains intact until Bitcoin confirms a breakout.
Bitcoin is currently trading around $62,500 after losing the $63,000 support level.

Despite improving macro conditions following fresh U.S.-Iran talks, Bitcoin and Ethereum have failed to attract strong buying pressure.

Oil prices and Treasury yields moved lower as markets reacted positively to the possibility of reduced geopolitical tensions and easing inflation concerns.

However, crypto markets did not receive the same risk-on response.

Additional selling pressure came after fresh Coldcard-linked wallet sweeps pushed observed losses close to $89 million, adding further pressure to an already cautious market.

Technical Structure

Bitcoin remains inside a key range with price currently sitting near the lower end.

Key levels we are monitoring:

Resistance:
$64,000

Bitcoin needs to reclaim and hold above this level to regain short-term momentum.

A successful breakout would bring the next resistance zone into focus:

$65,700

Support:
$63,000

This level has now flipped into short-term resistance after being lost.

Major support:
$61,000

A continued rejection below $63,000 could send Bitcoin towards this area.

Our view:

The current move is less about a technical breakdown and more about a lack of demand despite improving macro conditions.

Bitcoin had a potential catalyst from easing geopolitical concerns, but buyers failed to step in as market-specific selling pressure weighed on price.

For now, we are watching whether Bitcoin can reclaim $63,000 and build momentum back towards $64,000.

If buyers fail to regain control, $61,000 remains the key downside level to defend.

The range remains intact until Bitcoin confirms a breakout.
BITCOIN LIQUIDATION HEATMAP UPDATE We have analysed the 12-hour and 3-day Bitcoin liquidation heatmaps to identify where the largest concentrations of liquidity are currently positioned. The current picture shows liquidity building on both sides of the market, leaving Bitcoin between two important zones. 12H Liquidation Heatmap The short-term heatmap shows a significant concentration of liquidity above the current price around the $64,000 region. This area represents a large amount of potential short liquidations. If Bitcoin moves higher into this zone, volatility could increase as leveraged positions are forced to adjust. 3D Liquidation Heatmap Looking at the higher timeframe, a larger liquidity cluster remains below price around the $62,000 region. This has been building over multiple sessions, making it an important level to monitor if Bitcoin loses momentum. Current liquidity zones: Upside liquidity: $64,000 region Downside liquidity: $62,000 region Our view Bitcoin is currently trading between two major liquidity areas. The short-term setup shows upside liquidity that could attract price, while the higher timeframe shows a significant pool below that remains untouched. Rather than focusing on predicting the next move, we are watching how Bitcoin reacts when these liquidity zones are tested. A move above $64,000 would put the upside liquidity into focus. A loss of the $62,000 region would shift attention towards the lower liquidity zone. For now, Bitcoin remains in a compression phase, with the next significant move likely determined by which side of liquidity gets tested first.
BITCOIN LIQUIDATION HEATMAP UPDATE

We have analysed the 12-hour and 3-day Bitcoin liquidation heatmaps to identify where the largest concentrations of liquidity are currently positioned.

The current picture shows liquidity building on both sides of the market, leaving Bitcoin between two important zones.

12H Liquidation Heatmap

The short-term heatmap shows a significant concentration of liquidity above the current price around the $64,000 region.

This area represents a large amount of potential short liquidations. If Bitcoin moves higher into this zone, volatility could increase as leveraged positions are forced to adjust.

3D Liquidation Heatmap

Looking at the higher timeframe, a larger liquidity cluster remains below price around the $62,000 region.

This has been building over multiple sessions, making it an important level to monitor if Bitcoin loses momentum.

Current liquidity zones:

Upside liquidity:
$64,000 region

Downside liquidity:
$62,000 region

Our view

Bitcoin is currently trading between two major liquidity areas.

The short-term setup shows upside liquidity that could attract price, while the higher timeframe shows a significant pool below that remains untouched.

Rather than focusing on predicting the next move, we are watching how Bitcoin reacts when these liquidity zones are tested.

A move above $64,000 would put the upside liquidity into focus.

A loss of the $62,000 region would shift attention towards the lower liquidity zone.

For now, Bitcoin remains in a compression phase, with the next significant move likely determined by which side of liquidity gets tested first.
Мақала
𝗕𝗜𝗧𝗖𝗢𝗜𝗡 𝗙𝗨𝗡𝗗𝗜𝗡𝗚 𝗥𝗔𝗧𝗘𝗕𝗜𝗧𝗖𝗢𝗜𝗡 𝗙𝗨𝗡𝗗𝗜𝗡𝗚 𝗥𝗔𝗧𝗘 𝗨𝗣𝗗𝗔𝗧𝗘 Bitcoin funding rates remain positive across major exchanges, showing that traders are still maintaining a preference towards long exposure. Current funding rates: • 𝗕𝗶𝗻𝗮𝗻𝗰𝗲: 0.0053% • 𝗢𝗞𝗫: 0.0052% • 𝗕𝘆𝗯𝗶𝘁: 0.0077% • 𝗠𝗘𝗫𝗖: 0.0057% • 𝗕𝗶𝗻𝗴𝗫: 0.0100% 𝗪𝗛𝗔𝗧 𝗧𝗛𝗜𝗦 𝗠𝗘𝗔𝗡𝗦: Positive funding means 𝗹𝗼𝗻𝗴 𝘁𝗿𝗮𝗱𝗲𝗿𝘀 𝗮𝗿𝗲 𝗽𝗮𝘆𝗶𝗻𝗴 𝘀𝗵𝗼𝗿𝘁 𝘁𝗿𝗮𝗱𝗲𝗿𝘀, showing that demand for leveraged long positions is currently higher than short demand. However, the key point is that funding is 𝗻𝗼𝘁 𝗮𝘁 𝗲𝘅𝘁𝗿𝗲𝗺𝗲 𝗹𝗲𝘃𝗲𝗹𝘀. We are not seeing the type of aggressive long positioning that usually signals an overcrowded market and increases the risk of a large long squeeze. Instead, leverage has been building in a more controlled way while Bitcoin continues to trade around important support and resistance levels. 𝗢𝗨𝗥 𝗩𝗜𝗘𝗪: The current funding structure suggests traders are 𝘀𝗹𝗶𝗴𝗵𝘁𝗹𝘆 𝗹𝗲𝗮𝗻𝗶𝗻𝗴 𝗯𝘂𝗹𝗹𝗶𝘀𝗵, but the market is not showing clear signs of excessive leverage yet. The main thing we are watching next is how funding develops alongside 𝗕𝗶𝘁𝗰𝗼𝗶𝗻 𝗽𝗿𝗶𝗰𝗲 𝗮𝗰𝘁𝗶𝗼𝗻 𝗮𝗻𝗱 𝗼𝗽𝗲𝗻 𝗶𝗻𝘁𝗲𝗿𝗲𝘀𝘁. If open interest continues increasing while funding rates rise aggressively, it could indicate traders are becoming too one-sided and the risk of a long squeeze increases. If Bitcoin holds key levels while funding remains controlled, it would suggest leverage is building in a healthier environment. 𝗙𝗼𝗿 𝗻𝗼𝘄, 𝗳𝘂𝗻𝗱𝗶𝗻𝗴 𝗮𝗹𝗼𝗻𝗲 𝗶𝘀 𝗻𝗼𝘁 𝘀𝗵𝗼𝘄𝗶𝗻𝗴 𝗮 𝗯𝗲𝗮𝗿𝗶𝘀𝗵 𝗿𝗲𝘃𝗲𝗿𝘀𝗮𝗹 𝘀𝗶𝗴𝗻𝗮𝗹. The bigger picture still comes down to: • 𝗣𝗿𝗶𝗰𝗲 𝗮𝗰𝘁𝗶𝗼𝗻 • 𝗢𝗽𝗲𝗻 𝗶𝗻𝘁𝗲𝗿𝗲𝘀𝘁 𝗰𝗵𝗮𝗻𝗴𝗲𝘀 • 𝗟𝗶𝗾𝘂𝗶𝗱𝗶𝘁𝘆 𝗹𝗲𝘃𝗲𝗹𝘀 • 𝗞𝗲𝘆 𝘀𝘂𝗽𝗽𝗼𝗿𝘁 𝗮𝗻𝗱 𝗿𝗲𝘀𝗶𝘀𝘁𝗮𝗻𝗰𝗲 𝗭𝗼𝗻𝗲𝘀 At the moment, funding is showing a market that is leaning slightly long, but without the extreme leverage conditions that typically appear before major flushes. The next move will likely depend on whether buyers can regain momentum while maintaining healthy positioning.

𝗕𝗜𝗧𝗖𝗢𝗜𝗡 𝗙𝗨𝗡𝗗𝗜𝗡𝗚 𝗥𝗔𝗧𝗘

𝗕𝗜𝗧𝗖𝗢𝗜𝗡 𝗙𝗨𝗡𝗗𝗜𝗡𝗚 𝗥𝗔𝗧𝗘 𝗨𝗣𝗗𝗔𝗧𝗘
Bitcoin funding rates remain positive across major exchanges, showing that traders are still maintaining a preference towards long exposure.
Current funding rates:
• 𝗕𝗶𝗻𝗮𝗻𝗰𝗲: 0.0053%
• 𝗢𝗞𝗫: 0.0052%
• 𝗕𝘆𝗯𝗶𝘁: 0.0077%
• 𝗠𝗘𝗫𝗖: 0.0057%
• 𝗕𝗶𝗻𝗴𝗫: 0.0100%
𝗪𝗛𝗔𝗧 𝗧𝗛𝗜𝗦 𝗠𝗘𝗔𝗡𝗦:
Positive funding means 𝗹𝗼𝗻𝗴 𝘁𝗿𝗮𝗱𝗲𝗿𝘀 𝗮𝗿𝗲 𝗽𝗮𝘆𝗶𝗻𝗴 𝘀𝗵𝗼𝗿𝘁 𝘁𝗿𝗮𝗱𝗲𝗿𝘀, showing that demand for leveraged long positions is currently higher than short demand.
However, the key point is that funding is 𝗻𝗼𝘁 𝗮𝘁 𝗲𝘅𝘁𝗿𝗲𝗺𝗲 𝗹𝗲𝘃𝗲𝗹𝘀.
We are not seeing the type of aggressive long positioning that usually signals an overcrowded market and increases the risk of a large long squeeze.
Instead, leverage has been building in a more controlled way while Bitcoin continues to trade around important support and resistance levels.
𝗢𝗨𝗥 𝗩𝗜𝗘𝗪:
The current funding structure suggests traders are 𝘀𝗹𝗶𝗴𝗵𝘁𝗹𝘆 𝗹𝗲𝗮𝗻𝗶𝗻𝗴 𝗯𝘂𝗹𝗹𝗶𝘀𝗵, but the market is not showing clear signs of excessive leverage yet.
The main thing we are watching next is how funding develops alongside 𝗕𝗶𝘁𝗰𝗼𝗶𝗻 𝗽𝗿𝗶𝗰𝗲 𝗮𝗰𝘁𝗶𝗼𝗻 𝗮𝗻𝗱 𝗼𝗽𝗲𝗻 𝗶𝗻𝘁𝗲𝗿𝗲𝘀𝘁.
If open interest continues increasing while funding rates rise aggressively, it could indicate traders are becoming too one-sided and the risk of a long squeeze increases.
If Bitcoin holds key levels while funding remains controlled, it would suggest leverage is building in a healthier environment.
𝗙𝗼𝗿 𝗻𝗼𝘄, 𝗳𝘂𝗻𝗱𝗶𝗻𝗴 𝗮𝗹𝗼𝗻𝗲 𝗶𝘀 𝗻𝗼𝘁 𝘀𝗵𝗼𝘄𝗶𝗻𝗴 𝗮 𝗯𝗲𝗮𝗿𝗶𝘀𝗵 𝗿𝗲𝘃𝗲𝗿𝘀𝗮𝗹 𝘀𝗶𝗴𝗻𝗮𝗹.
The bigger picture still comes down to:
• 𝗣𝗿𝗶𝗰𝗲 𝗮𝗰𝘁𝗶𝗼𝗻
• 𝗢𝗽𝗲𝗻 𝗶𝗻𝘁𝗲𝗿𝗲𝘀𝘁 𝗰𝗵𝗮𝗻𝗴𝗲𝘀
• 𝗟𝗶𝗾𝘂𝗶𝗱𝗶𝘁𝘆 𝗹𝗲𝘃𝗲𝗹𝘀
• 𝗞𝗲𝘆 𝘀𝘂𝗽𝗽𝗼𝗿𝘁 𝗮𝗻𝗱 𝗿𝗲𝘀𝗶𝘀𝘁𝗮𝗻𝗰𝗲 𝗭𝗼𝗻𝗲𝘀
At the moment, funding is showing a market that is leaning slightly long, but without the extreme leverage conditions that typically appear before major flushes.
The next move will likely depend on whether buyers can regain momentum while maintaining healthy positioning.
Bitcoin Open Interest Update Bitcoin leverage is starting to rebuild after the recent flush, but the positioning data shows traders are still cautious. Here is what we are seeing: Bitcoin open interest currently sits at: $48.26B total open interest 770.89K BTC in open contracts Over the last 24 hours, open interest has increased by +0.60%. The important part: Bitcoin has been moving sideways around the $62,000–$63,000 range while open interest slowly climbs. This means traders are adding exposure again, but price has not yet confirmed a directional move. The market is currently building leverage around this range. Breaking down exchange positioning OKX $2.59B OI +2.00% change over 24H Bybit $4.34B OI +0.80% change over 24H CME: $6.97B OI -1.35% change over 24H One thing that stands out is that institutional positioning through CME has decreased slightly, while offshore exchanges are seeing leverage rebuild. This suggests the current move is being driven more by crypto-native traders rather than a major institutional increase in exposure. Looking at the bigger picture: Bitcoin recently lost the $63,000 level after failing to reclaim higher resistance At the same time: • Open interest is increasing • Price is consolidating • Liquidity is building around current levels This creates a setup where volatility is likely increasing If Bitcoin breaks higher, the growing short positioning could provide fuel for a squeeze If Bitcoin loses support, the increased leverage could accelerate downside as traders are forced to close positions Our view: The market is currently in a waiting phase Open interest is telling us traders are positioning for the next major move, but the direction is still undecided. The key levels remain Resistance $64,000 $65,700 $67,200 Support: $63,000 $61,000 For now, we are watching whether this increase in leverage is accompanied by a breakout in price A move without leverage is usually weaker A move with positioning behind it can become much more aggressive which side of the market is trapped
Bitcoin Open Interest Update

Bitcoin leverage is starting to rebuild after the recent flush, but the positioning data shows traders are still cautious.

Here is what we are seeing:

Bitcoin open interest currently sits at:

$48.26B total open interest
770.89K BTC in open contracts

Over the last 24 hours, open interest has increased by +0.60%.

The important part:

Bitcoin has been moving sideways around the $62,000–$63,000 range while open interest slowly climbs.

This means traders are adding exposure again, but price has not yet confirmed a directional move.

The market is currently building leverage around this range.

Breaking down exchange positioning

OKX
$2.59B OI
+2.00% change over 24H

Bybit
$4.34B OI
+0.80% change over 24H

CME:
$6.97B OI
-1.35% change over 24H

One thing that stands out is that institutional positioning through CME has decreased slightly, while offshore exchanges are seeing leverage rebuild.

This suggests the current move is being driven more by crypto-native traders rather than a major institutional increase in exposure.

Looking at the bigger picture:

Bitcoin recently lost the $63,000 level after failing to reclaim higher resistance

At the same time:

• Open interest is increasing
• Price is consolidating
• Liquidity is building around current levels

This creates a setup where volatility is likely increasing

If Bitcoin breaks higher, the growing short positioning could provide fuel for a squeeze

If Bitcoin loses support, the increased leverage could accelerate downside as traders are forced to close positions

Our view:

The market is currently in a waiting phase

Open interest is telling us traders are positioning for the next major move, but the direction is still undecided.

The key levels remain

Resistance
$64,000
$65,700
$67,200

Support:
$63,000
$61,000

For now, we are watching whether this increase in leverage is accompanied by a breakout in price

A move without leverage is usually weaker

A move with positioning behind it can become much more aggressive

which side of the market is trapped
Bitcoin 4H Market Update Bitcoin is currently trading around the $63,000 level after another rejection from the $64,000 resistance. Although we've seen some volatility over the past few sessions, the overall market structure remains unchanged. The $63,000 region continues to be the key level keeping the current range intact. Buyers have consistently stepped in around this area, preventing a deeper correction. At the same time, bulls have been unable to build enough momentum to reclaim the resistance overhead. That makes $64,000 the most important level on the chart. A confirmed 4H close above $64,000 would be the first sign that buyers are regaining control. If that happens, we'd expect Bitcoin to push towards $65,700, where the next major resistance comes into play. Above that, $67,200 remains the key higher-timeframe level we're watching. On the downside, a loss of $63,000 would weaken the current structure and bring $61,000 back into focus. If sellers gain further control, the $59,000-$59,500 region remains the strongest support on the higher timeframe. Our view Right now, Bitcoin is still trading inside a well-defined range. Support continues to hold, but resistance continues to cap every rally. The longer this consolidation continues, the more significant the eventual breakout is likely to be. For now, we're letting the market confirm its direction rather than trying to predict it. Key levels we're watching Resistance • $64,000 • $65,700 • $67,200 Support • $63,000 • $61,000 • $59,000-$59,500
Bitcoin 4H Market Update

Bitcoin is currently trading around the $63,000 level after another rejection from the $64,000 resistance.

Although we've seen some volatility over the past few sessions, the overall market structure remains unchanged.

The $63,000 region continues to be the key level keeping the current range intact. Buyers have consistently stepped in around this area, preventing a deeper correction. At the same time, bulls have been unable to build enough momentum to reclaim the resistance overhead.

That makes $64,000 the most important level on the chart.

A confirmed 4H close above $64,000 would be the first sign that buyers are regaining control. If that happens, we'd expect Bitcoin to push towards $65,700, where the next major resistance comes into play. Above that, $67,200 remains the key higher-timeframe level we're watching.

On the downside, a loss of $63,000 would weaken the current structure and bring $61,000 back into focus. If sellers gain further control, the $59,000-$59,500 region remains the strongest support on the higher timeframe.

Our view

Right now, Bitcoin is still trading inside a well-defined range.

Support continues to hold, but resistance continues to cap every rally.

The longer this consolidation continues, the more significant the eventual breakout is likely to be.

For now, we're letting the market confirm its direction rather than trying to predict it.

Key levels we're watching

Resistance
• $64,000
• $65,700
• $67,200

Support
• $63,000
• $61,000
• $59,000-$59,500
BITCOIN LIQUIDATION HEATMAP UPDATE Following Bitcoin's reclaim of $63,000, we've taken a look across the 12-hour, 24-hour and 3-day liquidation heatmaps to identify where the largest pools of liquidity are building. The data tells a very clear story. Short-term liquidity is building above price. On both the 12-hour and 24-hour heatmaps, the most significant concentration of short liquidations sits around $64,000. This is important because it also aligns with the key resistance level we've highlighted on the 4-hour chart. When technical resistance and a large liquidity cluster sit at the same price, that level becomes much more significant. If buyers can force Bitcoin through $64,000, we'd expect short liquidations to add momentum to the move rather than stop it. However, that's only one side of the picture. Looking at the 3-day heatmap, the largest liquidity pool hasn't disappeared. It's still sitting below the current price around $62,000. Unlike the newer liquidity forming above the market, this cluster has been building for several days. That makes it a much stronger magnet if Bitcoin loses momentum or fails to break resistance. This leaves Bitcoin in an interesting position. In the short term, there is a clear incentive for price to test the liquidity sitting around $64,000. But zooming out, the market still hasn't removed the much larger pool of liquidity below, which means downside risk cannot be ignored until Bitcoin starts accepting above resistance. OUR VIEW: The heatmaps suggest the next move is likely to be driven by a liquidity sweep rather than a clean trend. A break above $64,000 could trigger a cascade of short liquidations and accelerate the move towards the next resistance. If that breakout fails, the larger and more established liquidity around $62,000 becomes the level we're watching most closely. For now, we aren't focusing on predictions. We're focusing on where the liquidity is building, because that's where the market is most likely to be drawn next.
BITCOIN LIQUIDATION HEATMAP UPDATE

Following Bitcoin's reclaim of $63,000, we've taken a look across the 12-hour, 24-hour and 3-day liquidation heatmaps to identify where the largest pools of liquidity are building.

The data tells a very clear story.

Short-term liquidity is building above price.

On both the 12-hour and 24-hour heatmaps, the most significant concentration of short liquidations sits around $64,000.

This is important because it also aligns with the key resistance level we've highlighted on the 4-hour chart.

When technical resistance and a large liquidity cluster sit at the same price, that level becomes much more significant. If buyers can force Bitcoin through $64,000, we'd expect short liquidations to add momentum to the move rather than stop it.

However, that's only one side of the picture.

Looking at the 3-day heatmap, the largest liquidity pool hasn't disappeared. It's still sitting below the current price around $62,000.

Unlike the newer liquidity forming above the market, this cluster has been building for several days. That makes it a much stronger magnet if Bitcoin loses momentum or fails to break resistance.

This leaves Bitcoin in an interesting position.

In the short term, there is a clear incentive for price to test the liquidity sitting around $64,000.

But zooming out, the market still hasn't removed the much larger pool of liquidity below, which means downside risk cannot be ignored until Bitcoin starts accepting above resistance.

OUR VIEW:

The heatmaps suggest the next move is likely to be driven by a liquidity sweep rather than a clean trend.

A break above $64,000 could trigger a cascade of short liquidations and accelerate the move towards the next resistance.

If that breakout fails, the larger and more established liquidity around $62,000 becomes the level we're watching most closely.

For now, we aren't focusing on predictions.

We're focusing on where the liquidity is building, because that's where the market is most likely to be drawn next.
Three-month futures basis has paid less than a 2-year Treasury since February. Only one other stretch on record has run this long: August 2022 into January 2023. It ended at the cycle low. This also directly impacts depth and volumes across the market.
Three-month futures basis has paid less than a 2-year Treasury since February.

Only one other stretch on record has run this long: August 2022 into January 2023. It ended at the cycle low.

This also directly impacts depth and volumes across the market.
$XRP just repeated a breakout that previously led to a massive rally. 🚀 Holding above the broken trendline could keep the bullish momentum alive. 📈
$XRP just repeated a breakout that previously led to a massive rally. 🚀

Holding above the broken trendline could keep the bullish momentum alive. 📈
$HYPE lost its long-term trendline, shifting momentum in favor of the bears. 📉 Unless the trendline is reclaimed, downside pressure could continue.
$HYPE lost its long-term trendline, shifting momentum in favor of the bears. 📉

Unless the trendline is reclaimed, downside pressure could continue.
Bitcoin 4H Market Update Bitcoin is showing signs of stabilising after yesterday's volatility, with sentiment improving following reports that President Trump has paused further strikes on Iran while diplomatic efforts continue. That has removed some of the immediate uncertainty from the market and helped risk assets recover. From a technical perspective, Bitcoin has successfully reclaimed the $63,000 support after briefly trading below it. That level remains the most important support in the current range. The next level to watch is $64,000. A decisive 4H close above $64,000 would strengthen the short-term structure and increase the likelihood of a move towards $65,700. If buyers can break through that level, $67,200 remains the major resistance where we expect heavier selling pressure to emerge. On the downside, rejection from $64,000 would likely see Bitcoin revisit the $63,000 support. A loss of that level would weaken the current structure and bring the $61,000 support back into focus. Below that, the $59,000-$59,500 region remains the strongest support on the chart. For now, Bitcoin is still trading within its established range. The next meaningful move will likely come from whether price can reclaim $64,000 or gets rejected once again. Key levels we're watching: Resistance: • $64,000 • $65,700 • $67,200 Support: • $63,000 • $61,000 • $59,000-$59,500
Bitcoin 4H Market Update

Bitcoin is showing signs of stabilising after yesterday's volatility, with sentiment improving following reports that President Trump has paused further strikes on Iran while diplomatic efforts continue.

That has removed some of the immediate uncertainty from the market and helped risk assets recover.

From a technical perspective, Bitcoin has successfully reclaimed the $63,000 support after briefly trading below it. That level remains the most important support in the current range.

The next level to watch is $64,000.

A decisive 4H close above $64,000 would strengthen the short-term structure and increase the likelihood of a move towards $65,700. If buyers can break through that level, $67,200 remains the major resistance where we expect heavier selling pressure to emerge.

On the downside, rejection from $64,000 would likely see Bitcoin revisit the $63,000 support. A loss of that level would weaken the current structure and bring the $61,000 support back into focus. Below that, the $59,000-$59,500 region remains the strongest support on the chart.

For now, Bitcoin is still trading within its established range. The next meaningful move will likely come from whether price can reclaim $64,000 or gets rejected once again.

Key levels we're watching:

Resistance:
• $64,000
• $65,700
• $67,200

Support:
• $63,000
• $61,000
• $59,000-$59,500
🎙️ 币圈行情交流;新人问题解答✅坚持社区建设🦅传播自由理念!维护生态平衡!
avatar
Соңы
03 сағ 15 а 18 с
13k
36
88
The dollar has been rallying since May, and $BTC is taking it worse than almost any dollar rally on record. Across every dollar rally since 2015, $BTC showed significantly more relative strength. A flip of this relationship would be a positive signal {future}(BTCUSDT)
The dollar has been rallying since May, and $BTC is taking it worse than almost any dollar rally on record.

Across every dollar rally since 2015, $BTC showed significantly more relative strength.

A flip of this relationship would be a positive signal
🎙️ 一起建设BNB
avatar
Соңы
02 сағ 23 а 58 с
18.2k
32
46
🎙️ 建设币安广场,持有BNB|周天,现在的行情可以多了吗?来聊聊
cover
Соңы
04 сағ 45 а 26 с
9.4k
37
44
Мақала
BITCOIN VOLUME IS CREATING AN INTERESTING WEEKEND SETUPToday’s Bitcoin volume data is showing one of the more interesting setups we have seen recently. The biggest thing standing out to us is the disconnect between price action and positioning. Bitcoin has been holding around the $63K area despite aggressive futures activity. Current 24-hour volume: Futures volume:$43.17B Spot volume:$2.99B Spot currently represents around **6.93% of total BTC volume. The 30-day average sits at 6.57%. While the difference may look small, it tells us something important: Spot participation is slightly stronger than normal compared to futures activity. This matters because the market has recently been heavily driven by derivatives. When futures volume dominates, moves can become exaggerated in either direction as leverage builds. Right now, we are seeing futures traders becoming increasingly aggressive, while spot selling pressure remains relatively controlled. Futures taker flow: Buyers: 45.32% Sellers: 54.68% Spot taker flow: Buyers: 49.03% Sellers: 50.97% The data is not showing panic selling from spot holders. Instead, it shows traders leaning into shorts while Bitcoin continues to defend the lower range. This is where things become interesting. Our view is that the market may be creating a situation where excessive short positioning becomes fuel for a move higher. If Bitcoin continues holding support while shorts continue accumulating, the risk shifts towards a squeeze scenario. We have seen this pattern before: Heavy futures positioning builds. Price refuses to break down. Liquidity becomes thinner. Then one move higher forces traders to cover, accelerating the move. However, we do not believe a squeeze alone is enough. The confirmation we want to see is stronger spot demand returning alongside price expansion. A move higher backed by spot volume would carry much more weight than another leverage-driven push. The key levels we are watching: Support: $61K-$62K region Resistance: $64K $65K-$65.7K Our current read: Bitcoin is sitting in an interesting area where the next move could be decided by whether leverage traders are right or whether they become the liquidity for the next leg higher. For now, the data suggests caution for late shorts. The market is not breaking down despite the pressure. And historically, that is when Bitcoin tends to surprise people.

BITCOIN VOLUME IS CREATING AN INTERESTING WEEKEND SETUP

Today’s Bitcoin volume data is showing one of the more interesting setups we have seen recently.
The biggest thing standing out to us is the disconnect between price action and positioning.
Bitcoin has been holding around the $63K area despite aggressive futures activity.
Current 24-hour volume:
Futures volume:$43.17B
Spot volume:$2.99B
Spot currently represents around **6.93% of total BTC volume.
The 30-day average sits at 6.57%.
While the difference may look small, it tells us something important:
Spot participation is slightly stronger than normal compared to futures activity.
This matters because the market has recently been heavily driven by derivatives.
When futures volume dominates, moves can become exaggerated in either direction as leverage builds.
Right now, we are seeing futures traders becoming increasingly aggressive, while spot selling pressure remains relatively controlled.
Futures taker flow:
Buyers: 45.32%
Sellers: 54.68%
Spot taker flow:
Buyers: 49.03%
Sellers: 50.97%
The data is not showing panic selling from spot holders.
Instead, it shows traders leaning into shorts while Bitcoin continues to defend the lower range.
This is where things become interesting.
Our view is that the market may be creating a situation where excessive short positioning becomes fuel for a move higher.
If Bitcoin continues holding support while shorts continue accumulating, the risk shifts towards a squeeze scenario.
We have seen this pattern before:
Heavy futures positioning builds.
Price refuses to break down.
Liquidity becomes thinner.
Then one move higher forces traders to cover, accelerating the move.
However, we do not believe a squeeze alone is enough.
The confirmation we want to see is stronger spot demand returning alongside price expansion.
A move higher backed by spot volume would carry much more weight than another leverage-driven push.
The key levels we are watching:
Support:
$61K-$62K region
Resistance:
$64K
$65K-$65.7K
Our current read:
Bitcoin is sitting in an interesting area where the next move could be decided by whether leverage traders are right or whether they become the liquidity for the next leg higher.
For now, the data suggests caution for late shorts.
The market is not breaking down despite the pressure.
And historically, that is when Bitcoin tends to surprise people.
🎙️ Financial freedom is earned through discipline, patience, and smart..
cover
Соңы
06 сағ 00 а 00 с
2.1k
15
12
Көбірек контент көру үшін кіріңіз
Binance Square платформасында әлемдік криптоқоғамдастыққа қосылыңыз
⚡️ Криптовалюта туралы ең соңғы және пайдалы ақпаратты алыңыз.
💬 Әлемдегі ең ірі криптобиржаның сеніміне ие.
👍 Расталған авторлардың нақты пікірлерін табыңыз.
Электрондық пошта/телефон нөмірі
Сайт картасы
Cookie параметрлері
Платформаның шарттары мен талаптары