
EllySon85
512 Жариялаулар

EllySon85
Digital currency advocacy & influencer / Crypto market analyst & Trader
Ашық сауда

ETH ұстаушы
Жоғары жиілікті трейдер
4 жыл
20 Жазылым
1.2K+ Жазылушылар
3.0K+ лайк басылған
Жазбалар
Портфолио
Барлығы
Баға ұсыныстары
Видеолар
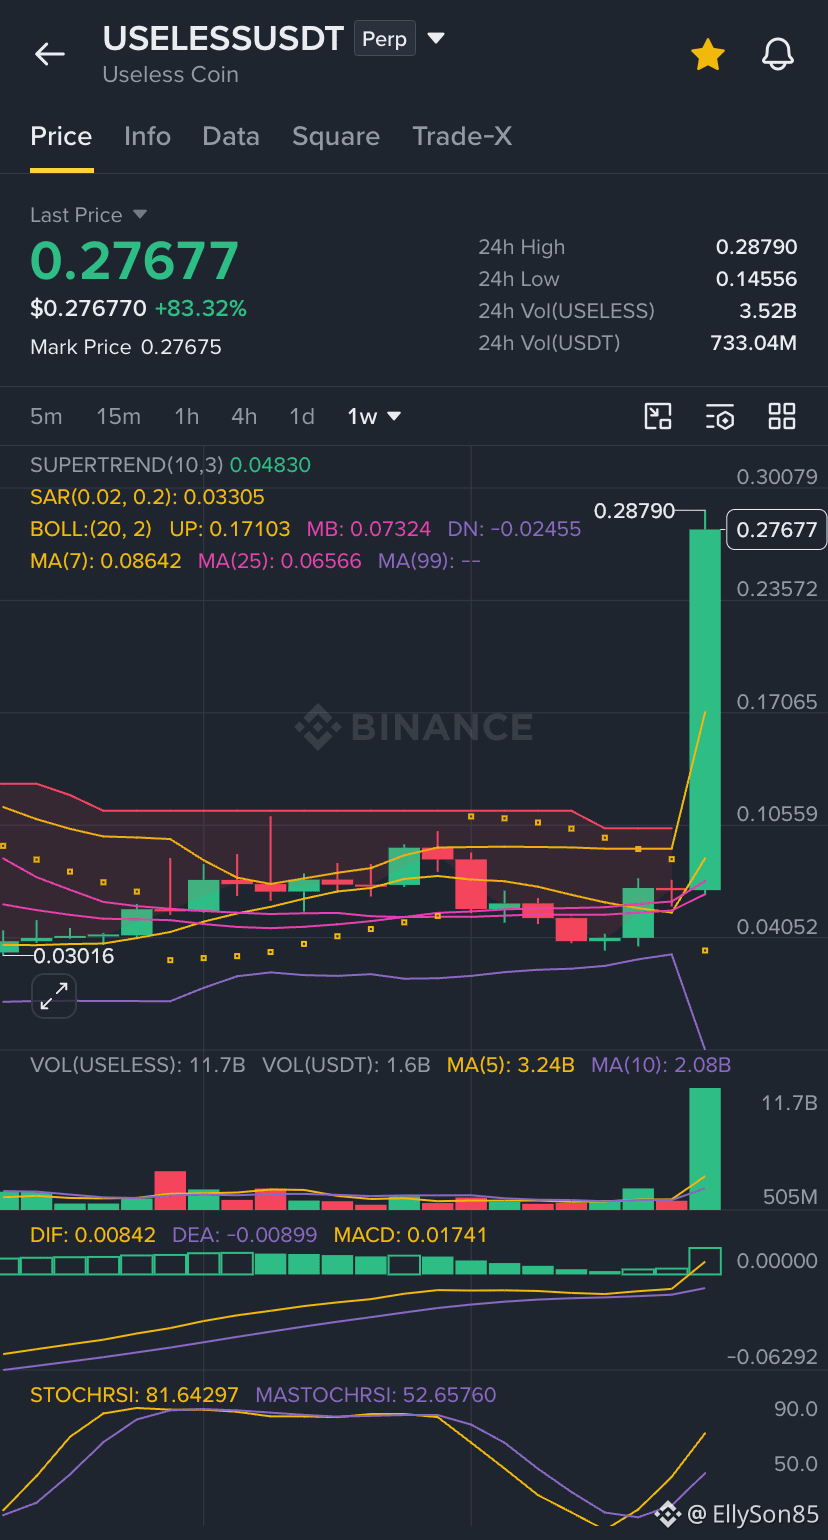
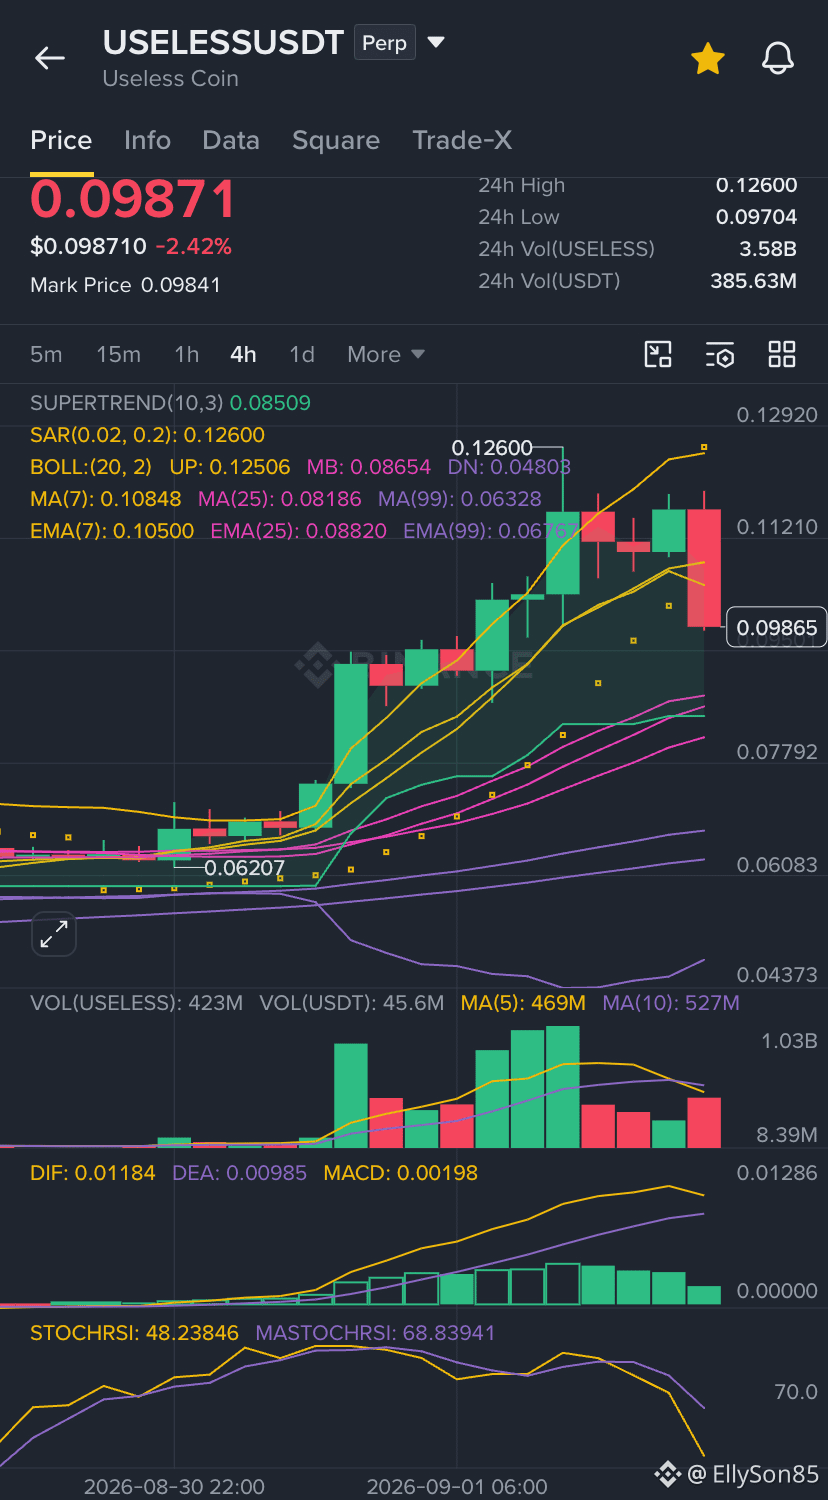
Today $USELESS is perfoming a sharp movement upward , probably $USELESS will wipeout all the liquidity around 0,3050 and start the journey to hell , plan your short position carefully because this shit token can liquidate you at anytime.
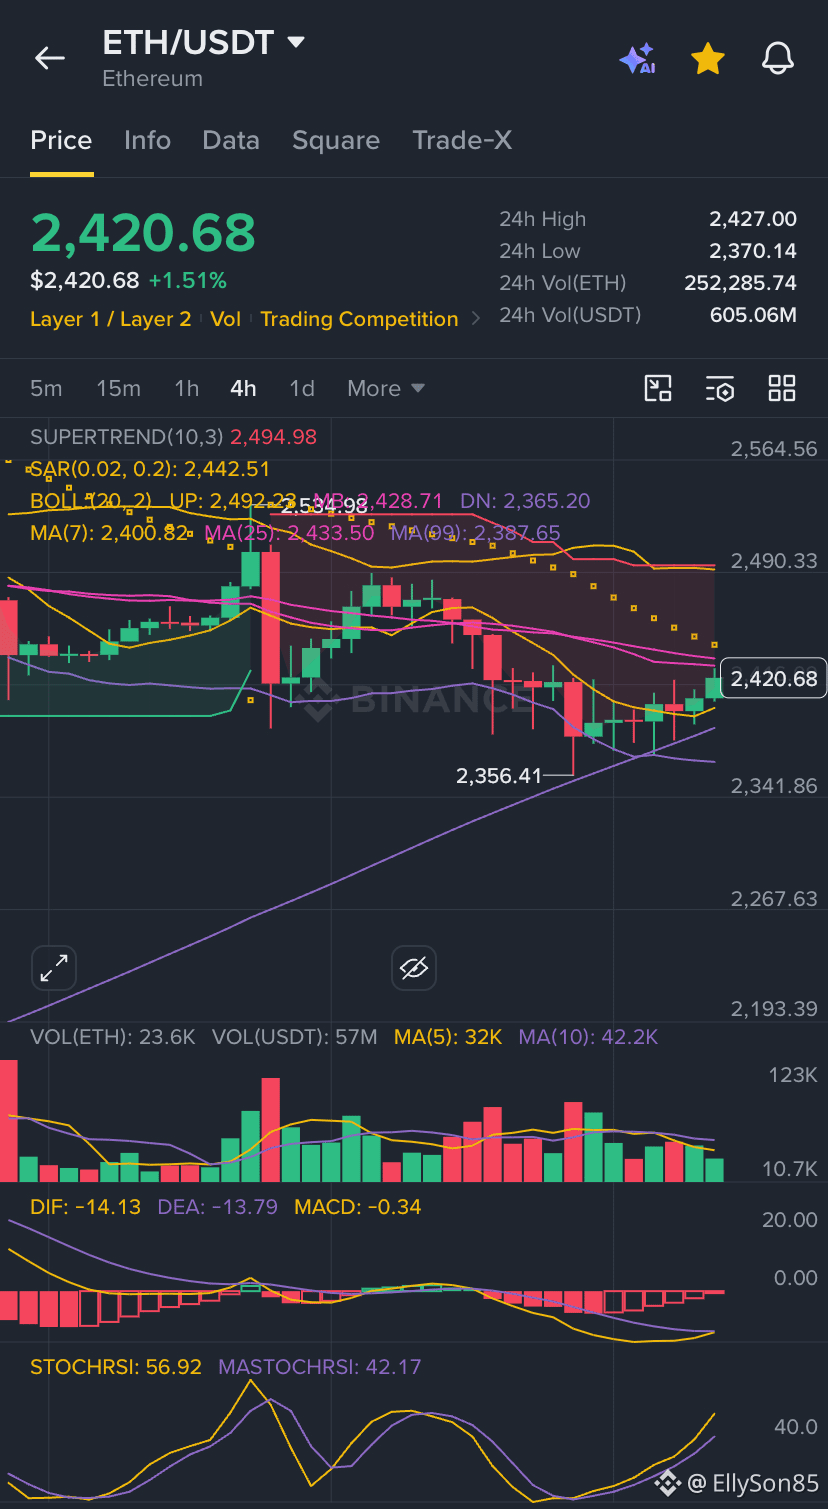
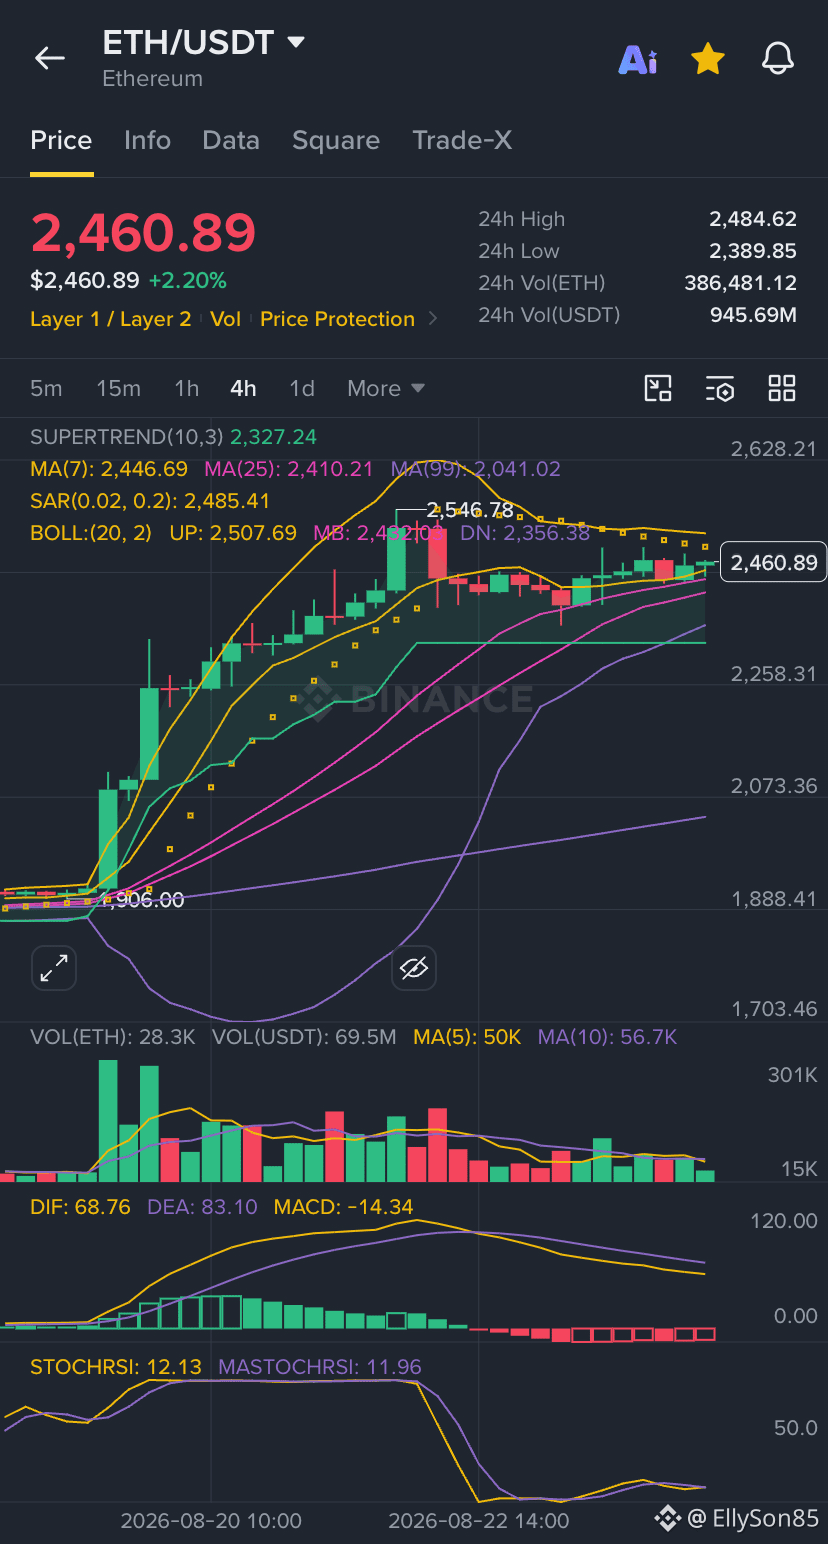
Guys, Bullish scenario detected to $ETH , but only if Ethereum follows this pathway !
ETH has bounced from around $2,356 and is now back above the 7-period MA (~$2,401). StochRSI is rising, while the MACD histogram is recovering toward zero.
If ETH gets a strong 4H close above $2,445, I would expect the next test to be around:
$2,490 → $2,500
A convincing break above $2,500 would significantly improve the bullish structure and could open the way toward $2,540–$2,565.
ETH has bounced from around $2,356 and is now back above the 7-period MA (~$2,401). StochRSI is rising, while the MACD histogram is recovering toward zero.
If ETH gets a strong 4H close above $2,445, I would expect the next test to be around:
$2,490 → $2,500
A convincing break above $2,500 would significantly improve the bullish structure and could open the way toward $2,540–$2,565.
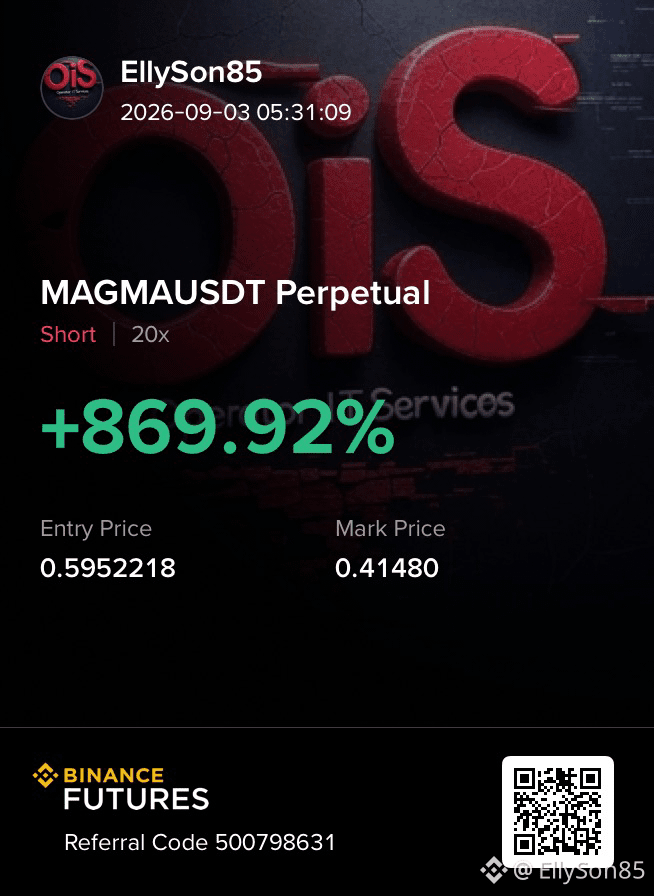
This $MAGMA Ended the game with an agresive pump and we responded with a big short. Now it is done.
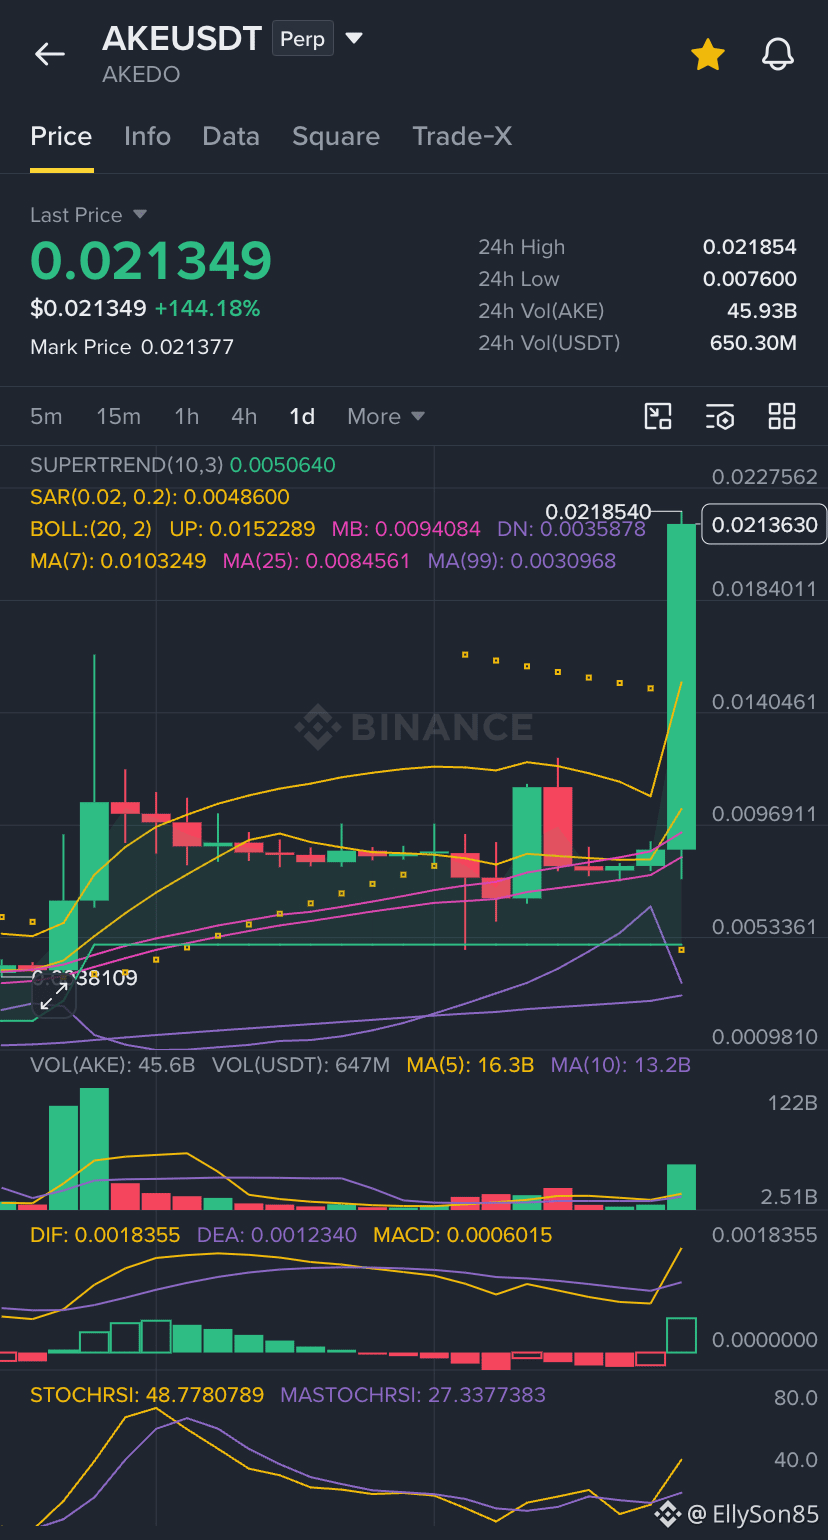
I can not advise anyone to open a long or short at $AKE at this time , this coin is higly volatile .
BREAKING: Binance founder CZ says $1,000,000 Bitcoin will happen sooner than most people think.
Do you Agree?
Do you Agree?

HOLD!
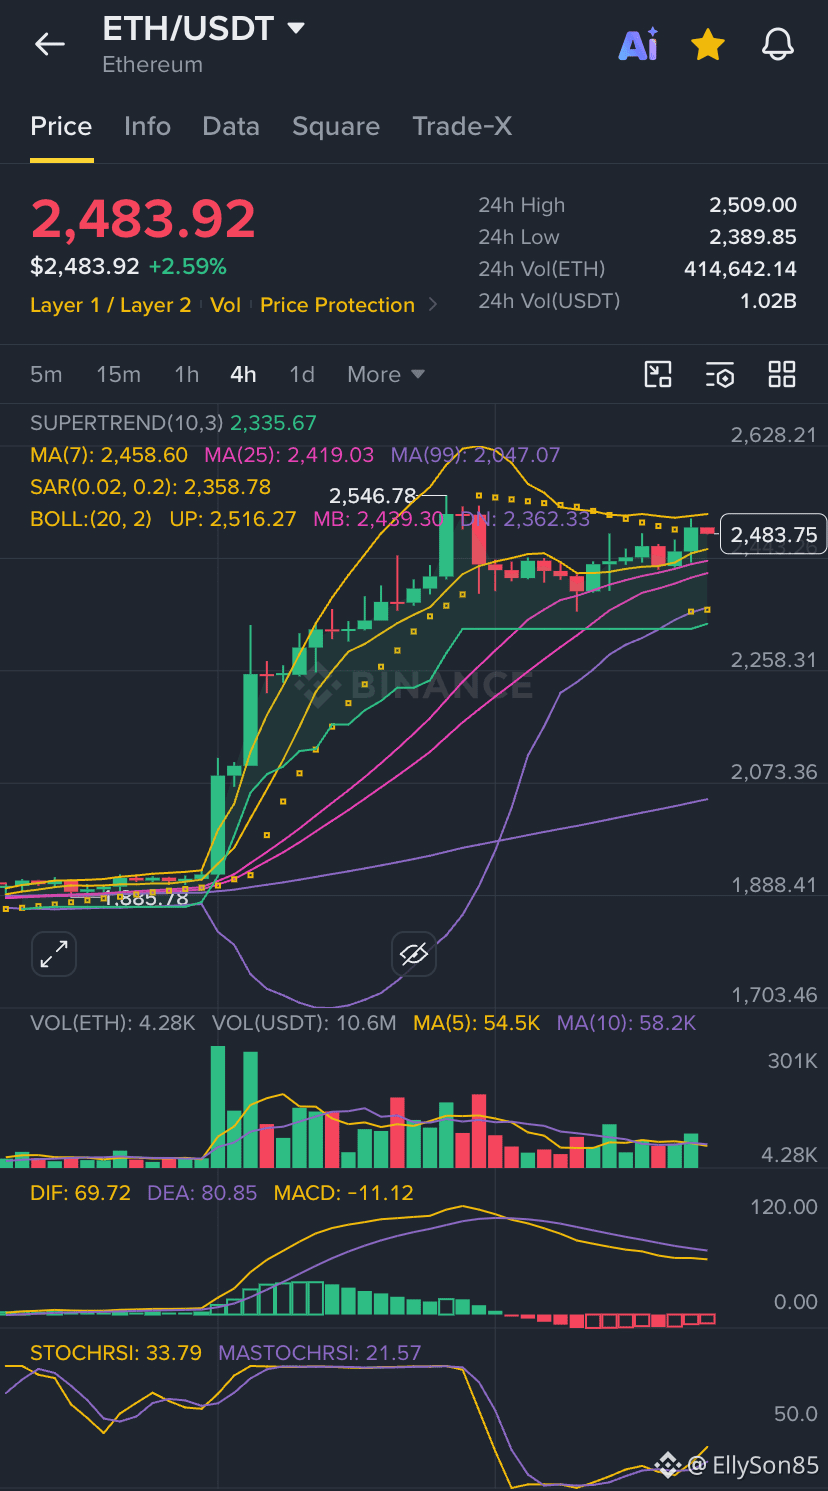
📊 What the 4H chart is showing, let’s get into indicators analysis step by step.
Current price: ~$2,461
* MA(7): $2,446.69 → price is above it ✅
* MA(25): $2,410.21 → price is comfortably above it ✅
* MA(99): $2,041 → strong separation, confirming the broader 4H uptrend ✅
* Supertrend: $2,327 → still bullish ✅
* Bollinger middle: ~$2,432
* Bollinger upper: ~$2,508 → immediate resistance
* SAR: $2,485 → currently above price, giving a short-term bearish warning
* MACD: bearish crossover/histogram → momentum has cooled
* Stoch RSI: around 12 → very low, meaning selling momentum may be getting exhausted.
ETH has also recently made a strong recovery, with current market commentary noting the move toward the $2,500 area.
🔑 The important levels
Resistance
* $2,485 — first hurdle/SAR
* $2,508 — Bollinger upper band
* $2,547 — recent 4H swing high
* $2,600–$2,630 — next major upside zone
Support
* $2,432 — Bollinger middle / near-term support
* $2,410 — MA25
* $2,390 — recent 24H low area
* $2,356 — lower Bollinger band
* $2,327 — Supertrend support
🟢 Bullish scenario
If ETH can establish a 4H close above $2,508, that would be the first important confirmation.
Then a break above $2,547 would strengthen the bullish structure and could open the way toward approximately:
$2,600 → $2,628
The key is that I would want to see increasing volume accompanying the breakout. Right now, volume on the chart is relatively subdued, so a move above resistance without volume could become a false breakout.
🔴 Bearish/pullback scenario
If ETH fails around $2,485–$2,508, the first likely test is:
$2,432 → $2,410
If $2,410 fails, the next important area is approximately $2,390–$2,356.
A 4H breakdown below $2,356 would weaken the current bullish structure considerably and bring the Supertrend area near $2,327 into focus
Current price: ~$2,461
* MA(7): $2,446.69 → price is above it ✅
* MA(25): $2,410.21 → price is comfortably above it ✅
* MA(99): $2,041 → strong separation, confirming the broader 4H uptrend ✅
* Supertrend: $2,327 → still bullish ✅
* Bollinger middle: ~$2,432
* Bollinger upper: ~$2,508 → immediate resistance
* SAR: $2,485 → currently above price, giving a short-term bearish warning
* MACD: bearish crossover/histogram → momentum has cooled
* Stoch RSI: around 12 → very low, meaning selling momentum may be getting exhausted.
ETH has also recently made a strong recovery, with current market commentary noting the move toward the $2,500 area.
🔑 The important levels
Resistance
* $2,485 — first hurdle/SAR
* $2,508 — Bollinger upper band
* $2,547 — recent 4H swing high
* $2,600–$2,630 — next major upside zone
Support
* $2,432 — Bollinger middle / near-term support
* $2,410 — MA25
* $2,390 — recent 24H low area
* $2,356 — lower Bollinger band
* $2,327 — Supertrend support
🟢 Bullish scenario
If ETH can establish a 4H close above $2,508, that would be the first important confirmation.
Then a break above $2,547 would strengthen the bullish structure and could open the way toward approximately:
$2,600 → $2,628
The key is that I would want to see increasing volume accompanying the breakout. Right now, volume on the chart is relatively subdued, so a move above resistance without volume could become a false breakout.
🔴 Bearish/pullback scenario
If ETH fails around $2,485–$2,508, the first likely test is:
$2,432 → $2,410
If $2,410 fails, the next important area is approximately $2,390–$2,356.
A 4H breakdown below $2,356 would weaken the current bullish structure considerably and bring the Supertrend area near $2,327 into focus
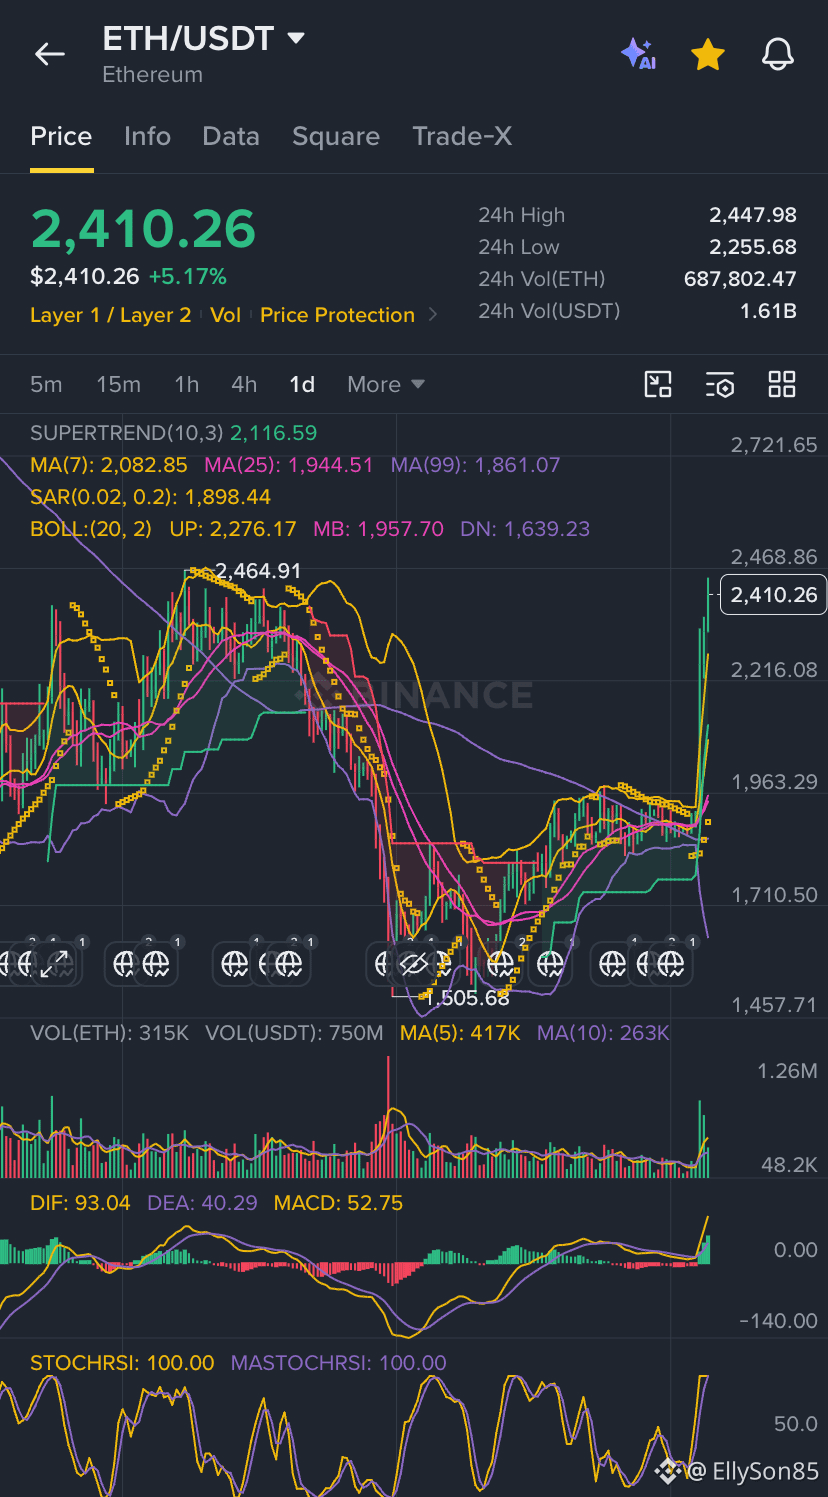
Ethereum $ETH is struggling to break the crucial resistance now at 2450$ , if $ETH successfully manages to break this resistance the next barrier will be around 3000$
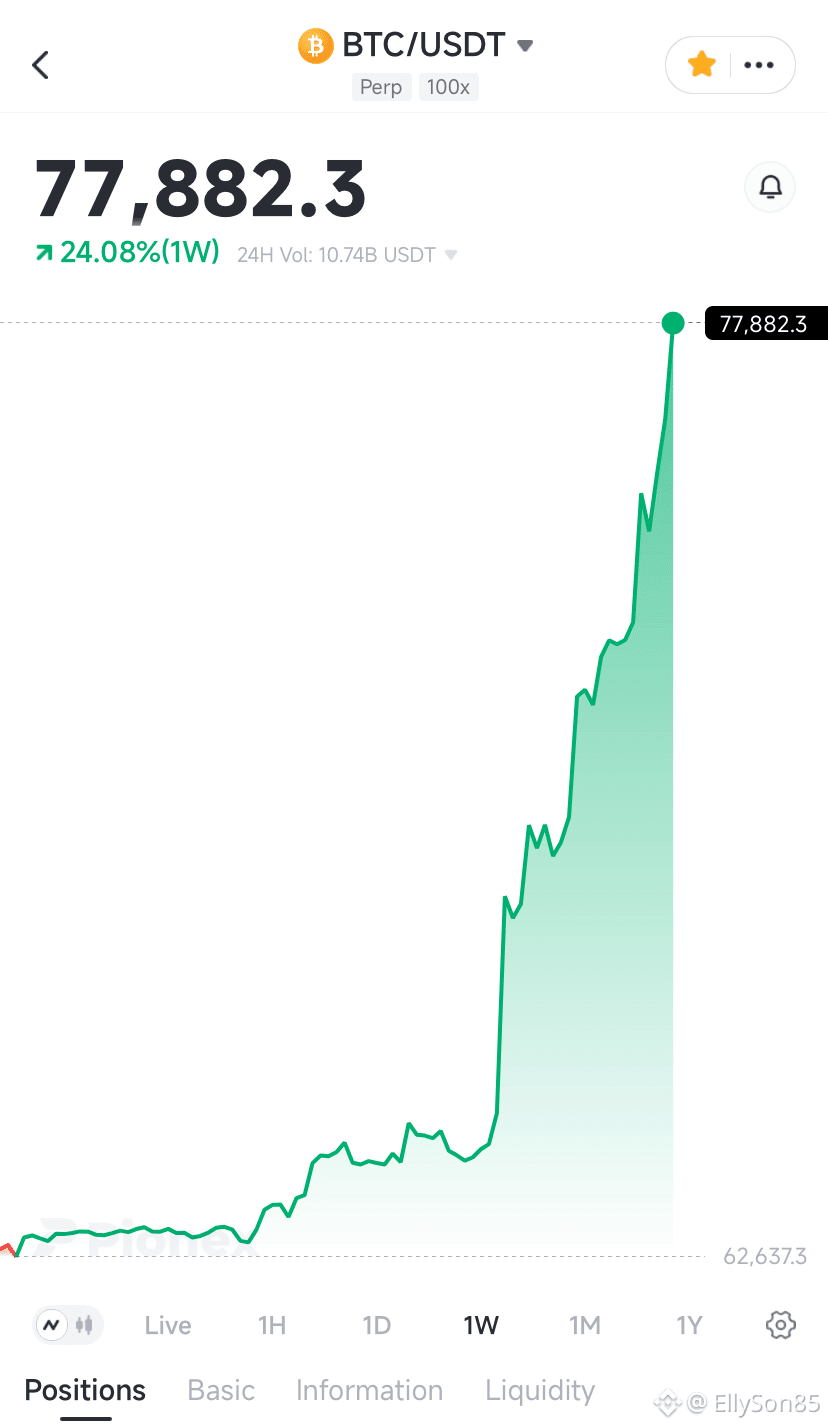
This $BTC Pump reminds me the same scenario in 2022 when in the bear market this same $BTC crashed to $15k and then, when so many were calling it to $10k , but BTC refused and decided for sharp reversal and rallied to $30k, this only reversal to 72k left $3 Billion in short liquidated.
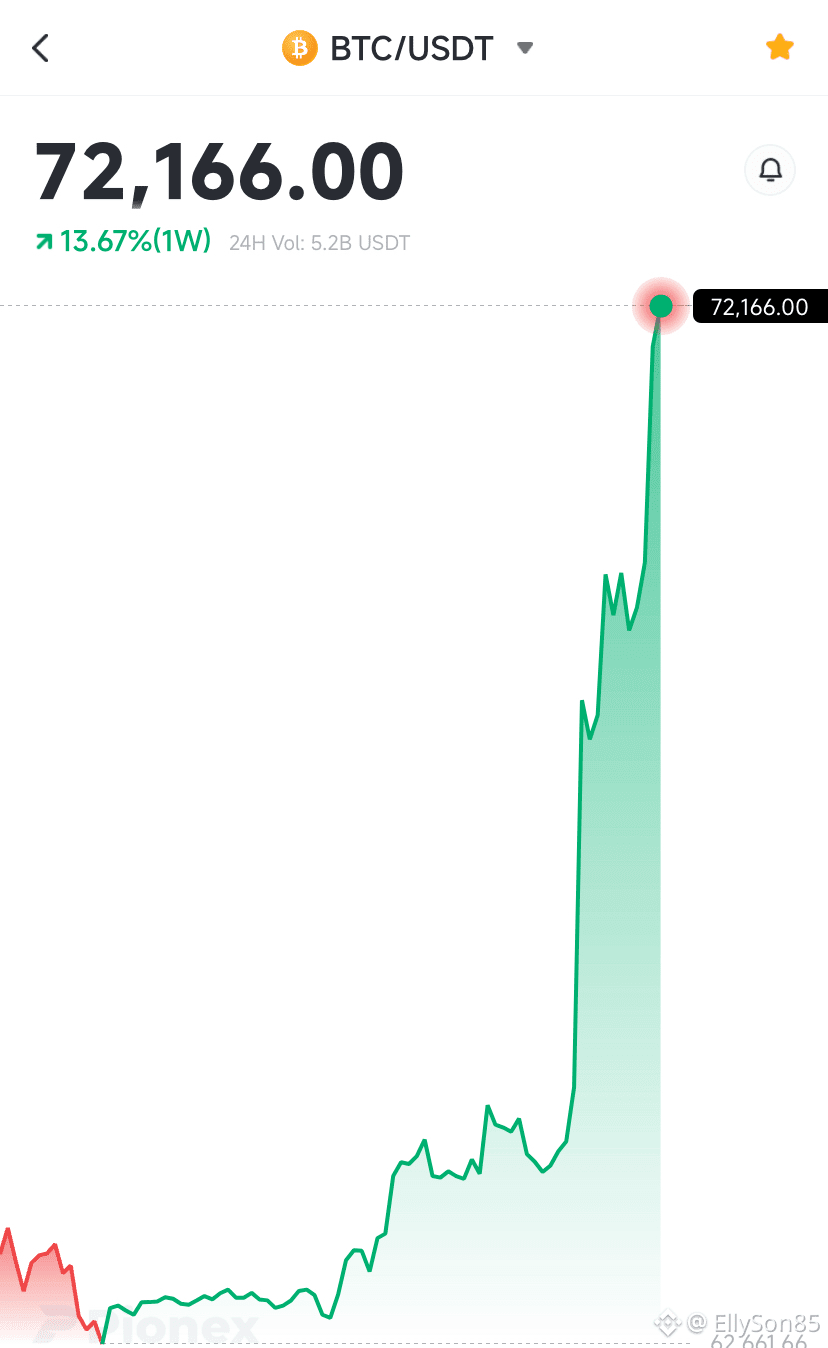
JUST IN: The Google Gemini Co-Founder Cameron Winklevoss says now is an "unprecedented time to buy" Bitcoin! Let’s pump it again.

Көбірек контент көру үшін кіріңіз