
Huutruong039811
10.6k Жариялаулар

Huutruong039811
Хабарлау
Пайдаланушыны блоктау
Crypto Airdrop Daily | Follow for new opportunities | Binance UID 152277880 | X Huutruong039811 | KITE 277880 🇻🇳
Ашық сауда
Жоғары жиілікті трейдер
5.5 жыл
3.6K+ Жазылым
2.4K+ Жазылушылар
847 лайк басылған
Жазбалар
Портфолио
Барлығы
Баға ұсыныстары
Видеолар
Тікелей эфир
·
--
Төмен (кемімелі)
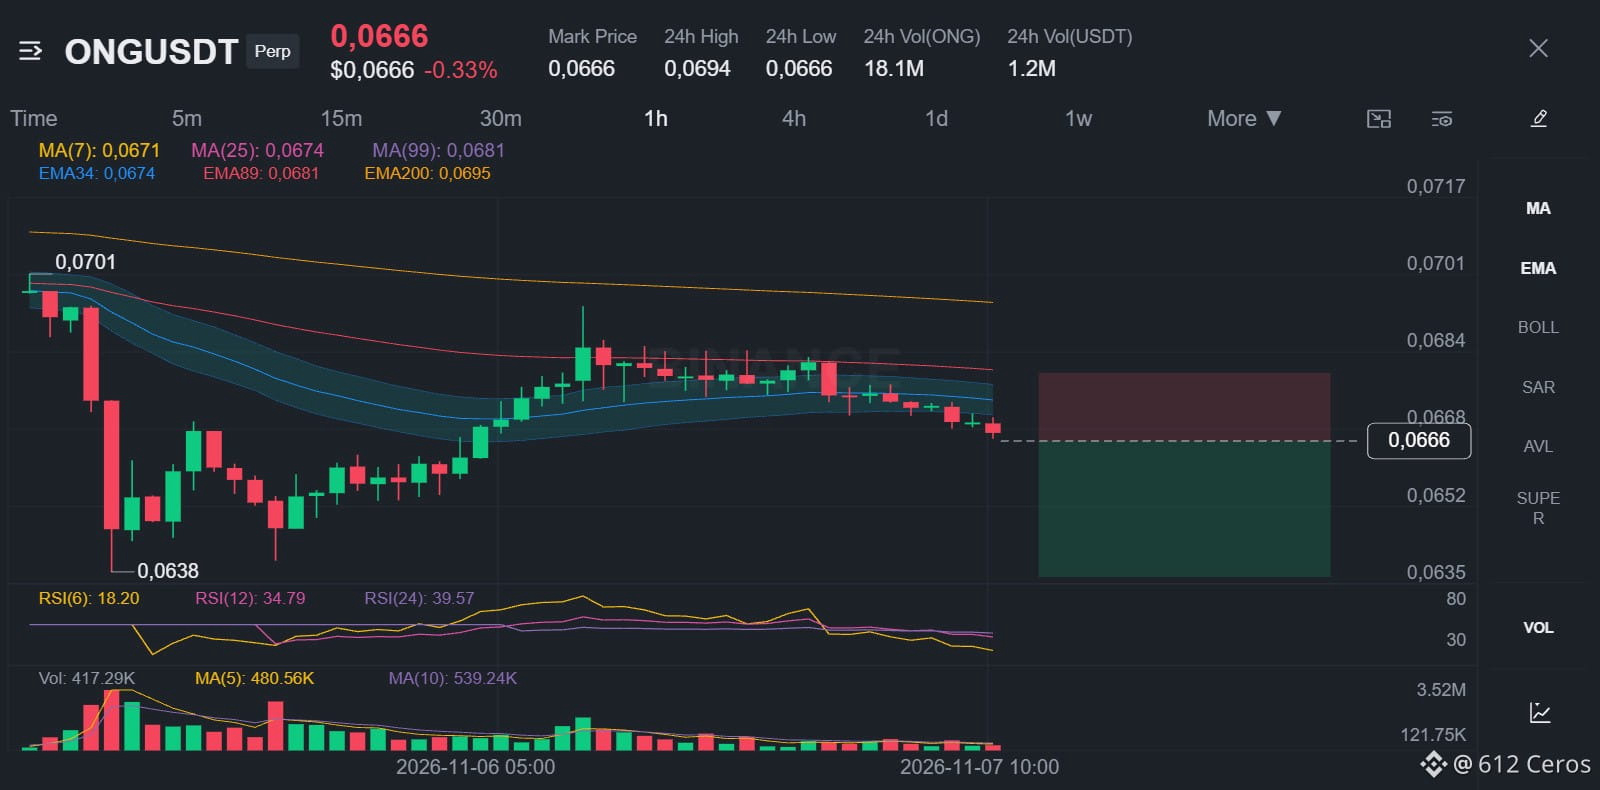
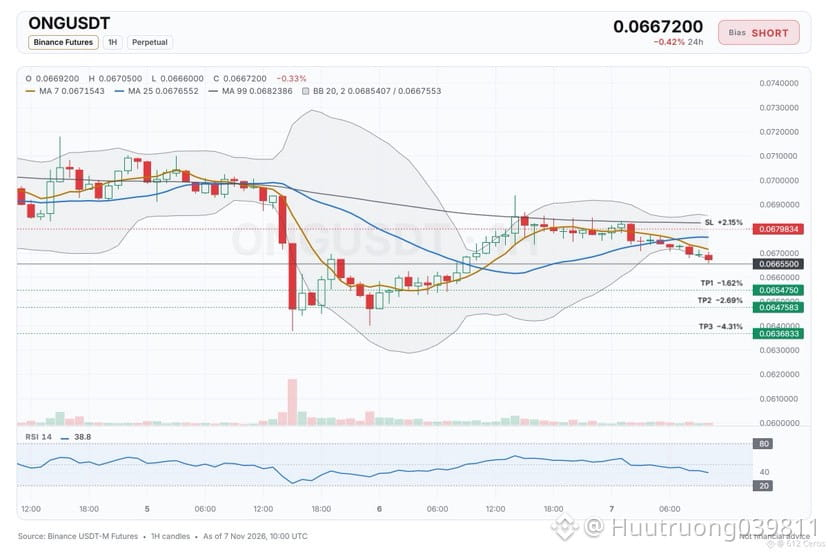
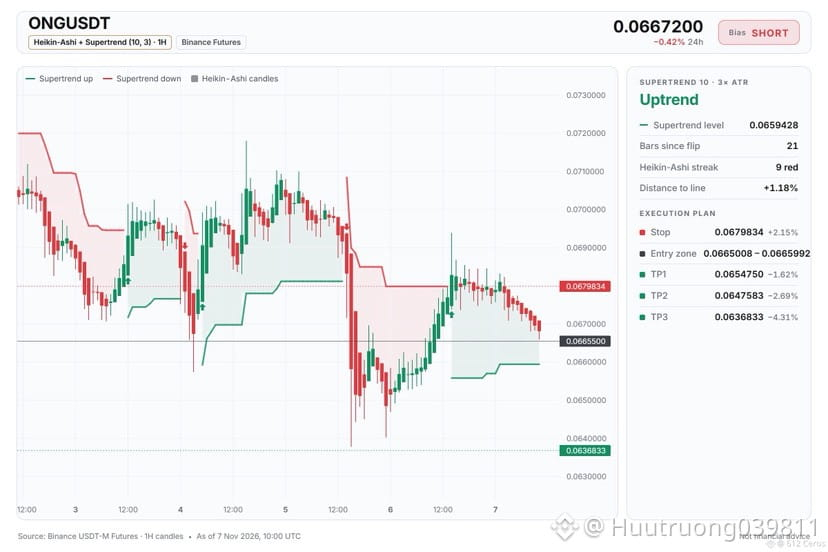
🔴 $ONG /USDT · Bias: SHORT
The 4h price sits below EMA50 and EMA200, showing a bearish stack that points lower.
Entry: 0.0665008 – 0.0665992
TP1: 0.0654750 (-1.6%)
TP2: 0.0647583 (-2.7%)
TP3: 0.0636833 (-4.3%)
SL: 0.0679834 (+2.2%)
Why: The 4h trend shows price below EMA50 and EMA200, meaning the swing trend is down.
Plan: close 50% at TP1, 25% at TP2, 25% at TP3, and move the stop to entry after TP1.
Would you enter this short at the current level?
{spot}(ONGUSDT)
🔴 $ONG /USDT · Bias: SHORT
The 4h price sits below EMA50 and EMA200, showing a bearish stack that points lower.
Entry: 0.0665008 – 0.0665992
TP1: 0.0654750 (-1.6%)
TP2: 0.0647583 (-2.7%)
TP3: 0.0636833 (-4.3%)
SL: 0.0679834 (+2.2%)
Why: The 4h trend shows price below EMA50 and EMA200, meaning the swing trend is down.
Plan: close 50% at TP1, 25% at TP2, 25% at TP3, and move the stop to entry after TP1.
Would you enter this short at the current level?
The 4h price sits below EMA50 and EMA200, showing a bearish stack that points lower.
Entry: 0.0665008 – 0.0665992
TP1: 0.0654750 (-1.6%)
TP2: 0.0647583 (-2.7%)
TP3: 0.0636833 (-4.3%)
SL: 0.0679834 (+2.2%)
Why: The 4h trend shows price below EMA50 and EMA200, meaning the swing trend is down.
Plan: close 50% at TP1, 25% at TP2, 25% at TP3, and move the stop to entry after TP1.
Would you enter this short at the current level?
5
·
--
Төмен (кемімелі)
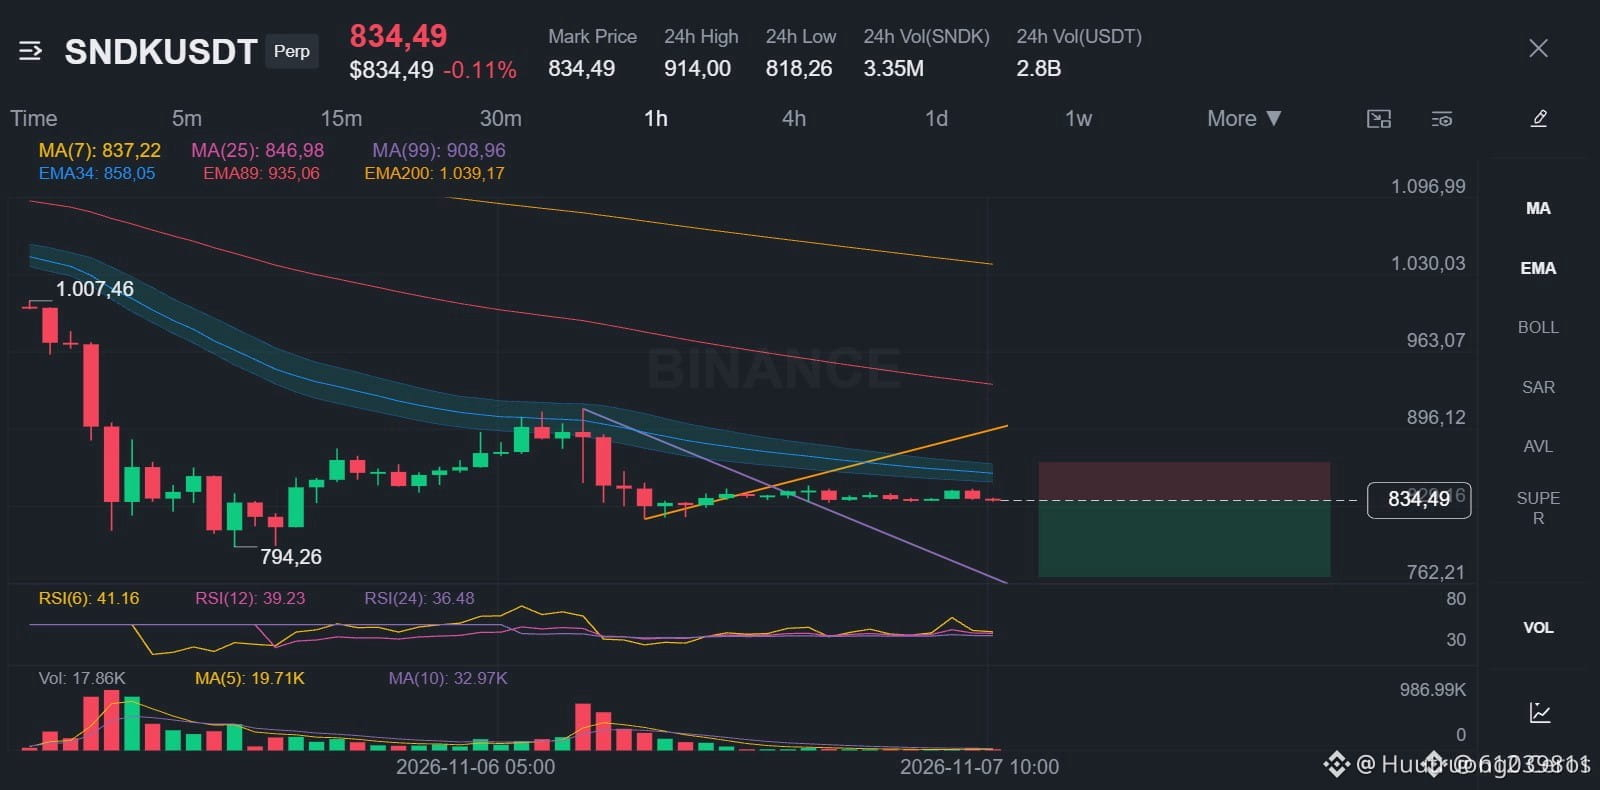
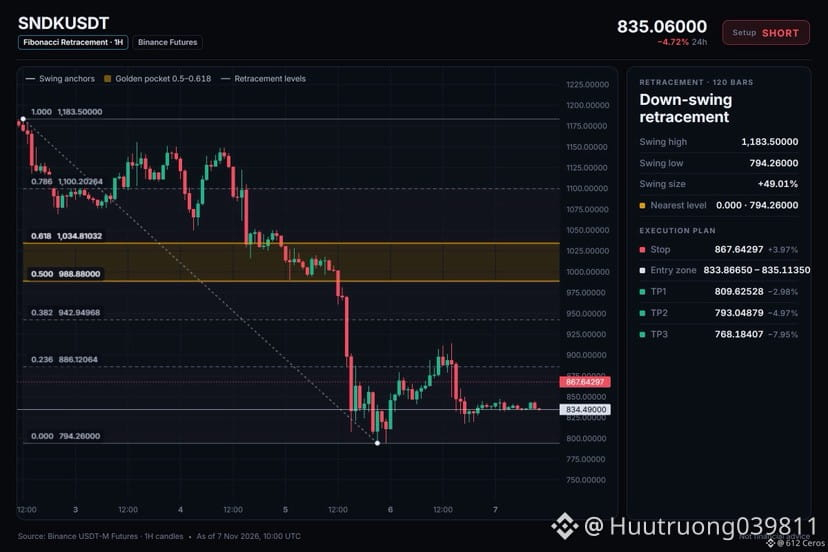
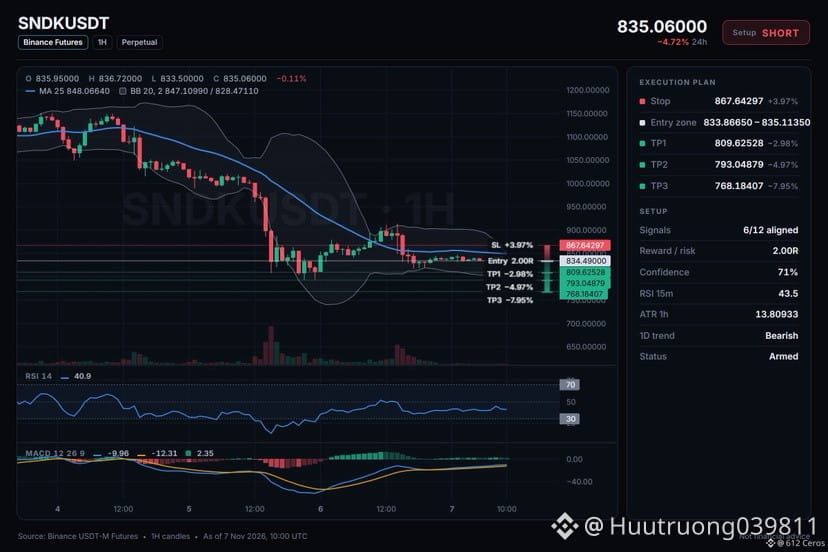
🔴 $SNDK /USDT · Bias: SHORT
SNDK is in a bearish stack on daily and 1h charts, pointing lower.
Entry: 833.86650 – 835.11350
TP1: 809.62528 (-3.0%)
TP2: 793.04879 (-5.0%)
TP3: 768.18407 (-7.9%)
SL: 867.64297 (+4.0%)
Why: The daily trend shows price below both EMAs, meaning the big-picture trend is down and sellers are in control.
Risk: Far below its average, bounce likely (−3.3 ATR from 1h EMA50)
Plan: close 50% at TP1, 25% at TP2, 25% at TP3, and move the stop to entry after TP1.
Do you agree with this short setup on SNDK?
{future}(SNDKUSDT)
🔴 $SNDK /USDT · Bias: SHORT
SNDK is in a bearish stack on daily and 1h charts, pointing lower.
Entry: 833.86650 – 835.11350
TP1: 809.62528 (-3.0%)
TP2: 793.04879 (-5.0%)
TP3: 768.18407 (-7.9%)
SL: 867.64297 (+4.0%)
Why: The daily trend shows price below both EMAs, meaning the big-picture trend is down and sellers are in control.
Risk: Far below its average, bounce likely (−3.3 ATR from 1h EMA50)
Plan: close 50% at TP1, 25% at TP2, 25% at TP3, and move the stop to entry after TP1.
Do you agree with this short setup on SNDK?
SNDK is in a bearish stack on daily and 1h charts, pointing lower.
Entry: 833.86650 – 835.11350
TP1: 809.62528 (-3.0%)
TP2: 793.04879 (-5.0%)
TP3: 768.18407 (-7.9%)
SL: 867.64297 (+4.0%)
Why: The daily trend shows price below both EMAs, meaning the big-picture trend is down and sellers are in control.
Risk: Far below its average, bounce likely (−3.3 ATR from 1h EMA50)
Plan: close 50% at TP1, 25% at TP2, 25% at TP3, and move the stop to entry after TP1.
Do you agree with this short setup on SNDK?
8
·
--
Төмен (кемімелі)
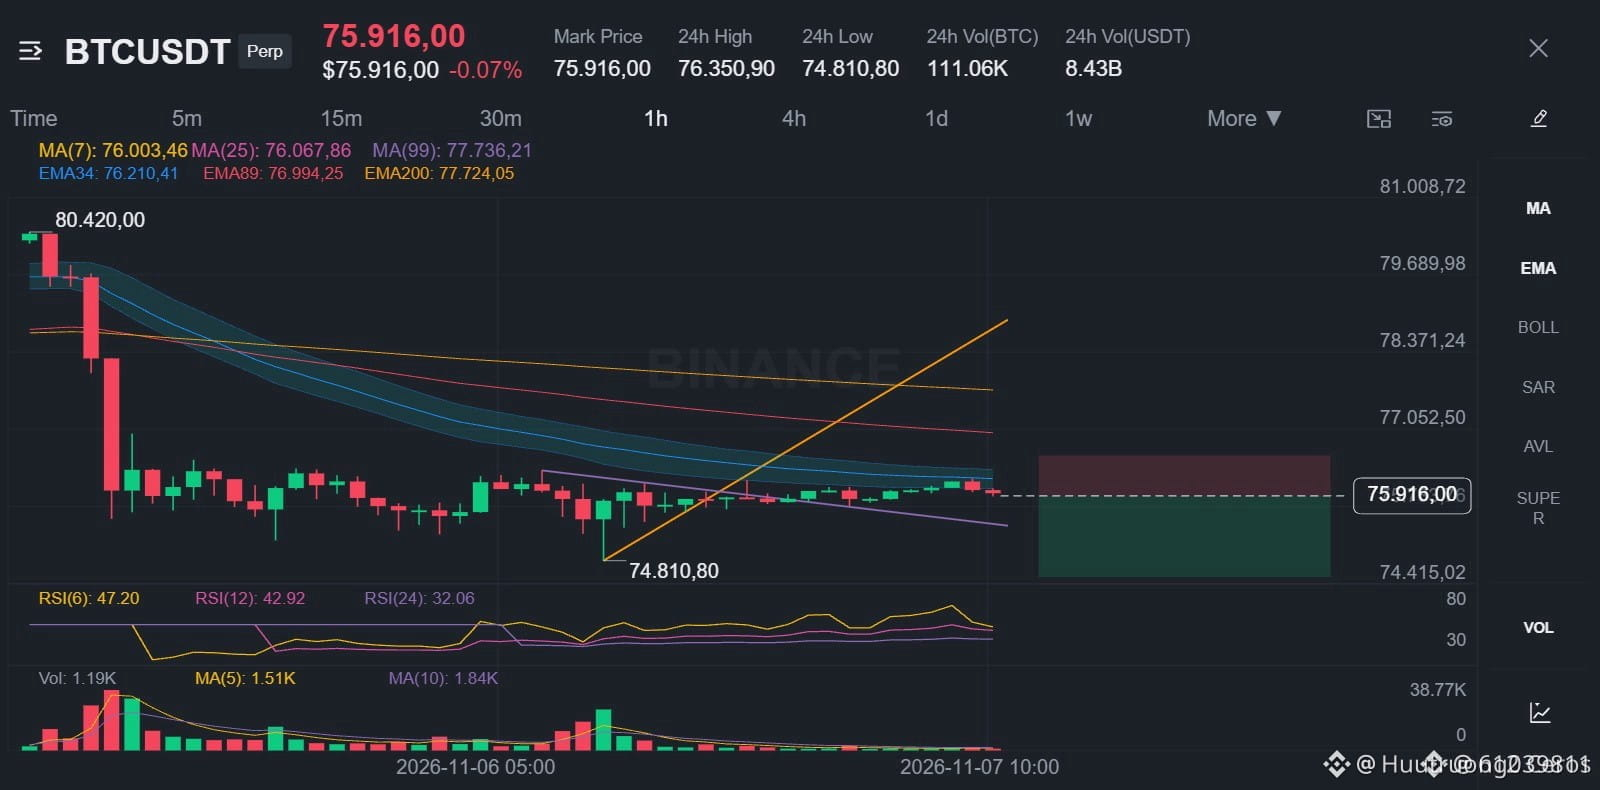
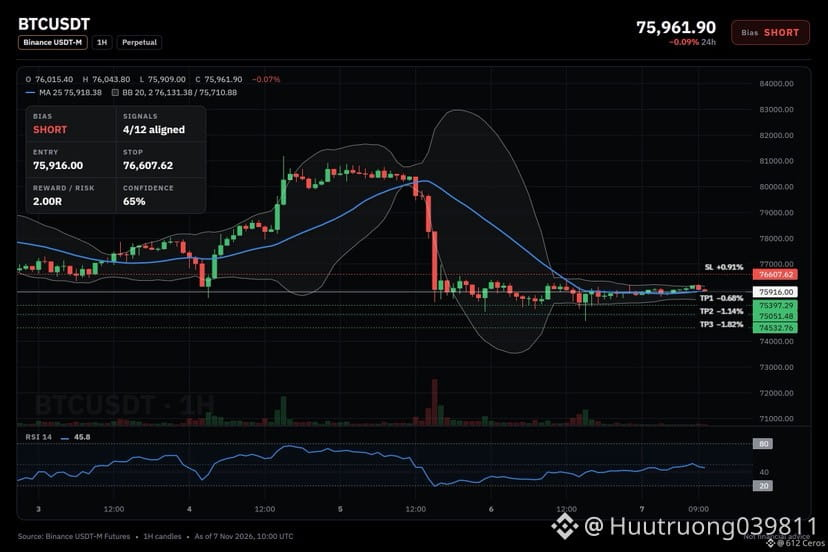
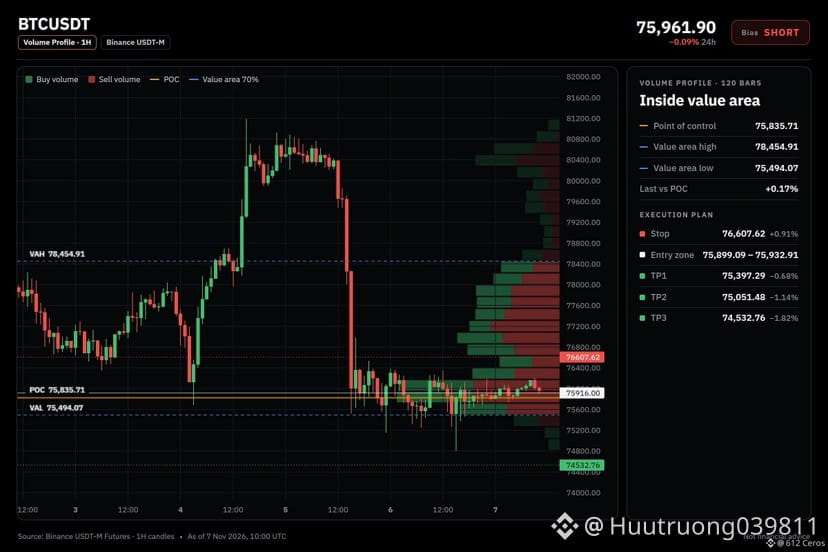
🔴 $BTC /USDT · Bias: SHORT
Four-hour and one-hour bearish stacks point the swing trend lower.
Entry: 75899.09 – 75932.91
TP1: 75397.29 (-0.7%)
TP2: 75051.48 (-1.1%)
TP3: 74532.76 (-1.8%)
SL: 76607.62 (+0.9%)
Note: moderate conviction only, keep size light.
Why: The 4h trend shows price below both EMAs in a bearish stack, meaning the swing trend is down.
Plan: close 50% at TP1, 25% at TP2, 25% at TP3, and move the stop to entry after TP1.
Do you see room for this short to reach the first target?
{spot}(BTCUSDT)
🔴 $BTC /USDT · Bias: SHORT
Four-hour and one-hour bearish stacks point the swing trend lower.
Entry: 75899.09 – 75932.91
TP1: 75397.29 (-0.7%)
TP2: 75051.48 (-1.1%)
TP3: 74532.76 (-1.8%)
SL: 76607.62 (+0.9%)
Note: moderate conviction only, keep size light.
Why: The 4h trend shows price below both EMAs in a bearish stack, meaning the swing trend is down.
Plan: close 50% at TP1, 25% at TP2, 25% at TP3, and move the stop to entry after TP1.
Do you see room for this short to reach the first target?
Four-hour and one-hour bearish stacks point the swing trend lower.
Entry: 75899.09 – 75932.91
TP1: 75397.29 (-0.7%)
TP2: 75051.48 (-1.1%)
TP3: 74532.76 (-1.8%)
SL: 76607.62 (+0.9%)
Note: moderate conviction only, keep size light.
Why: The 4h trend shows price below both EMAs in a bearish stack, meaning the swing trend is down.
Plan: close 50% at TP1, 25% at TP2, 25% at TP3, and move the stop to entry after TP1.
Do you see room for this short to reach the first target?
5
·
--
Төмен (кемімелі)
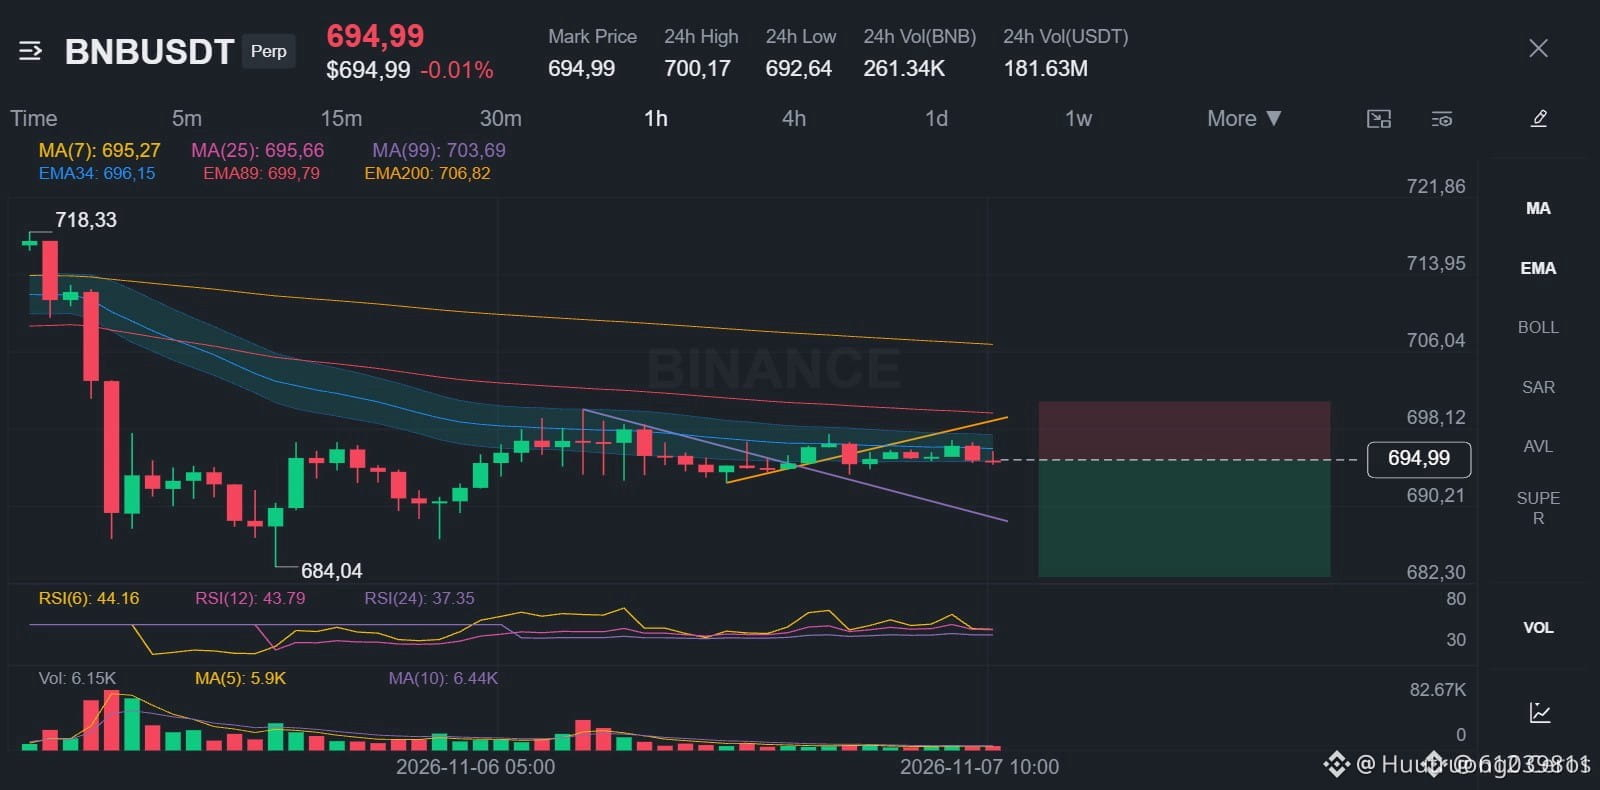
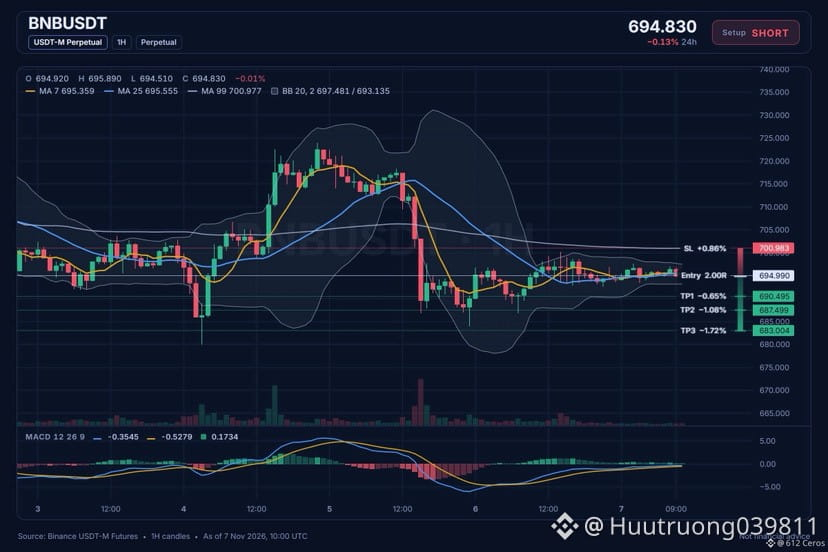
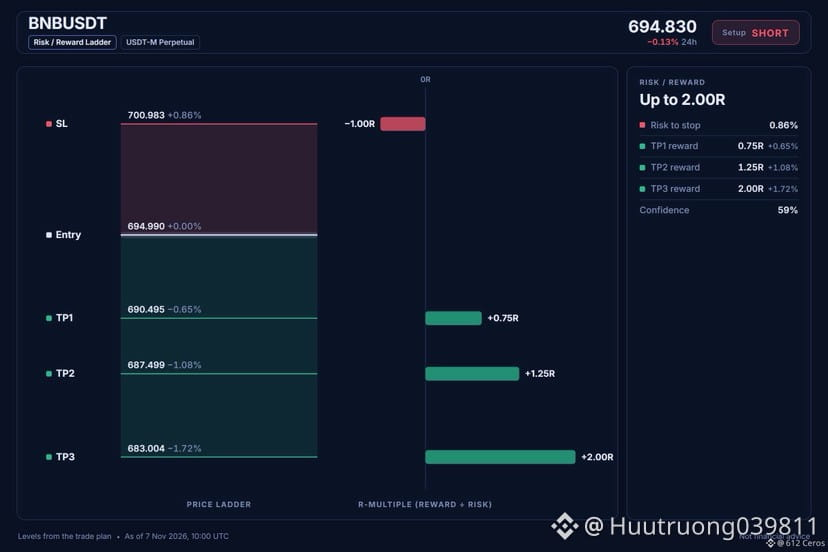
🔴 $BNB /USDT · Bias: SHORT
Price sits below both EMAs on the 4h chart, showing a bearish stack.
Entry: 694.817 – 695.163
TP1: 690.495 (-0.6%)
TP2: 687.499 (-1.1%)
TP3: 683.004 (-1.7%)
SL: 700.983 (+0.9%)
Note: moderate conviction only, keep size light.
Why: The 4h trend shows price below EMA50 and EMA200, a bearish stack meaning the swing trend is down.
Plan: close 50% at TP1, 25% at TP2, 25% at TP3, and move the stop to entry after TP1.
Do you see room for more downside from here?
{spot}(BNBUSDT)
🔴 $BNB /USDT · Bias: SHORT
Price sits below both EMAs on the 4h chart, showing a bearish stack.
Entry: 694.817 – 695.163
TP1: 690.495 (-0.6%)
TP2: 687.499 (-1.1%)
TP3: 683.004 (-1.7%)
SL: 700.983 (+0.9%)
Note: moderate conviction only, keep size light.
Why: The 4h trend shows price below EMA50 and EMA200, a bearish stack meaning the swing trend is down.
Plan: close 50% at TP1, 25% at TP2, 25% at TP3, and move the stop to entry after TP1.
Do you see room for more downside from here?
Price sits below both EMAs on the 4h chart, showing a bearish stack.
Entry: 694.817 – 695.163
TP1: 690.495 (-0.6%)
TP2: 687.499 (-1.1%)
TP3: 683.004 (-1.7%)
SL: 700.983 (+0.9%)
Note: moderate conviction only, keep size light.
Why: The 4h trend shows price below EMA50 and EMA200, a bearish stack meaning the swing trend is down.
Plan: close 50% at TP1, 25% at TP2, 25% at TP3, and move the stop to entry after TP1.
Do you see room for more downside from here?
10
·
--
Төмен (кемімелі)
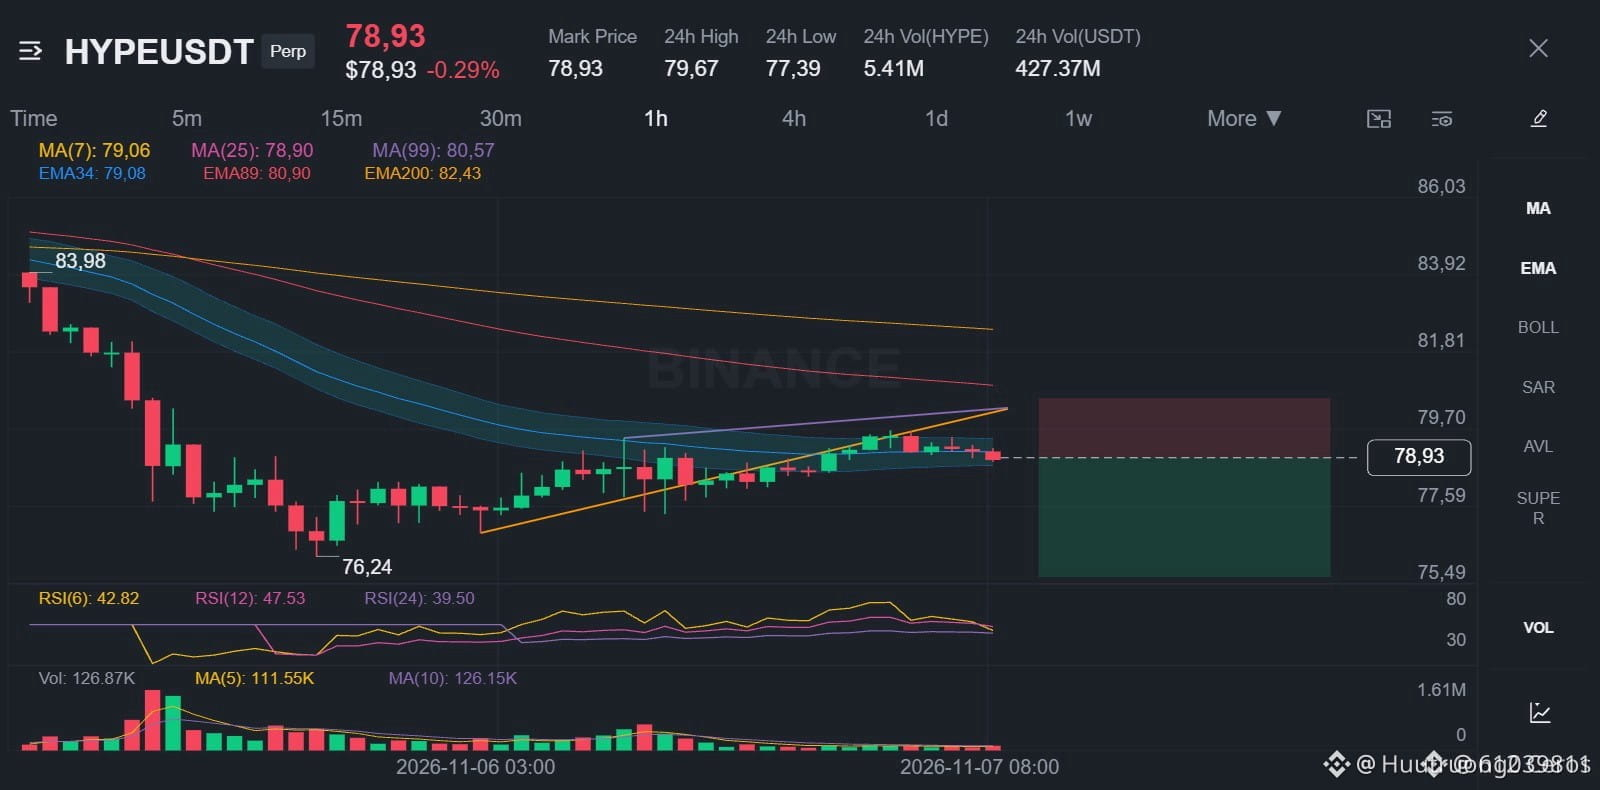
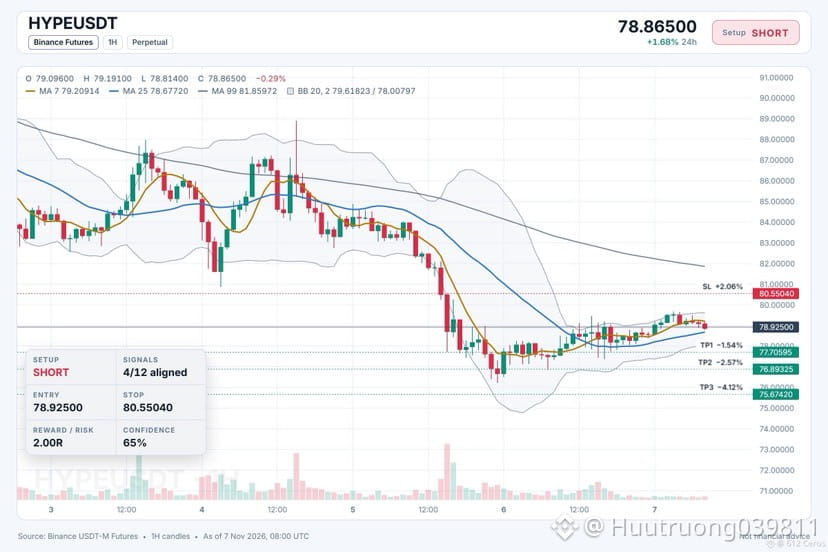
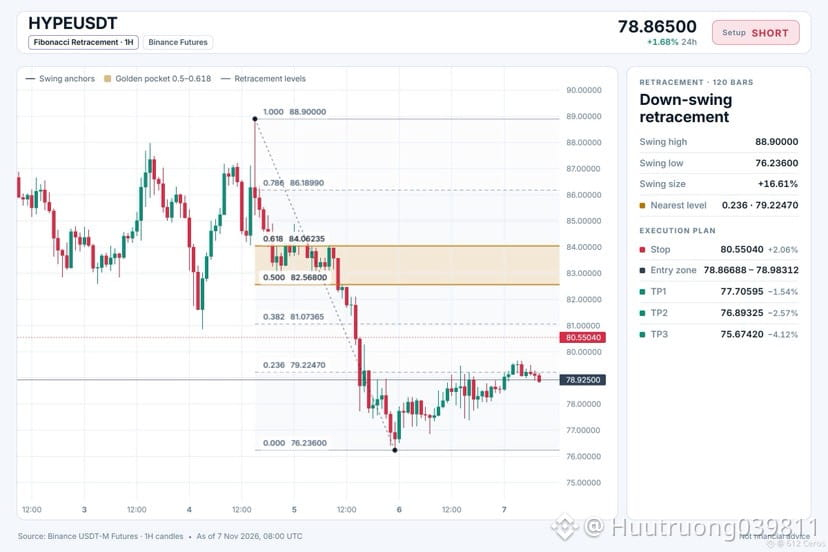
🔴 $HYPE /USDT · Bias: SHORT
4h and 1h bearish stacks keep price under both EMAs.
Entry: 78.86688 – 78.98312
TP1: 77.70595 (-1.5%)
TP2: 76.89325 (-2.6%)
TP3: 75.67420 (-4.1%)
SL: 80.55040 (+2.1%)
Note: moderate conviction only, keep size light.
Why: The 4h trend shows price below EMA50 below EMA200, a bearish stack meaning the swing trend is down.
Plan: close 50% at TP1, 25% at TP2, 25% at TP3, and move the stop to entry after TP1.
Do you see room for more downside from here?
{spot}(HYPEUSDT)
🔴 $HYPE /USDT · Bias: SHORT
4h and 1h bearish stacks keep price under both EMAs.
Entry: 78.86688 – 78.98312
TP1: 77.70595 (-1.5%)
TP2: 76.89325 (-2.6%)
TP3: 75.67420 (-4.1%)
SL: 80.55040 (+2.1%)
Note: moderate conviction only, keep size light.
Why: The 4h trend shows price below EMA50 below EMA200, a bearish stack meaning the swing trend is down.
Plan: close 50% at TP1, 25% at TP2, 25% at TP3, and move the stop to entry after TP1.
Do you see room for more downside from here?
4h and 1h bearish stacks keep price under both EMAs.
Entry: 78.86688 – 78.98312
TP1: 77.70595 (-1.5%)
TP2: 76.89325 (-2.6%)
TP3: 75.67420 (-4.1%)
SL: 80.55040 (+2.1%)
Note: moderate conviction only, keep size light.
Why: The 4h trend shows price below EMA50 below EMA200, a bearish stack meaning the swing trend is down.
Plan: close 50% at TP1, 25% at TP2, 25% at TP3, and move the stop to entry after TP1.
Do you see room for more downside from here?
7
·
--
Төмен (кемімелі)
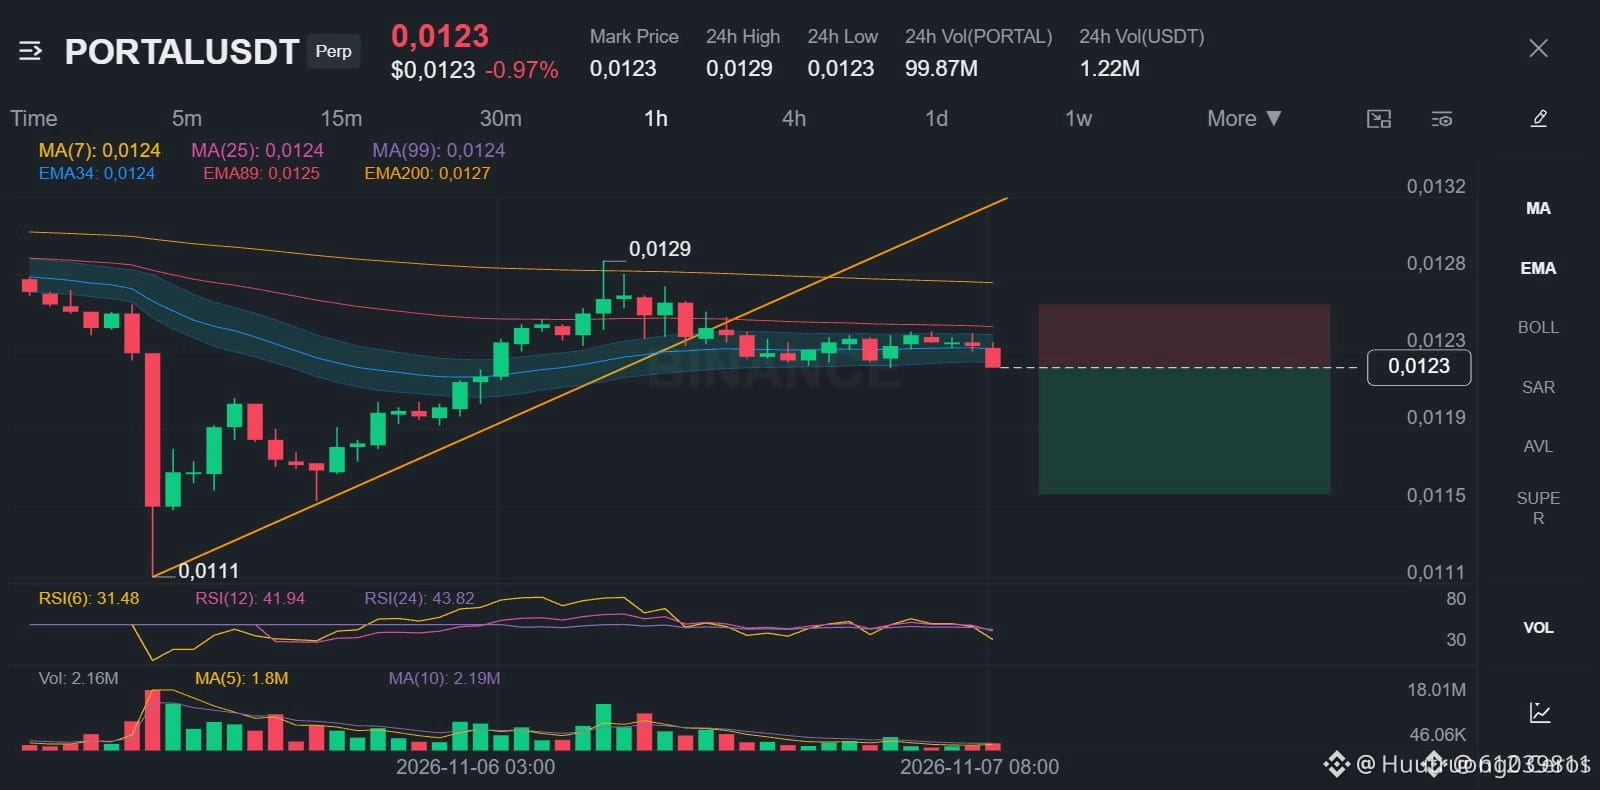
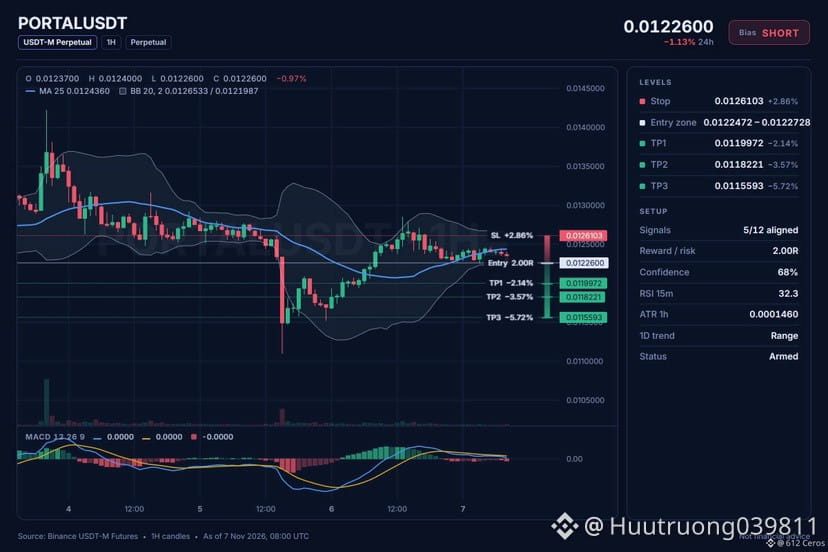
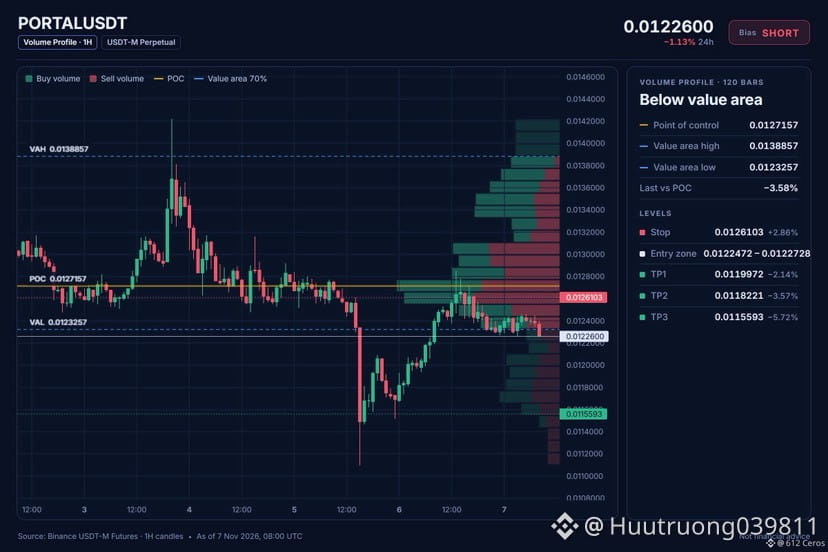
🔴 $PORTAL /USDT · Bias: SHORT
Four-hour trend shows bearish stack pushing price lower.
Entry: 0.0122472 – 0.0122728
TP1: 0.0119972 (-2.1%)
TP2: 0.0118221 (-3.6%)
TP3: 0.0115593 (-5.7%)
SL: 0.0126103 (+2.9%)
Note: moderate conviction only, keep size light.
Why: The 4h trend shows price below EMA50 and EMA200 in a bearish stack, meaning the swing trend is down.
Plan: close 50% at TP1, 25% at TP2, 25% at TP3, and move the stop to entry after TP1.
Where do you see price going from here?
{spot}(PORTALUSDT)
🔴 $PORTAL /USDT · Bias: SHORT
Four-hour trend shows bearish stack pushing price lower.
Entry: 0.0122472 – 0.0122728
TP1: 0.0119972 (-2.1%)
TP2: 0.0118221 (-3.6%)
TP3: 0.0115593 (-5.7%)
SL: 0.0126103 (+2.9%)
Note: moderate conviction only, keep size light.
Why: The 4h trend shows price below EMA50 and EMA200 in a bearish stack, meaning the swing trend is down.
Plan: close 50% at TP1, 25% at TP2, 25% at TP3, and move the stop to entry after TP1.
Where do you see price going from here?
Four-hour trend shows bearish stack pushing price lower.
Entry: 0.0122472 – 0.0122728
TP1: 0.0119972 (-2.1%)
TP2: 0.0118221 (-3.6%)
TP3: 0.0115593 (-5.7%)
SL: 0.0126103 (+2.9%)
Note: moderate conviction only, keep size light.
Why: The 4h trend shows price below EMA50 and EMA200 in a bearish stack, meaning the swing trend is down.
Plan: close 50% at TP1, 25% at TP2, 25% at TP3, and move the stop to entry after TP1.
Where do you see price going from here?
7
·
--
Төмен (кемімелі)
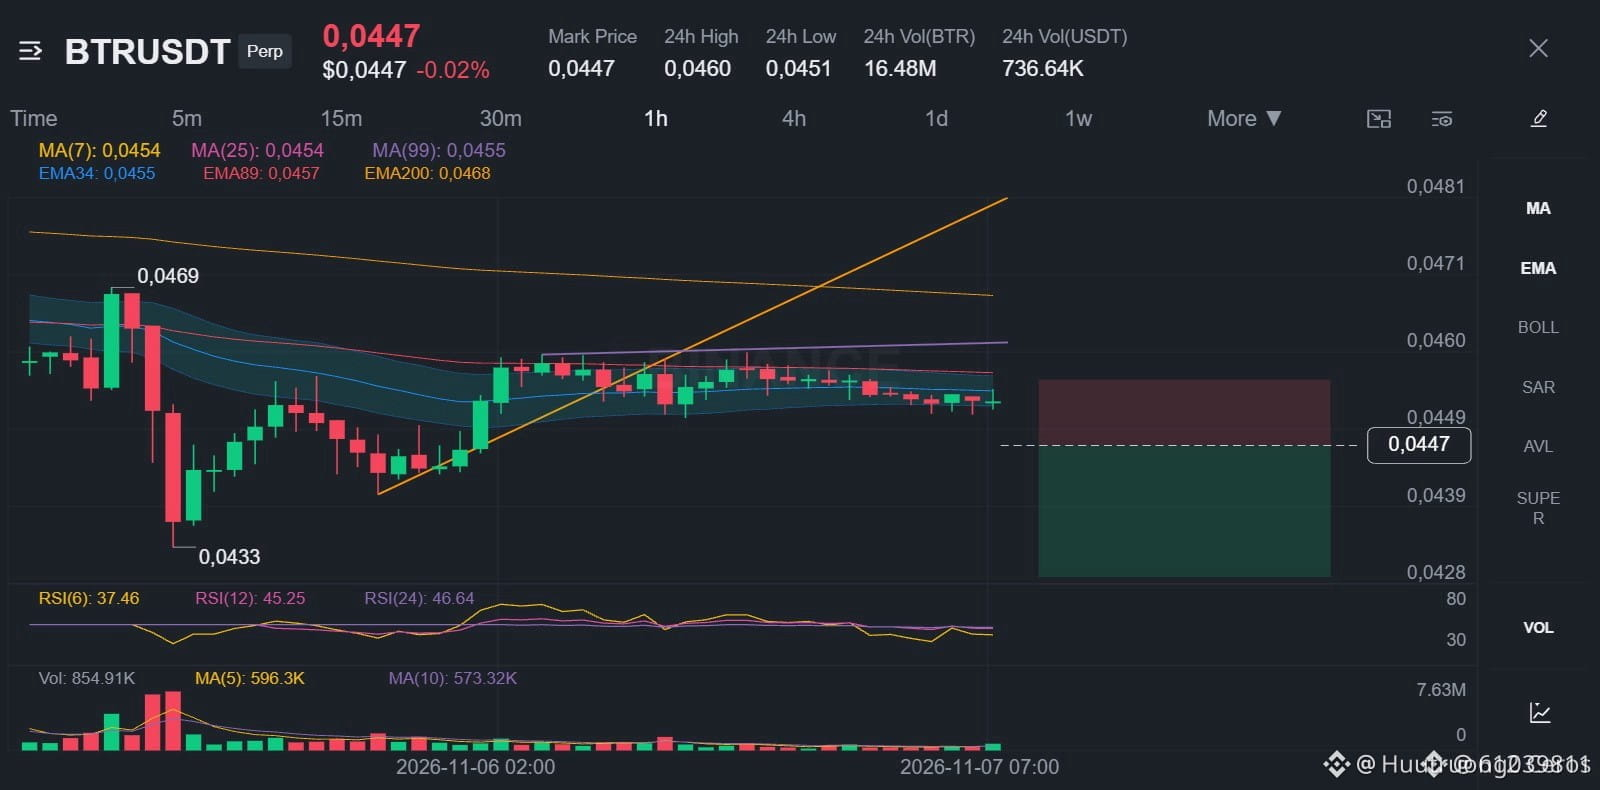
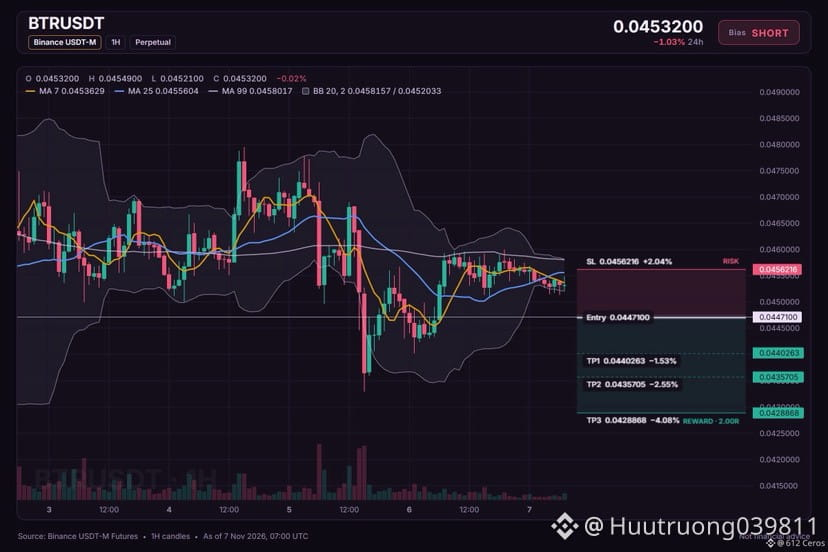
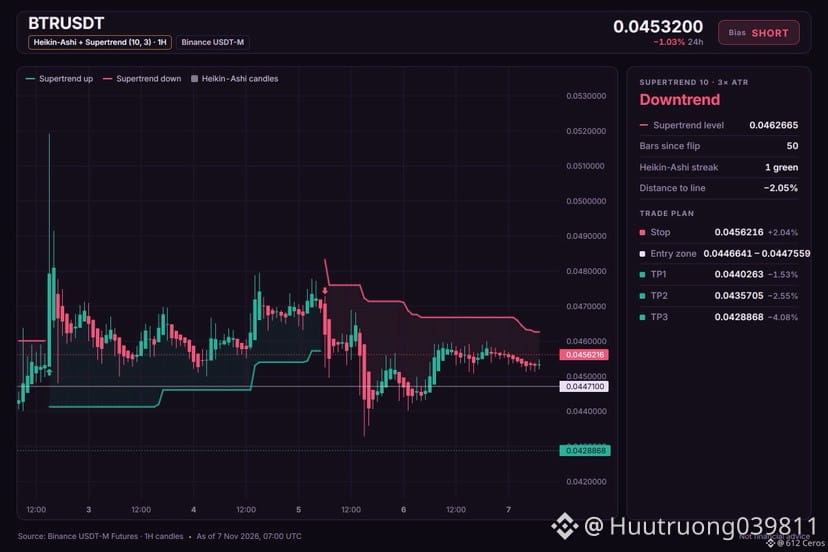
🔴 $BTR /USDT · Bias: SHORT
BTR keeps a bearish stack across daily, 4h and 1h timeframes.
Entry: 0.0446641 – 0.0447559
TP1: 0.0440263 (-1.5%)
TP2: 0.0435705 (-2.5%)
TP3: 0.0428868 (-4.1%)
SL: 0.0456216 (+2.0%)
Why: The daily trend shows price below both EMAs, a bearish stack that means the big-picture trend is down.
Risk: Range bottom, buyers often step in (RSI z −2.40)
Plan: close 50% at TP1, 25% at TP2, 25% at TP3, and move the stop to entry after TP1.
Where do you see this trade heading?
{future}(BTRUSDT)
🔴 $BTR /USDT · Bias: SHORT
BTR keeps a bearish stack across daily, 4h and 1h timeframes.
Entry: 0.0446641 – 0.0447559
TP1: 0.0440263 (-1.5%)
TP2: 0.0435705 (-2.5%)
TP3: 0.0428868 (-4.1%)
SL: 0.0456216 (+2.0%)
Why: The daily trend shows price below both EMAs, a bearish stack that means the big-picture trend is down.
Risk: Range bottom, buyers often step in (RSI z −2.40)
Plan: close 50% at TP1, 25% at TP2, 25% at TP3, and move the stop to entry after TP1.
Where do you see this trade heading?
BTR keeps a bearish stack across daily, 4h and 1h timeframes.
Entry: 0.0446641 – 0.0447559
TP1: 0.0440263 (-1.5%)
TP2: 0.0435705 (-2.5%)
TP3: 0.0428868 (-4.1%)
SL: 0.0456216 (+2.0%)
Why: The daily trend shows price below both EMAs, a bearish stack that means the big-picture trend is down.
Risk: Range bottom, buyers often step in (RSI z −2.40)
Plan: close 50% at TP1, 25% at TP2, 25% at TP3, and move the stop to entry after TP1.
Where do you see this trade heading?
9
·
--
Төмен (кемімелі)
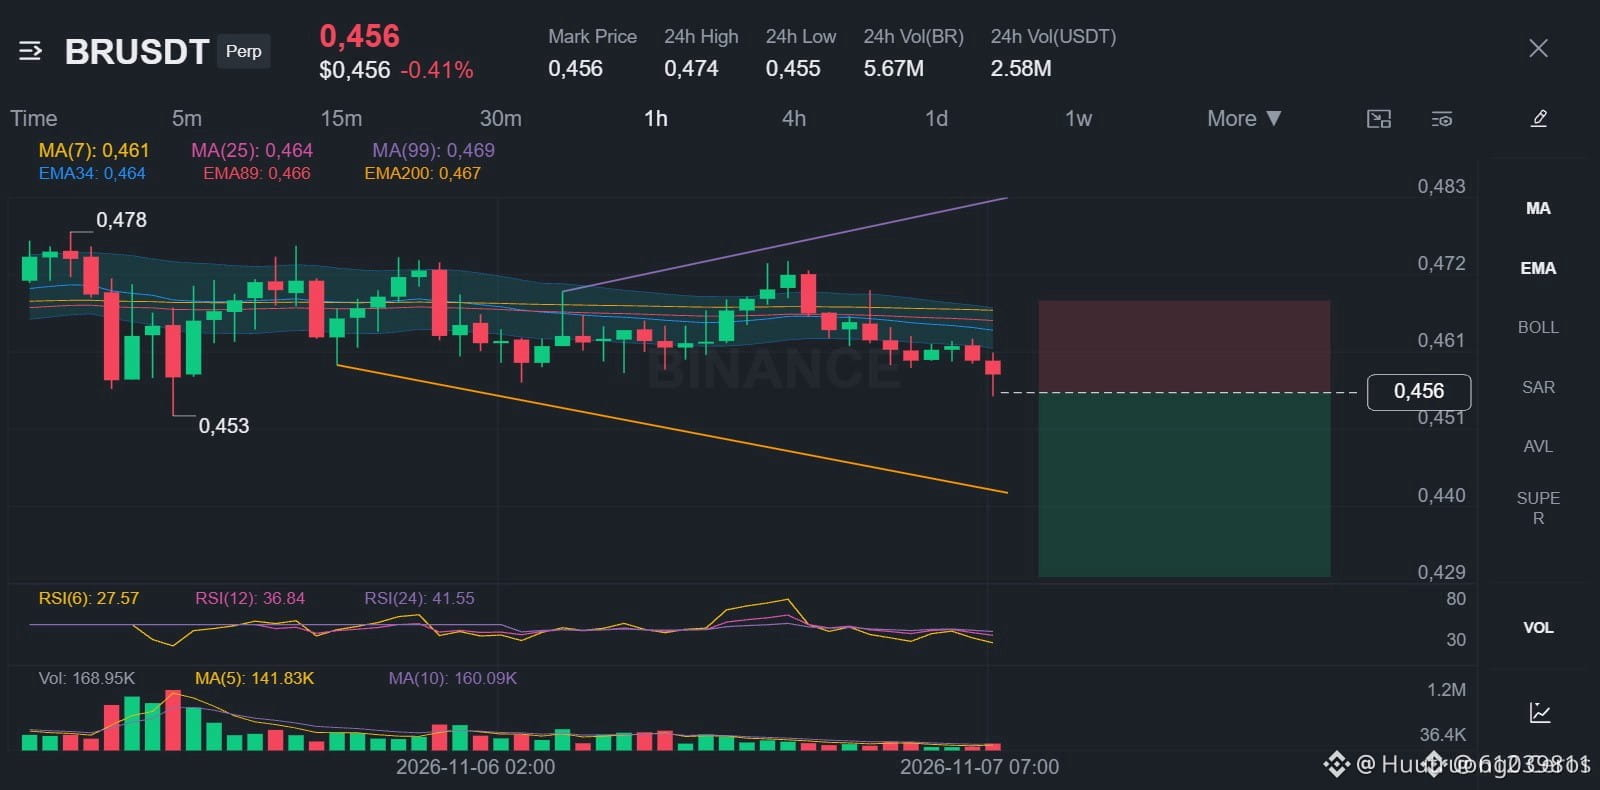
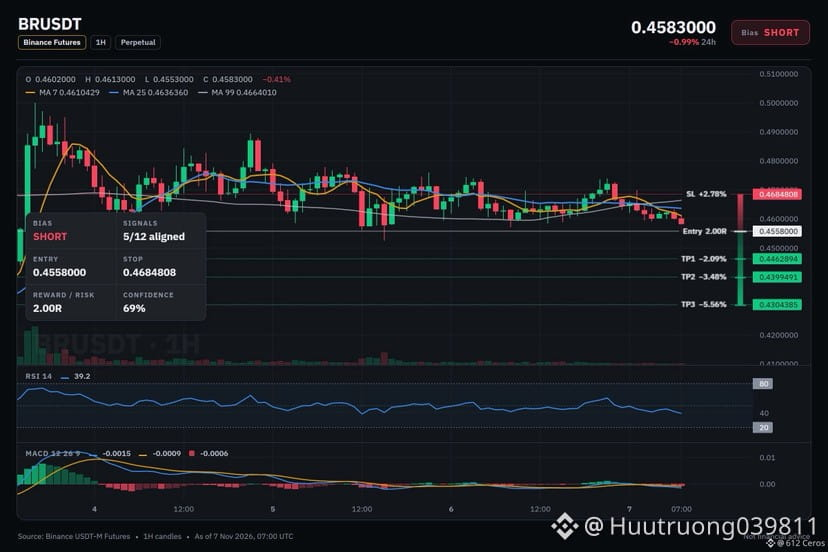
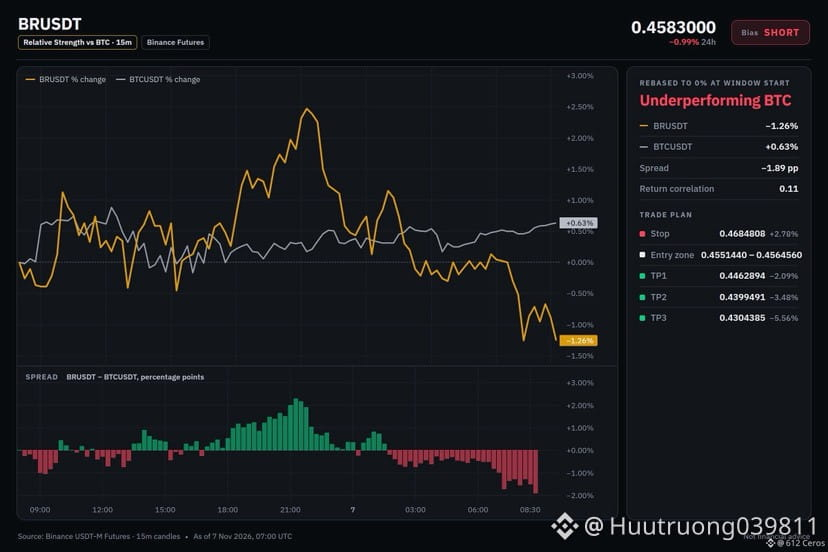
🔴 $BR /USDT · Bias: SHORT
BR 1h trend points lower in a bearish stack.
Entry: 0.4551440 – 0.4564560
TP1: 0.4462894 (-2.1%)
TP2: 0.4399491 (-3.5%)
TP3: 0.4304385 (-5.6%)
SL: 0.4684808 (+2.8%)
Note: moderate conviction only, keep size light.
Why: ADX 24.8 shows sellers in control, meaning the move is driven by selling pressure.
Plan: close 50% at TP1, 25% at TP2, 25% at TP3, and move the stop to entry after TP1.
Do you see room for more downside here?
{future}(BRUSDT)
🔴 $BR /USDT · Bias: SHORT
BR 1h trend points lower in a bearish stack.
Entry: 0.4551440 – 0.4564560
TP1: 0.4462894 (-2.1%)
TP2: 0.4399491 (-3.5%)
TP3: 0.4304385 (-5.6%)
SL: 0.4684808 (+2.8%)
Note: moderate conviction only, keep size light.
Why: ADX 24.8 shows sellers in control, meaning the move is driven by selling pressure.
Plan: close 50% at TP1, 25% at TP2, 25% at TP3, and move the stop to entry after TP1.
Do you see room for more downside here?
BR 1h trend points lower in a bearish stack.
Entry: 0.4551440 – 0.4564560
TP1: 0.4462894 (-2.1%)
TP2: 0.4399491 (-3.5%)
TP3: 0.4304385 (-5.6%)
SL: 0.4684808 (+2.8%)
Note: moderate conviction only, keep size light.
Why: ADX 24.8 shows sellers in control, meaning the move is driven by selling pressure.
Plan: close 50% at TP1, 25% at TP2, 25% at TP3, and move the stop to entry after TP1.
Do you see room for more downside here?
35
·
--
Төмен (кемімелі)
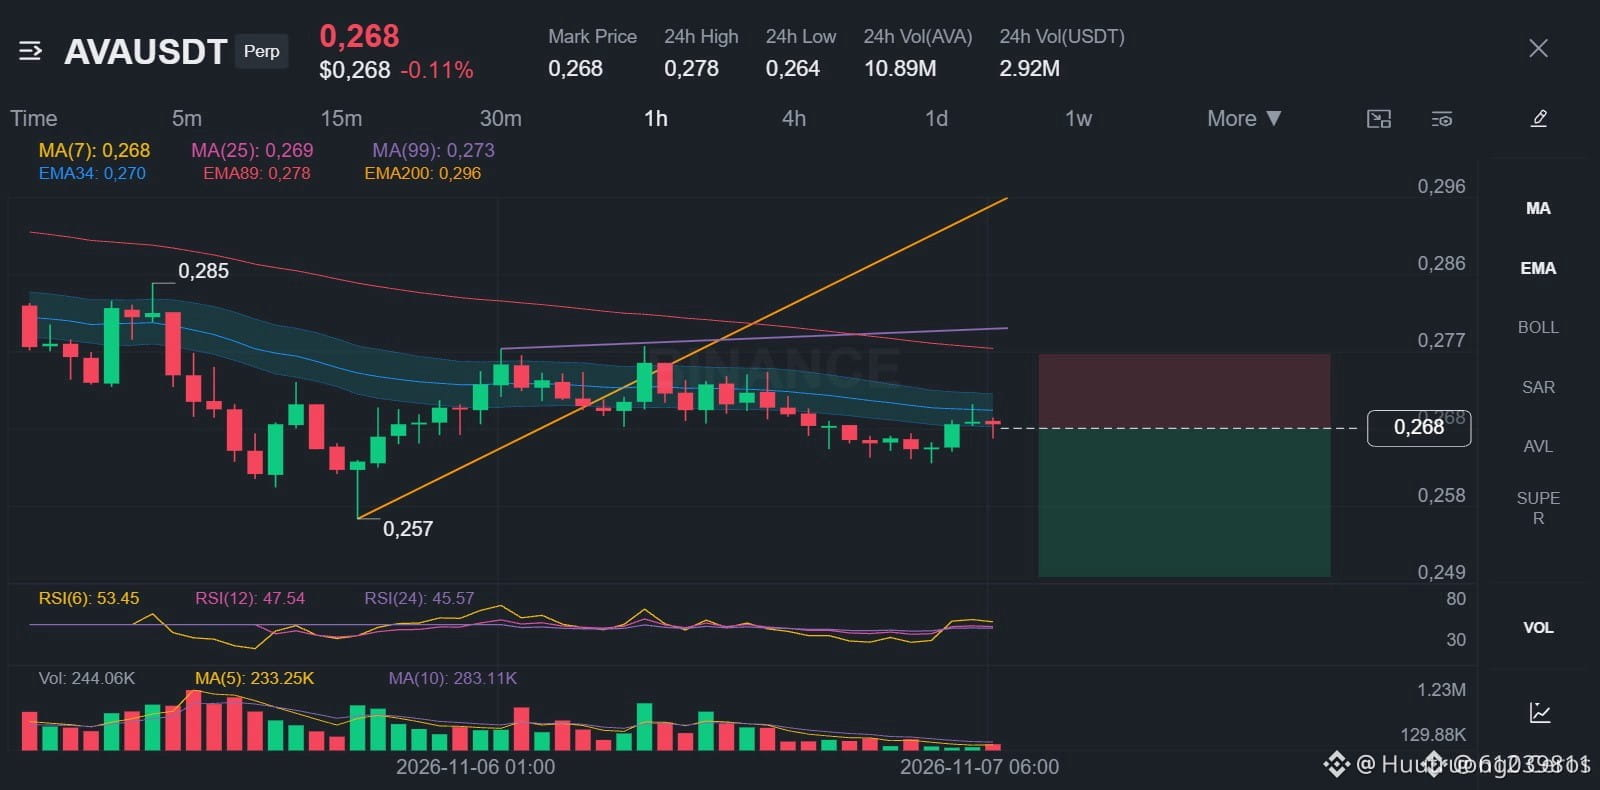
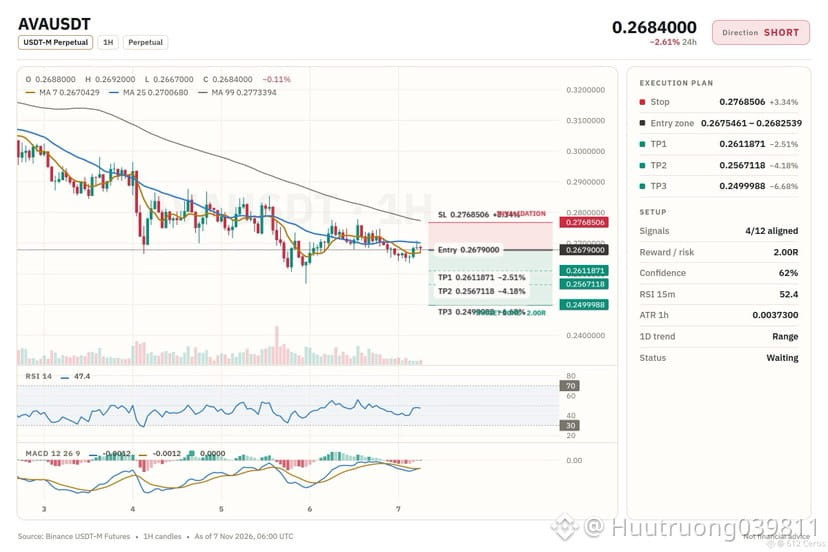
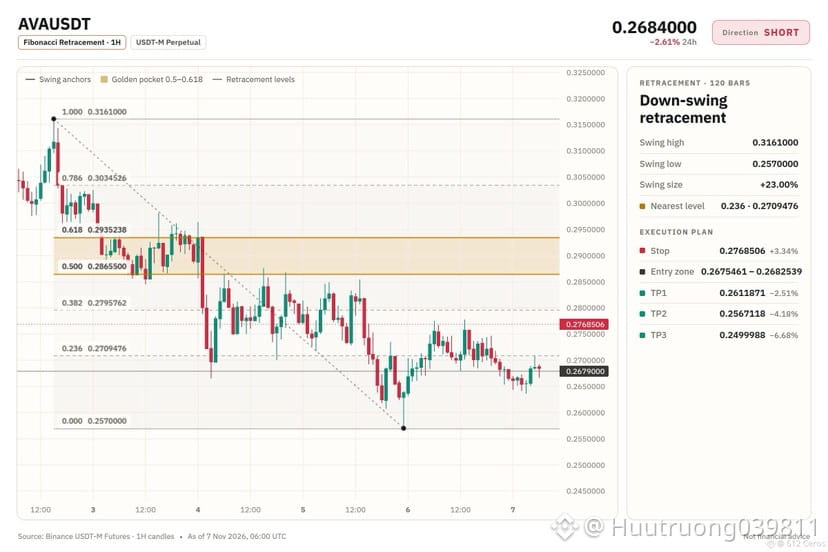
🔴 $AVA /USDT · Bias: SHORT
AVA is in a bearish stack on the 4h timeframe, pointing lower.
Entry: 0.2675461 – 0.2682539
TP1: 0.2611871 (-2.5%)
TP2: 0.2567118 (-4.2%)
TP3: 0.2499988 (-6.7%)
SL: 0.2768506 (+3.3%)
Note: moderate conviction only, keep size light.
Why: The 4h trend shows price below EMA50 and EMA200, a bearish stack meaning the swing trend is down.
Risk: Buyers are pushing right now (+0.26% 15m candle)
Plan: close 50% at TP1, 25% at TP2, 25% at TP3, and move the stop to entry after TP1.
Do you think price stays below the entry level here?
{spot}(AVAUSDT)
🔴 $AVA /USDT · Bias: SHORT
AVA is in a bearish stack on the 4h timeframe, pointing lower.
Entry: 0.2675461 – 0.2682539
TP1: 0.2611871 (-2.5%)
TP2: 0.2567118 (-4.2%)
TP3: 0.2499988 (-6.7%)
SL: 0.2768506 (+3.3%)
Note: moderate conviction only, keep size light.
Why: The 4h trend shows price below EMA50 and EMA200, a bearish stack meaning the swing trend is down.
Risk: Buyers are pushing right now (+0.26% 15m candle)
Plan: close 50% at TP1, 25% at TP2, 25% at TP3, and move the stop to entry after TP1.
Do you think price stays below the entry level here?
AVA is in a bearish stack on the 4h timeframe, pointing lower.
Entry: 0.2675461 – 0.2682539
TP1: 0.2611871 (-2.5%)
TP2: 0.2567118 (-4.2%)
TP3: 0.2499988 (-6.7%)
SL: 0.2768506 (+3.3%)
Note: moderate conviction only, keep size light.
Why: The 4h trend shows price below EMA50 and EMA200, a bearish stack meaning the swing trend is down.
Risk: Buyers are pushing right now (+0.26% 15m candle)
Plan: close 50% at TP1, 25% at TP2, 25% at TP3, and move the stop to entry after TP1.
Do you think price stays below the entry level here?
36
·
--
Төмен (кемімелі)
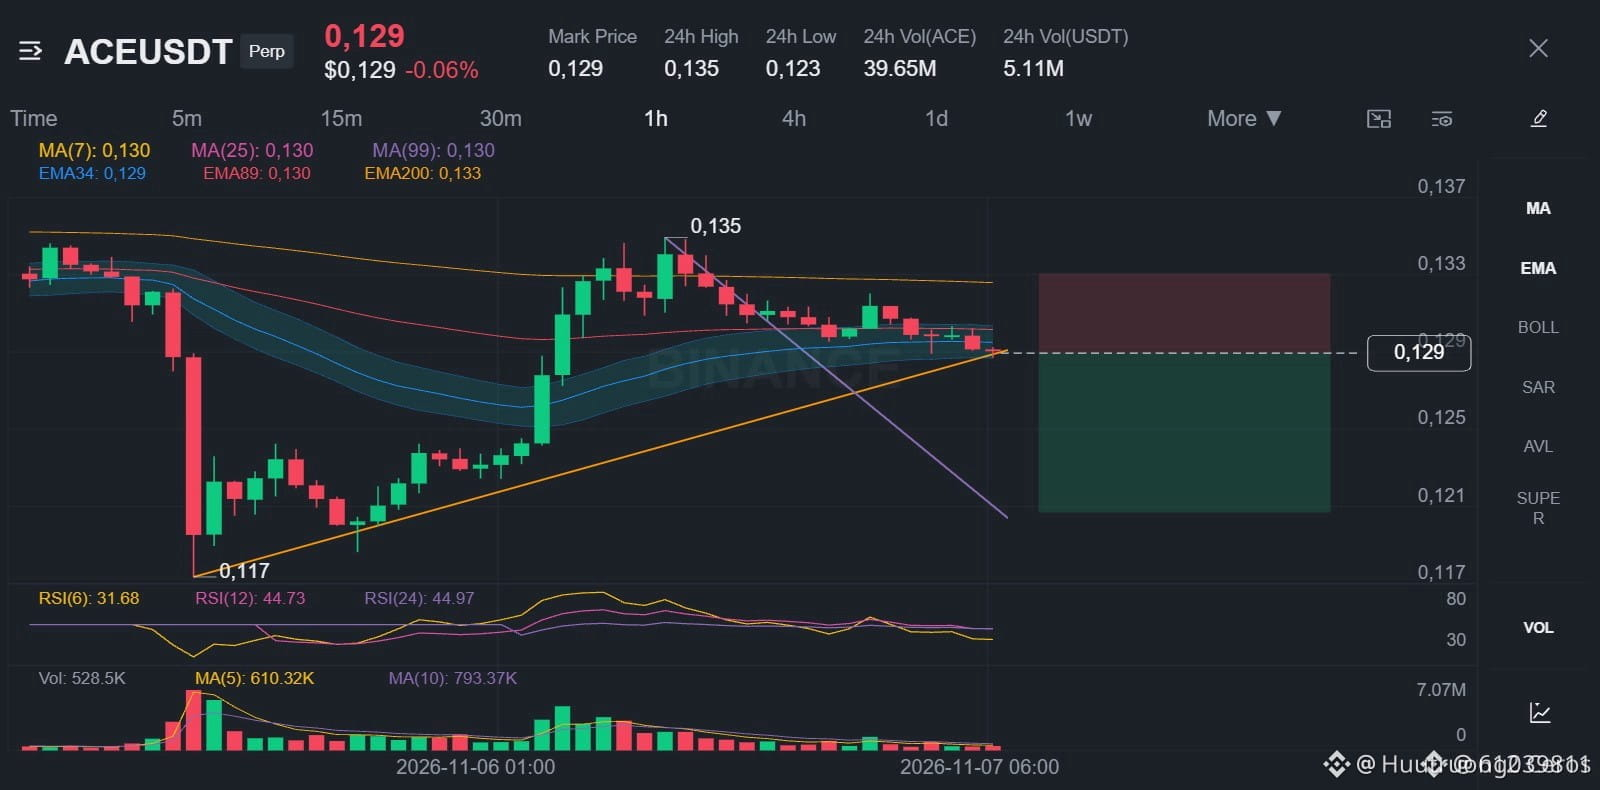
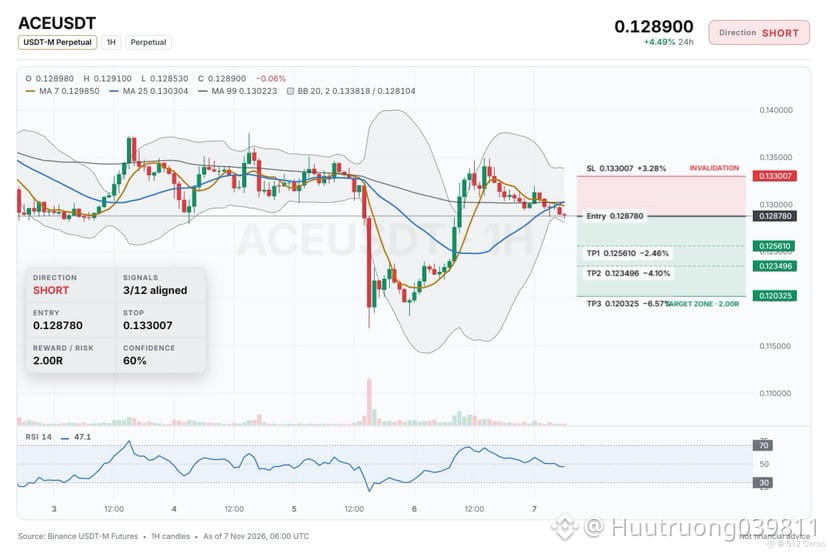
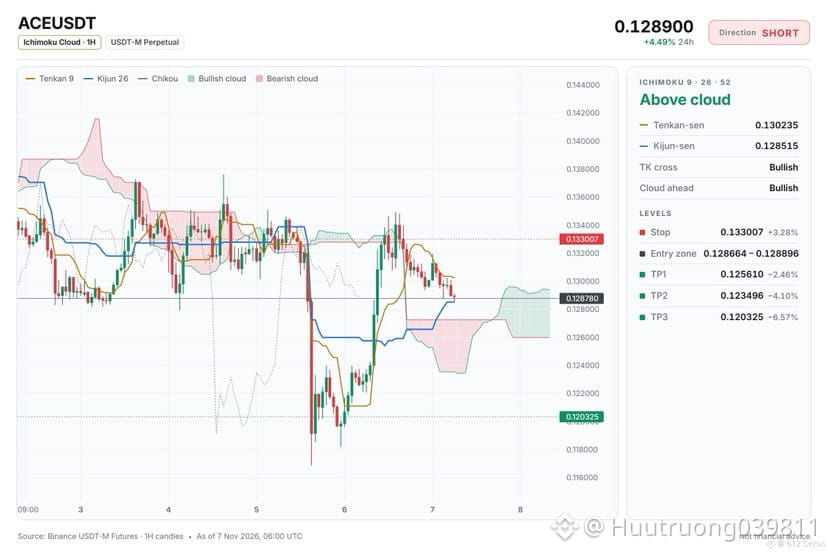
🔴 $ACE /USDT · Bias: SHORT
ACE is in a bearish stack on the 4h timeframe, pointing lower.
Entry: 0.128664 – 0.128896
TP1: 0.125610 (-2.5%)
TP2: 0.123496 (-4.1%)
TP3: 0.120325 (-6.6%)
SL: 0.133007 (+3.3%)
Note: moderate conviction only, keep size light.
Why: The 4h trend shows price below EMA50 below EMA200, a bearish stack meaning the swing trend is down.
Risk: Stronger than BTC (+3.34% 24h vs BTC)
Plan: close 50% at TP1, 25% at TP2, 25% at TP3, and move the stop to entry after TP1.
Do you think this short setup is worth taking?
{spot}(ACEUSDT)
🔴 $ACE /USDT · Bias: SHORT
ACE is in a bearish stack on the 4h timeframe, pointing lower.
Entry: 0.128664 – 0.128896
TP1: 0.125610 (-2.5%)
TP2: 0.123496 (-4.1%)
TP3: 0.120325 (-6.6%)
SL: 0.133007 (+3.3%)
Note: moderate conviction only, keep size light.
Why: The 4h trend shows price below EMA50 below EMA200, a bearish stack meaning the swing trend is down.
Risk: Stronger than BTC (+3.34% 24h vs BTC)
Plan: close 50% at TP1, 25% at TP2, 25% at TP3, and move the stop to entry after TP1.
Do you think this short setup is worth taking?
ACE is in a bearish stack on the 4h timeframe, pointing lower.
Entry: 0.128664 – 0.128896
TP1: 0.125610 (-2.5%)
TP2: 0.123496 (-4.1%)
TP3: 0.120325 (-6.6%)
SL: 0.133007 (+3.3%)
Note: moderate conviction only, keep size light.
Why: The 4h trend shows price below EMA50 below EMA200, a bearish stack meaning the swing trend is down.
Risk: Stronger than BTC (+3.34% 24h vs BTC)
Plan: close 50% at TP1, 25% at TP2, 25% at TP3, and move the stop to entry after TP1.
Do you think this short setup is worth taking?
60
·
--
Жоғары (өспелі)
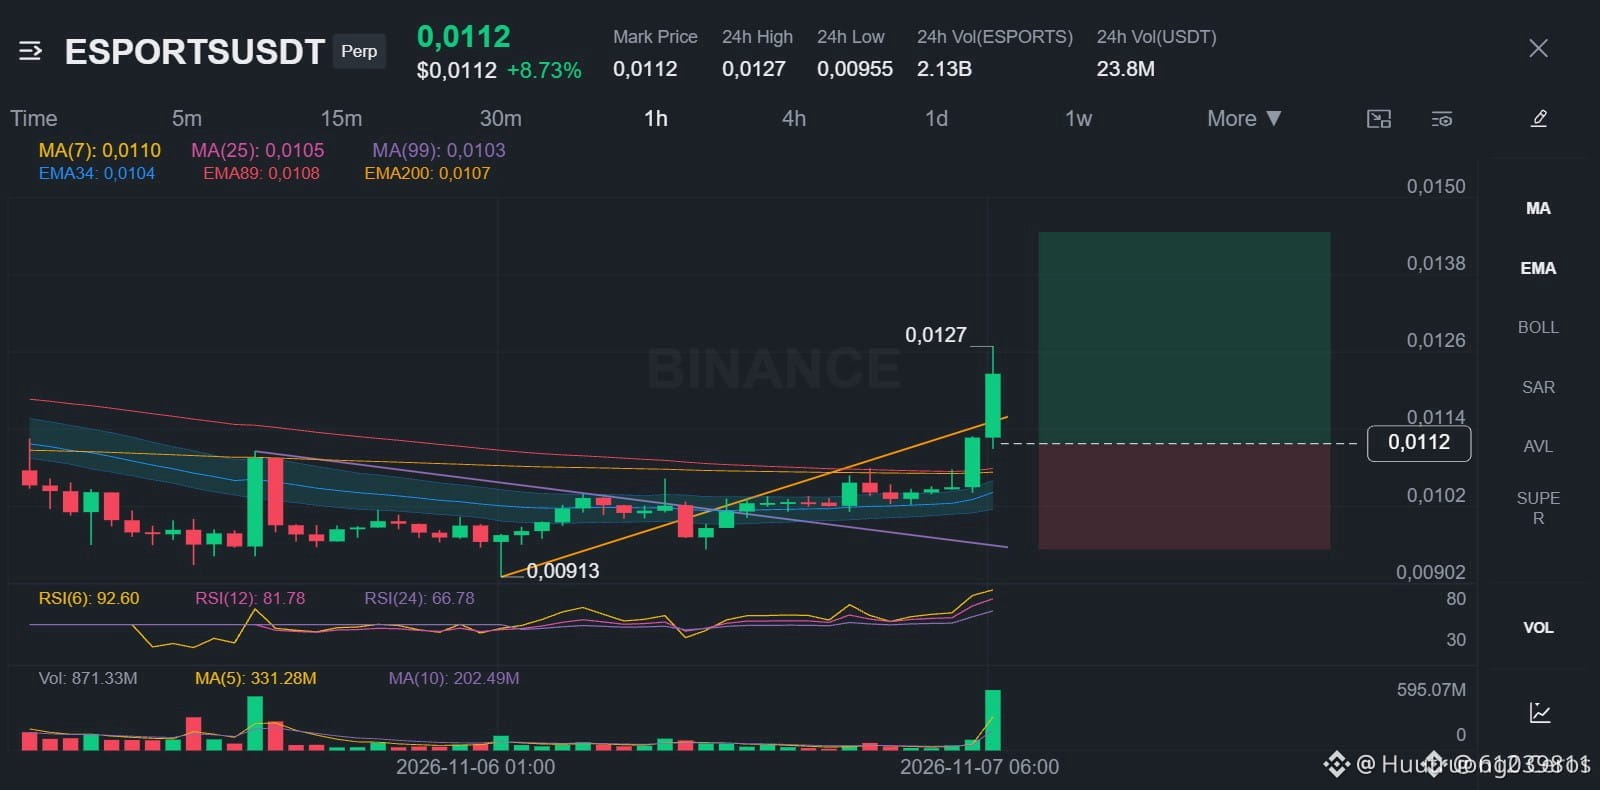
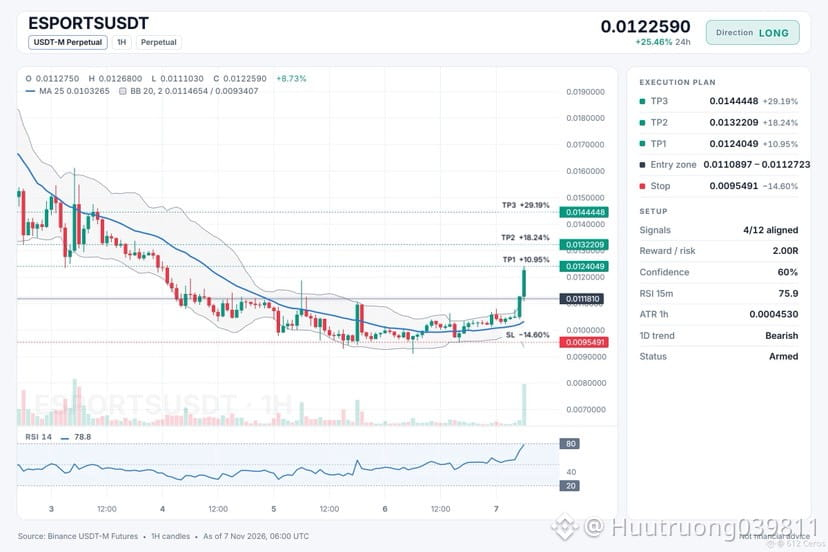
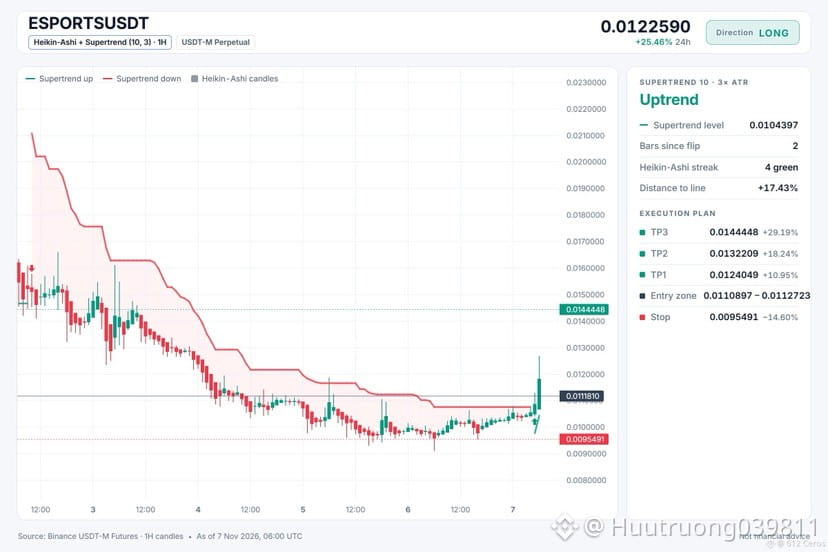
🟢 $ESPORTS /USDT · Bias: LONG
The 1h and 4h trends show bullish stacks pushing price higher.
Entry: 0.0110897 – 0.0112723
TP1: 0.0124049 (+10.9%)
TP2: 0.0132209 (+18.2%)
TP3: 0.0144448 (+29.2%)
SL: 0.0095491 (-14.6%)
Caution: counter-trend idea backed by 4 signals only. Smaller size, hard stop.
Why: The 1h bullish stack means the short-term trend is up, and buyers are driving the move with strong momentum.
Risk: Price ran hot, pullbacks are common from here (1h RSI 78.8, overbought)
Plan: close 50% at TP1, 25% at TP2, 25% at TP3, and move the stop to entry after TP1.
Do you see this as a valid reversal entry?
{future}(ESPORTSUSDT)
🟢 $ESPORTS /USDT · Bias: LONG
The 1h and 4h trends show bullish stacks pushing price higher.
Entry: 0.0110897 – 0.0112723
TP1: 0.0124049 (+10.9%)
TP2: 0.0132209 (+18.2%)
TP3: 0.0144448 (+29.2%)
SL: 0.0095491 (-14.6%)
Caution: counter-trend idea backed by 4 signals only. Smaller size, hard stop.
Why: The 1h bullish stack means the short-term trend is up, and buyers are driving the move with strong momentum.
Risk: Price ran hot, pullbacks are common from here (1h RSI 78.8, overbought)
Plan: close 50% at TP1, 25% at TP2, 25% at TP3, and move the stop to entry after TP1.
Do you see this as a valid reversal entry?
The 1h and 4h trends show bullish stacks pushing price higher.
Entry: 0.0110897 – 0.0112723
TP1: 0.0124049 (+10.9%)
TP2: 0.0132209 (+18.2%)
TP3: 0.0144448 (+29.2%)
SL: 0.0095491 (-14.6%)
Caution: counter-trend idea backed by 4 signals only. Smaller size, hard stop.
Why: The 1h bullish stack means the short-term trend is up, and buyers are driving the move with strong momentum.
Risk: Price ran hot, pullbacks are common from here (1h RSI 78.8, overbought)
Plan: close 50% at TP1, 25% at TP2, 25% at TP3, and move the stop to entry after TP1.
Do you see this as a valid reversal entry?
63
·
--
Төмен (кемімелі)
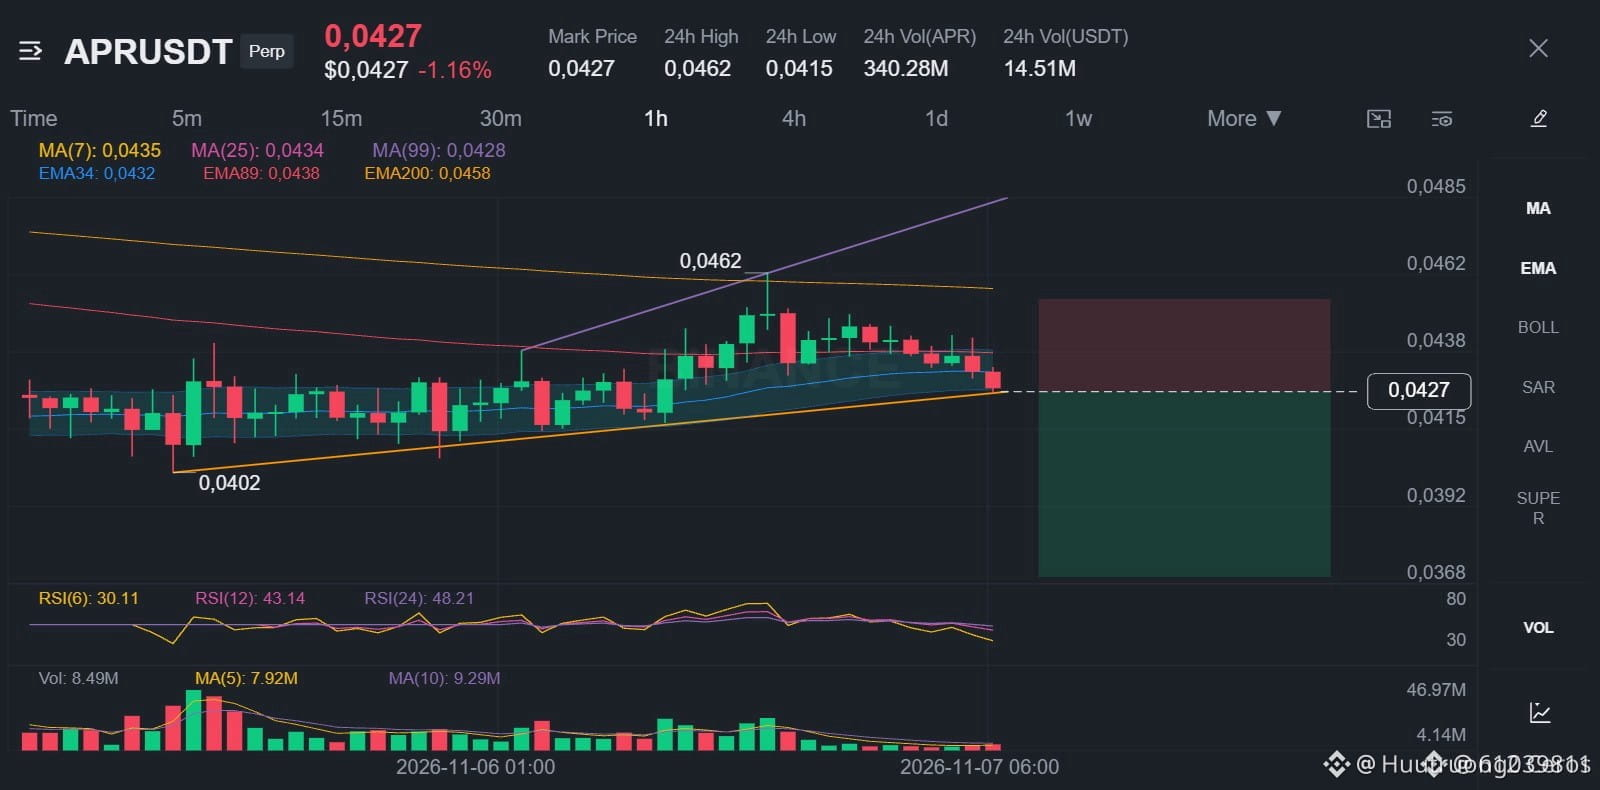
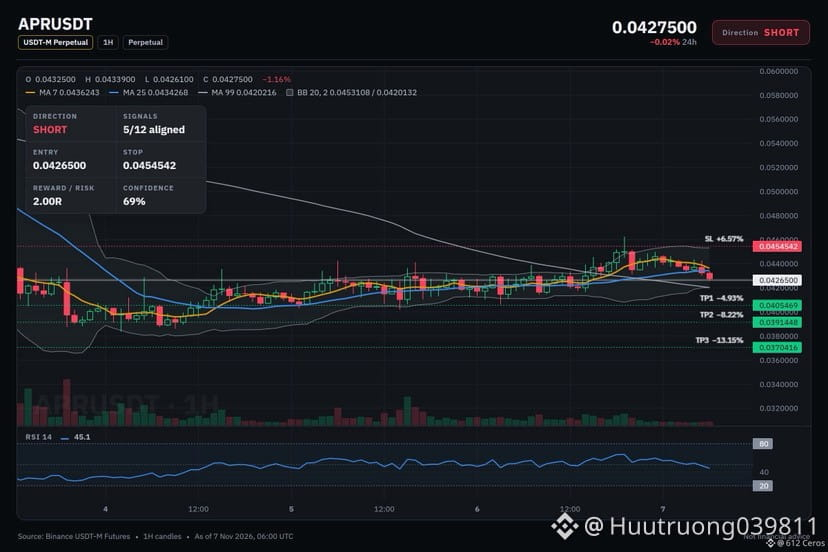
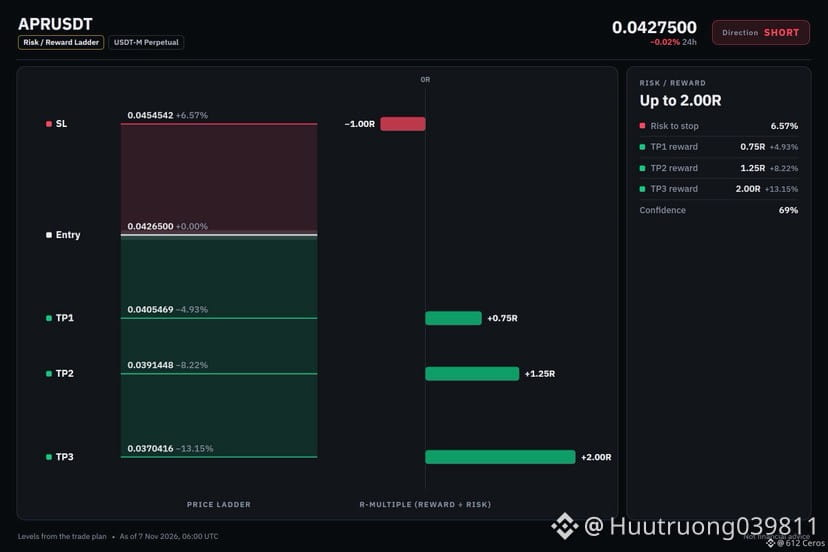
🔴 $APR /USDT · Bias: SHORT
The daily, 4h and 1h trends all point lower for APR, a bearish stack.
Entry: 0.0425272 – 0.0427728
TP1: 0.0405469 (-4.9%)
TP2: 0.0391448 (-8.2%)
TP3: 0.0370416 (-13.1%)
SL: 0.0454542 (+6.6%)
Note: moderate conviction only, keep size light.
Why: Daily trend: price below EMA50 below EMA200, bearish stack, meaning the big-picture trend is down.
Risk: Range bottom, buyers often step in (RSI z −3.26)
Plan: close 50% at TP1, 25% at TP2, 25% at TP3, and move the stop to entry after TP1.
Do you see a clean short entry here?
{future}(APRUSDT)
🔴 $APR /USDT · Bias: SHORT
The daily, 4h and 1h trends all point lower for APR, a bearish stack.
Entry: 0.0425272 – 0.0427728
TP1: 0.0405469 (-4.9%)
TP2: 0.0391448 (-8.2%)
TP3: 0.0370416 (-13.1%)
SL: 0.0454542 (+6.6%)
Note: moderate conviction only, keep size light.
Why: Daily trend: price below EMA50 below EMA200, bearish stack, meaning the big-picture trend is down.
Risk: Range bottom, buyers often step in (RSI z −3.26)
Plan: close 50% at TP1, 25% at TP2, 25% at TP3, and move the stop to entry after TP1.
Do you see a clean short entry here?
The daily, 4h and 1h trends all point lower for APR, a bearish stack.
Entry: 0.0425272 – 0.0427728
TP1: 0.0405469 (-4.9%)
TP2: 0.0391448 (-8.2%)
TP3: 0.0370416 (-13.1%)
SL: 0.0454542 (+6.6%)
Note: moderate conviction only, keep size light.
Why: Daily trend: price below EMA50 below EMA200, bearish stack, meaning the big-picture trend is down.
Risk: Range bottom, buyers often step in (RSI z −3.26)
Plan: close 50% at TP1, 25% at TP2, 25% at TP3, and move the stop to entry after TP1.
Do you see a clean short entry here?
80
#BinancePick 🚀 Exploring new opportunities in Web3 with Binance! Every step is a chance to learn, grow, and earn. 💎
What’s your favorite crypto project? 👇
#BinancePick 🚀 Exploring new opportunities in Web3 with Binance! Every step is a chance to learn, grow, and earn. 💎
What’s your favorite crypto project? 👇
What’s your favorite crypto project? 👇

8
·
--
Төмен (кемімелі)
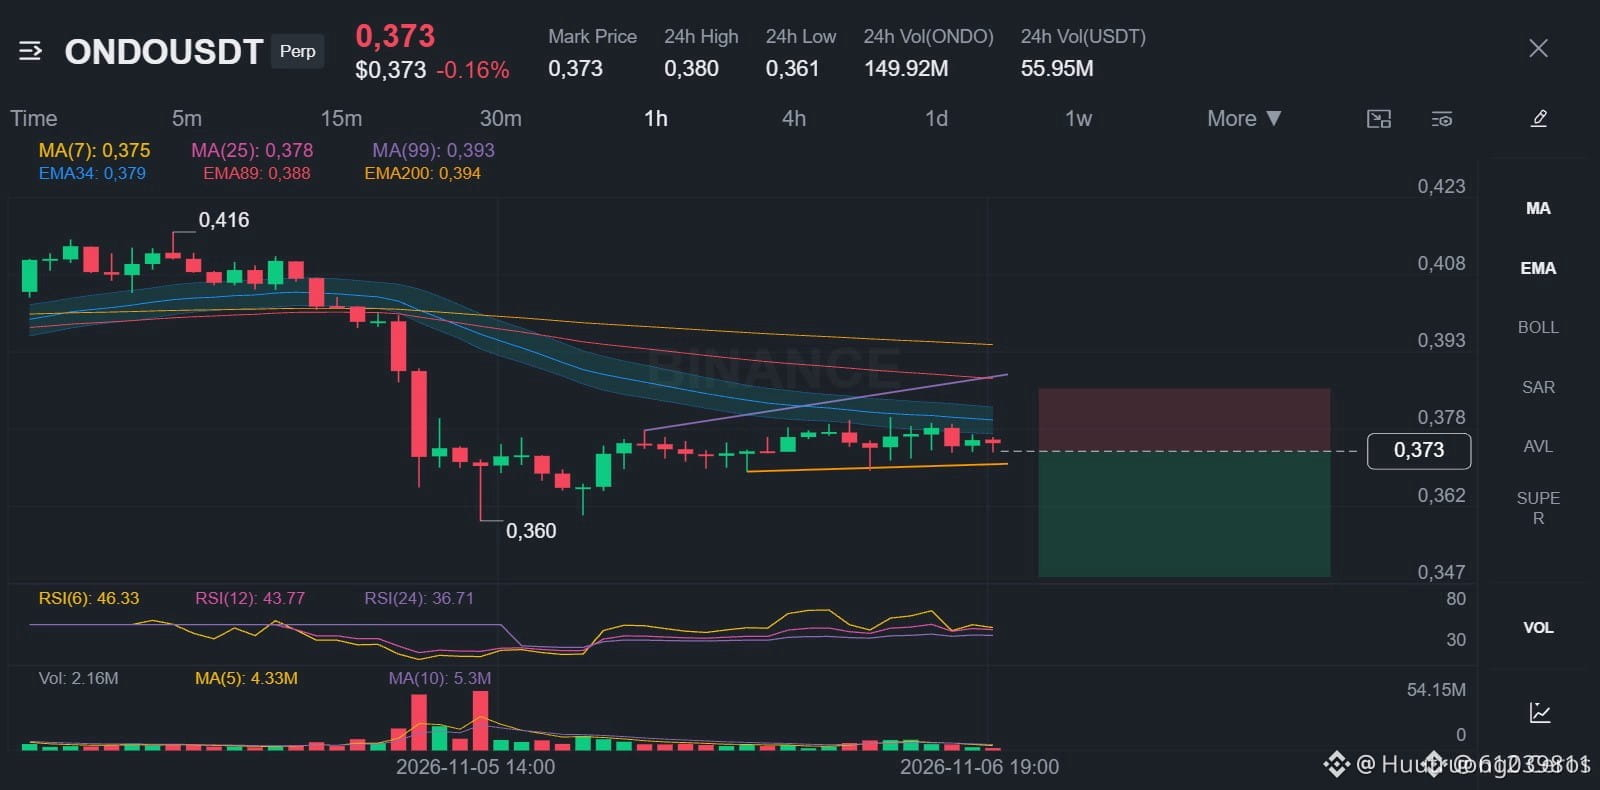
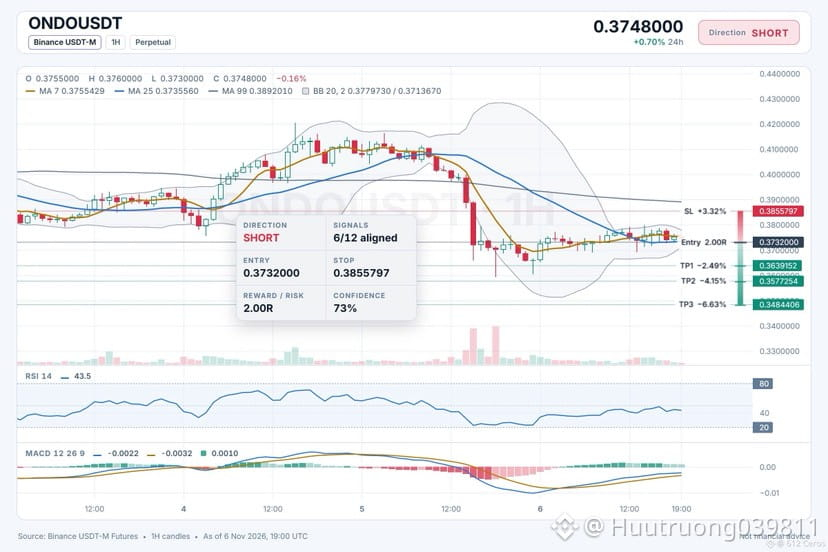
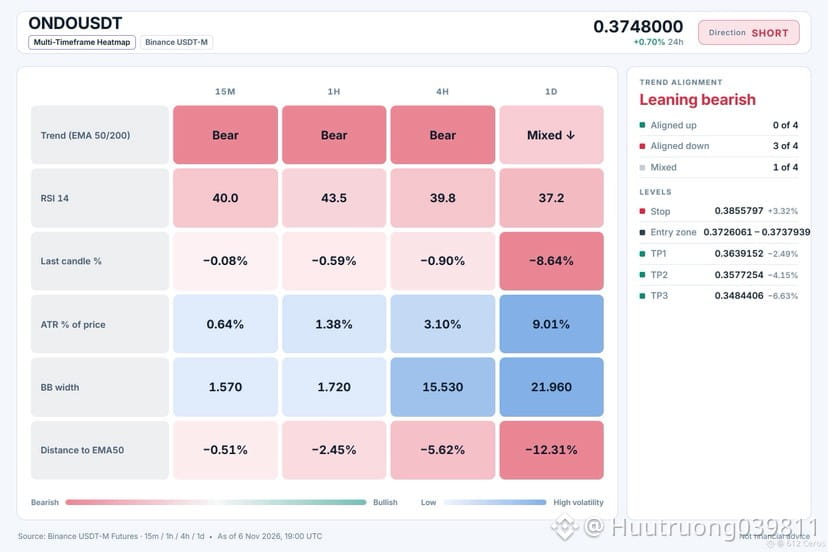
🔴 $ONDO /USDT · Bias: SHORT
4h price sits below a bearish EMA stack, so the swing trend is down.
Entry: 0.3726061 – 0.3737939
TP1: 0.3639152 (-2.5%)
TP2: 0.3577254 (-4.1%)
TP3: 0.3484406 (-6.6%)
SL: 0.3855797 (+3.3%)
Why: The 4h trend shows price below EMA50 and EMA200, a bearish stack meaning the swing trend is down.
Plan: close 50% at TP1, 25% at TP2, 25% at TP3, and move the stop to entry after TP1.
Where do you see the next move for ONDO from the entry zone?
{spot}(ONDOUSDT)
🔴 $ONDO /USDT · Bias: SHORT
4h price sits below a bearish EMA stack, so the swing trend is down.
Entry: 0.3726061 – 0.3737939
TP1: 0.3639152 (-2.5%)
TP2: 0.3577254 (-4.1%)
TP3: 0.3484406 (-6.6%)
SL: 0.3855797 (+3.3%)
Why: The 4h trend shows price below EMA50 and EMA200, a bearish stack meaning the swing trend is down.
Plan: close 50% at TP1, 25% at TP2, 25% at TP3, and move the stop to entry after TP1.
Where do you see the next move for ONDO from the entry zone?
4h price sits below a bearish EMA stack, so the swing trend is down.
Entry: 0.3726061 – 0.3737939
TP1: 0.3639152 (-2.5%)
TP2: 0.3577254 (-4.1%)
TP3: 0.3484406 (-6.6%)
SL: 0.3855797 (+3.3%)
Why: The 4h trend shows price below EMA50 and EMA200, a bearish stack meaning the swing trend is down.
Plan: close 50% at TP1, 25% at TP2, 25% at TP3, and move the stop to entry after TP1.
Where do you see the next move for ONDO from the entry zone?
23
·
--
Төмен (кемімелі)
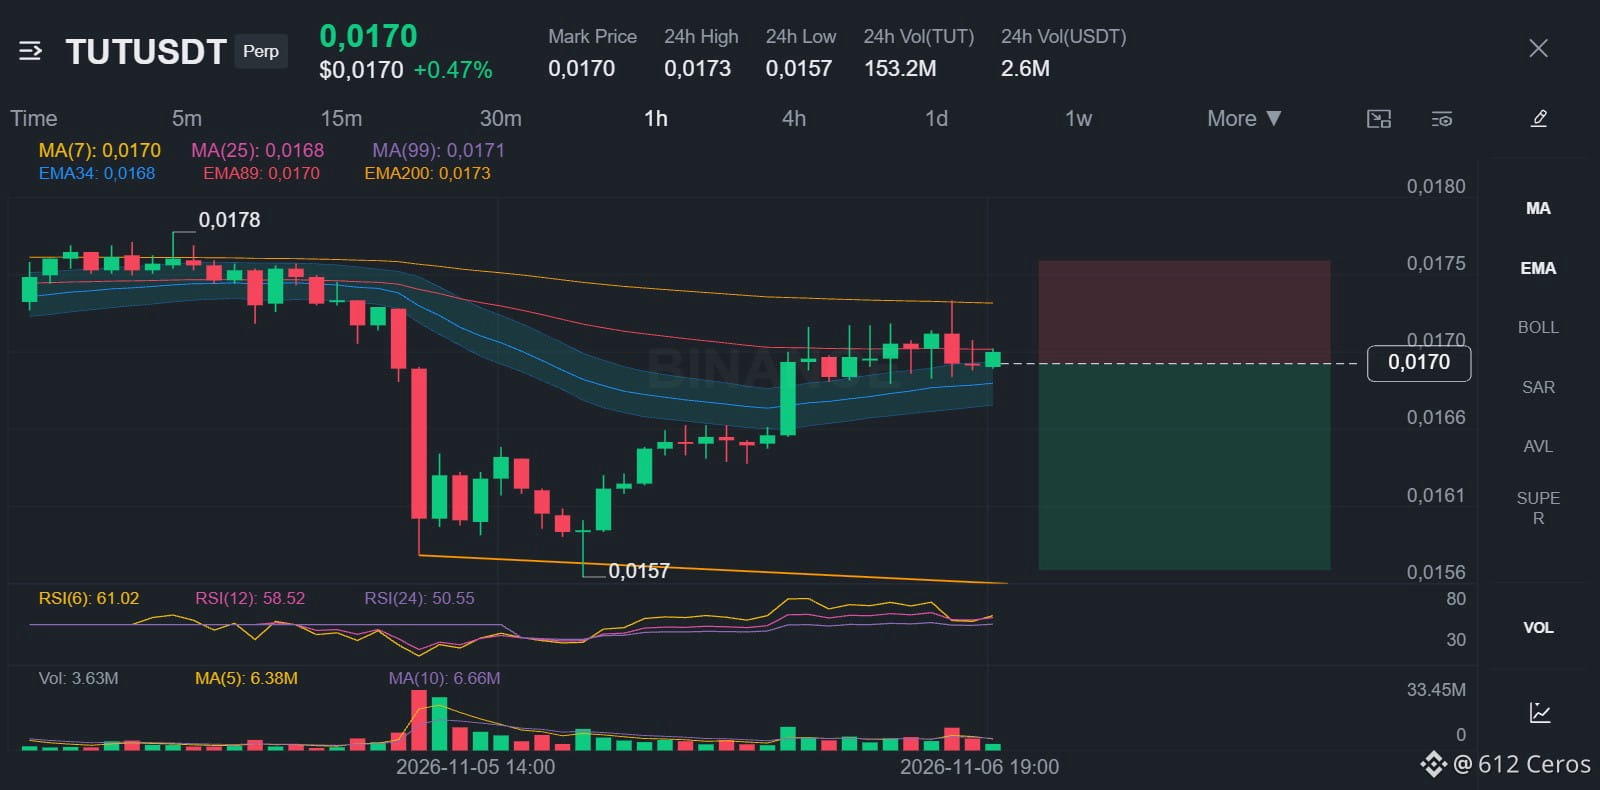
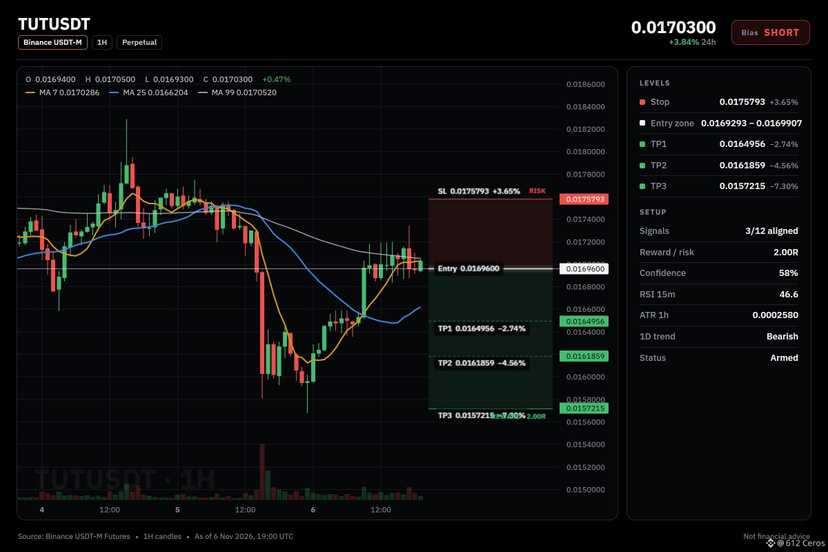
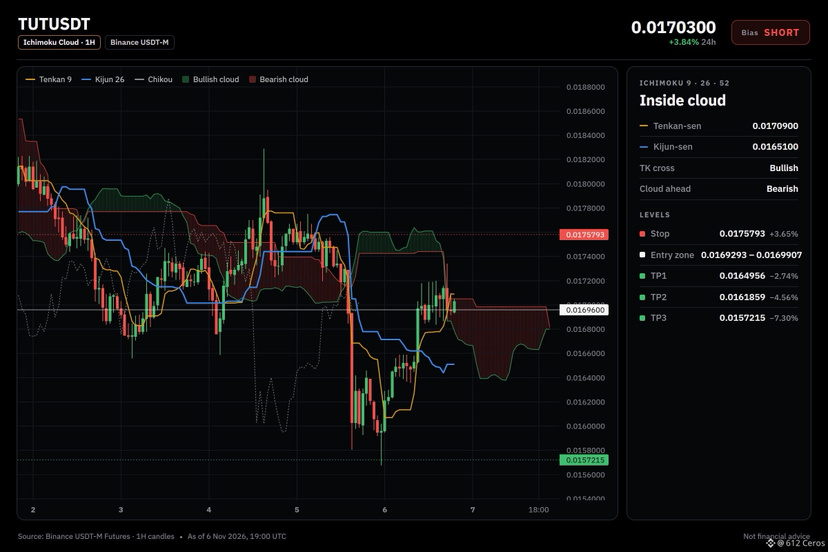
🔴 $TUT /USDT · Bias: SHORT
The daily trend is bearish and the 4h trend is bearish, so price should move down.
Entry: 0.0169293 – 0.0169907
TP1: 0.0164956 (-2.7%)
TP2: 0.0161859 (-4.6%)
TP3: 0.0157215 (-7.3%)
SL: 0.0175793 (+3.7%)
Note: moderate conviction only, keep size light.
Why: The daily trend shows a bearish EMA stack, meaning the big-picture trend is down, and the 4h trend shows a bearish EMA stack, meaning the swing trend is down.
Risk: Buyers have the momentum (1h RSI 57.0)
Plan: close 50% at TP1, 25% at TP2, 25% at TP3, and move the stop to entry after TP1.
Do you think this short is worth taking at the entry zone?
{spot}(TUTUSDT)
🔴 $TUT /USDT · Bias: SHORT
The daily trend is bearish and the 4h trend is bearish, so price should move down.
Entry: 0.0169293 – 0.0169907
TP1: 0.0164956 (-2.7%)
TP2: 0.0161859 (-4.6%)
TP3: 0.0157215 (-7.3%)
SL: 0.0175793 (+3.7%)
Note: moderate conviction only, keep size light.
Why: The daily trend shows a bearish EMA stack, meaning the big-picture trend is down, and the 4h trend shows a bearish EMA stack, meaning the swing trend is down.
Risk: Buyers have the momentum (1h RSI 57.0)
Plan: close 50% at TP1, 25% at TP2, 25% at TP3, and move the stop to entry after TP1.
Do you think this short is worth taking at the entry zone?
The daily trend is bearish and the 4h trend is bearish, so price should move down.
Entry: 0.0169293 – 0.0169907
TP1: 0.0164956 (-2.7%)
TP2: 0.0161859 (-4.6%)
TP3: 0.0157215 (-7.3%)
SL: 0.0175793 (+3.7%)
Note: moderate conviction only, keep size light.
Why: The daily trend shows a bearish EMA stack, meaning the big-picture trend is down, and the 4h trend shows a bearish EMA stack, meaning the swing trend is down.
Risk: Buyers have the momentum (1h RSI 57.0)
Plan: close 50% at TP1, 25% at TP2, 25% at TP3, and move the stop to entry after TP1.
Do you think this short is worth taking at the entry zone?
23
·
--
Төмен (кемімелі)
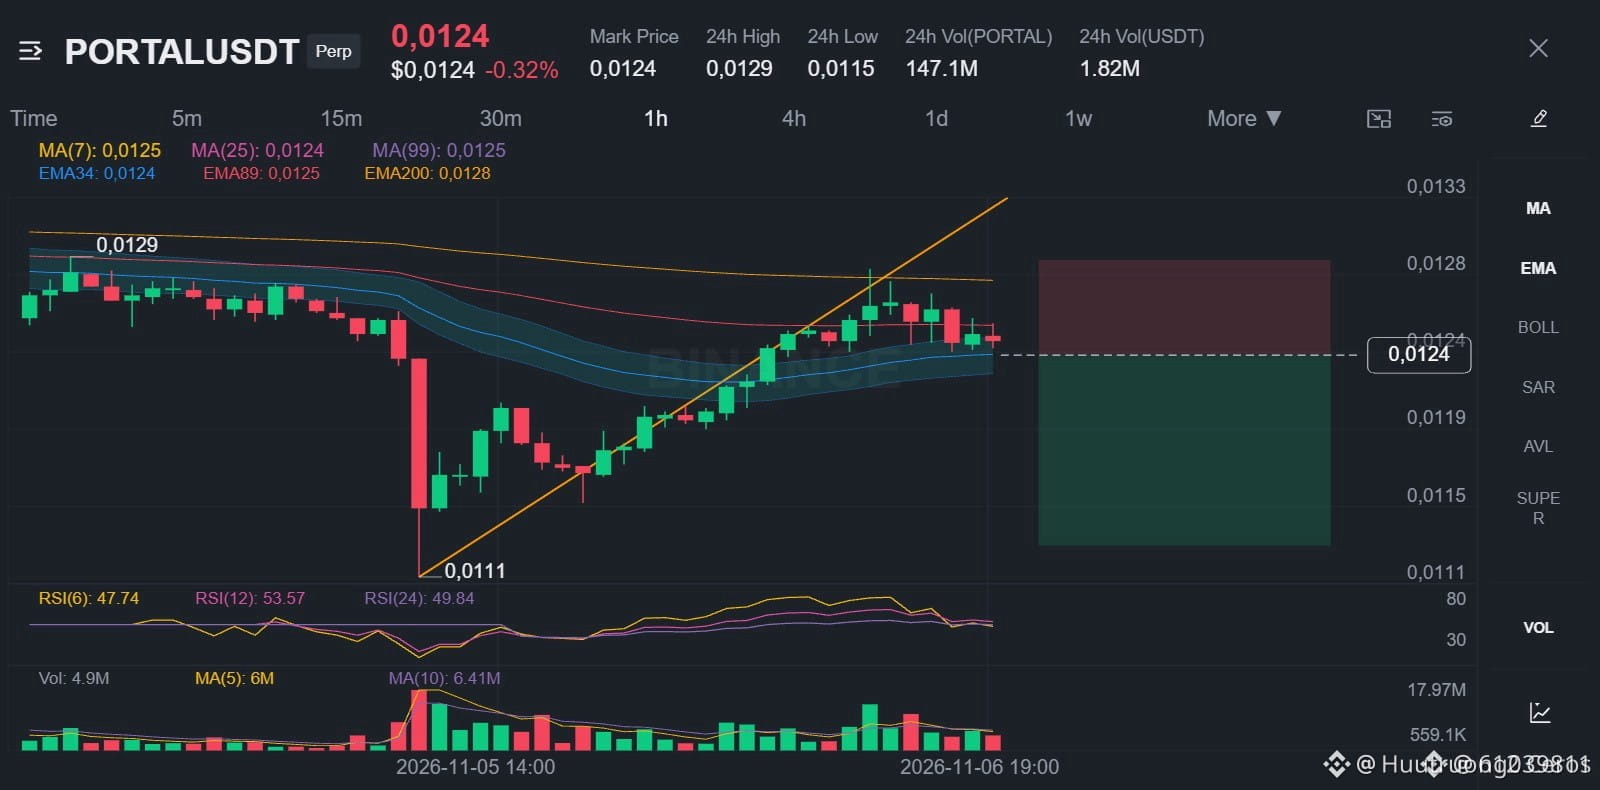
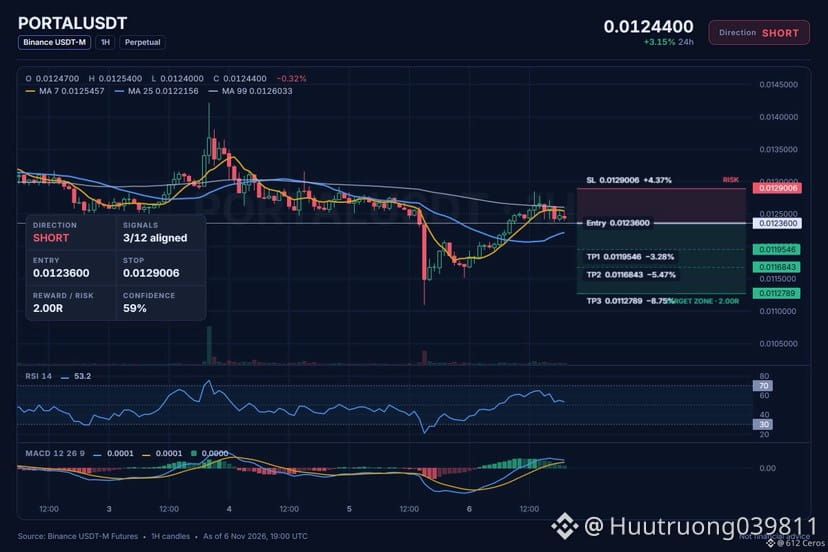
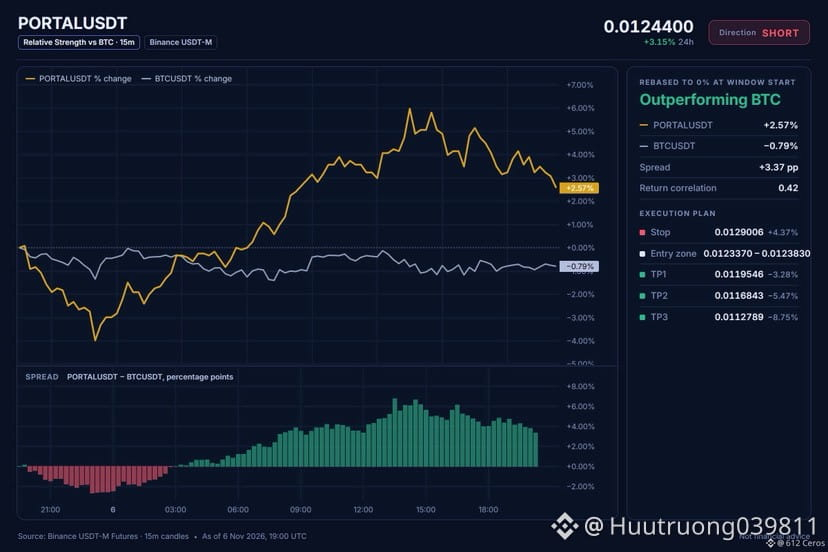
🔴 $PORTAL /USDT · Bias: SHORT
Price sits below stacked bearish EMAs on the 4h, so the swing trend is down.
Entry: 0.0123370 – 0.0123830
TP1: 0.0119546 (-3.3%)
TP2: 0.0116843 (-5.5%)
TP3: 0.0112789 (-8.7%)
SL: 0.0129006 (+4.4%)
Note: moderate conviction only, keep size light.
Why: The 4h trend shows price below EMA50 and EMA200 in a bearish stack, meaning the swing trend is clearly down.
Risk: Stronger than BTC (+4.20% 24h vs BTC)
Plan: close 50% at TP1, 25% at TP2, 25% at TP3, and move the stop to entry after TP1.
Do you see this short setup as high probability right now?
{spot}(PORTALUSDT)
🔴 $PORTAL /USDT · Bias: SHORT
Price sits below stacked bearish EMAs on the 4h, so the swing trend is down.
Entry: 0.0123370 – 0.0123830
TP1: 0.0119546 (-3.3%)
TP2: 0.0116843 (-5.5%)
TP3: 0.0112789 (-8.7%)
SL: 0.0129006 (+4.4%)
Note: moderate conviction only, keep size light.
Why: The 4h trend shows price below EMA50 and EMA200 in a bearish stack, meaning the swing trend is clearly down.
Risk: Stronger than BTC (+4.20% 24h vs BTC)
Plan: close 50% at TP1, 25% at TP2, 25% at TP3, and move the stop to entry after TP1.
Do you see this short setup as high probability right now?
Price sits below stacked bearish EMAs on the 4h, so the swing trend is down.
Entry: 0.0123370 – 0.0123830
TP1: 0.0119546 (-3.3%)
TP2: 0.0116843 (-5.5%)
TP3: 0.0112789 (-8.7%)
SL: 0.0129006 (+4.4%)
Note: moderate conviction only, keep size light.
Why: The 4h trend shows price below EMA50 and EMA200 in a bearish stack, meaning the swing trend is clearly down.
Risk: Stronger than BTC (+4.20% 24h vs BTC)
Plan: close 50% at TP1, 25% at TP2, 25% at TP3, and move the stop to entry after TP1.
Do you see this short setup as high probability right now?
21
·
--
Төмен (кемімелі)
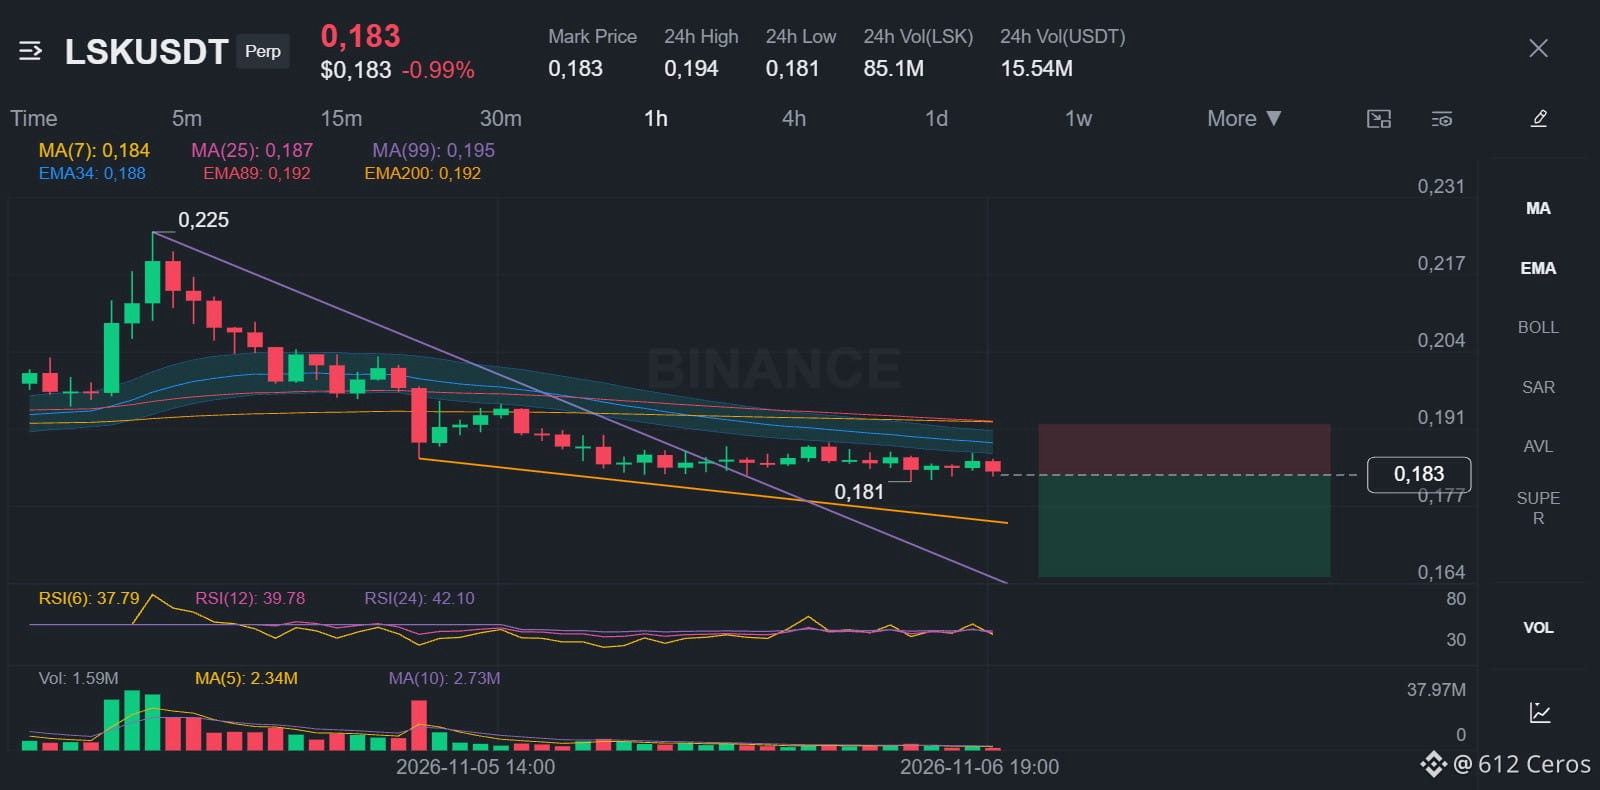
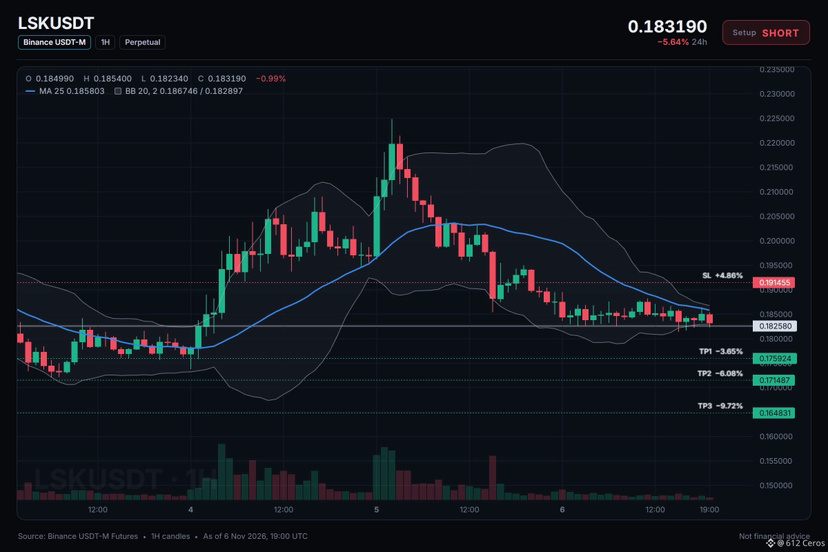
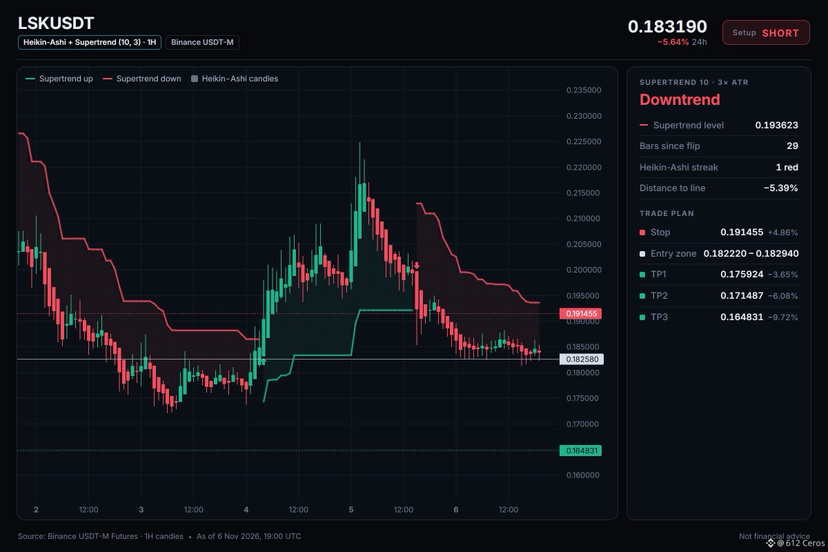
🔴 $LSK /USDT · Bias: SHORT
The 4h trend shows price below a bearish EMA stack, so the swing trend is down.
Entry: 0.182220 – 0.182940
TP1: 0.175924 (-3.6%)
TP2: 0.171487 (-6.1%)
TP3: 0.164831 (-9.7%)
SL: 0.191455 (+4.9%)
Note: moderate conviction only, keep size light.
Why: 4h trend shows price below stacked bearish EMAs, meaning the swing trend is down with 43.9 RSI indicating sellers hold momentum.
Plan: close 50% at TP1, 25% at TP2, 25% at TP3, and move the stop to entry after TP1.
Where do you see the best short target on this pair?
{spot}(LSKUSDT)
🔴 $LSK /USDT · Bias: SHORT
The 4h trend shows price below a bearish EMA stack, so the swing trend is down.
Entry: 0.182220 – 0.182940
TP1: 0.175924 (-3.6%)
TP2: 0.171487 (-6.1%)
TP3: 0.164831 (-9.7%)
SL: 0.191455 (+4.9%)
Note: moderate conviction only, keep size light.
Why: 4h trend shows price below stacked bearish EMAs, meaning the swing trend is down with 43.9 RSI indicating sellers hold momentum.
Plan: close 50% at TP1, 25% at TP2, 25% at TP3, and move the stop to entry after TP1.
Where do you see the best short target on this pair?
The 4h trend shows price below a bearish EMA stack, so the swing trend is down.
Entry: 0.182220 – 0.182940
TP1: 0.175924 (-3.6%)
TP2: 0.171487 (-6.1%)
TP3: 0.164831 (-9.7%)
SL: 0.191455 (+4.9%)
Note: moderate conviction only, keep size light.
Why: 4h trend shows price below stacked bearish EMAs, meaning the swing trend is down with 43.9 RSI indicating sellers hold momentum.
Plan: close 50% at TP1, 25% at TP2, 25% at TP3, and move the stop to entry after TP1.
Where do you see the best short target on this pair?
14
·
--
Төмен (кемімелі)
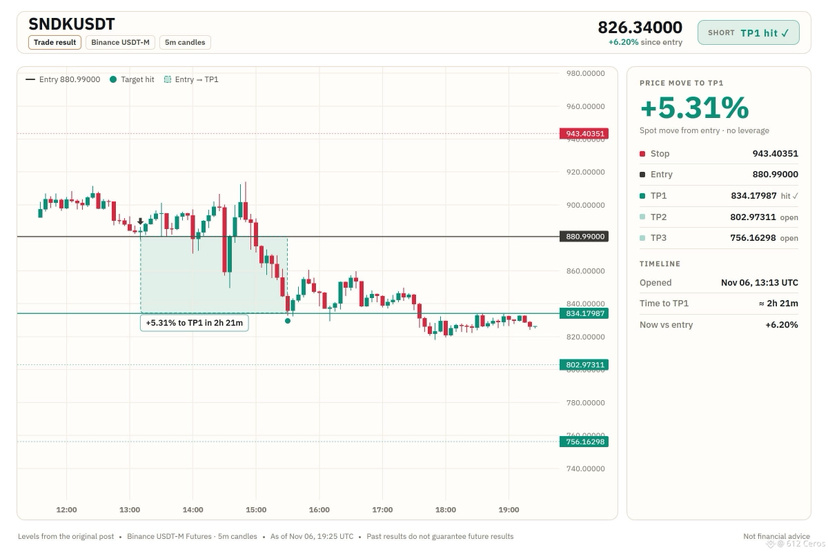
$SNDK USDT short hit TP1 📉📊
Spot move of +5.31% from entry in about 2h 21m. No leverage used.
Always manage your risk and size positions responsibly. Trade safe ✌️
{future}(SNDKUSDT)
$SNDK USDT short hit TP1 📉📊
Spot move of +5.31% from entry in about 2h 21m. No leverage used.
Always manage your risk and size positions responsibly. Trade safe ✌️
Spot move of +5.31% from entry in about 2h 21m. No leverage used.
Always manage your risk and size positions responsibly. Trade safe ✌️
Huutruong039811
·
--
Төмен (кемімелі)🔴 $SNDK /USDT · Bias: SHORT
Daily, 4h and 1h trends all show bearish stacked EMAs, so price should move down.
Entry: 878.20593 – 883.77407
TP1: 834.17987 (-5.3%)
TP2: 802.97311 (-8.9%)
TP3: 756.16298 (-14.2%)
SL: 943.40351 (+7.1%)
Why: The daily trend shows price below EMA50 below EMA200, a bearish stack, meaning the big-picture trend is down.
Risk: Buyers are driving the move (15m ADX 32.4)
Plan: close 50% at TP1, 25% at TP2, 25% at TP3, and move the stop to entry after TP1.
Do you agree this short setup is worth taking at the entry zone?
Daily, 4h and 1h trends all show bearish stacked EMAs, so price should move down.
Entry: 878.20593 – 883.77407
TP1: 834.17987 (-5.3%)
TP2: 802.97311 (-8.9%)
TP3: 756.16298 (-14.2%)
SL: 943.40351 (+7.1%)
Why: The daily trend shows price below EMA50 below EMA200, a bearish stack, meaning the big-picture trend is down.
Risk: Buyers are driving the move (15m ADX 32.4)
Plan: close 50% at TP1, 25% at TP2, 25% at TP3, and move the stop to entry after TP1.
Do you agree this short setup is worth taking at the entry zone?
23
·
--
Төмен (кемімелі)
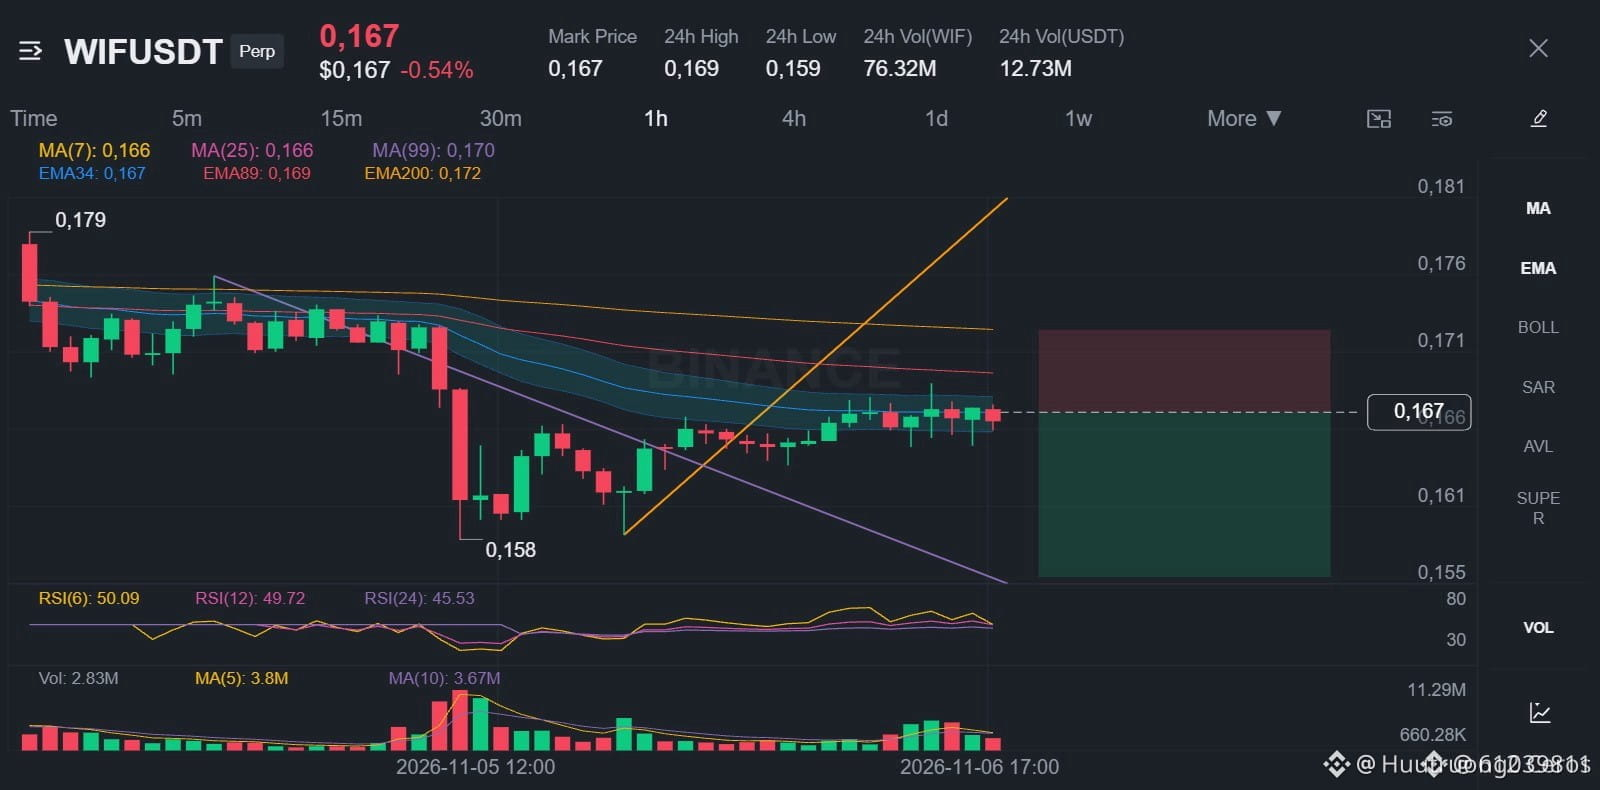
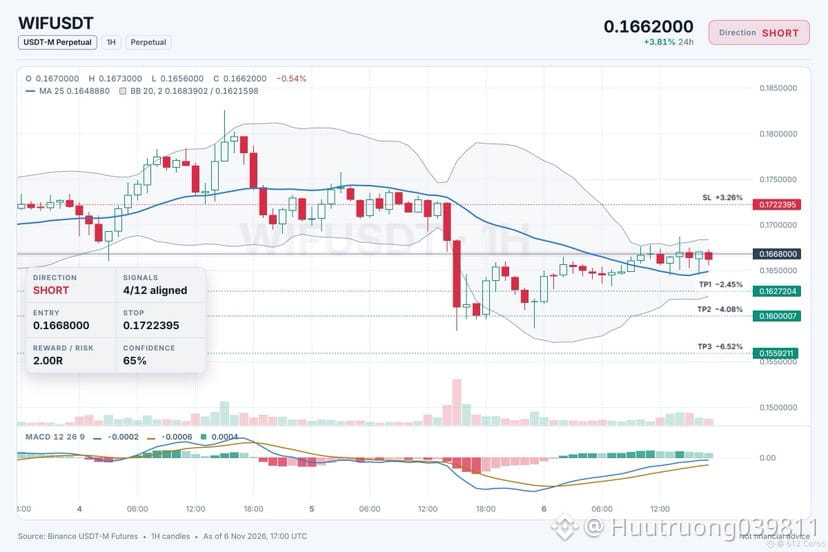
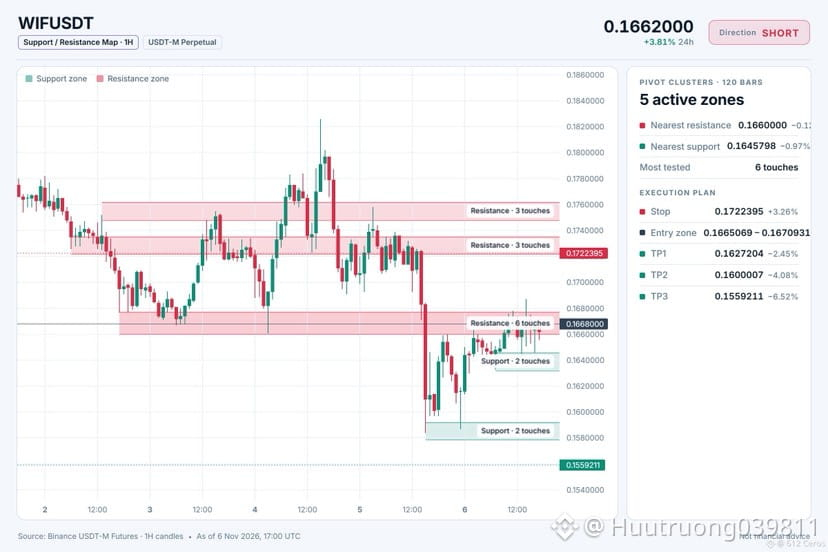
🔴 $WIF /USDT · Bias: SHORT
Daily trend shows a bearish EMA stack, so price should move down.
Entry: 0.1665069 – 0.1670931
TP1: 0.1627204 (-2.4%)
TP2: 0.1600007 (-4.1%)
TP3: 0.1559211 (-6.5%)
SL: 0.1722395 (+3.3%)
Note: moderate conviction only, keep size light.
Why: The daily trend shows price below the EMA50 and EMA200, which means the big picture trend is down.
Risk: Stronger than BTC (+2.41% 24h vs BTC)
Plan: close 50% at TP1, 25% at TP2, 25% at TP3, and move the stop to entry after TP1.
Where do you see this trade heading?
{spot}(WIFUSDT)
🔴 $WIF /USDT · Bias: SHORT
Daily trend shows a bearish EMA stack, so price should move down.
Entry: 0.1665069 – 0.1670931
TP1: 0.1627204 (-2.4%)
TP2: 0.1600007 (-4.1%)
TP3: 0.1559211 (-6.5%)
SL: 0.1722395 (+3.3%)
Note: moderate conviction only, keep size light.
Why: The daily trend shows price below the EMA50 and EMA200, which means the big picture trend is down.
Risk: Stronger than BTC (+2.41% 24h vs BTC)
Plan: close 50% at TP1, 25% at TP2, 25% at TP3, and move the stop to entry after TP1.
Where do you see this trade heading?
Daily trend shows a bearish EMA stack, so price should move down.
Entry: 0.1665069 – 0.1670931
TP1: 0.1627204 (-2.4%)
TP2: 0.1600007 (-4.1%)
TP3: 0.1559211 (-6.5%)
SL: 0.1722395 (+3.3%)
Note: moderate conviction only, keep size light.
Why: The daily trend shows price below the EMA50 and EMA200, which means the big picture trend is down.
Risk: Stronger than BTC (+2.41% 24h vs BTC)
Plan: close 50% at TP1, 25% at TP2, 25% at TP3, and move the stop to entry after TP1.
Where do you see this trade heading?
19
·
--
Жоғары (өспелі)
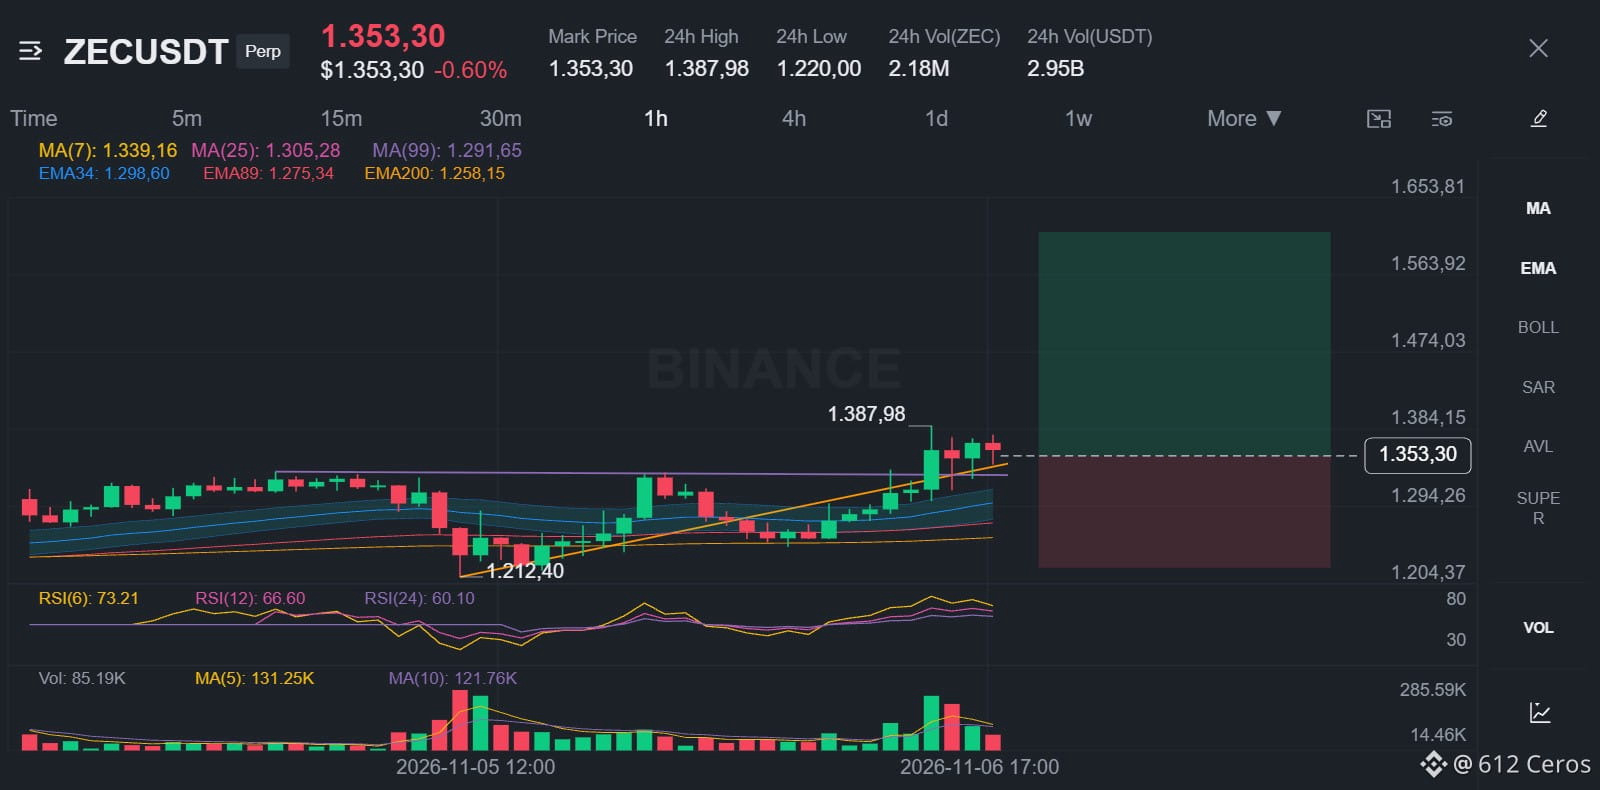
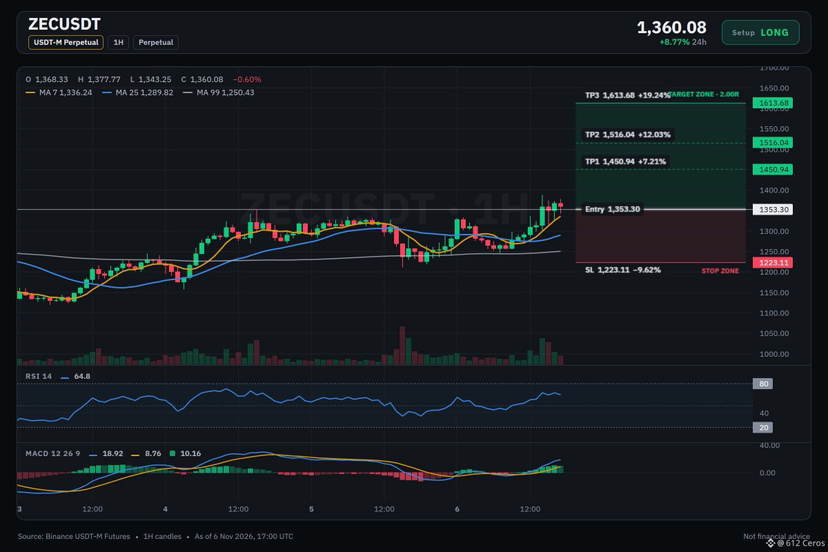
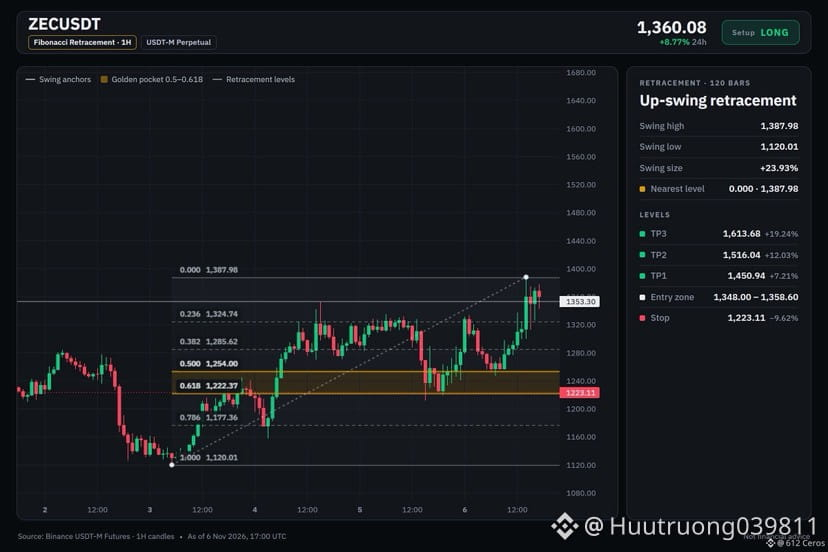
🟢 $ZEC /USDT · Bias: LONG
The daily trend is bullish, so price should move up from the entry zone.
Entry: 1348.00 – 1358.60
TP1: 1450.94 (+7.2%)
TP2: 1516.04 (+12.0%)
TP3: 1613.68 (+19.2%)
SL: 1223.11 (-9.6%)
Why: The daily trend shows price above EMA50 above EMA200, a bullish stack meaning the big-picture trend is up.
Plan: close 50% at TP1, 25% at TP2, 25% at TP3, and move the stop to entry after TP1.
Where do you see ZEC going from here?
{spot}(ZECUSDT)
🟢 $ZEC /USDT · Bias: LONG
The daily trend is bullish, so price should move up from the entry zone.
Entry: 1348.00 – 1358.60
TP1: 1450.94 (+7.2%)
TP2: 1516.04 (+12.0%)
TP3: 1613.68 (+19.2%)
SL: 1223.11 (-9.6%)
Why: The daily trend shows price above EMA50 above EMA200, a bullish stack meaning the big-picture trend is up.
Plan: close 50% at TP1, 25% at TP2, 25% at TP3, and move the stop to entry after TP1.
Where do you see ZEC going from here?
The daily trend is bullish, so price should move up from the entry zone.
Entry: 1348.00 – 1358.60
TP1: 1450.94 (+7.2%)
TP2: 1516.04 (+12.0%)
TP3: 1613.68 (+19.2%)
SL: 1223.11 (-9.6%)
Why: The daily trend shows price above EMA50 above EMA200, a bullish stack meaning the big-picture trend is up.
Plan: close 50% at TP1, 25% at TP2, 25% at TP3, and move the stop to entry after TP1.
Where do you see ZEC going from here?
11
Көбірек контент көру үшін кіріңіз
Binance Square платформасында әлемдік криптоқоғамдастыққа қосылыңыз
⚡️ Криптовалюта туралы ең соңғы және пайдалы ақпаратты алыңыз.
💬 Әлемдегі ең ірі криптобиржаның сеніміне ие.
👍 Расталған авторлардың нақты пікірлерін табыңыз.
Электрондық пошта/телефон нөмірі
Трендтегі тақырыптар
JobsReportRaisesHikeOdds
260,380 рет көрілді
2,062 адам талқылап жатыр
TradFi News | US Adds 165,000 Jobs in October, More Than Double the 65,000 Forecast, as Unemployment Falls to 4.1%
Binance News
·34 лайк
·22.6k рет көрілді
CPITestsDecemberRateOutlook
22,930 рет көрілді
331 адам талқылап жатыр
BitcoinRebounds$75KAsChipsLead
21,545 рет көрілді
226 адам талқылап жатыр