

CRYPTO MECHANIC
10.3k Жариялаулар

CRYPTO MECHANIC
 «Square расталған+» белгісі
Хабарлау
Пайдаланушыны блоктау
Trading Crypto Since 2016 | 🏆 4x Award winner
X: @cryptomechanicX

2025 Blockchain 100 — Трейдер

Creator Awards 2024

Excellence Award (Trading)
6 Жазылым
271.6K+ Жазылушылар
519.5K лайк басылған
7 Белгішелер
Жазбалар
Барлығы
Баға ұсыныстары
Видеолар
Тікелей эфир
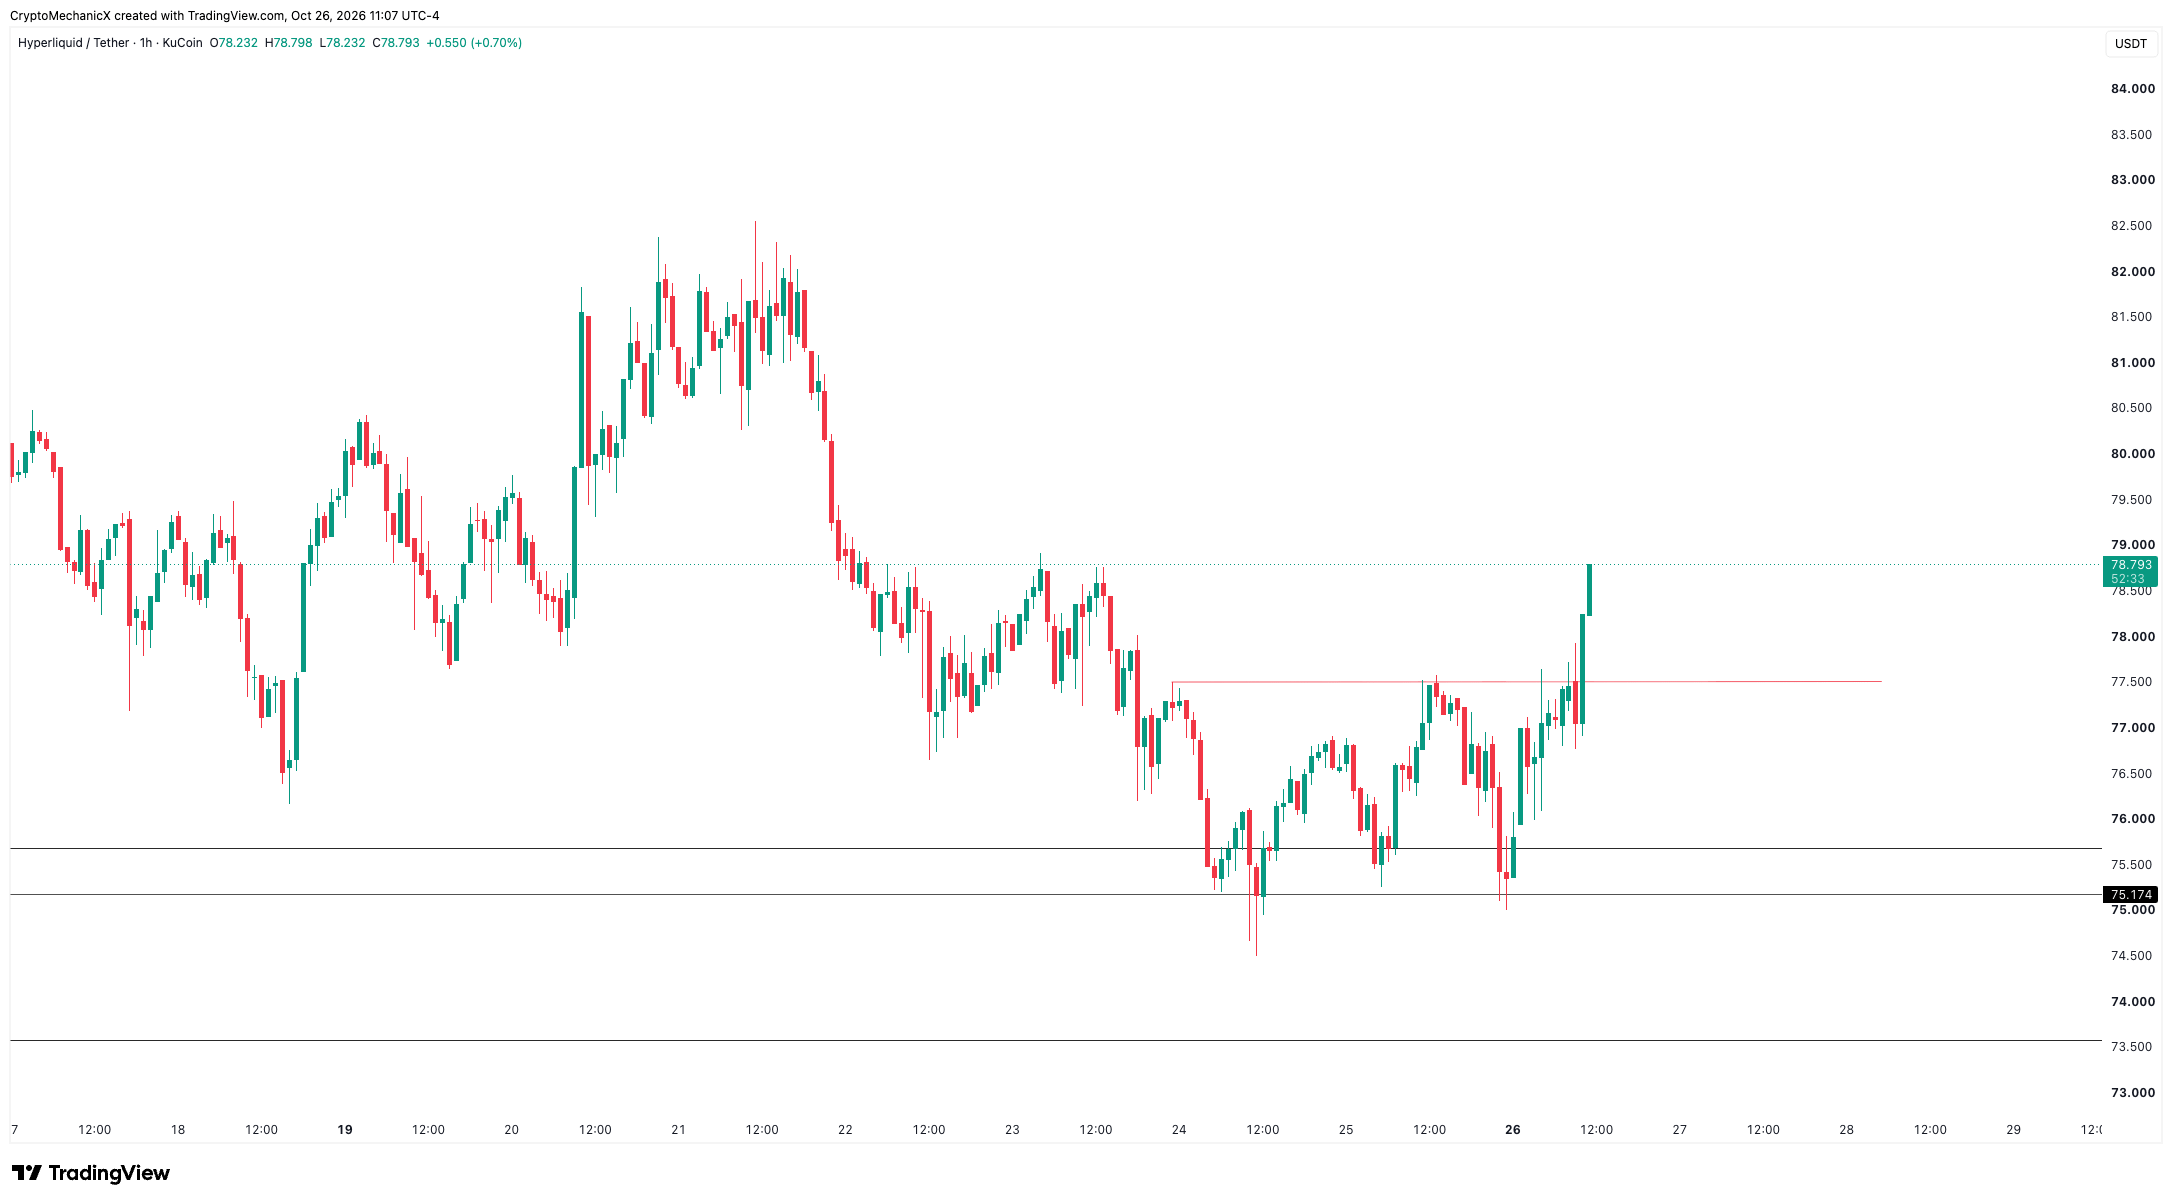
$HYPE
Nice reaction after that Daily SFP. 🤝
$HYPE
Nice reaction after that Daily SFP. 🤝
Nice reaction after that Daily SFP. 🤝
CRYPTO MECHANIC
·
--
$HYPE Sitting at support with potential Daily SFP.
If it’s going to bounce, this could be the spot.
If it’s going to bounce, this could be the spot.
2
15
3.1k
$BTC
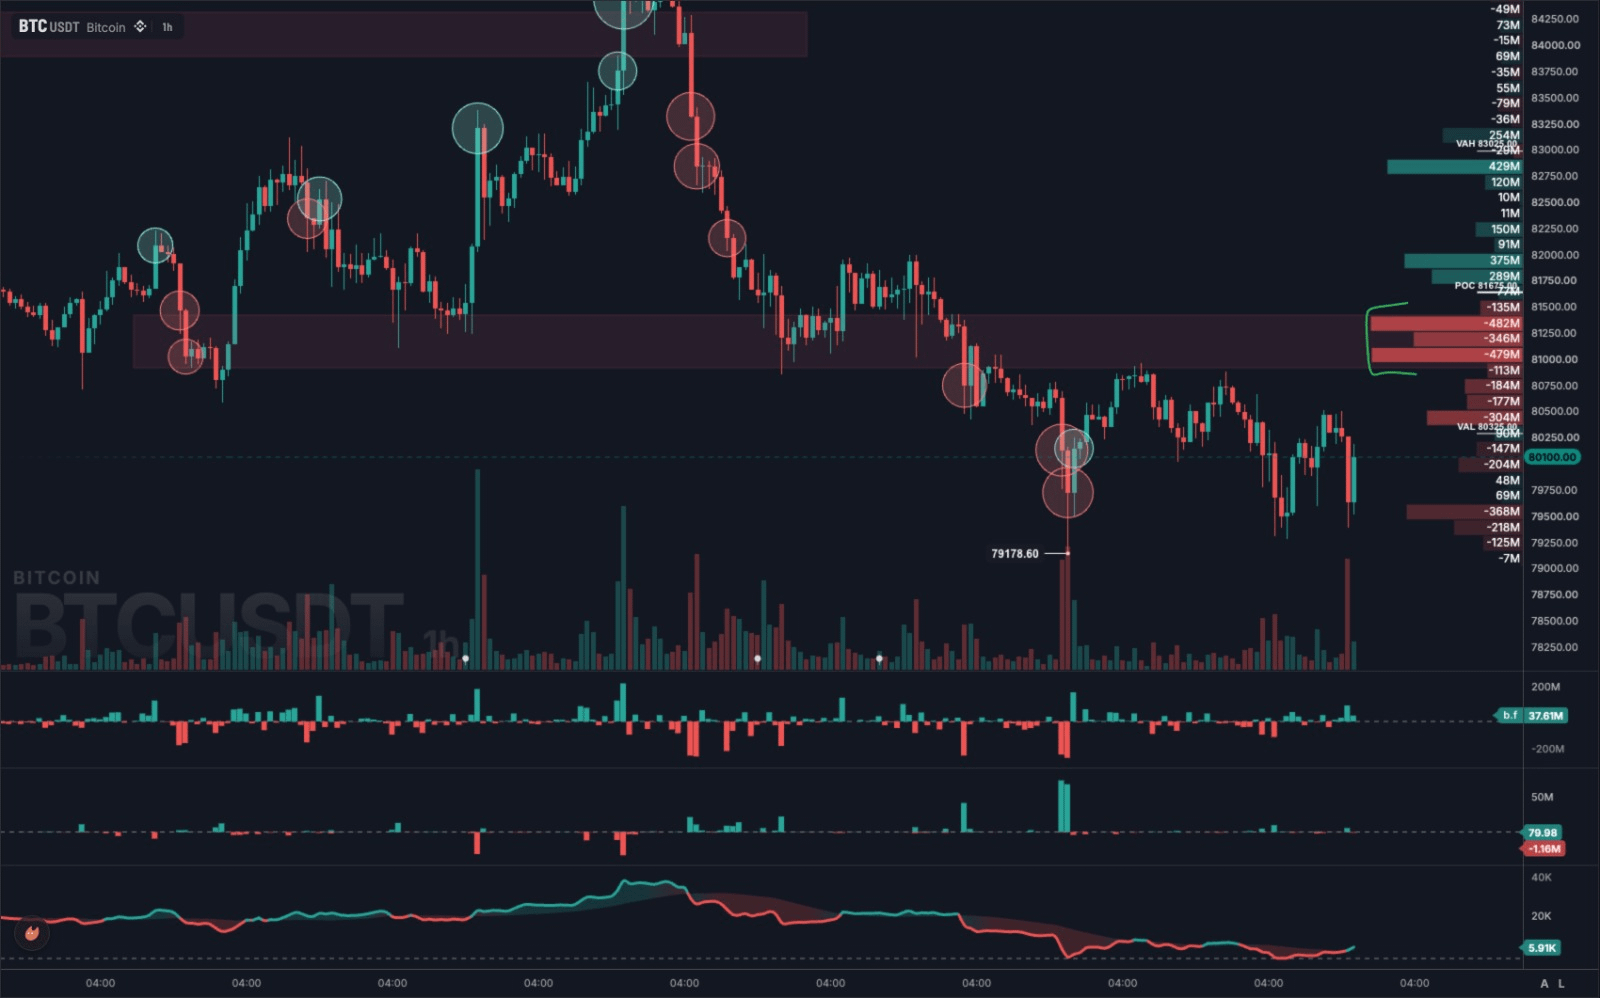
Bears are trying to push BTC below $80,000, but bulls are somehow managing to defend it. However, that's not enough.
There are heavy sellers sitting around $81,500–$82,000, and BTC has faced significant selling pressure in this area.
If bulls can somehow reclaim this zone, we'll have some confidence that bears might be trapped below $80K and Bitcoin could push higher.
But until that happens, BTC is still looking weak on the lower time frames.
16
46
6.7k
Bear are so weak, can't even hold $BTC under $80k
Bear are so weak, can't even hold $BTC under $80k
10
30
3.2k
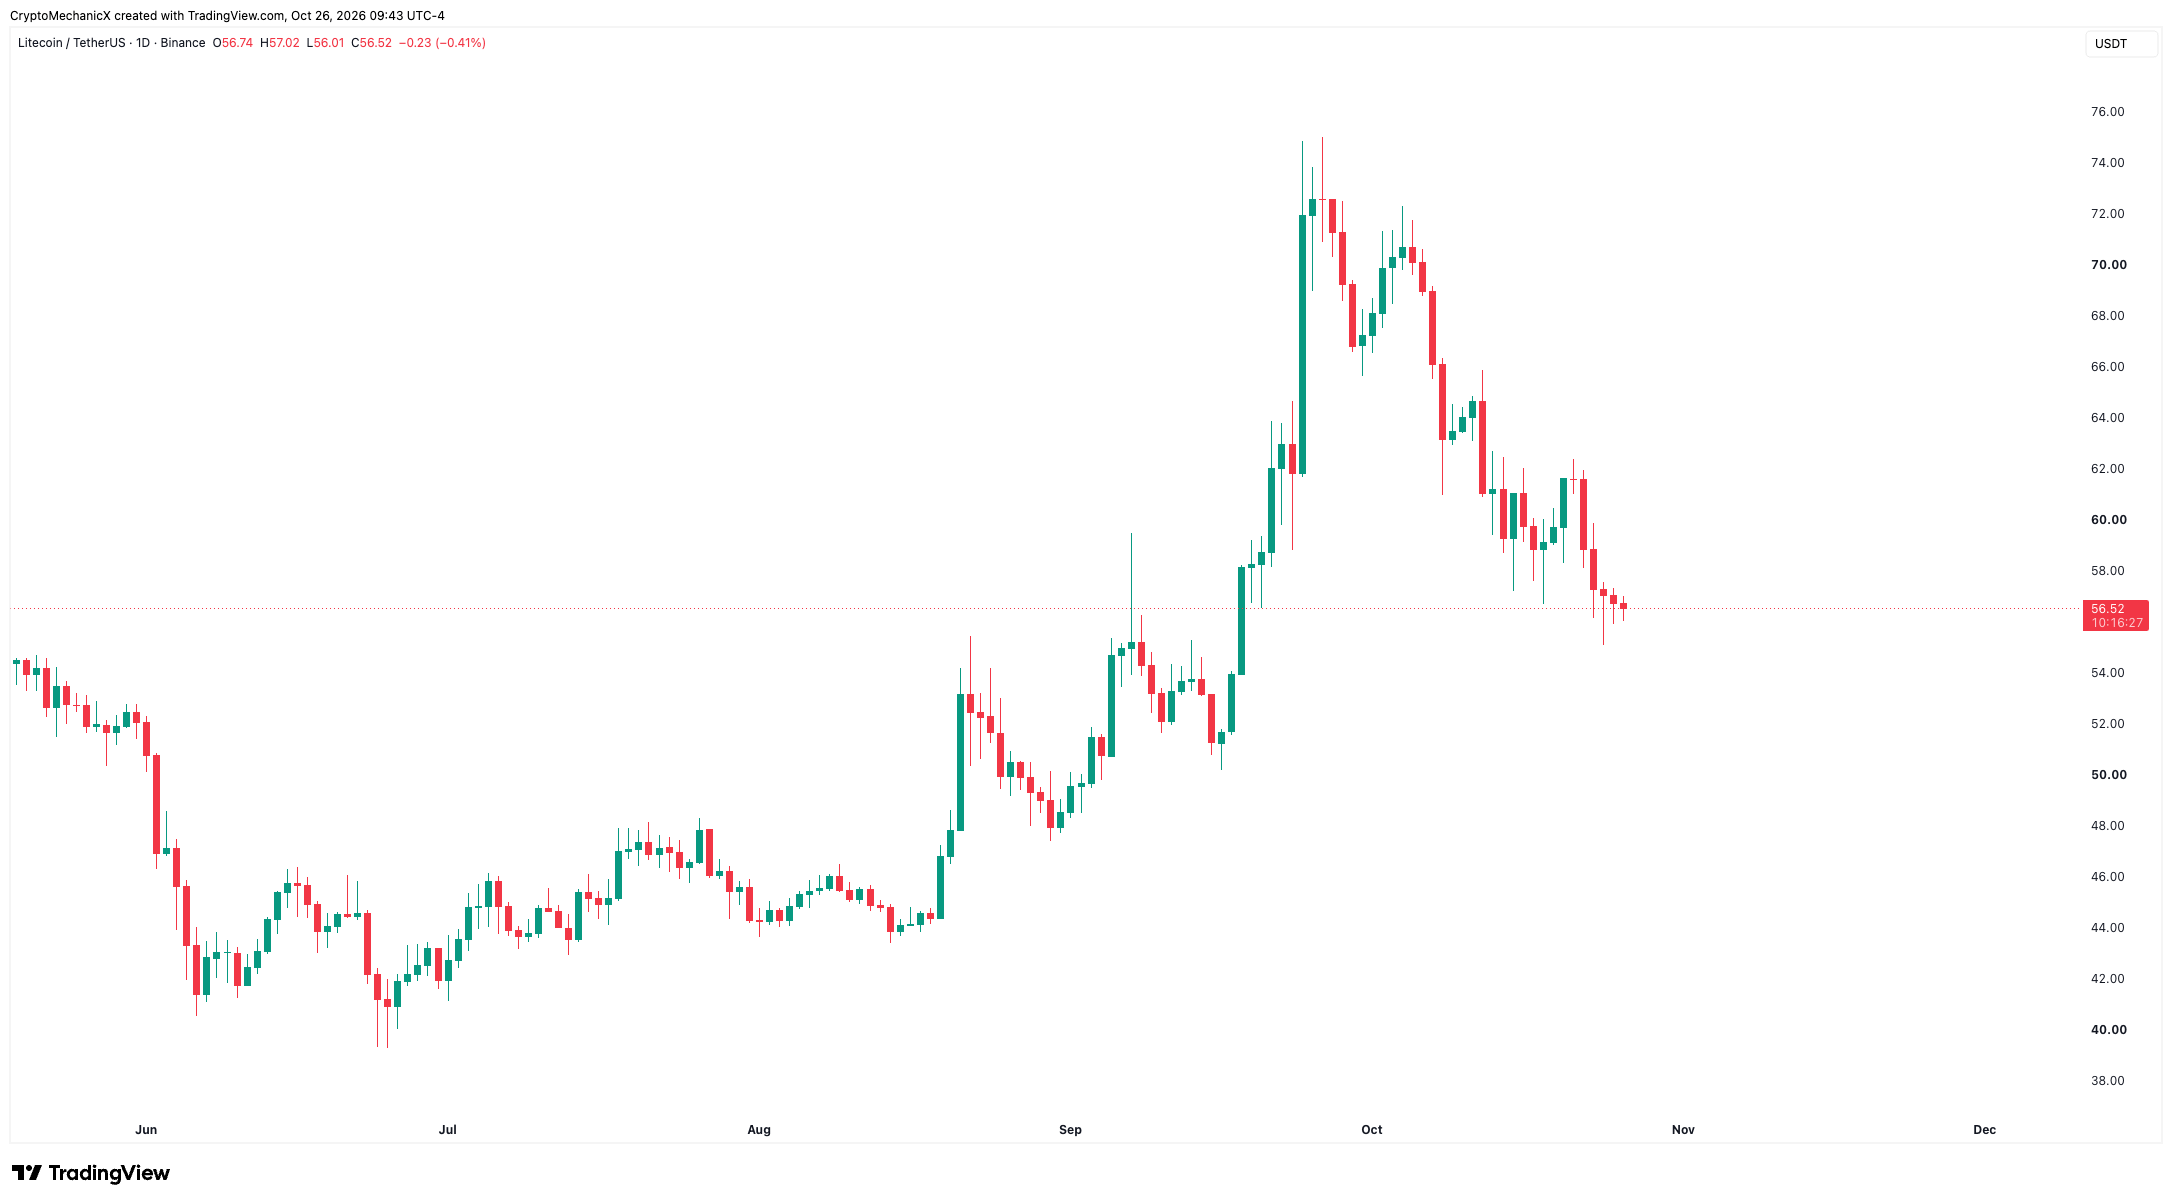
LTC is usually one of the last things to pump before the whole market tops.
You all pumped it, and everything topped after that day 😂
LTC is usually one of the last things to pump before the whole market tops.
You all pumped it, and everything topped after that day 😂
You all pumped it, and everything topped after that day 😂
CRYPTO MECHANIC
·
--
Can you all stop pumping $LTC
3
11
2.6k
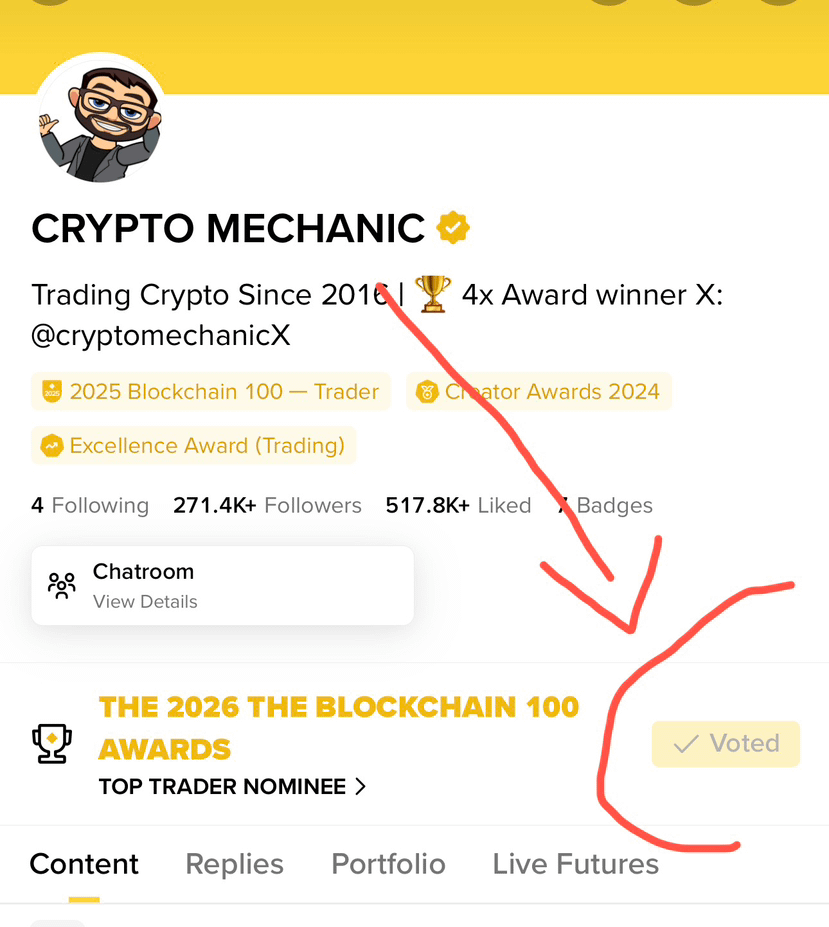
The voting competition is entering into the final days, this is where we need to give it a final push.
Tap here 👉🏻 [Vote For Cm](https://app.binance.com/uni-qr/cact26user/744?uc=app_square_share_link&us=copylink)
Thank you for your every day support ❤️
The voting competition is entering into the final days, this is where we need to give it a final push.
Tap here 👉🏻 Vote For Cm
Thank you for your every day support ❤️
Tap here 👉🏻 Vote For Cm
Thank you for your every day support ❤️
18
36
2.5k
A lot of you requested high timeframe views on different altcoins, and I shared some charts on my profile as well. I tried to cover as many as possible, especially the ones that were requested the most.
But let me explain the bigger picture.
Most altcoins are currently sitting at their high timeframe support levels. By high timeframe, I mean the weekly chart. These levels could be weekly demand zones or the previous weekly lows from where the market made a move up. Technically, these are important zones.
Some altcoins have already broken their lower timeframe levels, and you want to see them quickly reclaim those zones.
Now, here's the thing. I think this week is going to be important, and next week will be important as well.
We have FOMC this week, along with earnings from some major stocks. It's important to watch those earnings because, obviously, they can affect the crypto market as well.
Then next week, we have the US midterm elections.
Ideally, what you want to see is the market showing strength this week or, at the very least, next week. Even if we get a pullback, price should be able to quickly reclaim those levels.
I'm talking specifically about the coins that are currently sitting at important high timeframe zones. And for the coins that have already broken their levels, you want to see them reclaim and hold those zones again.
At this point, we could either see some good bounces or another round of pullbacks. It's a 50-50 scenario, and you don't want to bet heavily when things are this uncertain.
When October started, I also made multiple posts saying that I wasn't expecting the market to do anything crazy because it had already been moving up for two or three months.
So, good luck. Watch what price does, and don't over-risk.
12
42
5k
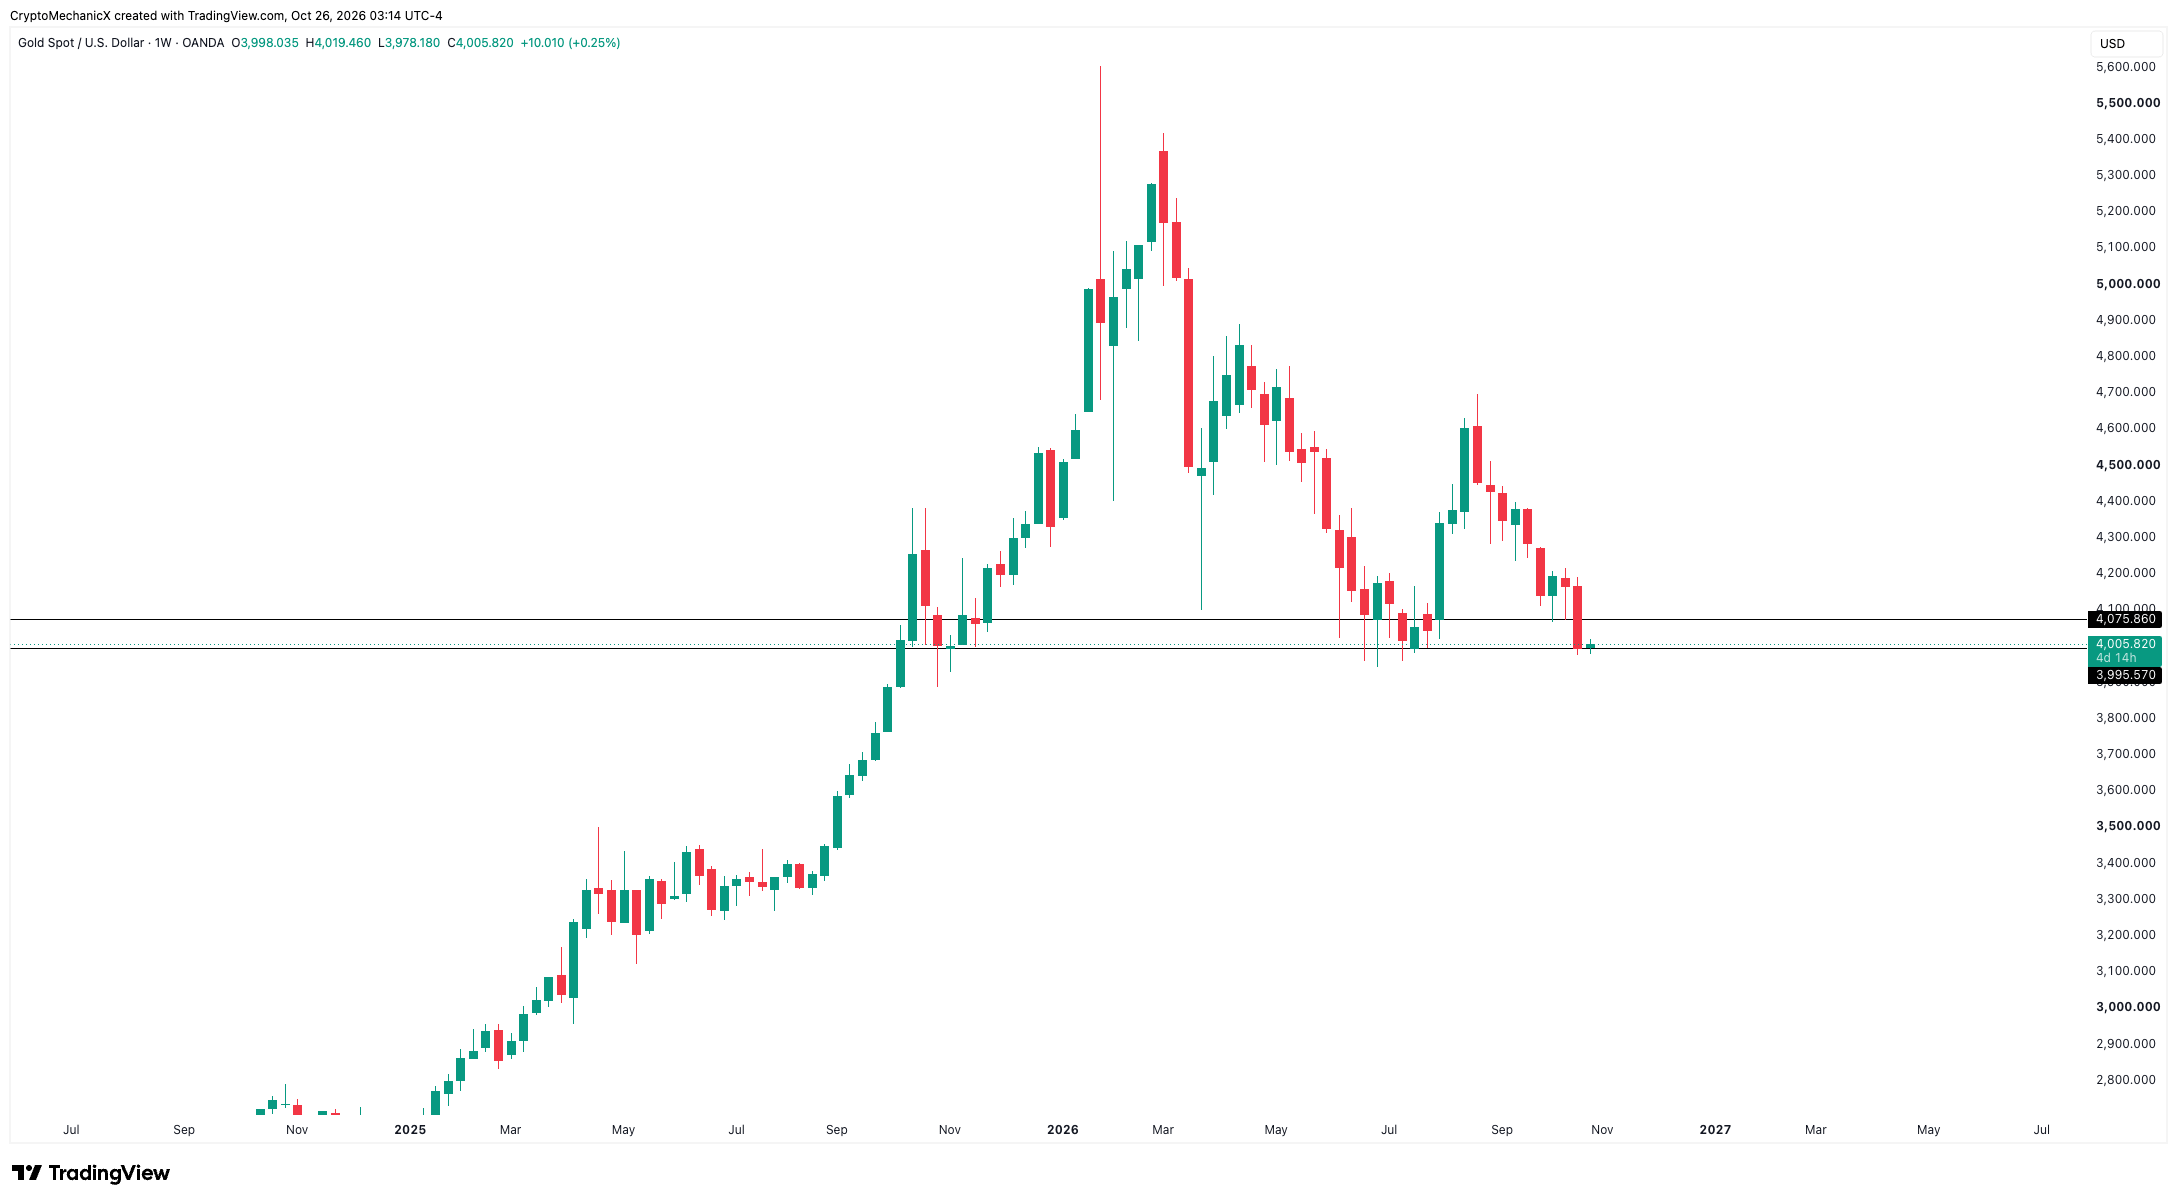
GOLD
Sitting at a key high timeframe zone and the psychological $4000 level.
I think this week will be the decider for what price wants to do next.
GOLD
Sitting at a key high timeframe zone and the psychological $4000 level.
I think this week will be the decider for what price wants to do next.
Sitting at a key high timeframe zone and the psychological $4000 level.
I think this week will be the decider for what price wants to do next.
2
20
3.3k
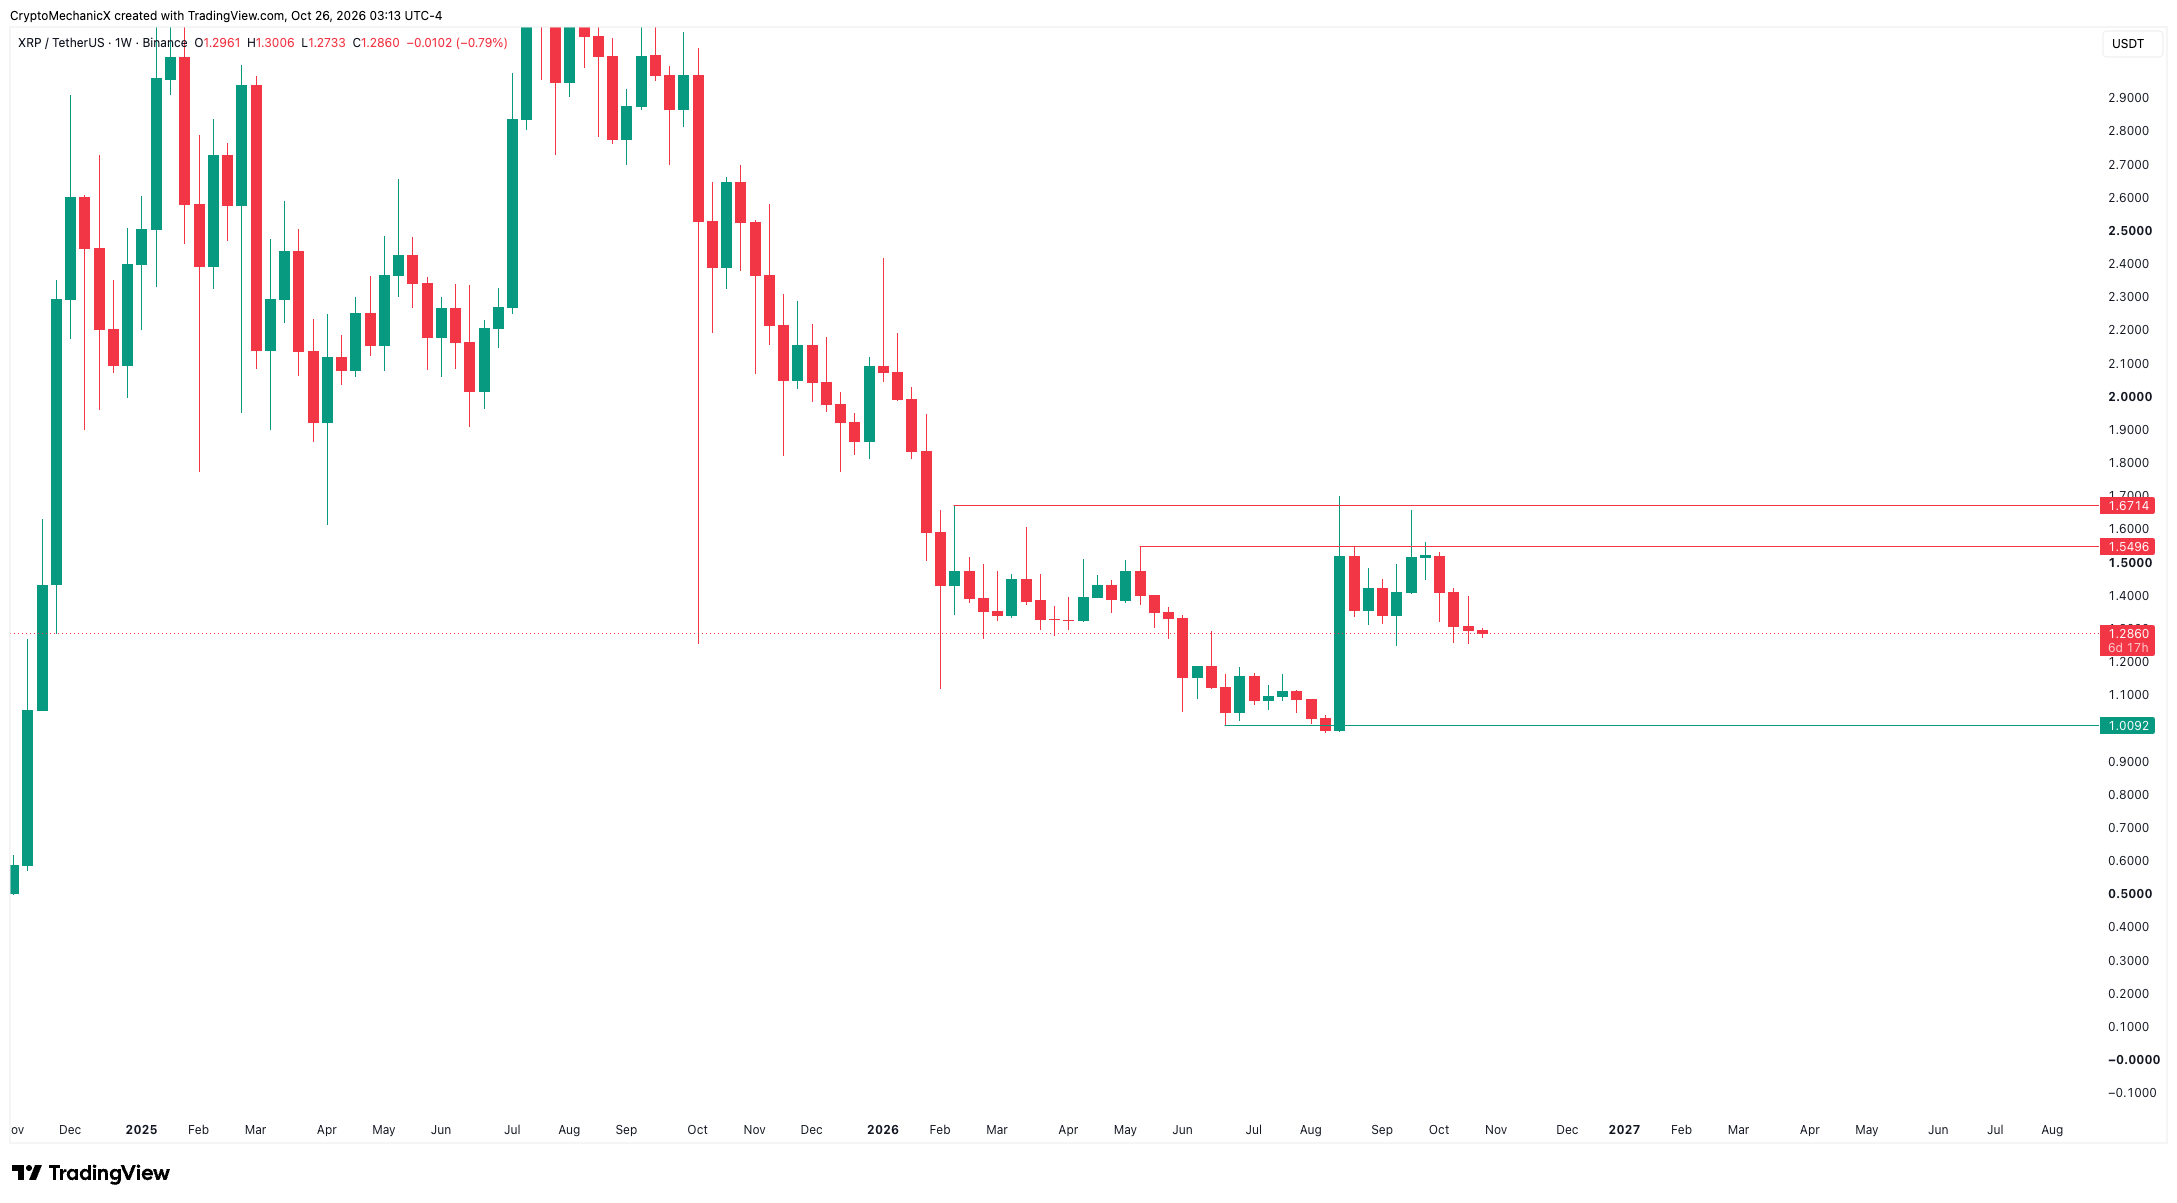
$XRP
My last update on $XRP was back in August, and price hasn't really done anything since then except slowly bleed.
I still don't see anything interesting on this chart.
$XRP
My last update on $XRP was back in August, and price hasn't really done anything since then except slowly bleed.
I still don't see anything interesting on this chart.
My last update on $XRP was back in August, and price hasn't really done anything since then except slowly bleed.
I still don't see anything interesting on this chart.
CRYPTO MECHANIC
·
--
$XRP Took all the highs on that move up.
Could just be a big short squeeze unless price starts breaking into those highs again.
Could just be a big short squeeze unless price starts breaking into those highs again.
3
14
2.1k
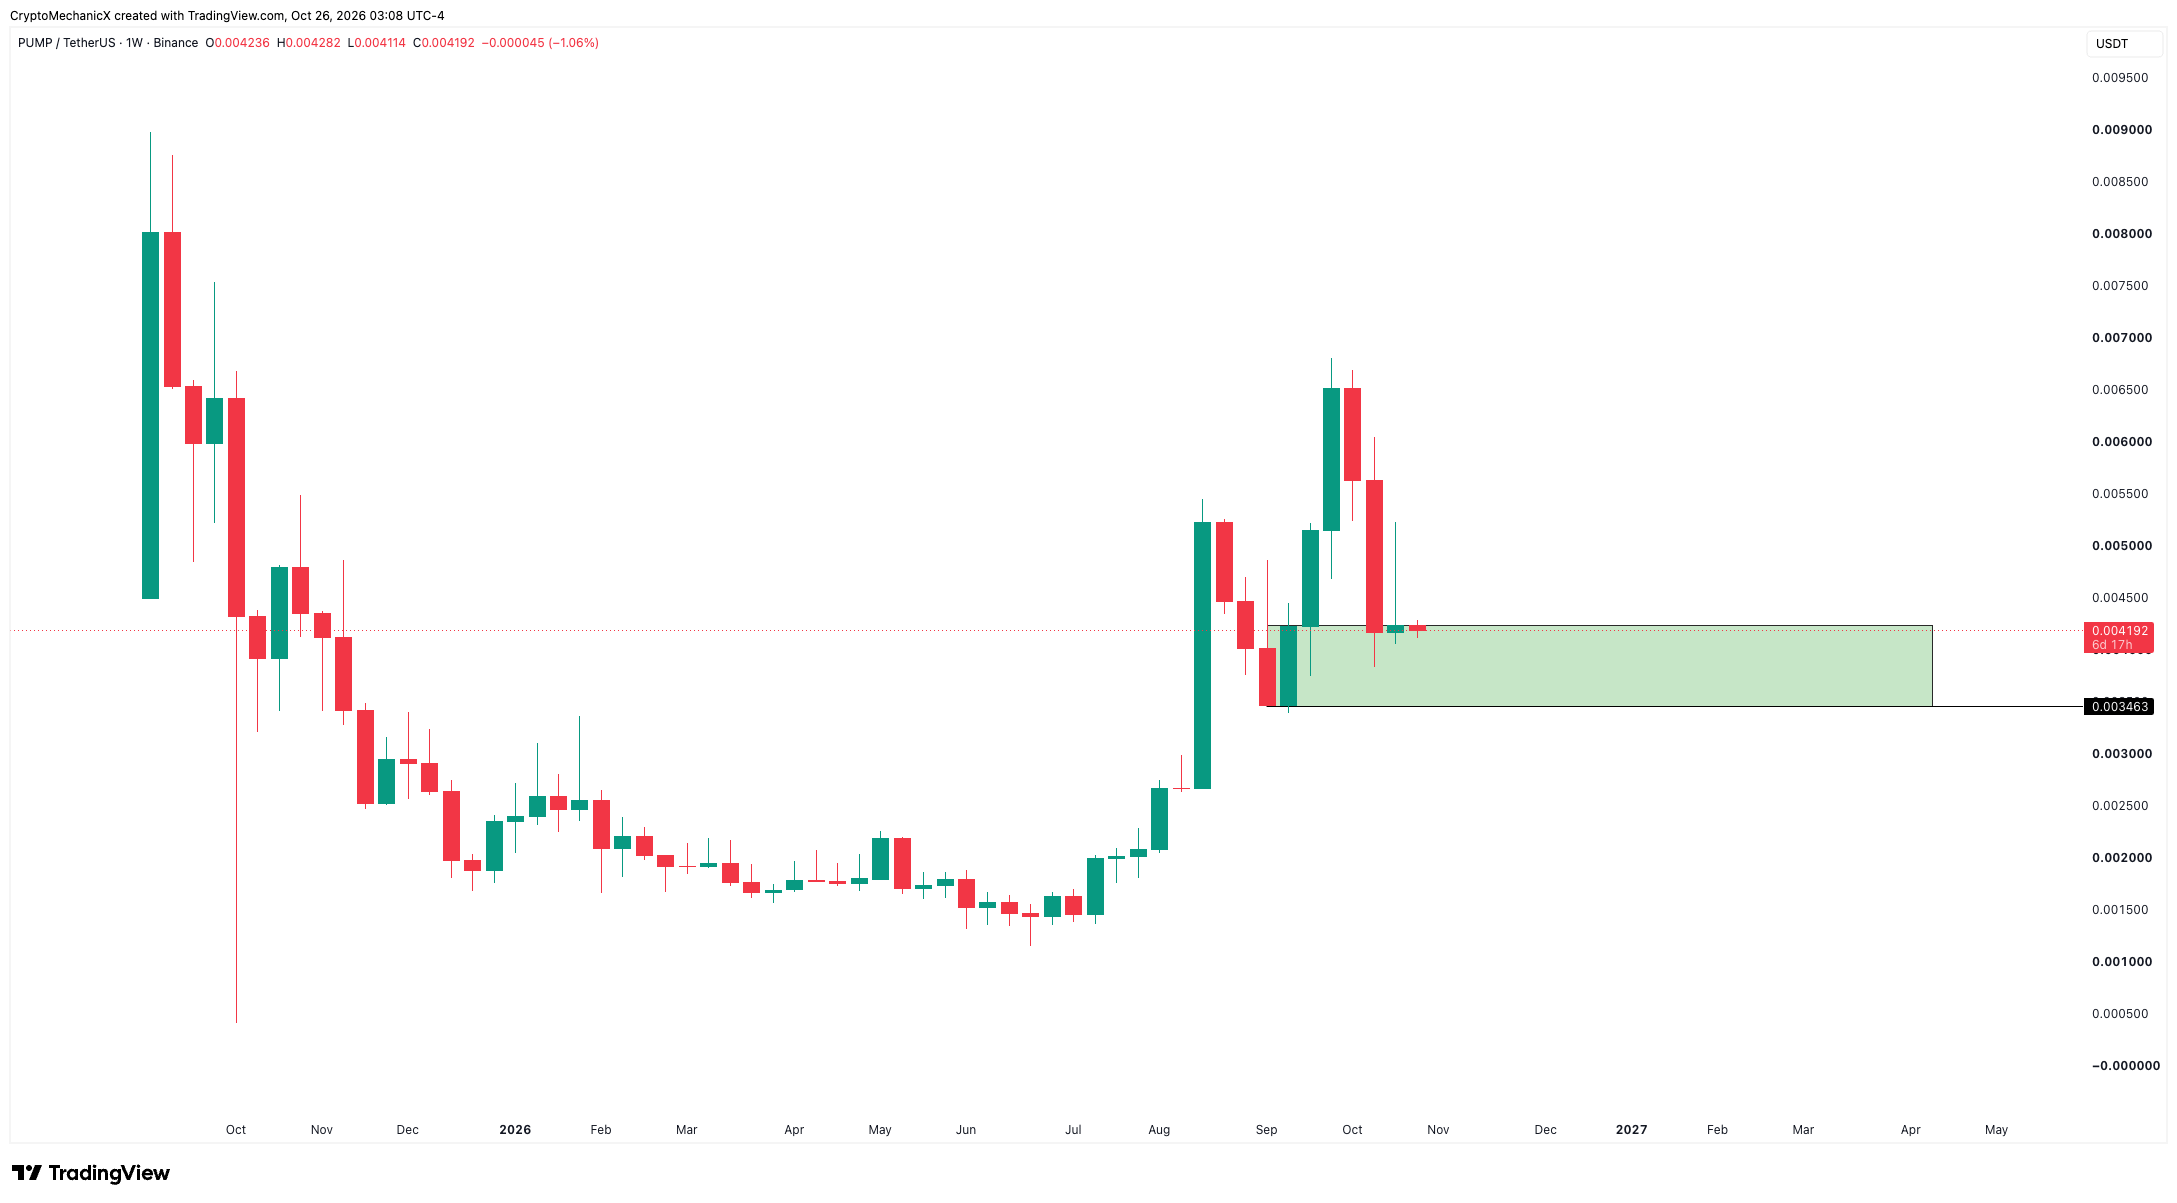
$PUMP High Timeframe View
Price is trading around the weekly demand zone, which is also an important zone structurally.
$PUMP High Timeframe View
Price is trading around the weekly demand zone, which is also an important zone structurally.
Price is trading around the weekly demand zone, which is also an important zone structurally.
1
15
2.2k
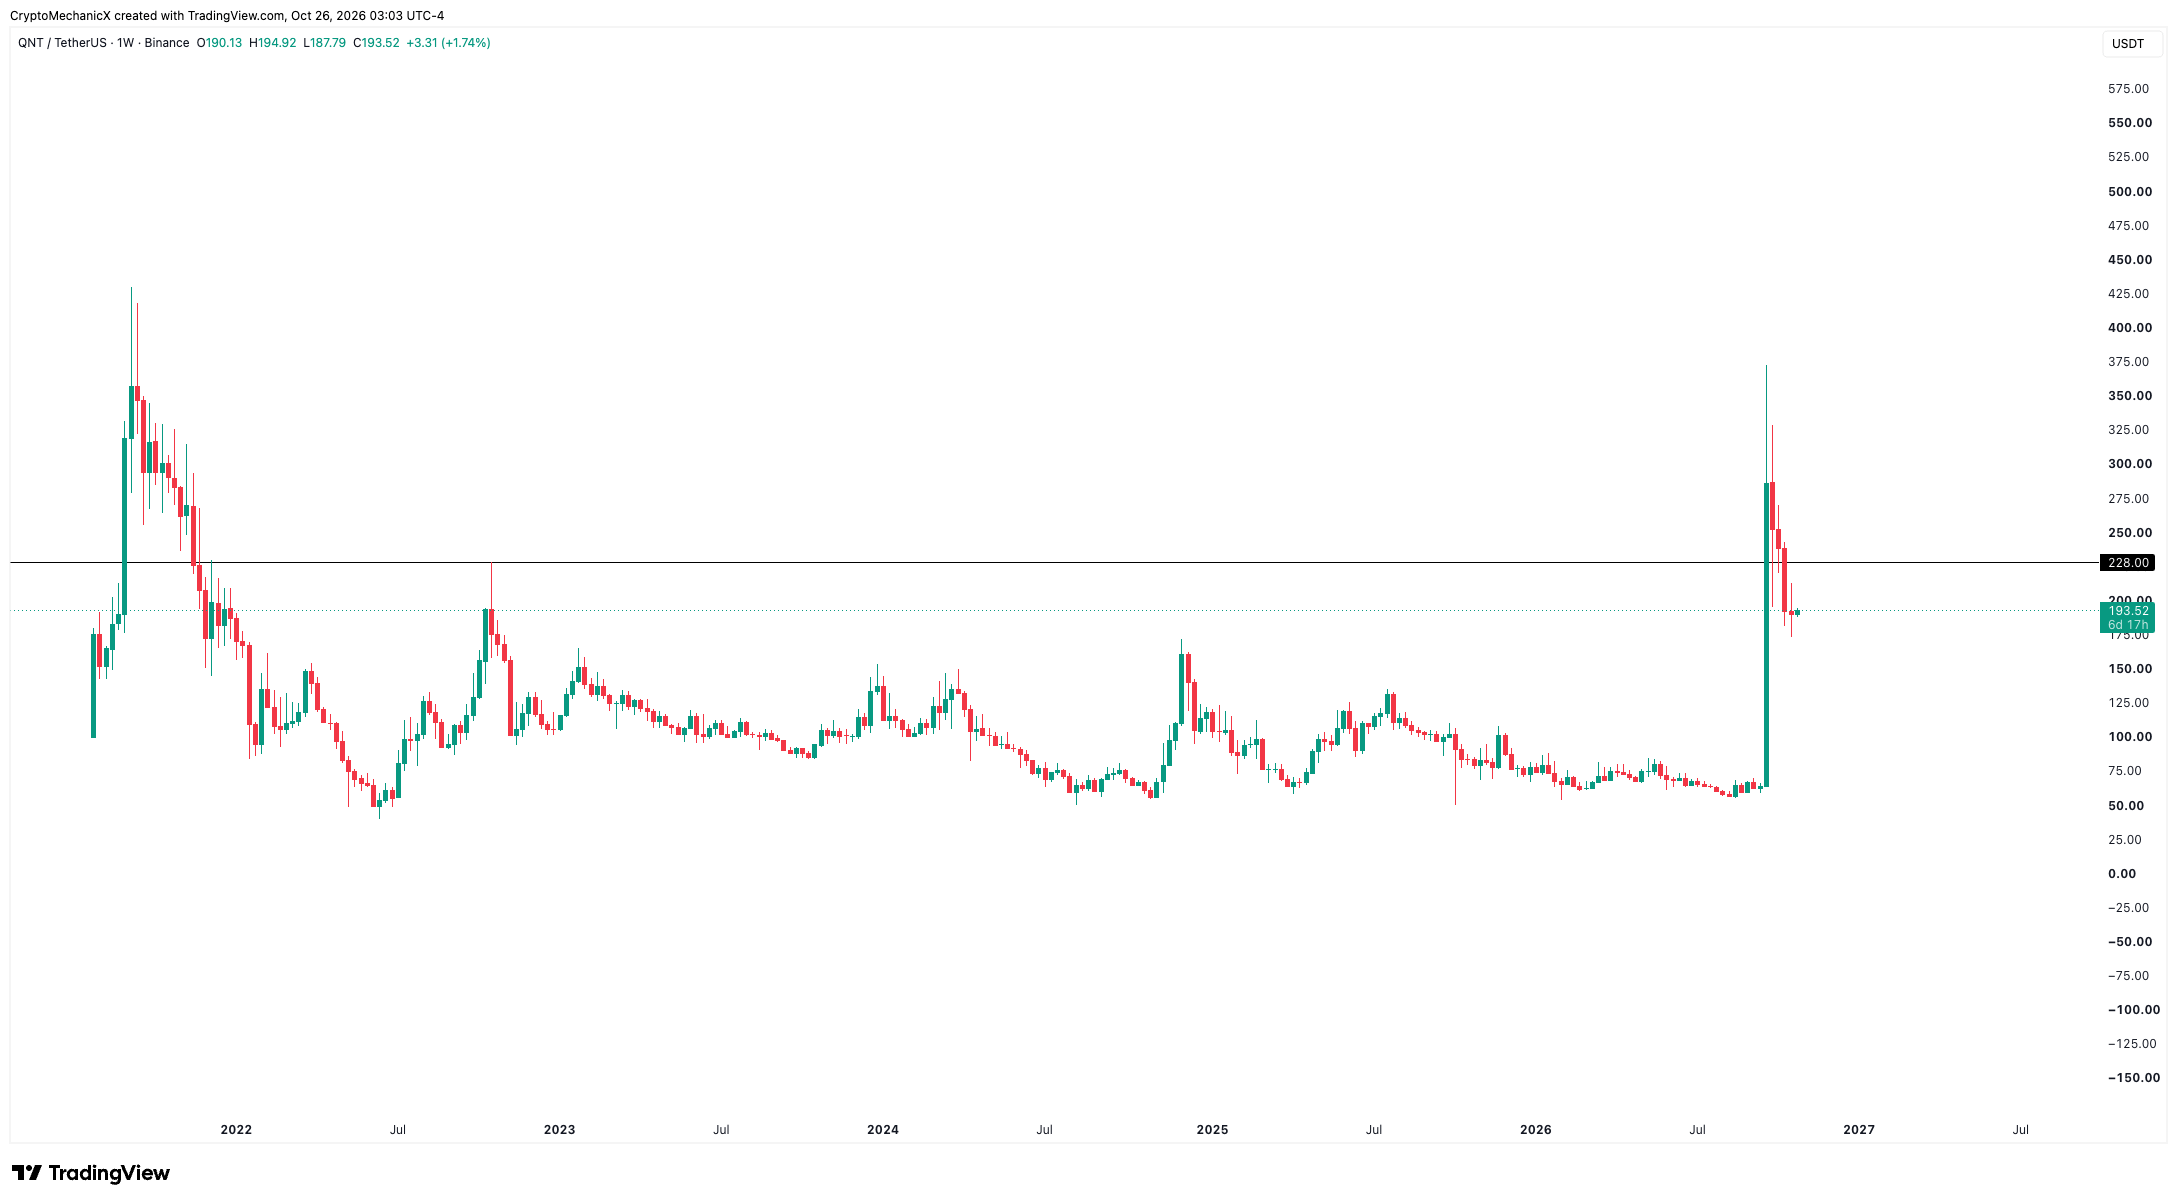
A lot of you ask me about $QNT .
Unless it does something again, I have nothing to say about it. We’ve all seen coins print one good candle and then slowly fade all the way back to zero.
Give it time.
A lot of you ask me about $QNT .
Unless it does something again, I have nothing to say about it. We’ve all seen coins print one good candle and then slowly fade all the way back to zero.
Give it time.
Unless it does something again, I have nothing to say about it. We’ve all seen coins print one good candle and then slowly fade all the way back to zero.
Give it time.
1
24
10.5k
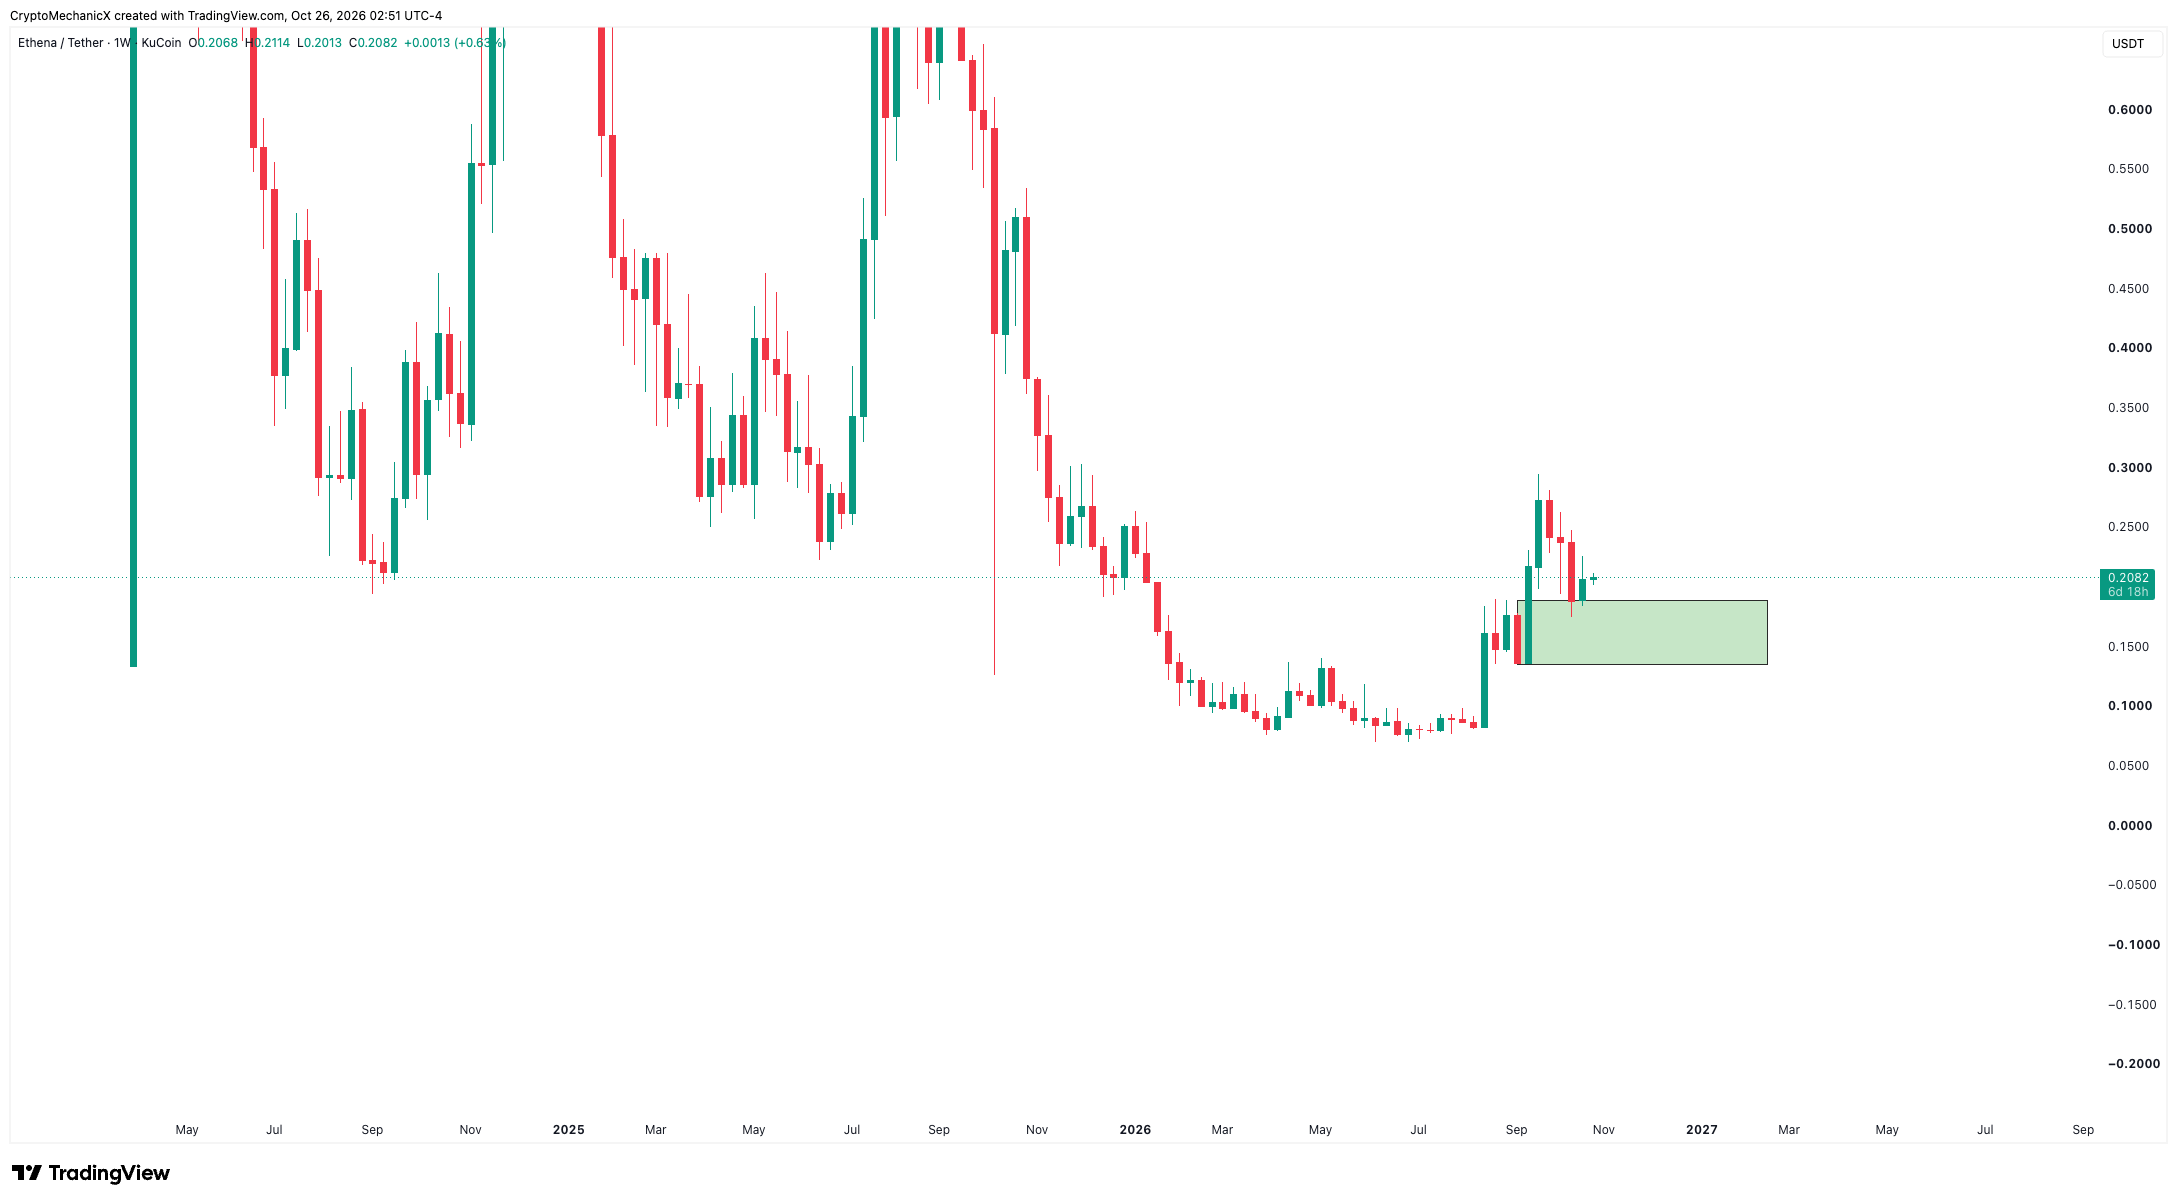
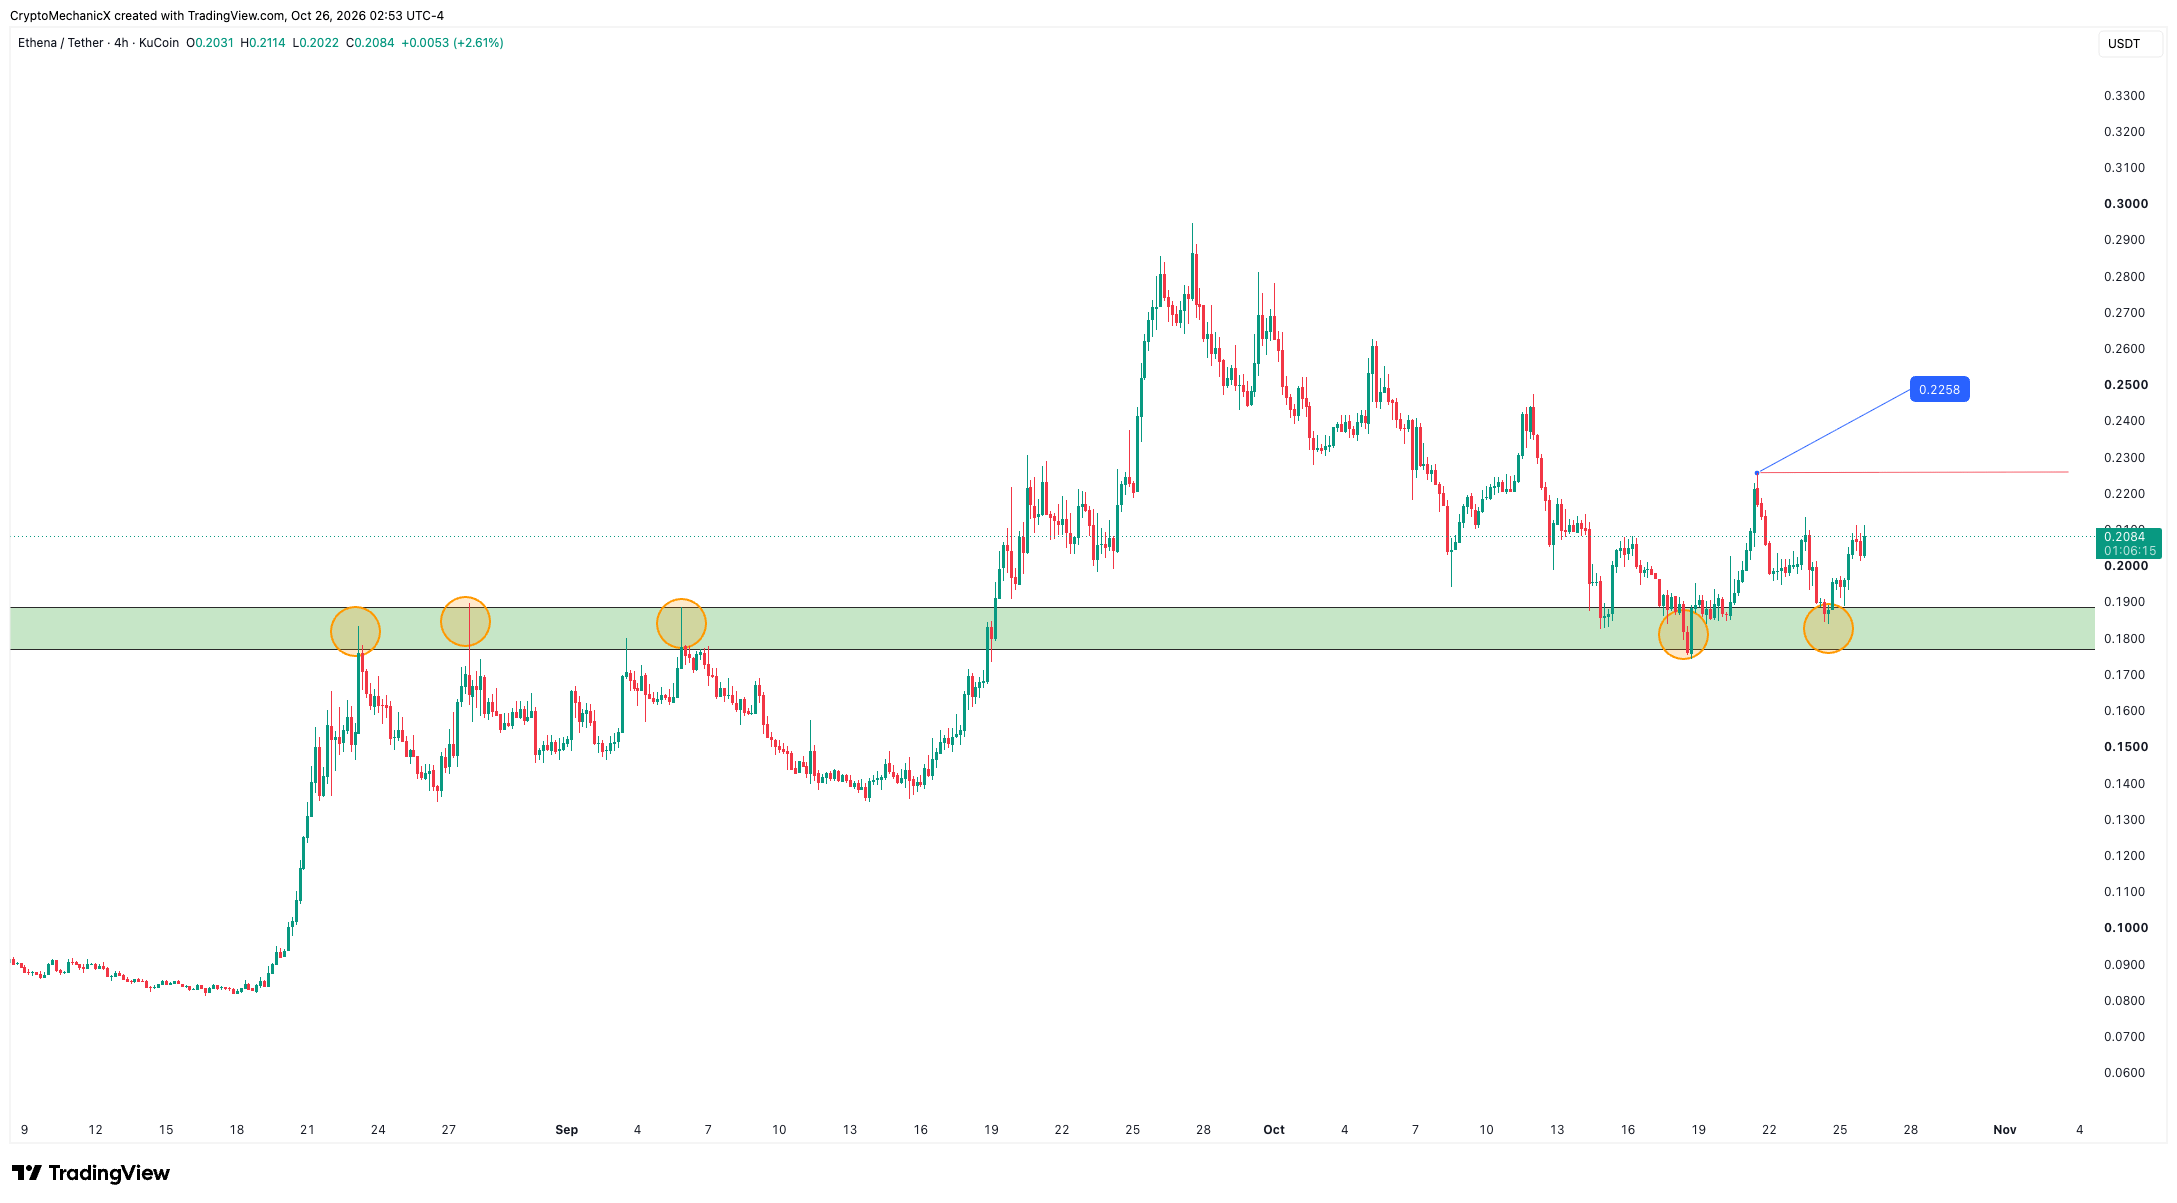
$ENA High Timeframe View
Price tapped the weekly demand zone and bounced. As long as it holds above this zone, the HTF chart looks fine imo.
Price is also holding the lower timeframe zone it needs to hold, so overall, this is not a bad-looking chart compared to other altcoins.
$0.2260 is the key LTF resistance to break. Above that, it should just fly.
2
30
4.6k
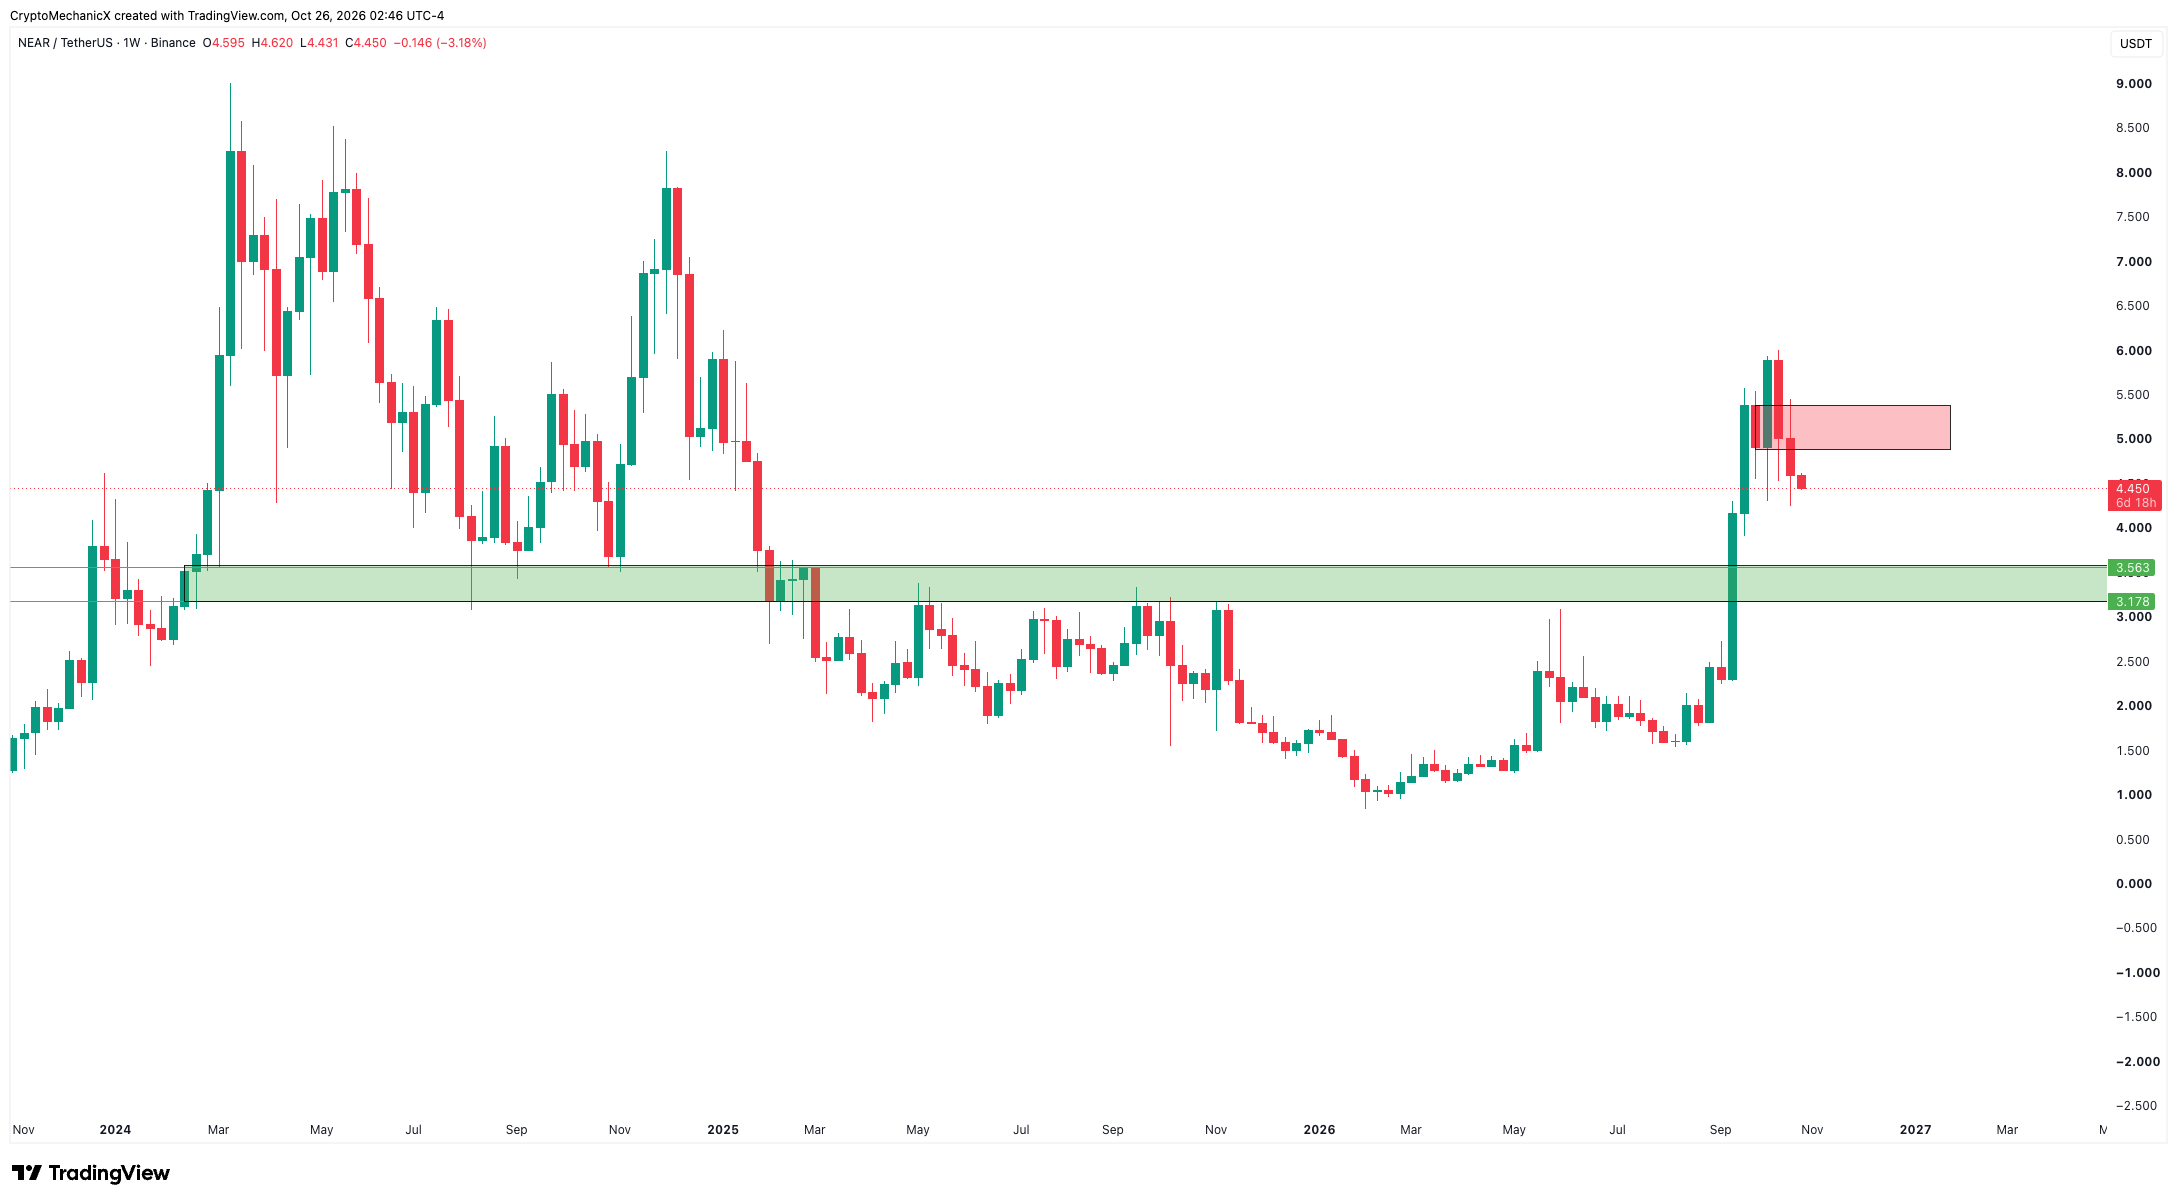
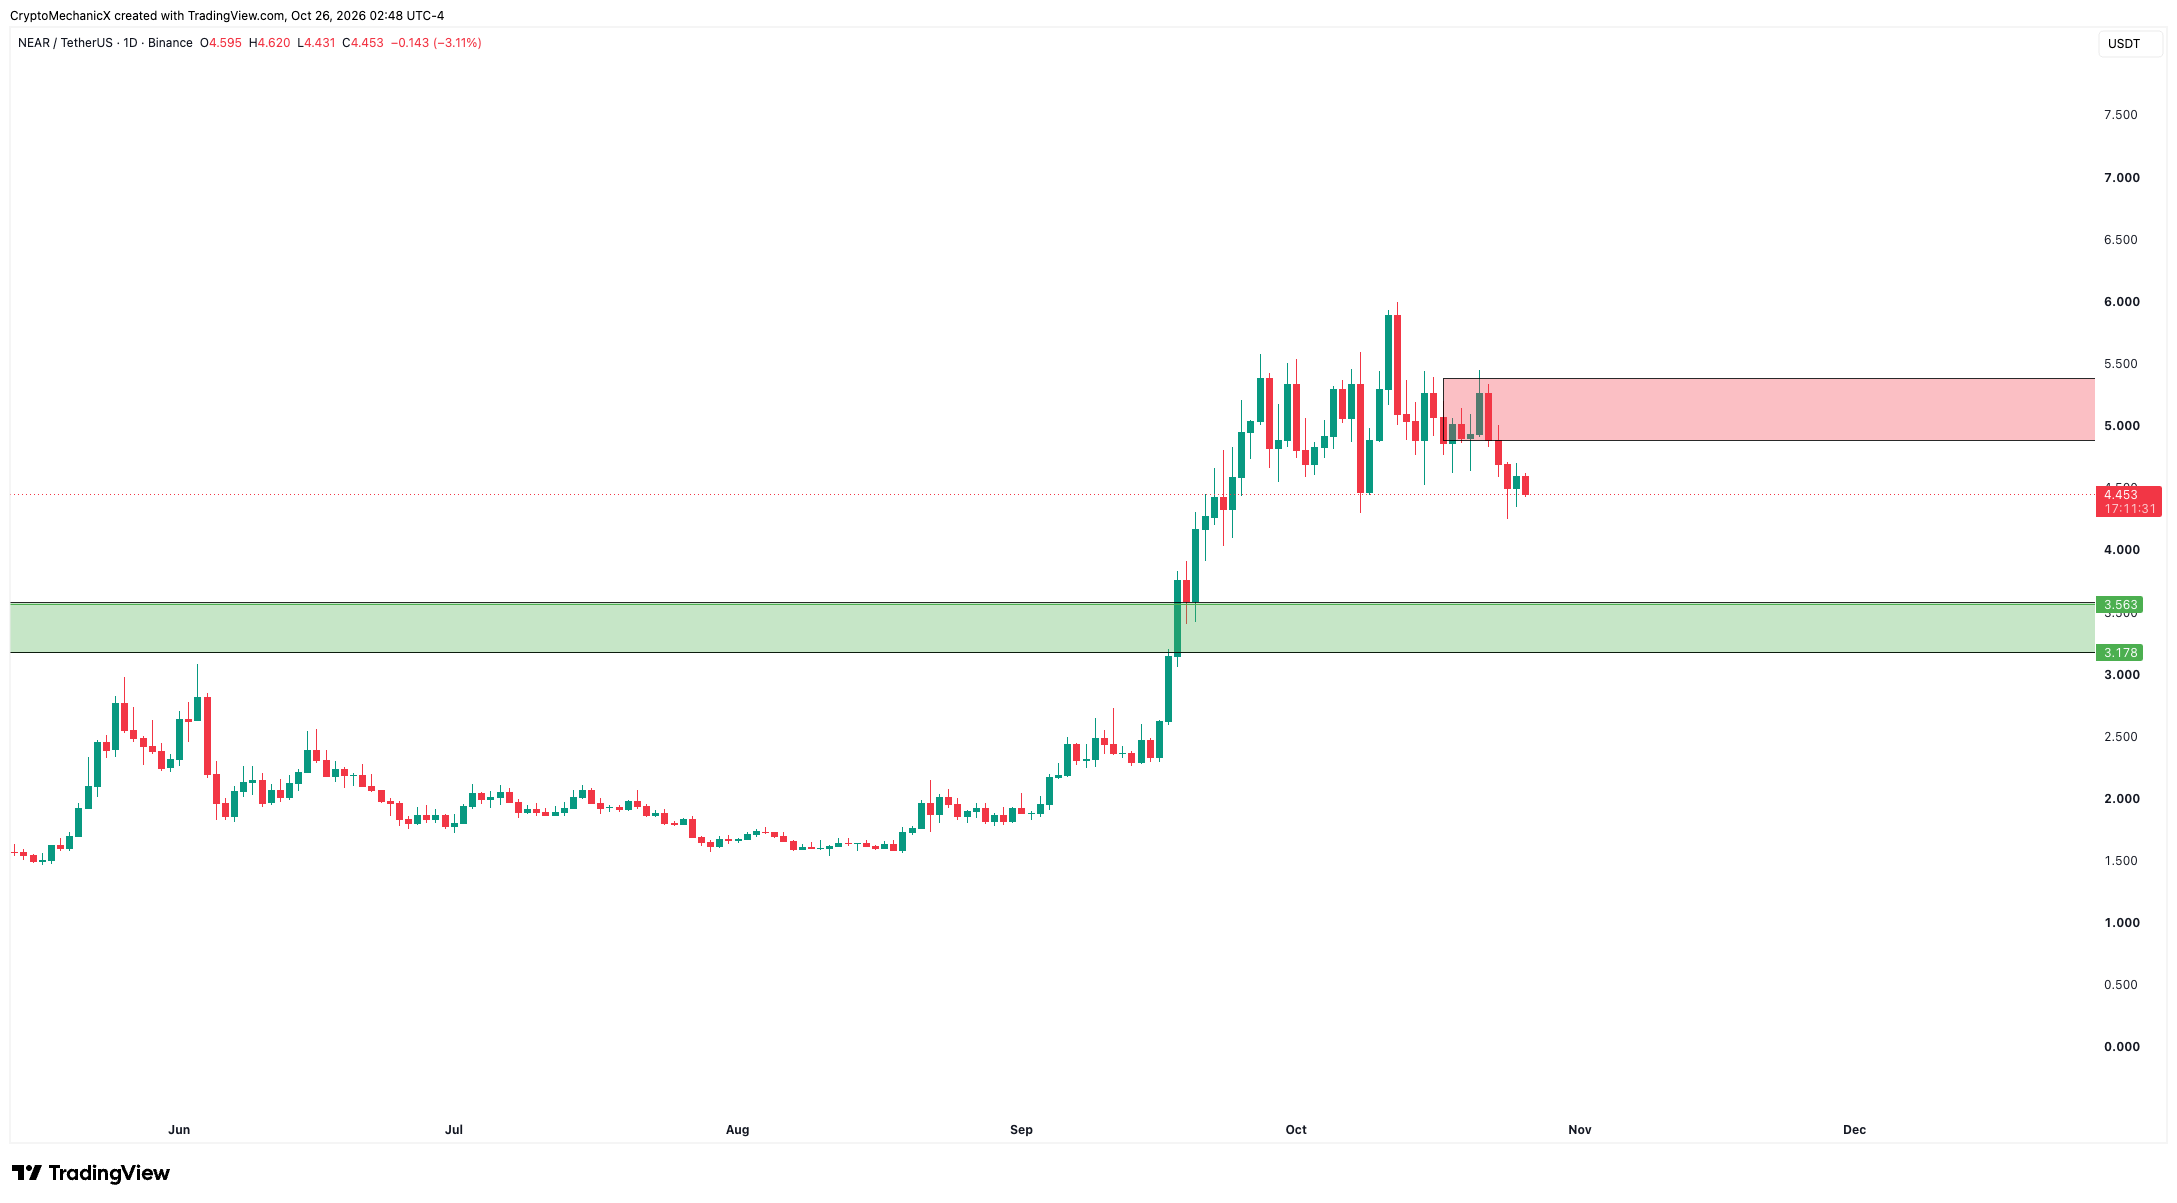
$NEAR High Timeframe View
Chart looks fine. Price has been going up for weeks and is now pulling back, and I missed this whole run. Lol
$3.2–$3.6 could be a good zone to get some if price gives.
Key resistance: $5–$5.40
$NEAR High Timeframe View
Chart looks fine. Price has been going up for weeks and is now pulling back, and I missed this whole run. Lol
$3.2–$3.6 could be a good zone to get some if price gives.
Key resistance: $5–$5.40
Chart looks fine. Price has been going up for weeks and is now pulling back, and I missed this whole run. Lol
$3.2–$3.6 could be a good zone to get some if price gives.
Key resistance: $5–$5.40
3
20
3.2k
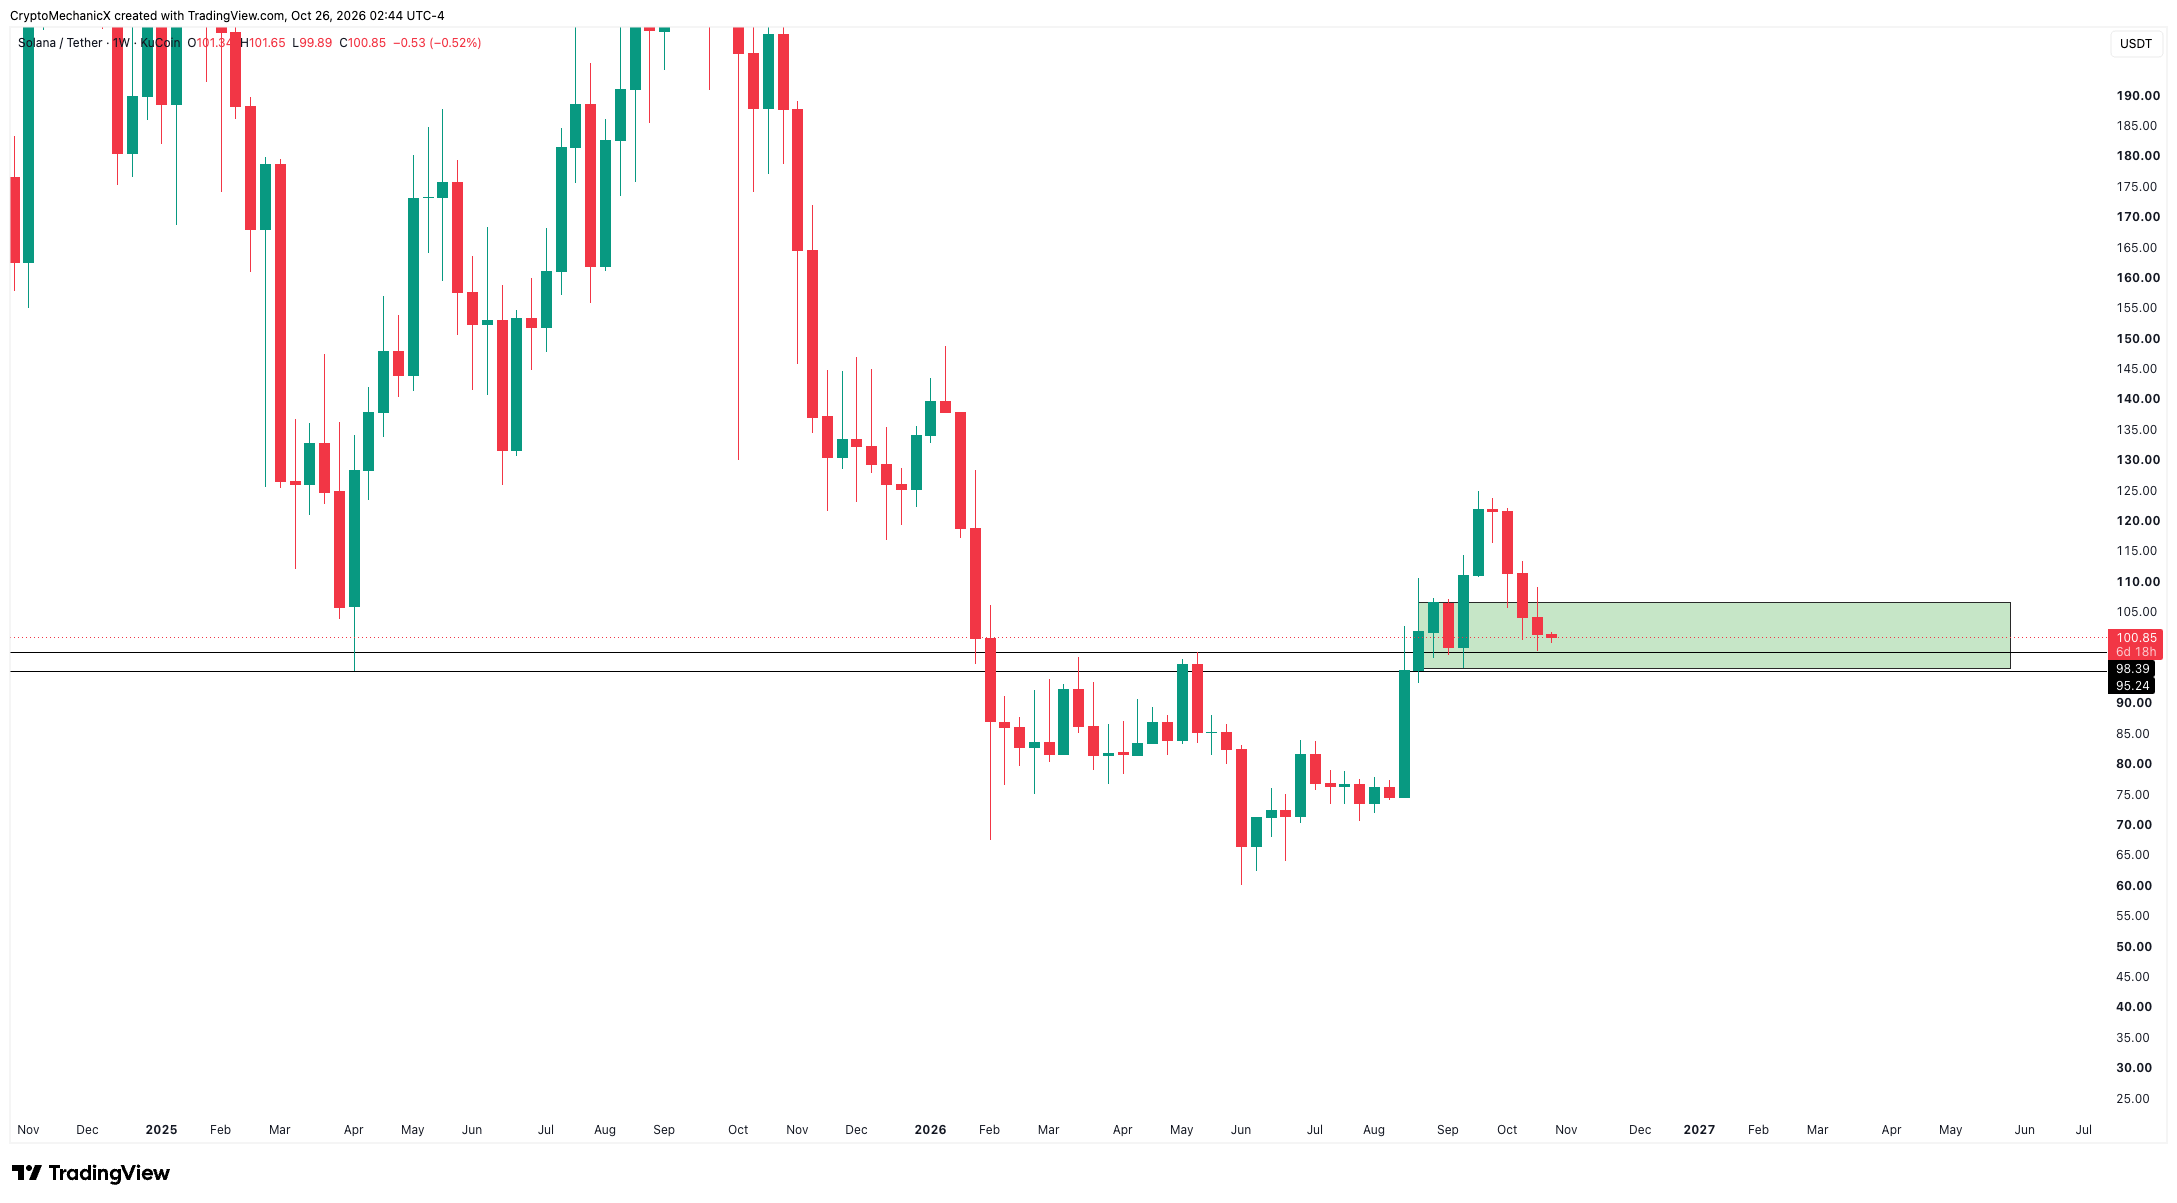
$SOL High Timeframe View
Price is currently trading around an important zone. Bulls should not lose this level imo.
$SOL High Timeframe View
Price is currently trading around an important zone. Bulls should not lose this level imo.
Price is currently trading around an important zone. Bulls should not lose this level imo.
1
19
2.4k
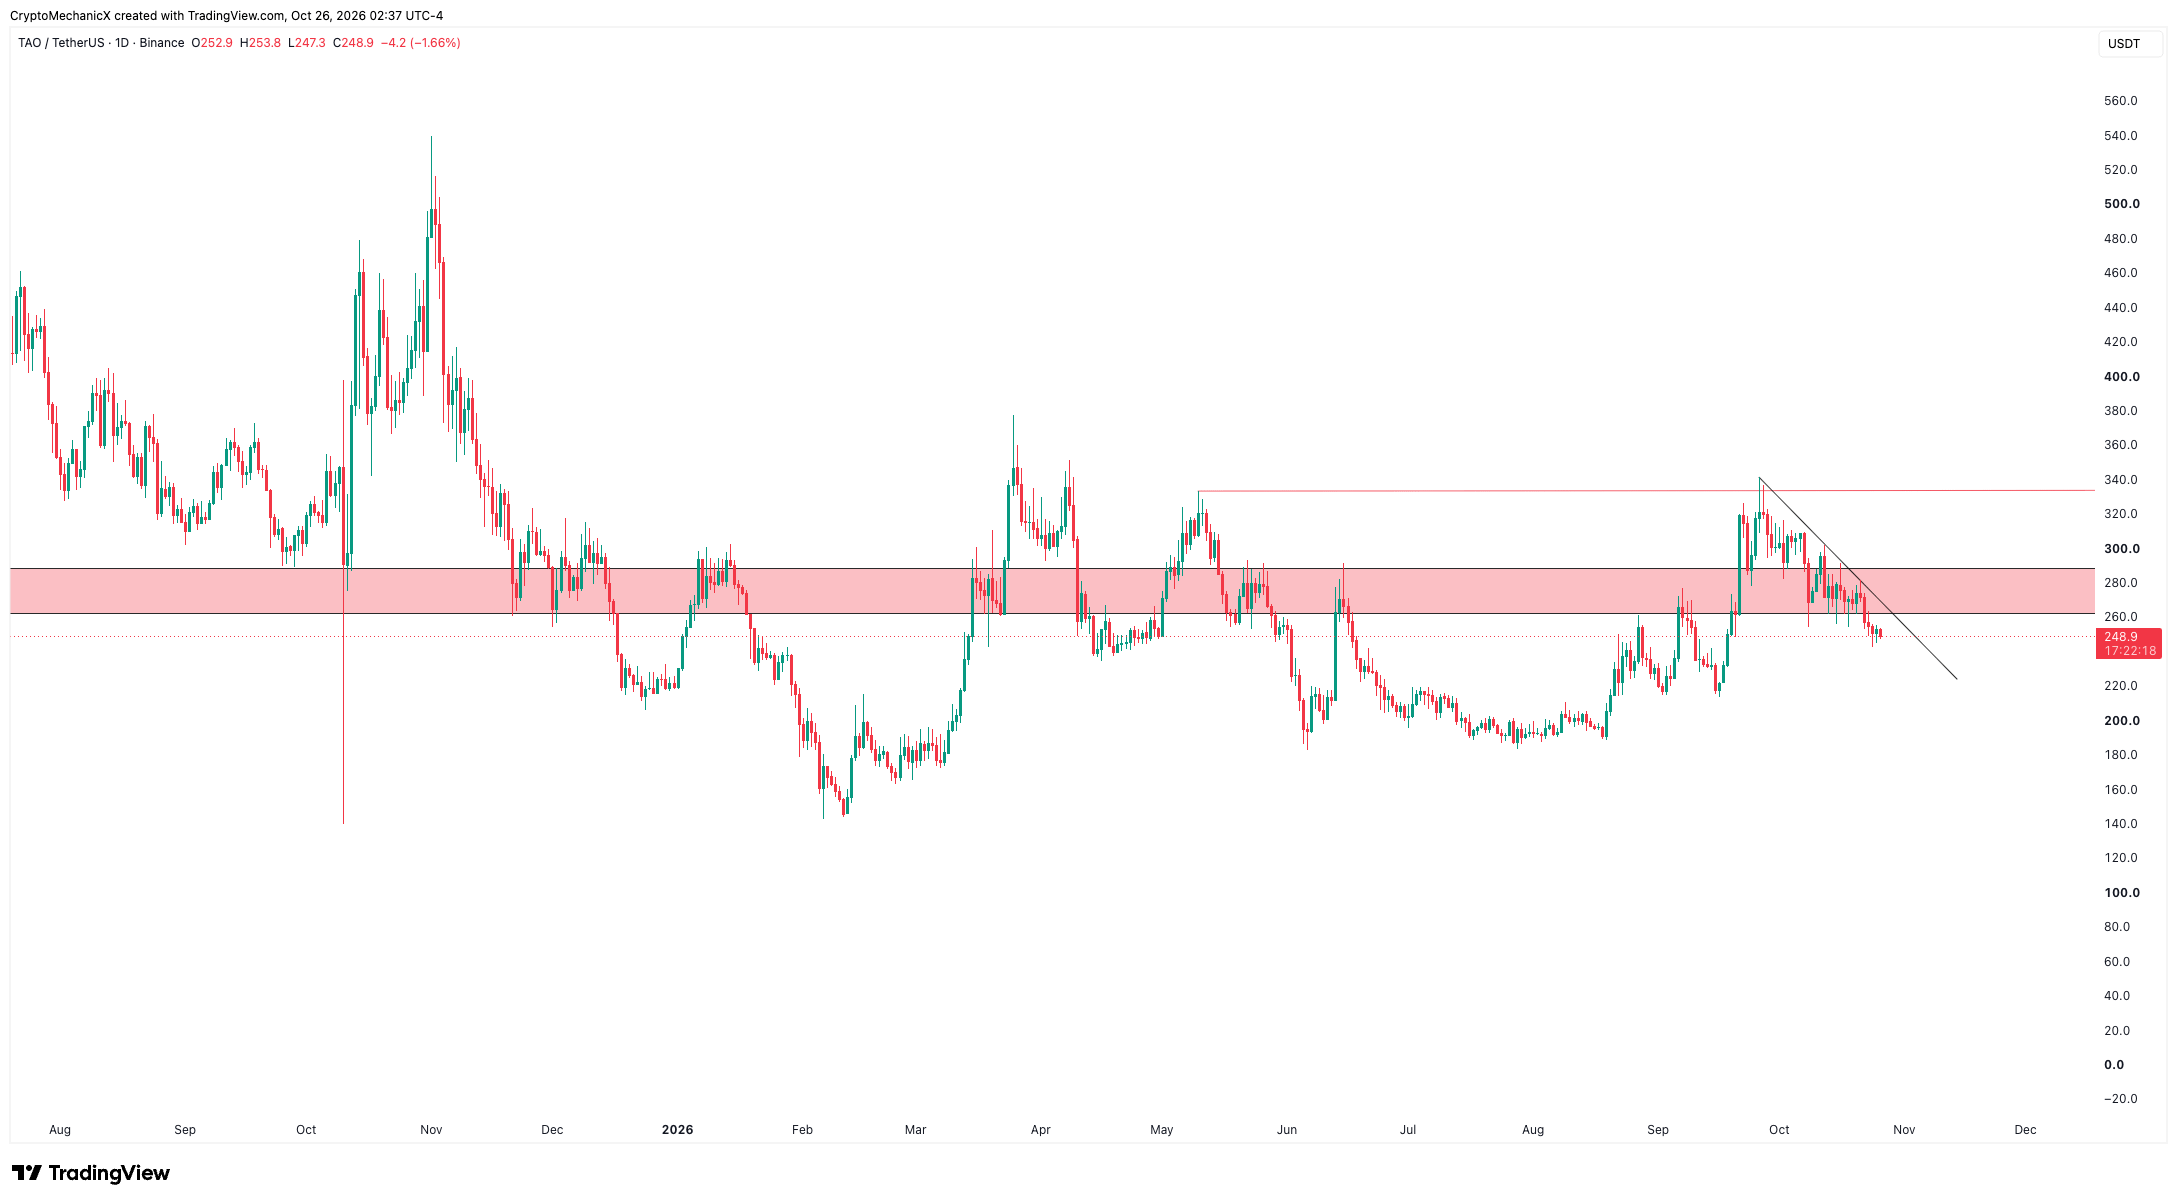
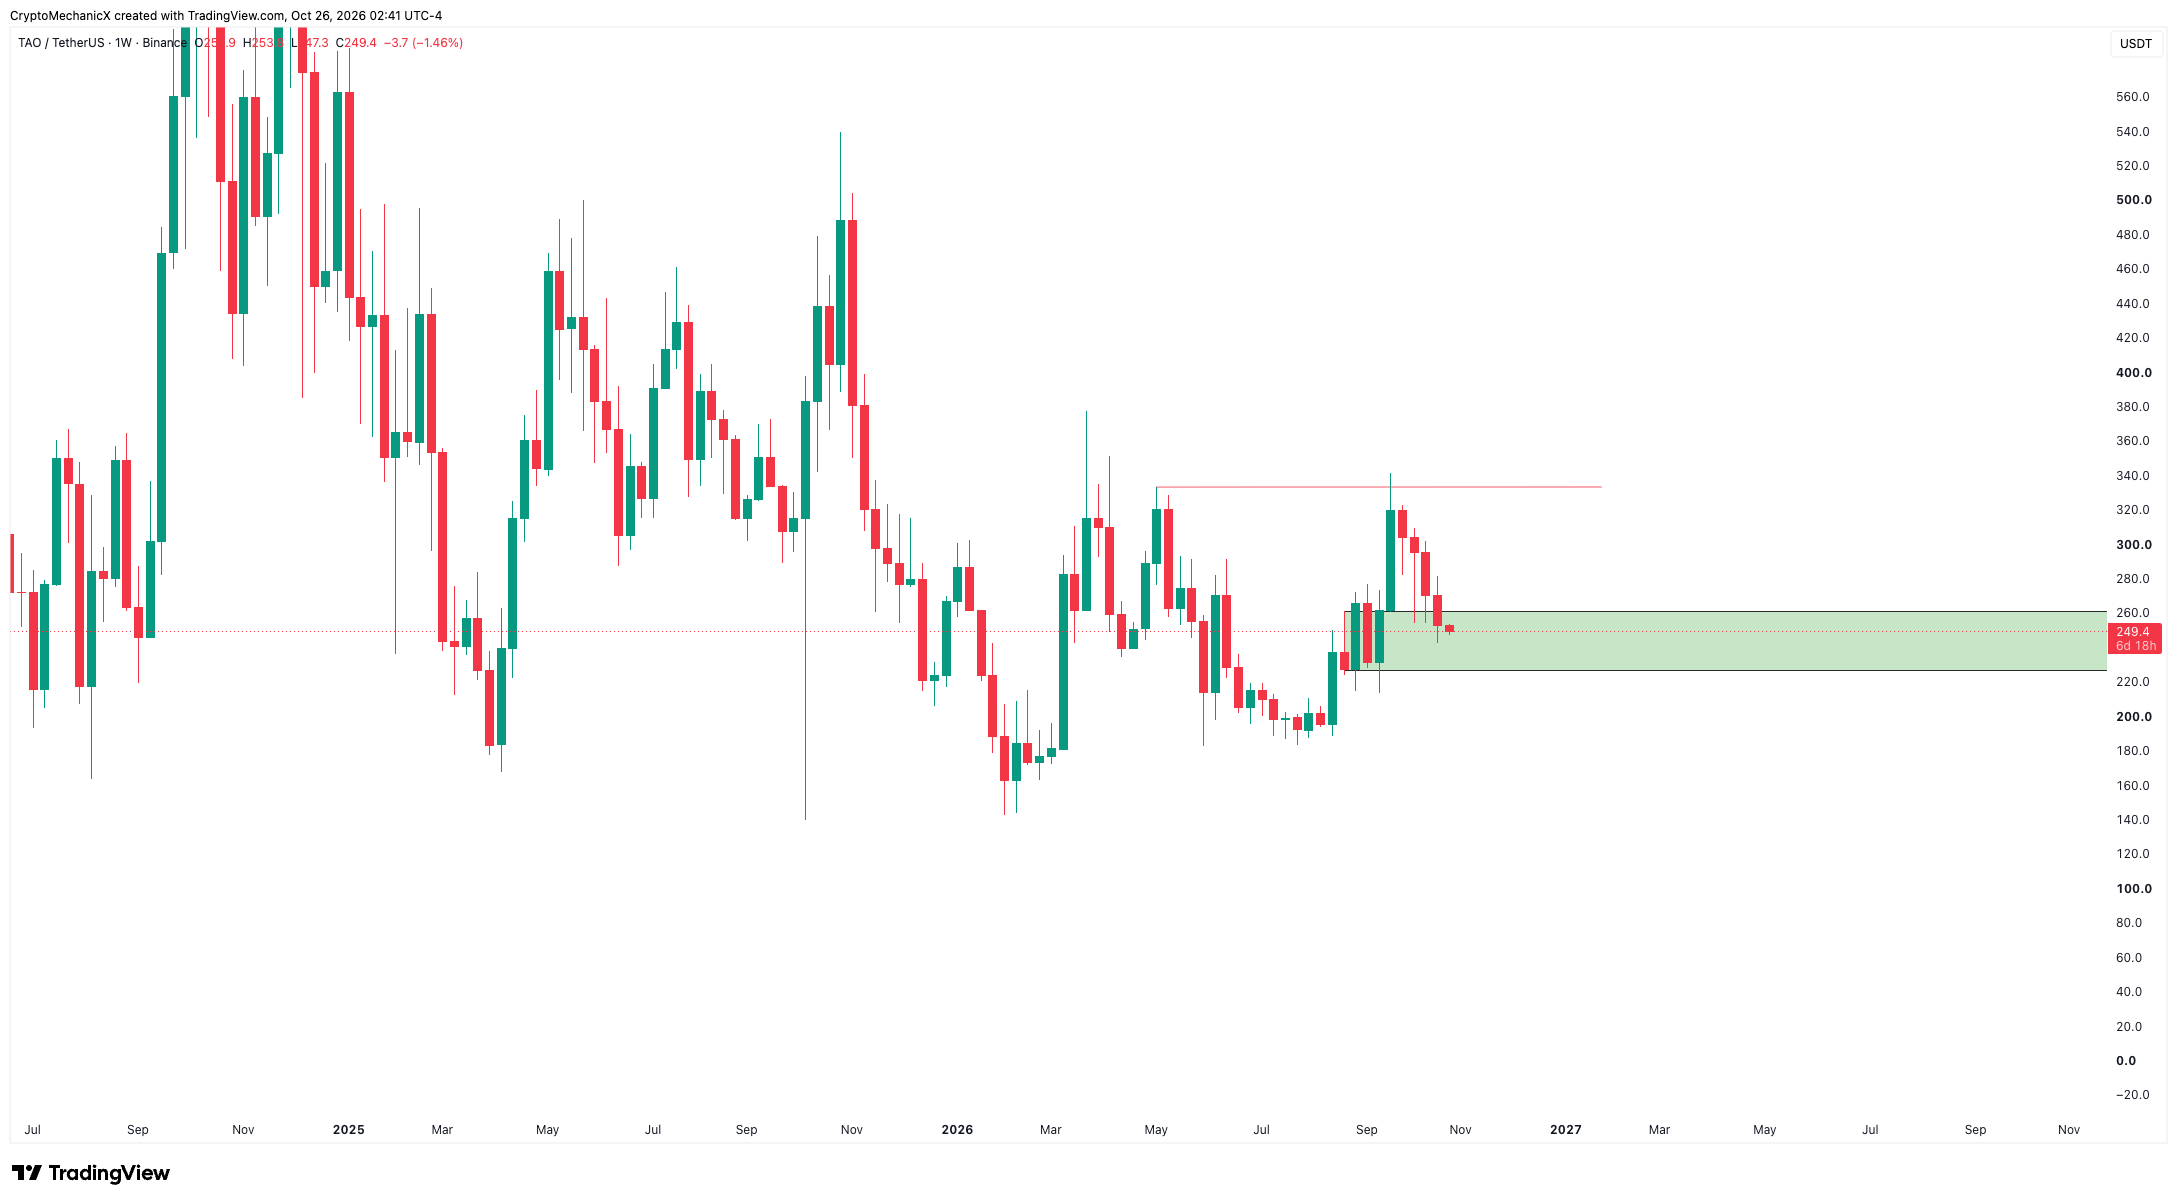
$TAO High Timeframe View
Price is currently trading around the weekly Demand zone
I had this one in my portfolio as well, but price has been failing to show any strength.
Overall market weakness could be the reason, but I wanted to see it hold above those daily highs, which it failed to do.
I exited my trade last week as price kept failing to break any highs.
6
26
4.3k
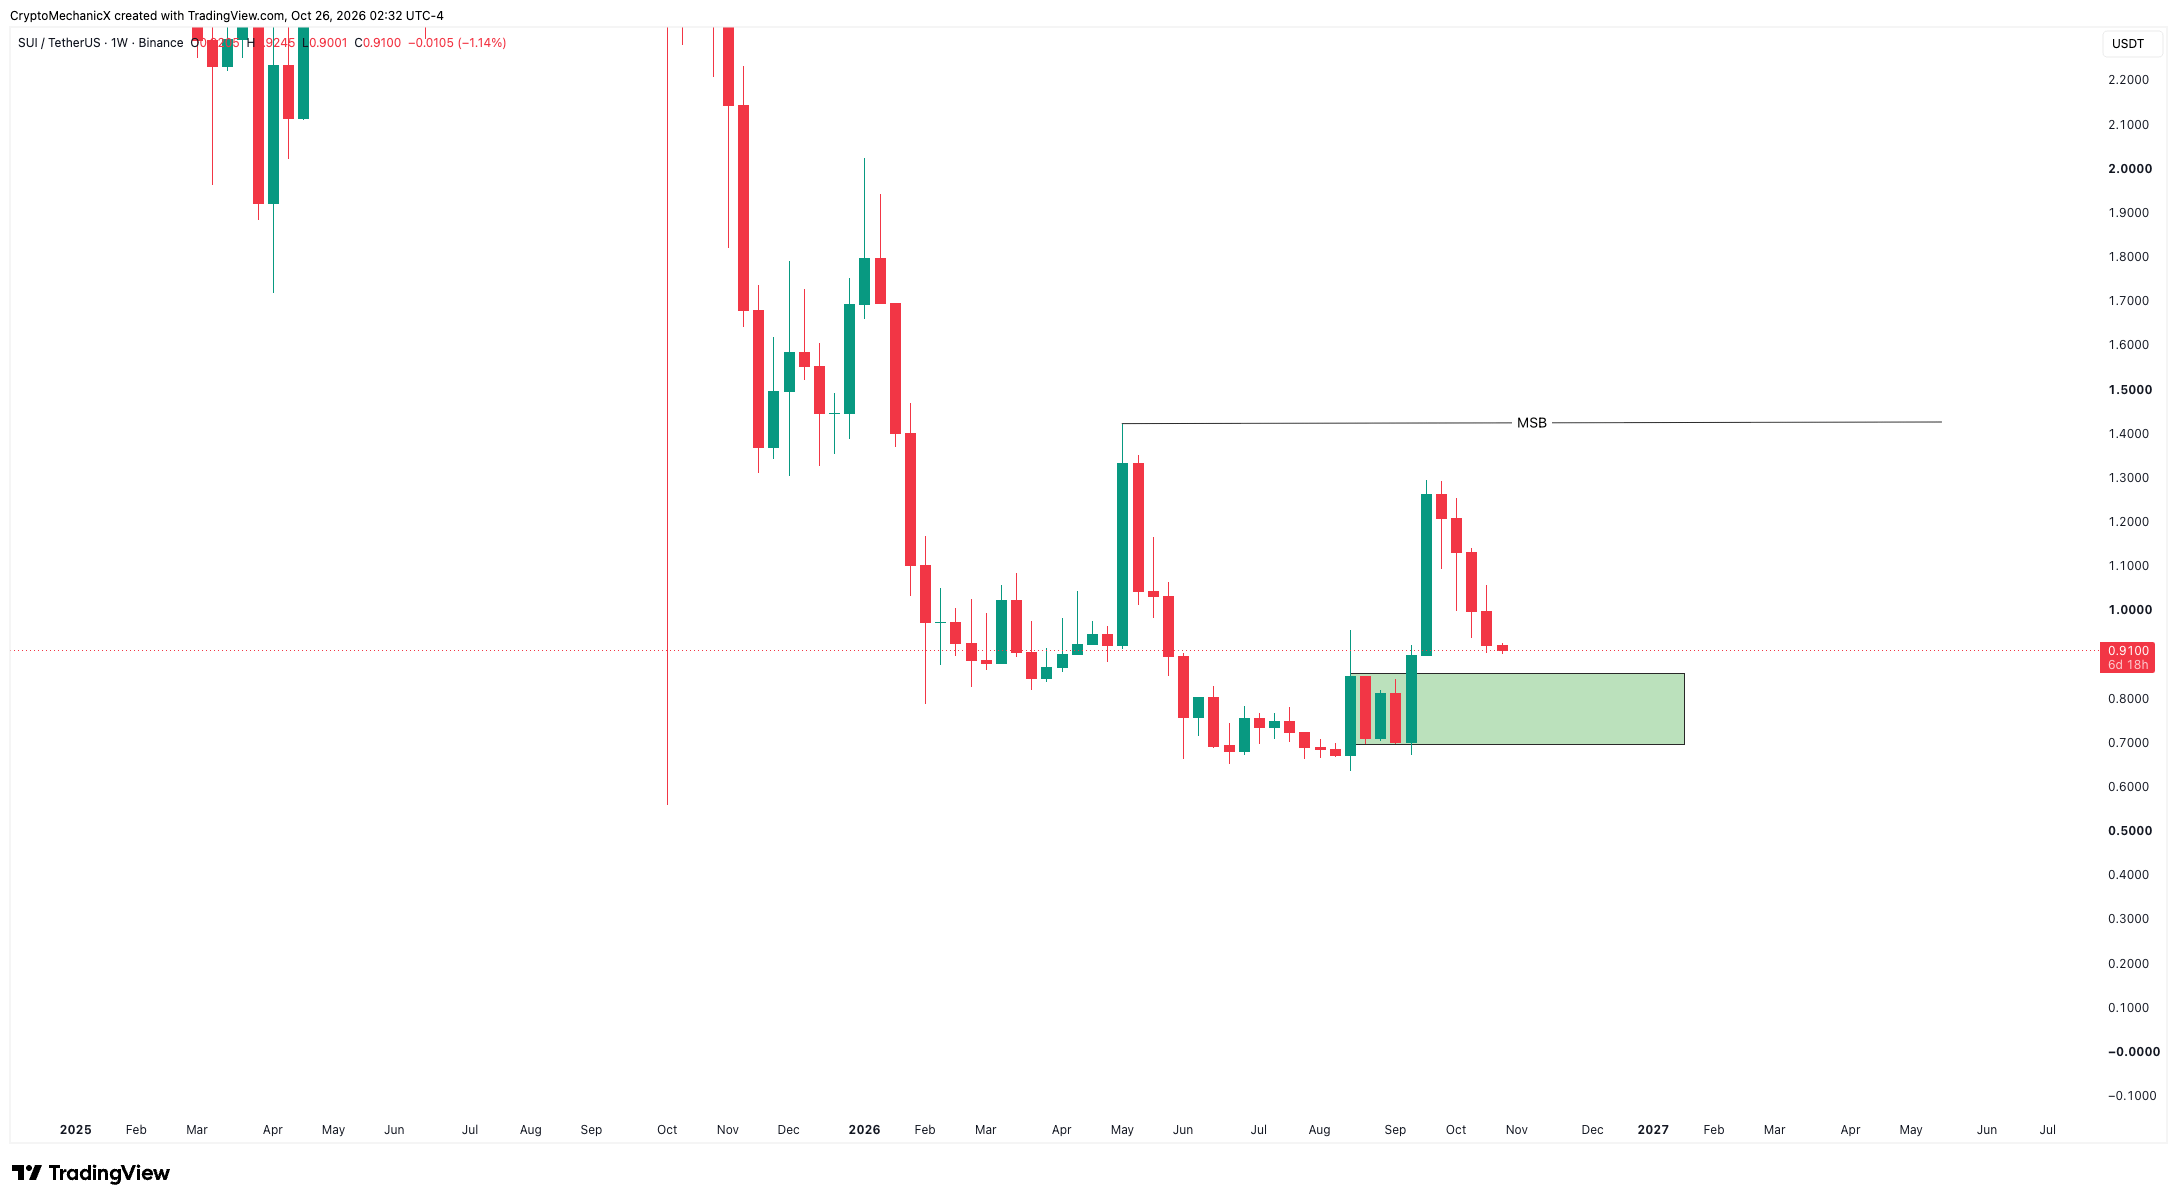
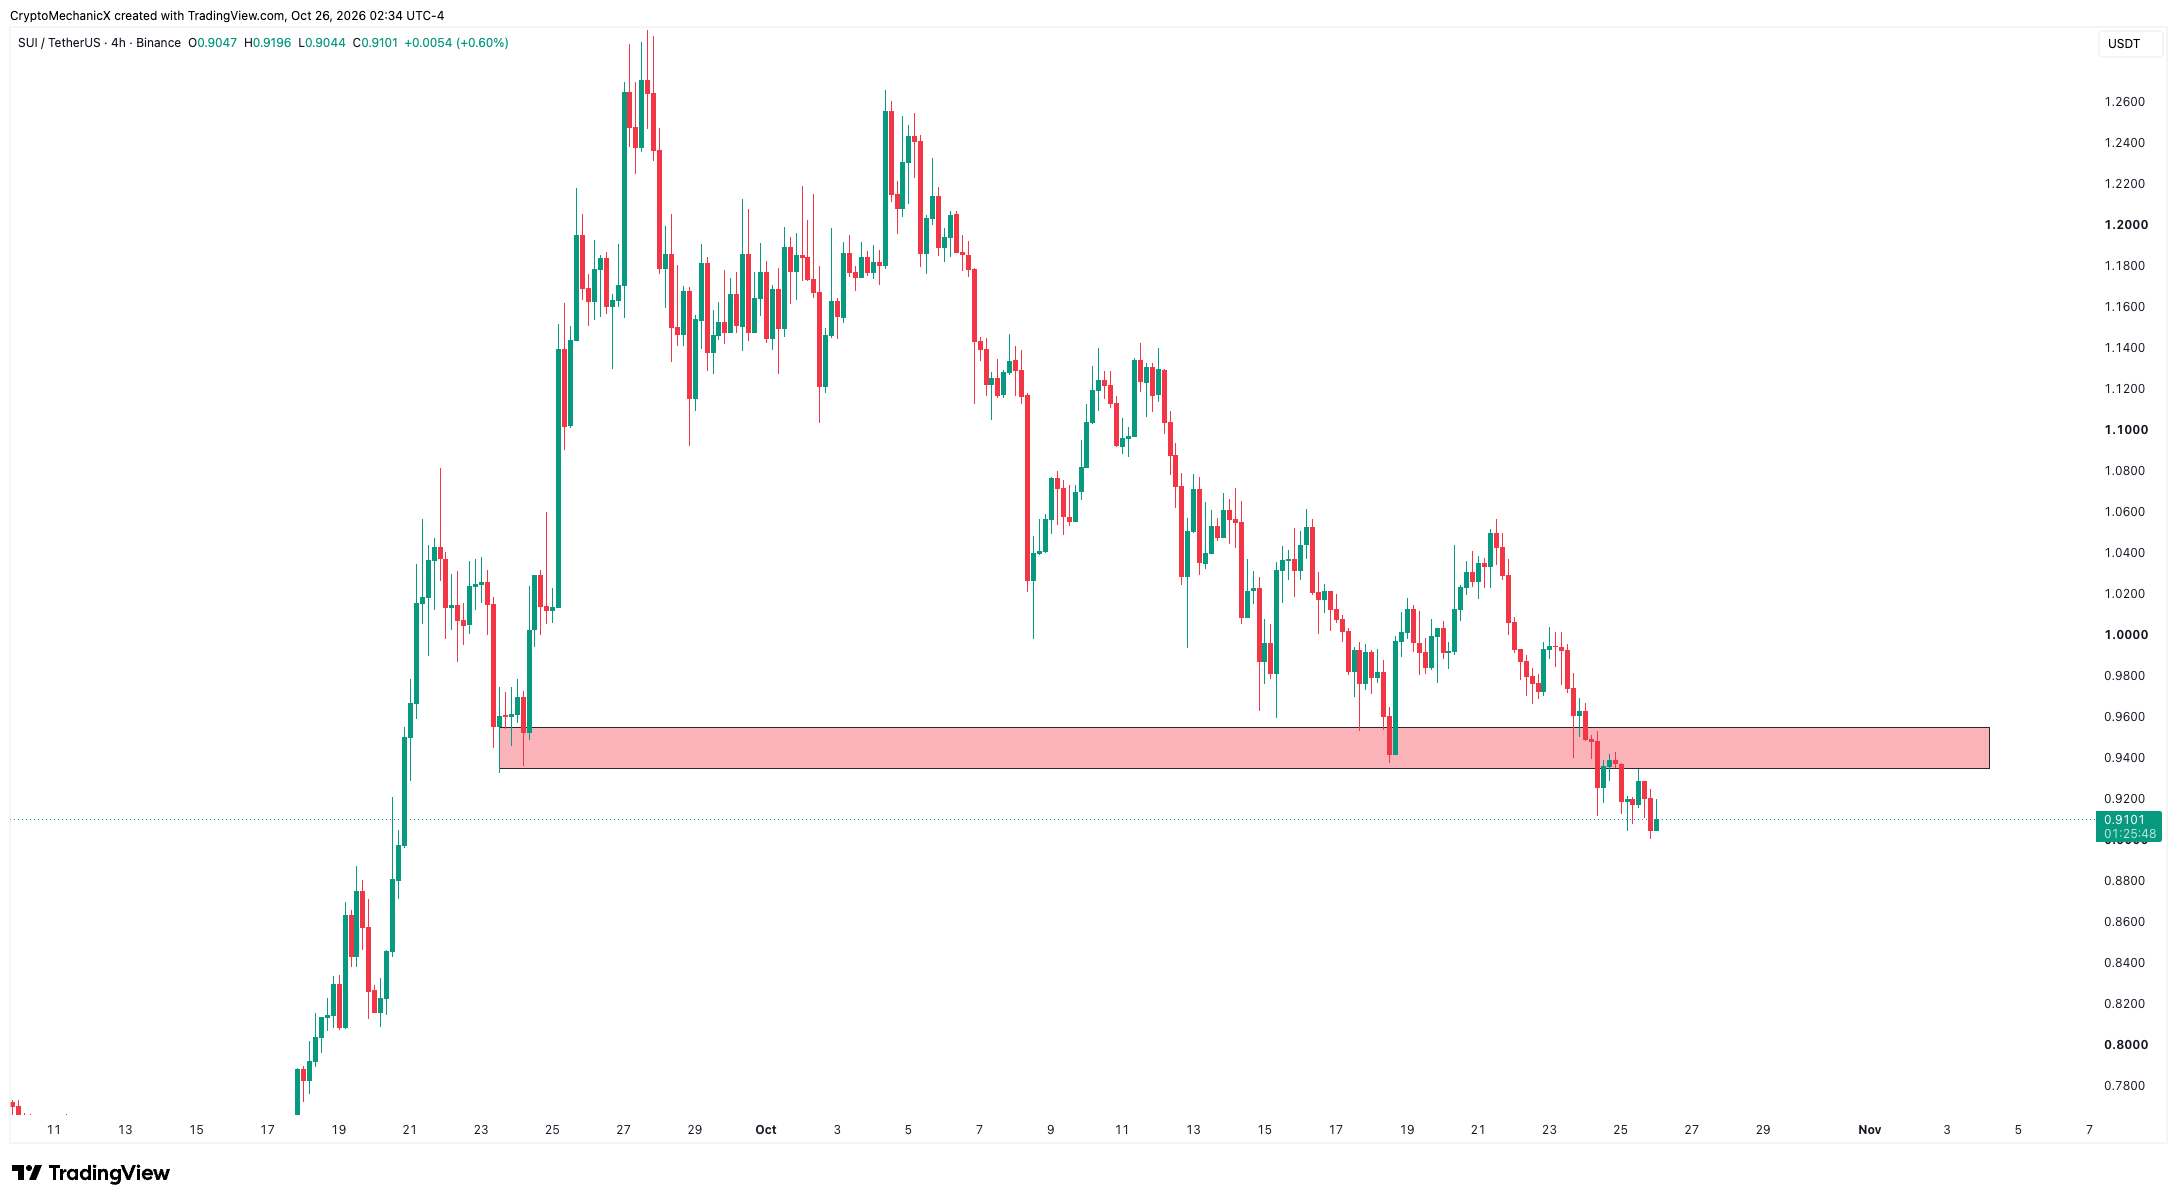
$SUI High Timeframe View
The weekly chart still hasn’t given us a market structure break, which keeps it in a HTF downtrend overall.
Lower timeframes aren’t looking good either, with price breaking below the lows.
Bulls need to reclaim $0.95 at least.
$SUI High Timeframe View
The weekly chart still hasn’t given us a market structure break, which keeps it in a HTF downtrend overall.
Lower timeframes aren’t looking good either, with price breaking below the lows.
Bulls need to reclaim $0.95 at least.
The weekly chart still hasn’t given us a market structure break, which keeps it in a HTF downtrend overall.
Lower timeframes aren’t looking good either, with price breaking below the lows.
Bulls need to reclaim $0.95 at least.
2
25
3.7k
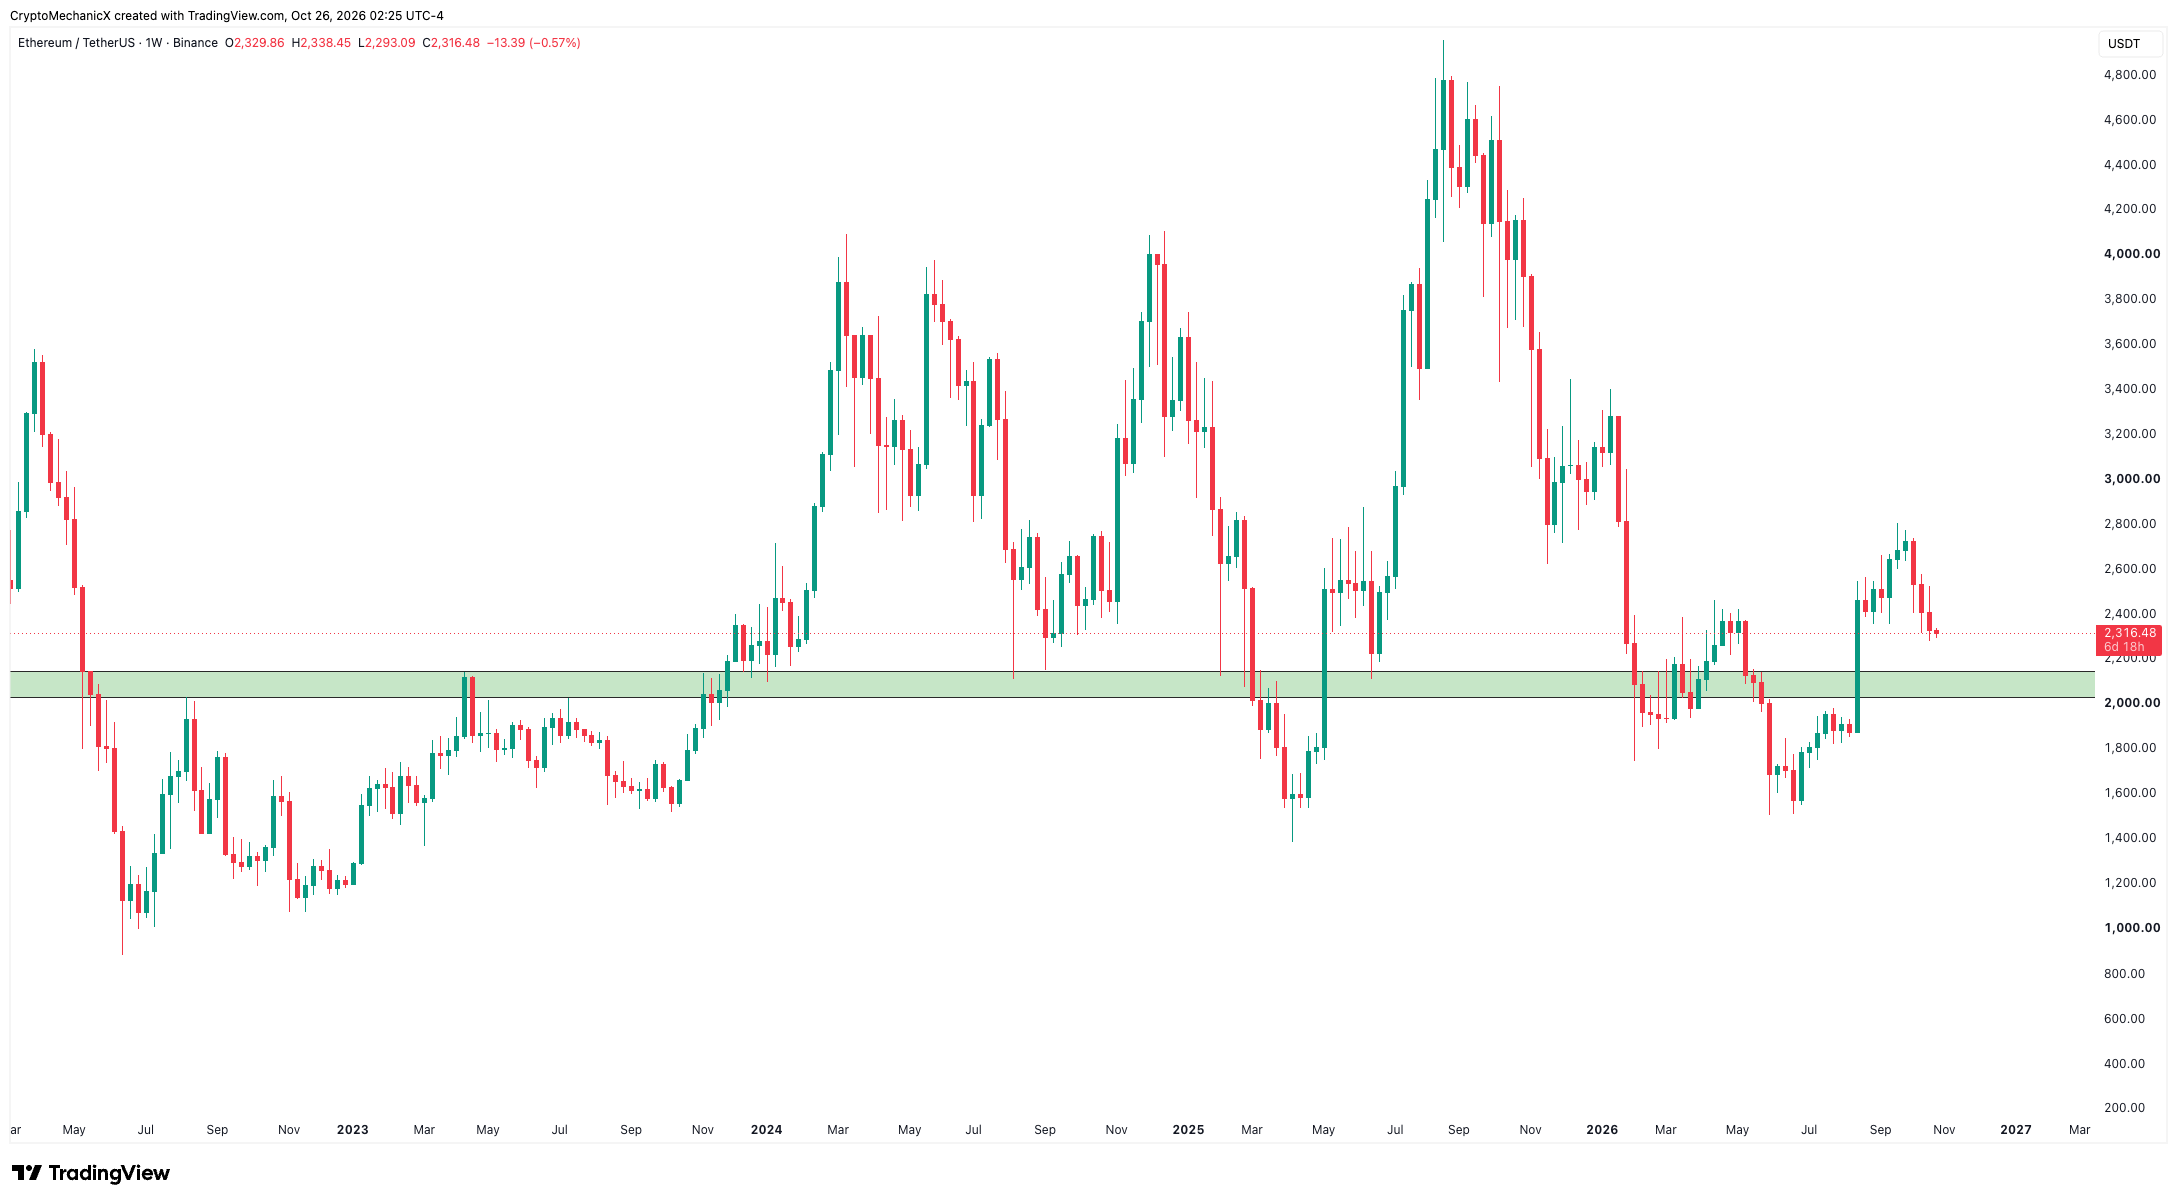
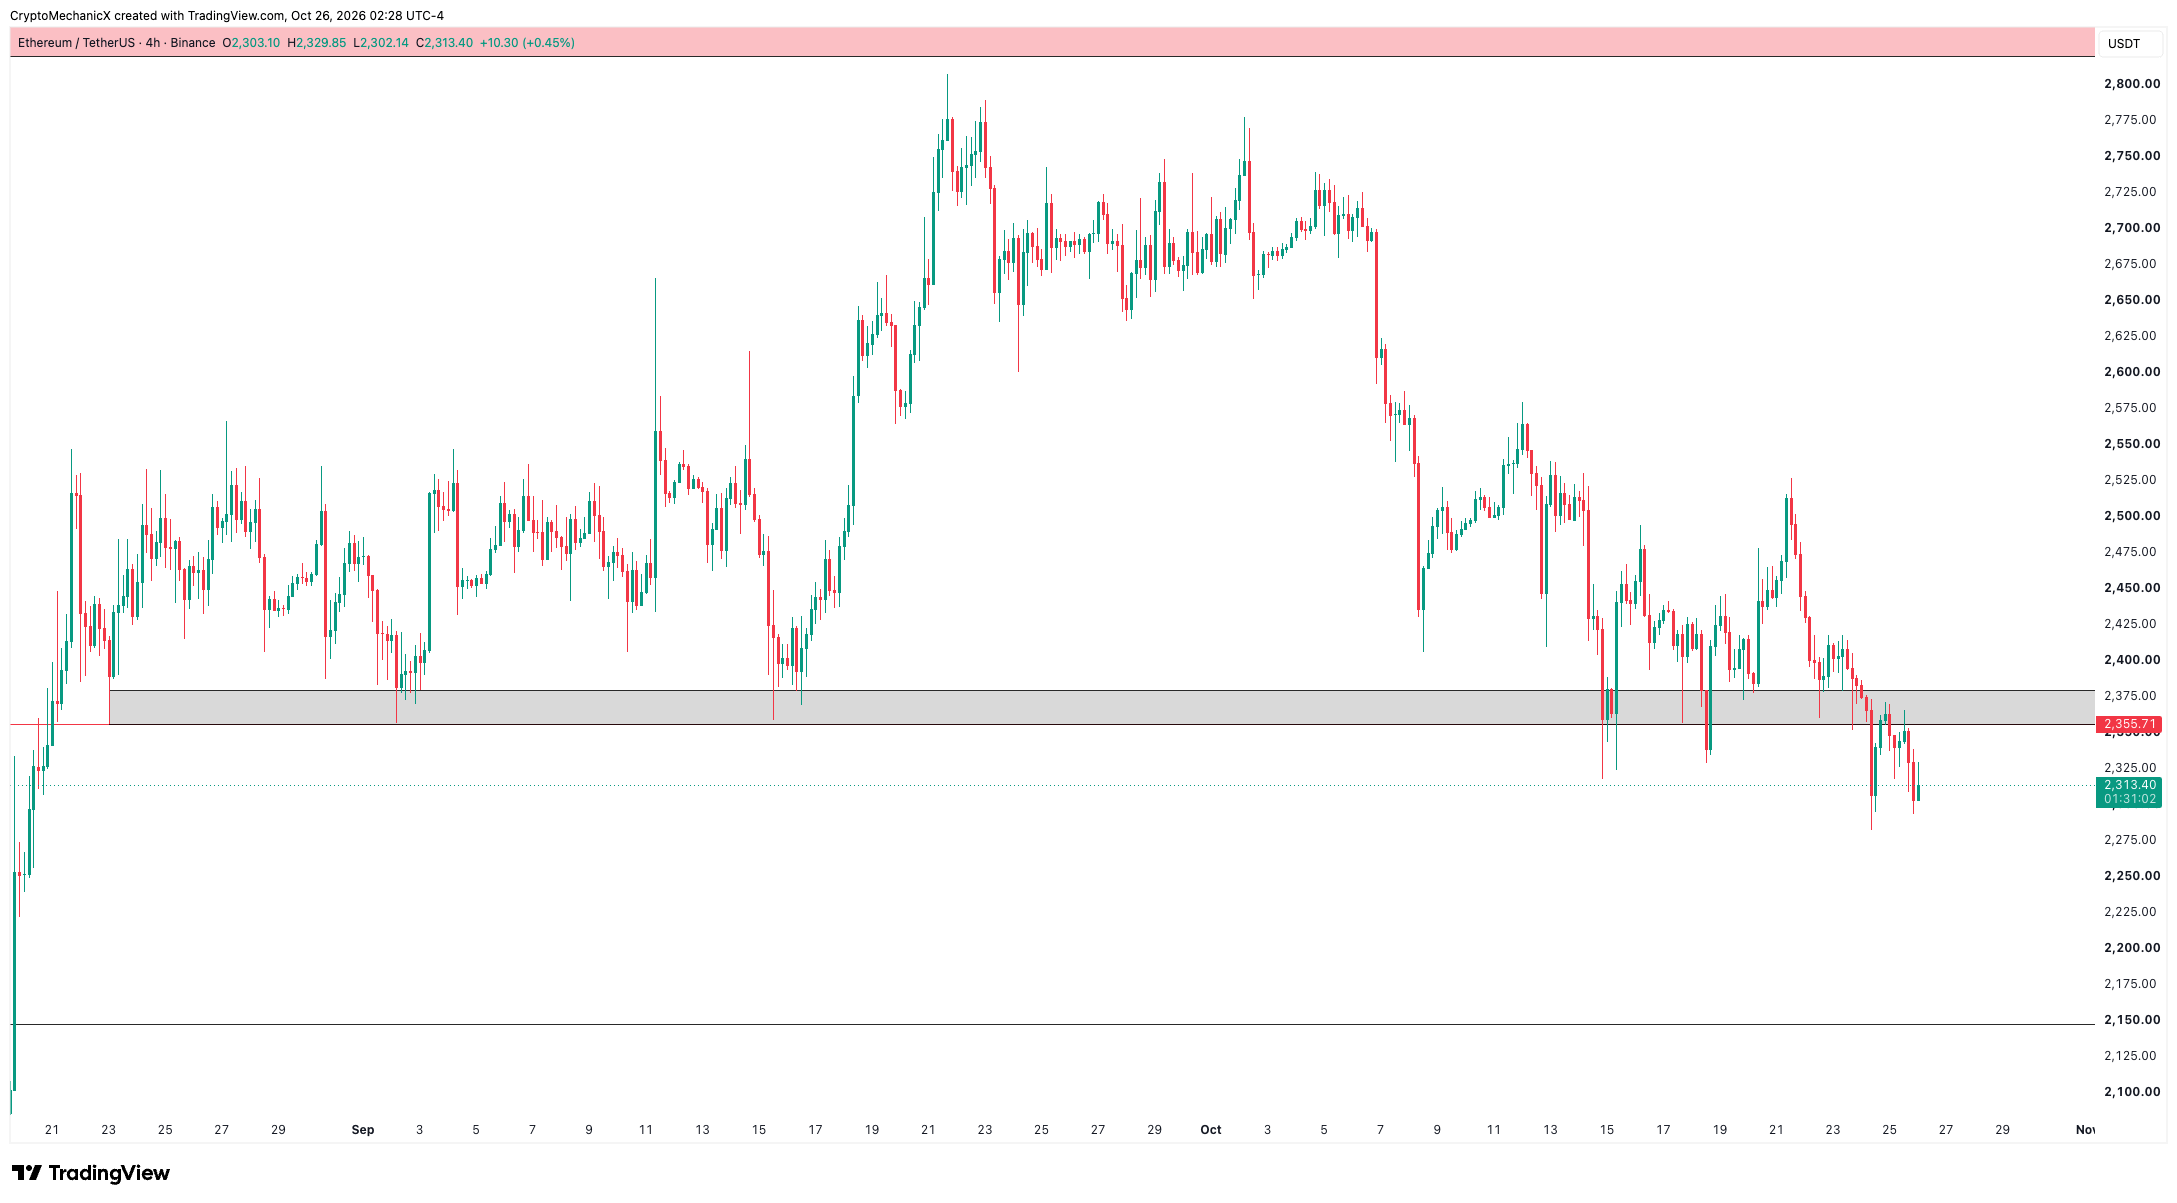
$ETH High Timeframe View
The weekly chart still looks fine as price is holding well above the $2000–2100 zone.
But lower timeframes are starting to look meh after price broke below the lows.
Bulls need to quickly reclaim the $2380 zone to avoid a deeper pullback.
$ETH High Timeframe View
The weekly chart still looks fine as price is holding well above the $2000–2100 zone.
But lower timeframes are starting to look meh after price broke below the lows.
Bulls need to quickly reclaim the $2380 zone to avoid a deeper pullback.
The weekly chart still looks fine as price is holding well above the $2000–2100 zone.
But lower timeframes are starting to look meh after price broke below the lows.
Bulls need to quickly reclaim the $2380 zone to avoid a deeper pullback.
1
31
7.1k
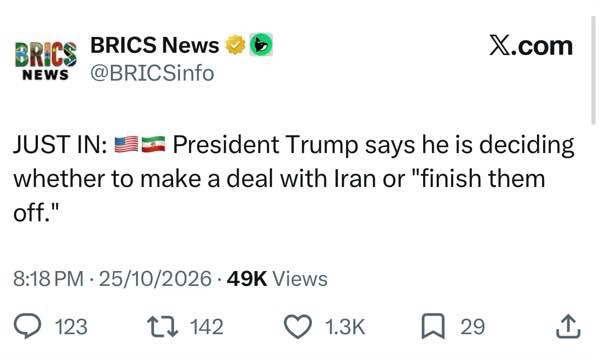
Buckle up guys, stocks are down so orange man is thinking to do something.
Buckle up guys, stocks are down so orange man is thinking to do something.
6
49
10.9k
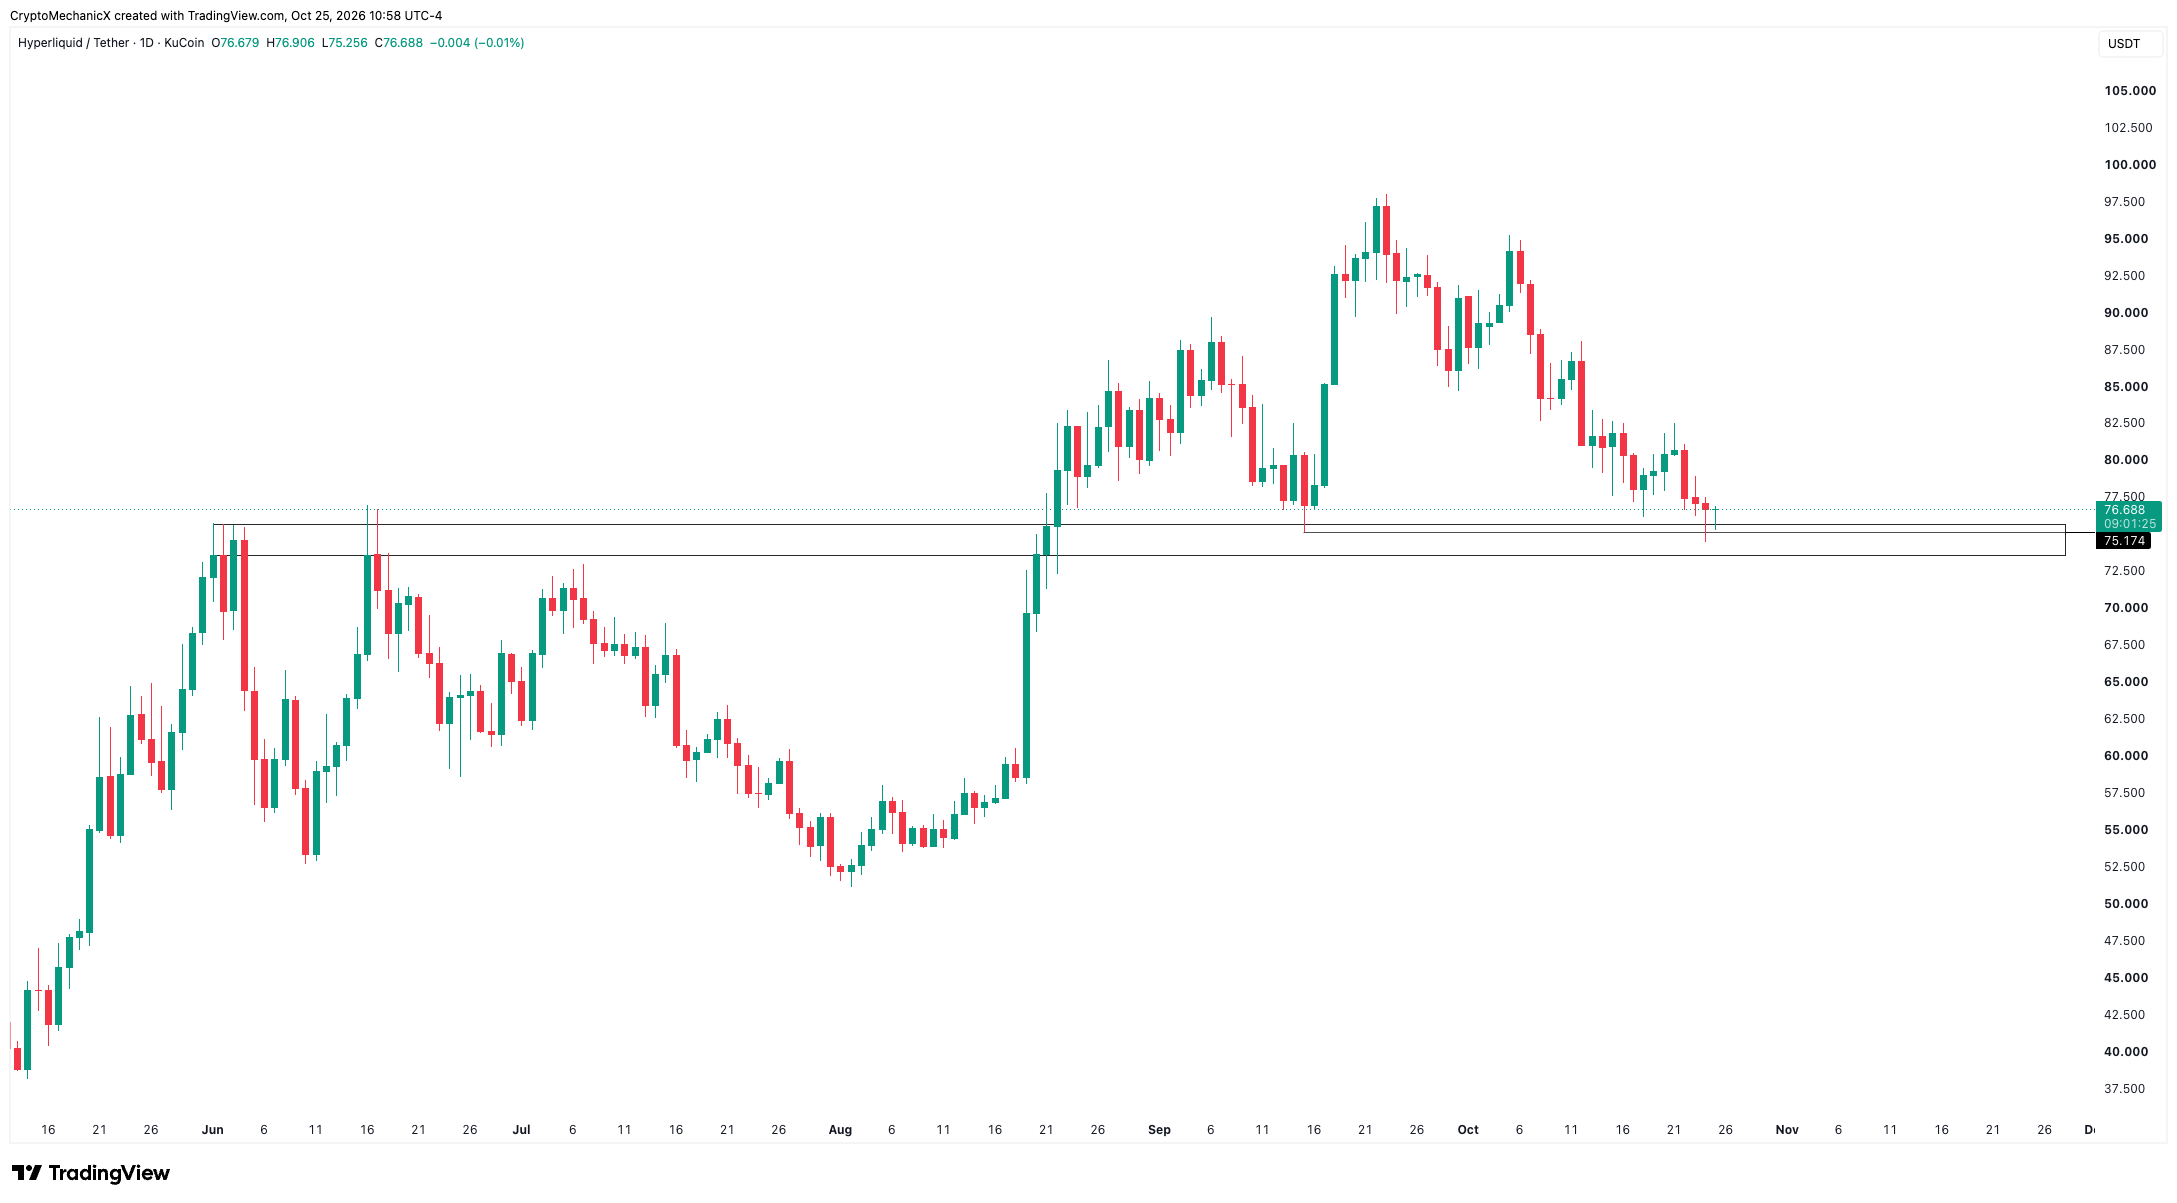
$HYPE Sitting at support with potential Daily SFP.
If it’s going to bounce, this could be the spot.
$HYPE Sitting at support with potential Daily SFP.
If it’s going to bounce, this could be the spot.
If it’s going to bounce, this could be the spot.
1
1
24
6.8k
Көбірек контент көру үшін кіріңіз
Binance Square платформасында әлемдік криптоқоғамдастыққа қосылыңыз
⚡️ Криптовалюта туралы ең соңғы және пайдалы ақпаратты алыңыз.
💬 Әлемдегі ең ірі криптобиржаның сеніміне ие.
👍 Расталған авторлардың нақты пікірлерін табыңыз.
Электрондық пошта/телефон нөмірі
Трендтегі тақырыптар
BinancePick
3.1M рет көрілді
155,185 адам талқылап жатыр
Join #EarningsSeason: Predict Earnings on Binance Pick, Share Your Take on Binance Square!
Binance Square Official
·413 лайк
·343.7k рет көрілді
EarningsSeason
5.3M рет көрілді
26,130 адам талқылап жатыр
AnthropicTTMRevenueGrewAbout1200%
38,663 рет көрілді
471 адам талқылап жатыр