
Crypto Signal Advisor
611 Жариялаулар
Crypto Signal Advisor
Successful traders always manage risk.
Ашық сауда
Жиі сауда жасайтын трейдер
3.5 жыл
135 Жазылым
9.6K+ Жазылушылар
6.1K+ лайк басылған
Жазбалар
Портфолио
Барлығы
Баға ұсыныстары
GOLD ANALYSIS - (Based on 15m Chart)
The Gold perpetual chart is showing a bearish-to-neutral setup. Gold is currently priced at 4,623, facing clear downward pressure. It is trading below the MA7 at 4,627, the MA25 at 4,628, and the MA99 at 4,644. The SAR level at 4,636 sits above the price, which keeps the market heavy. The RSI is at 40.86, which suggests that bears (sellers) are slightly stronger than bulls (buyers) on this 15-minute timeframe.
There is a 60% to 65% chance that Gold moves lower in the next session. The price is currently hugging the daily low of 4,607. If this support level fails to hold, the next stop could be 4,580. Conversely, the upside probability is only 35-40%. For Gold to turn bullish and move up, it must break the first major resistance at 4,640. If it crosses 4,640, we might see a push towards 4,660.
Comparing the 15-minute chart, Gold is trying to hold above the low, but it lacks momentum to bounce higher. While the high Core PCE number (3.6%) usually supports Gold as an inflation hedge, the fear of higher interest rates is capping the gains. Also, the peace talks between Ukraine and the US are reducing safe-haven demand. So, Gold will likely trade sideways to down. A safe strategy is to wait for a breakout above $4,640 before you consider buying.
#GOLD_UPDATE $XAU
The Gold perpetual chart is showing a bearish-to-neutral setup. Gold is currently priced at 4,623, facing clear downward pressure. It is trading below the MA7 at 4,627, the MA25 at 4,628, and the MA99 at 4,644. The SAR level at 4,636 sits above the price, which keeps the market heavy. The RSI is at 40.86, which suggests that bears (sellers) are slightly stronger than bulls (buyers) on this 15-minute timeframe.
There is a 60% to 65% chance that Gold moves lower in the next session. The price is currently hugging the daily low of 4,607. If this support level fails to hold, the next stop could be 4,580. Conversely, the upside probability is only 35-40%. For Gold to turn bullish and move up, it must break the first major resistance at 4,640. If it crosses 4,640, we might see a push towards 4,660.
Comparing the 15-minute chart, Gold is trying to hold above the low, but it lacks momentum to bounce higher. While the high Core PCE number (3.6%) usually supports Gold as an inflation hedge, the fear of higher interest rates is capping the gains. Also, the peace talks between Ukraine and the US are reducing safe-haven demand. So, Gold will likely trade sideways to down. A safe strategy is to wait for a breakout above $4,640 before you consider buying.
#GOLD_UPDATE $XAU
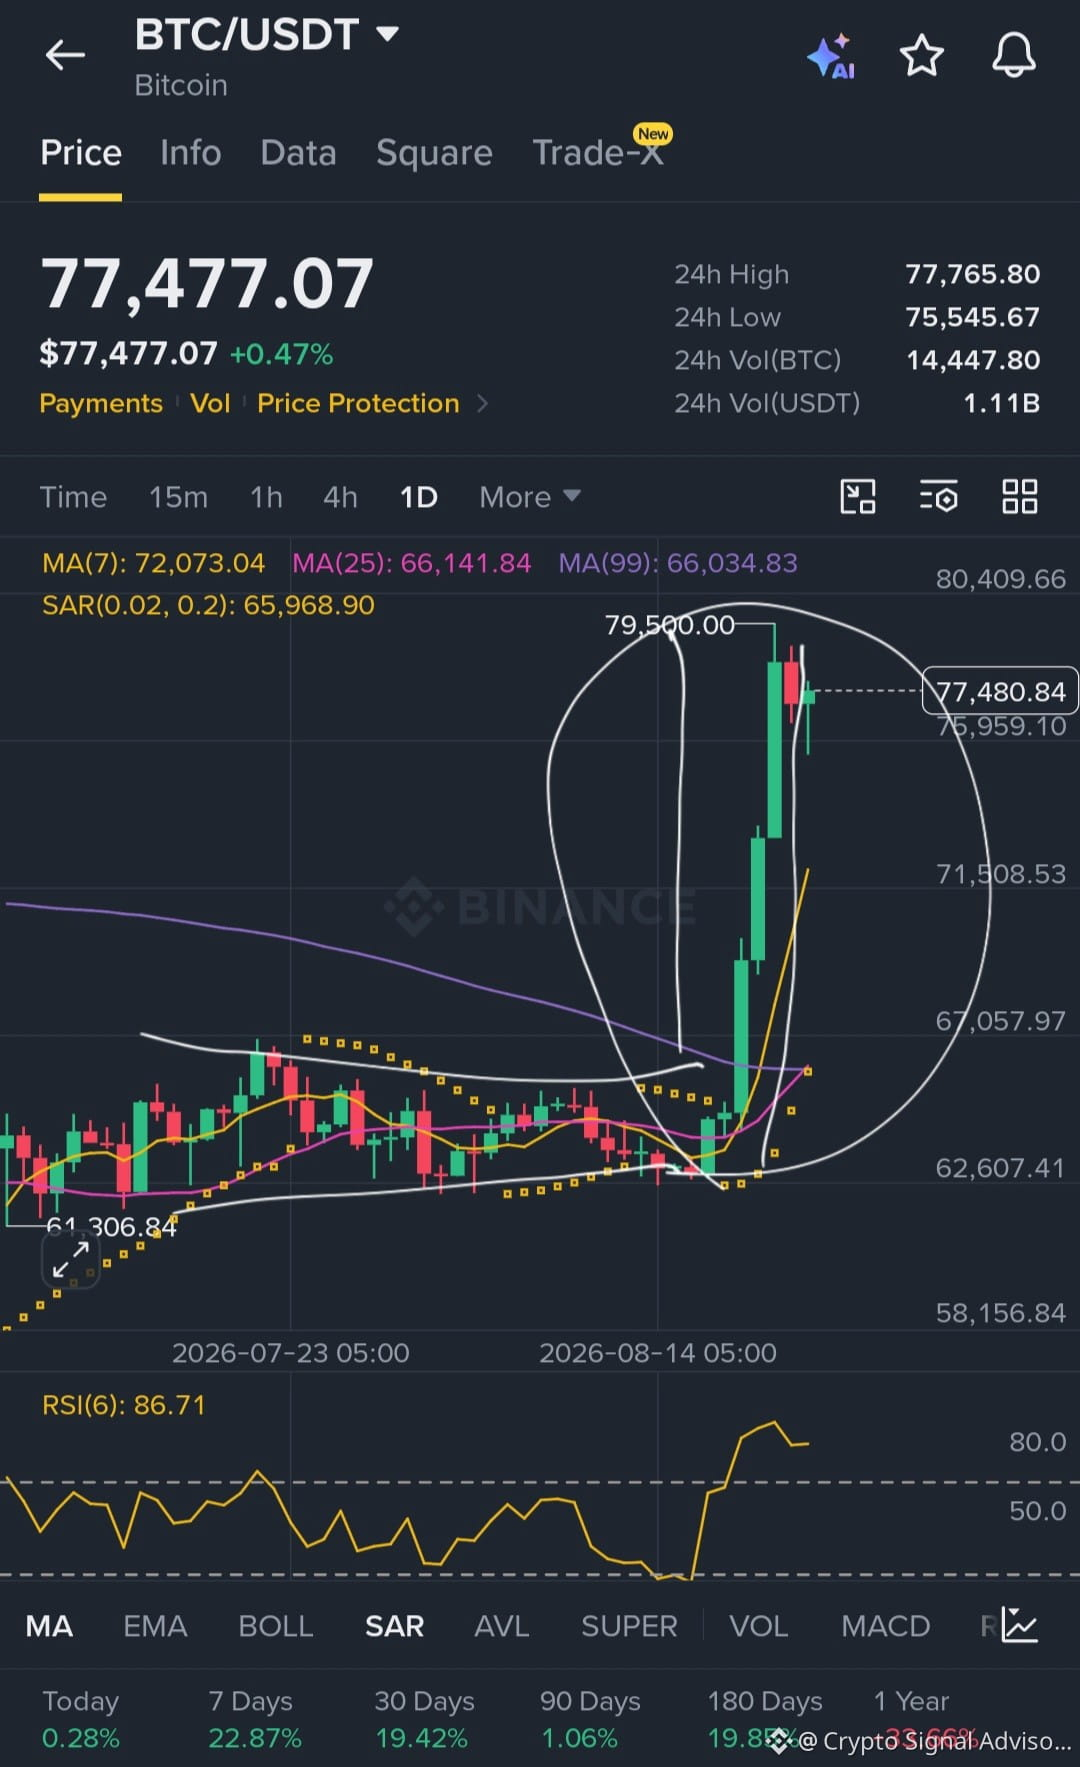
BITCOIN Price ANALYSIS - (Based on 15m Chart)
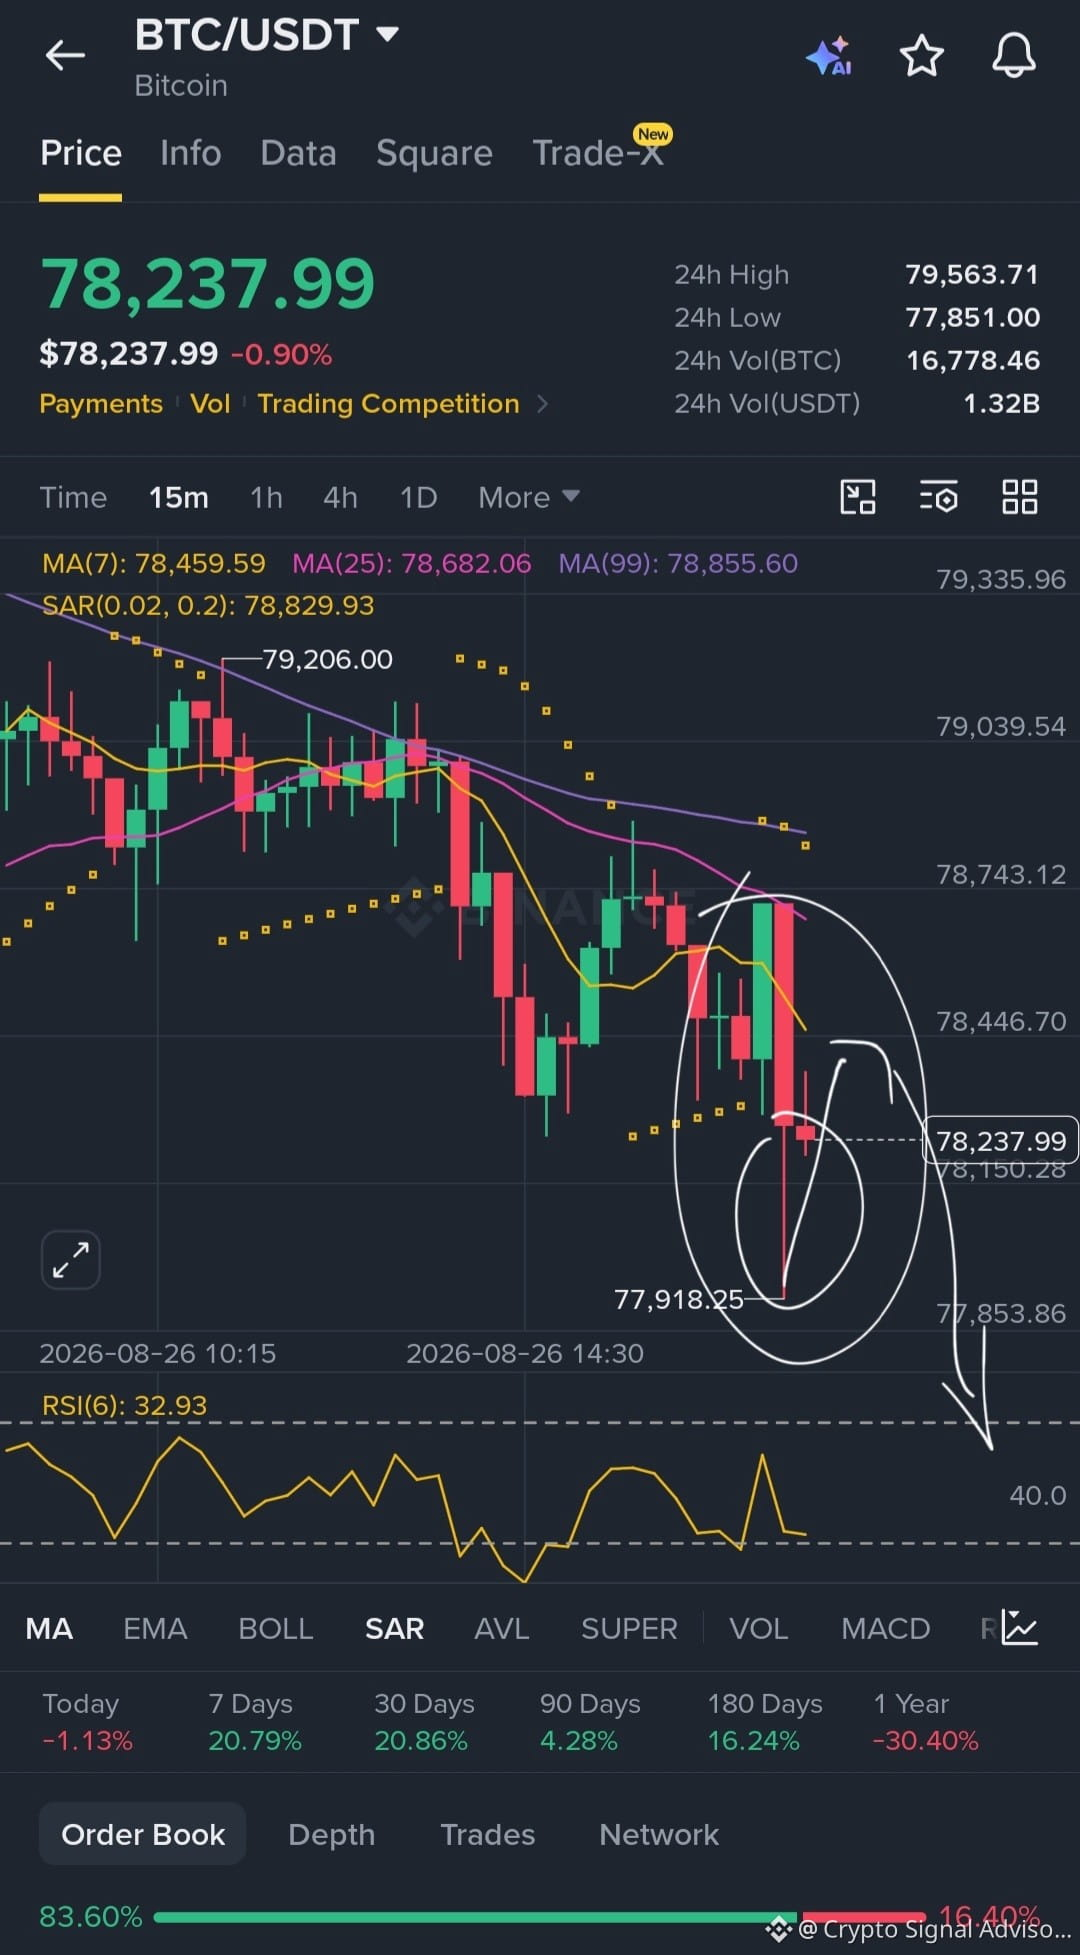
The Bitcoin chart is showing a clear bearish (downward) trend for the short term. The current price is 78,237, which is trading below all three major moving averages 78,459, MA25 at 78,682, and MA99 at 78,855). The MA99 at 78,855 is acting as a strong ceiling. Additionally, the SAR indicator is above the price at 78,829, and the RSI has dropped to 32.93, which shows that sellers are completely in control right now.
There is about a 70% chance that Bitcoin moves further down, while the upside probability is only 30%. The critical support zone is between 77,500 and 77,900. If the price breaks below 77,900, it will quickly fall to 77,000. On the other hand, the main resistance is at 78,800. Bitcoin will only turn bullish if it breaks and closes back above this 78,800 level.
The 15-minute chart shows that buying interest is very weak right now. Although oil prices fell and Ukraine peace talks gave some relief, the hot inflation data (PCE 3.6%) is keeping the pressure on Bitcoin. I advise you to avoid buying right now. Wait for a clean break above 78,800 to enter a long trade; otherwise, the bearish trend is likely to continue towards 77,000.
#BTC☀ $BTC
The Bitcoin chart is showing a clear bearish (downward) trend for the short term. The current price is 78,237, which is trading below all three major moving averages 78,459, MA25 at 78,682, and MA99 at 78,855). The MA99 at 78,855 is acting as a strong ceiling. Additionally, the SAR indicator is above the price at 78,829, and the RSI has dropped to 32.93, which shows that sellers are completely in control right now.
There is about a 70% chance that Bitcoin moves further down, while the upside probability is only 30%. The critical support zone is between 77,500 and 77,900. If the price breaks below 77,900, it will quickly fall to 77,000. On the other hand, the main resistance is at 78,800. Bitcoin will only turn bullish if it breaks and closes back above this 78,800 level.
The 15-minute chart shows that buying interest is very weak right now. Although oil prices fell and Ukraine peace talks gave some relief, the hot inflation data (PCE 3.6%) is keeping the pressure on Bitcoin. I advise you to avoid buying right now. Wait for a clean break above 78,800 to enter a long trade; otherwise, the bearish trend is likely to continue towards 77,000.
#BTC☀ $BTC
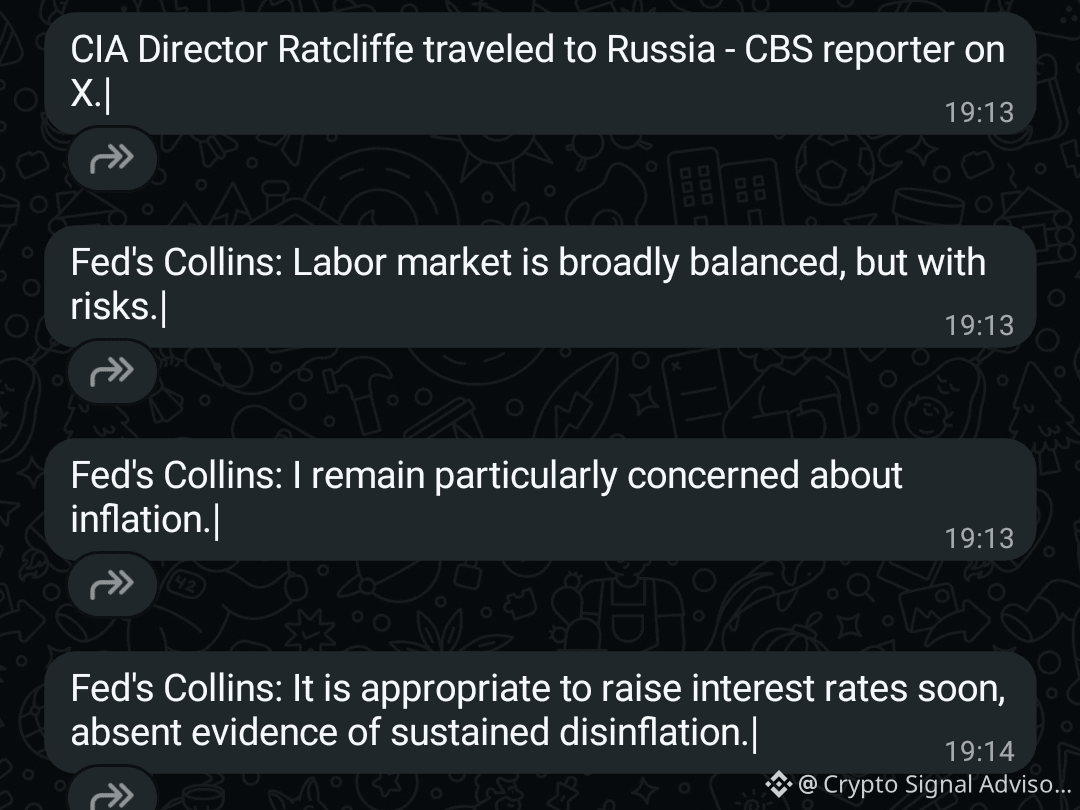
Collins discussion!!!
Soon we will se btc at 74k-75k, ready for dump in btc gold and silver
BTC is in strong entry zone
1st target 77000
2nd 76500
3rd 76000
4rth 75600
5th 75200
further downward will send btc on 72k - 74k.
Open imediare short positions
Thanks me later
FED recent rate hike news will send btc stong dip
happy profit
Soon we will se btc at 74k-75k, ready for dump in btc gold and silver
BTC is in strong entry zone
1st target 77000
2nd 76500
3rd 76000
4rth 75600
5th 75200
further downward will send btc on 72k - 74k.
Open imediare short positions
Thanks me later
FED recent rate hike news will send btc stong dip
happy profit
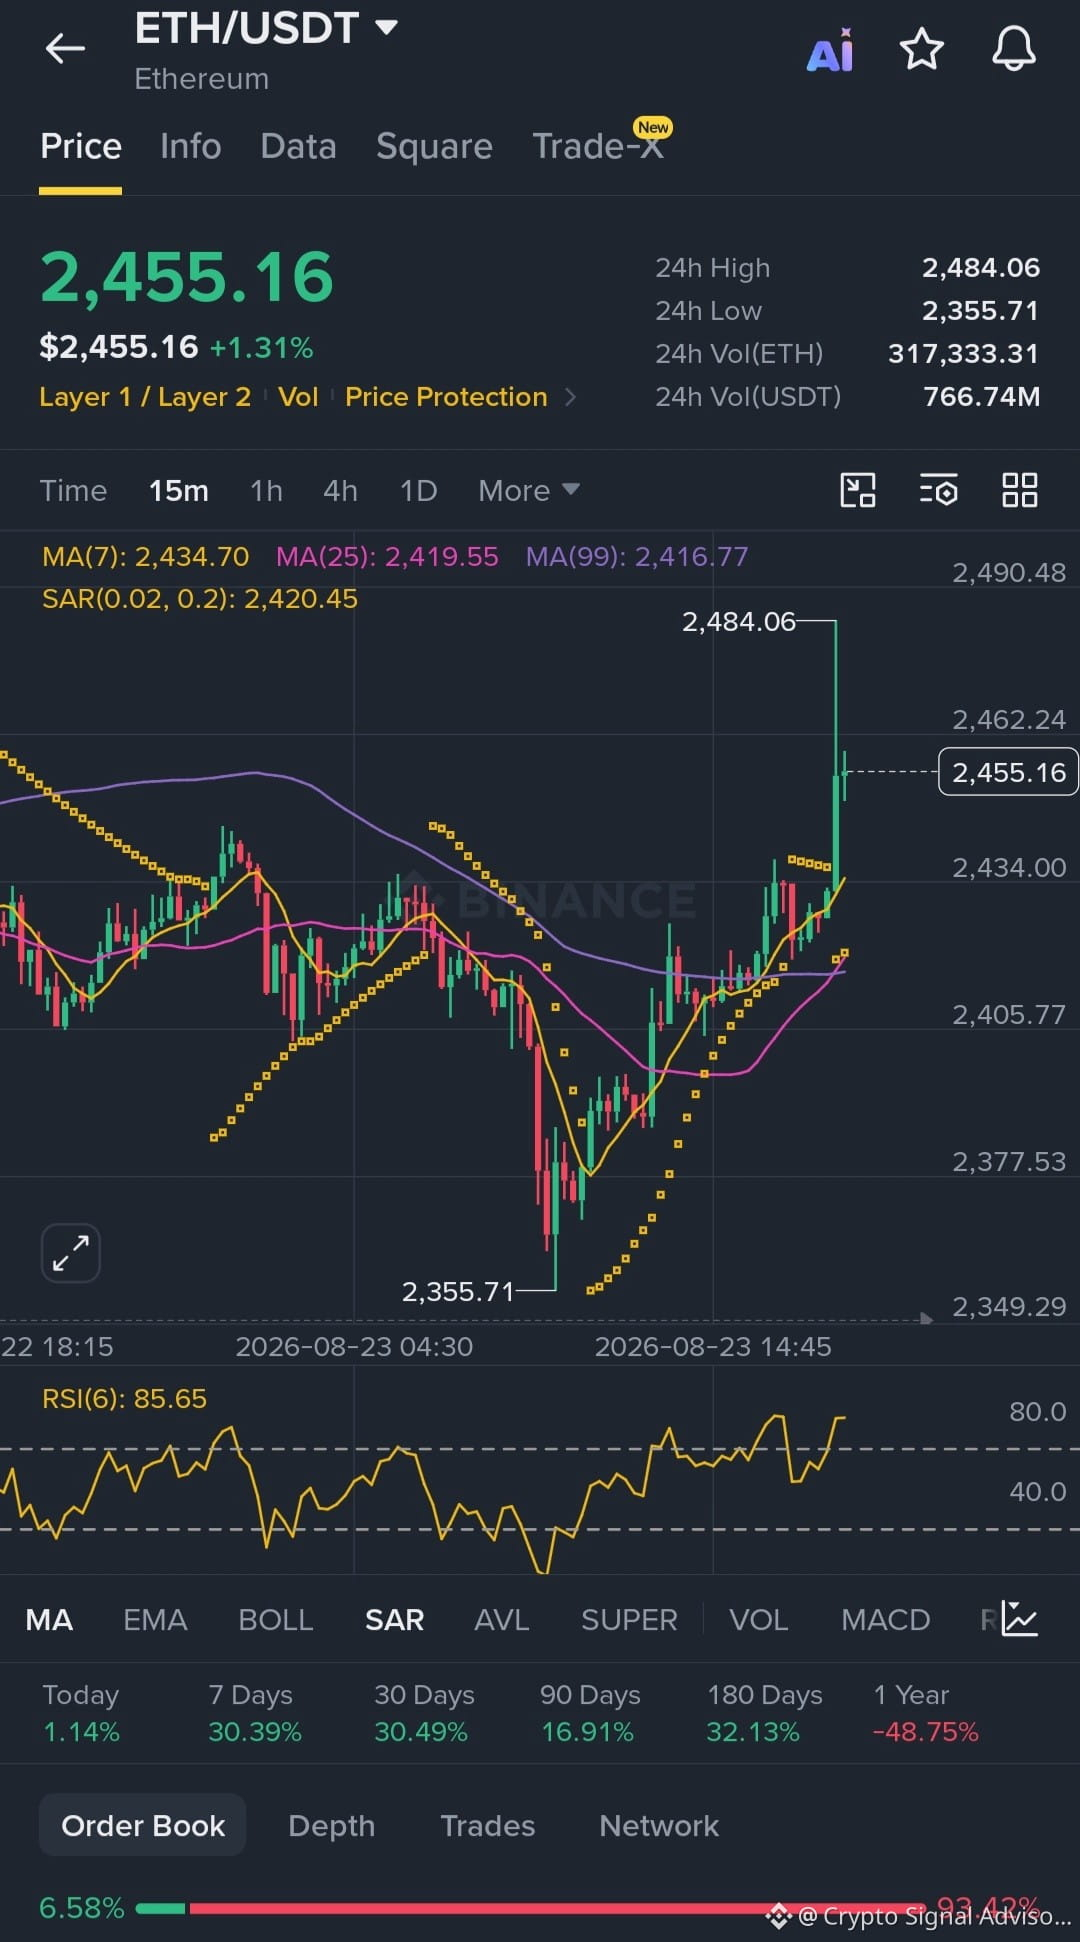
ETH Future Trade Signals!!!
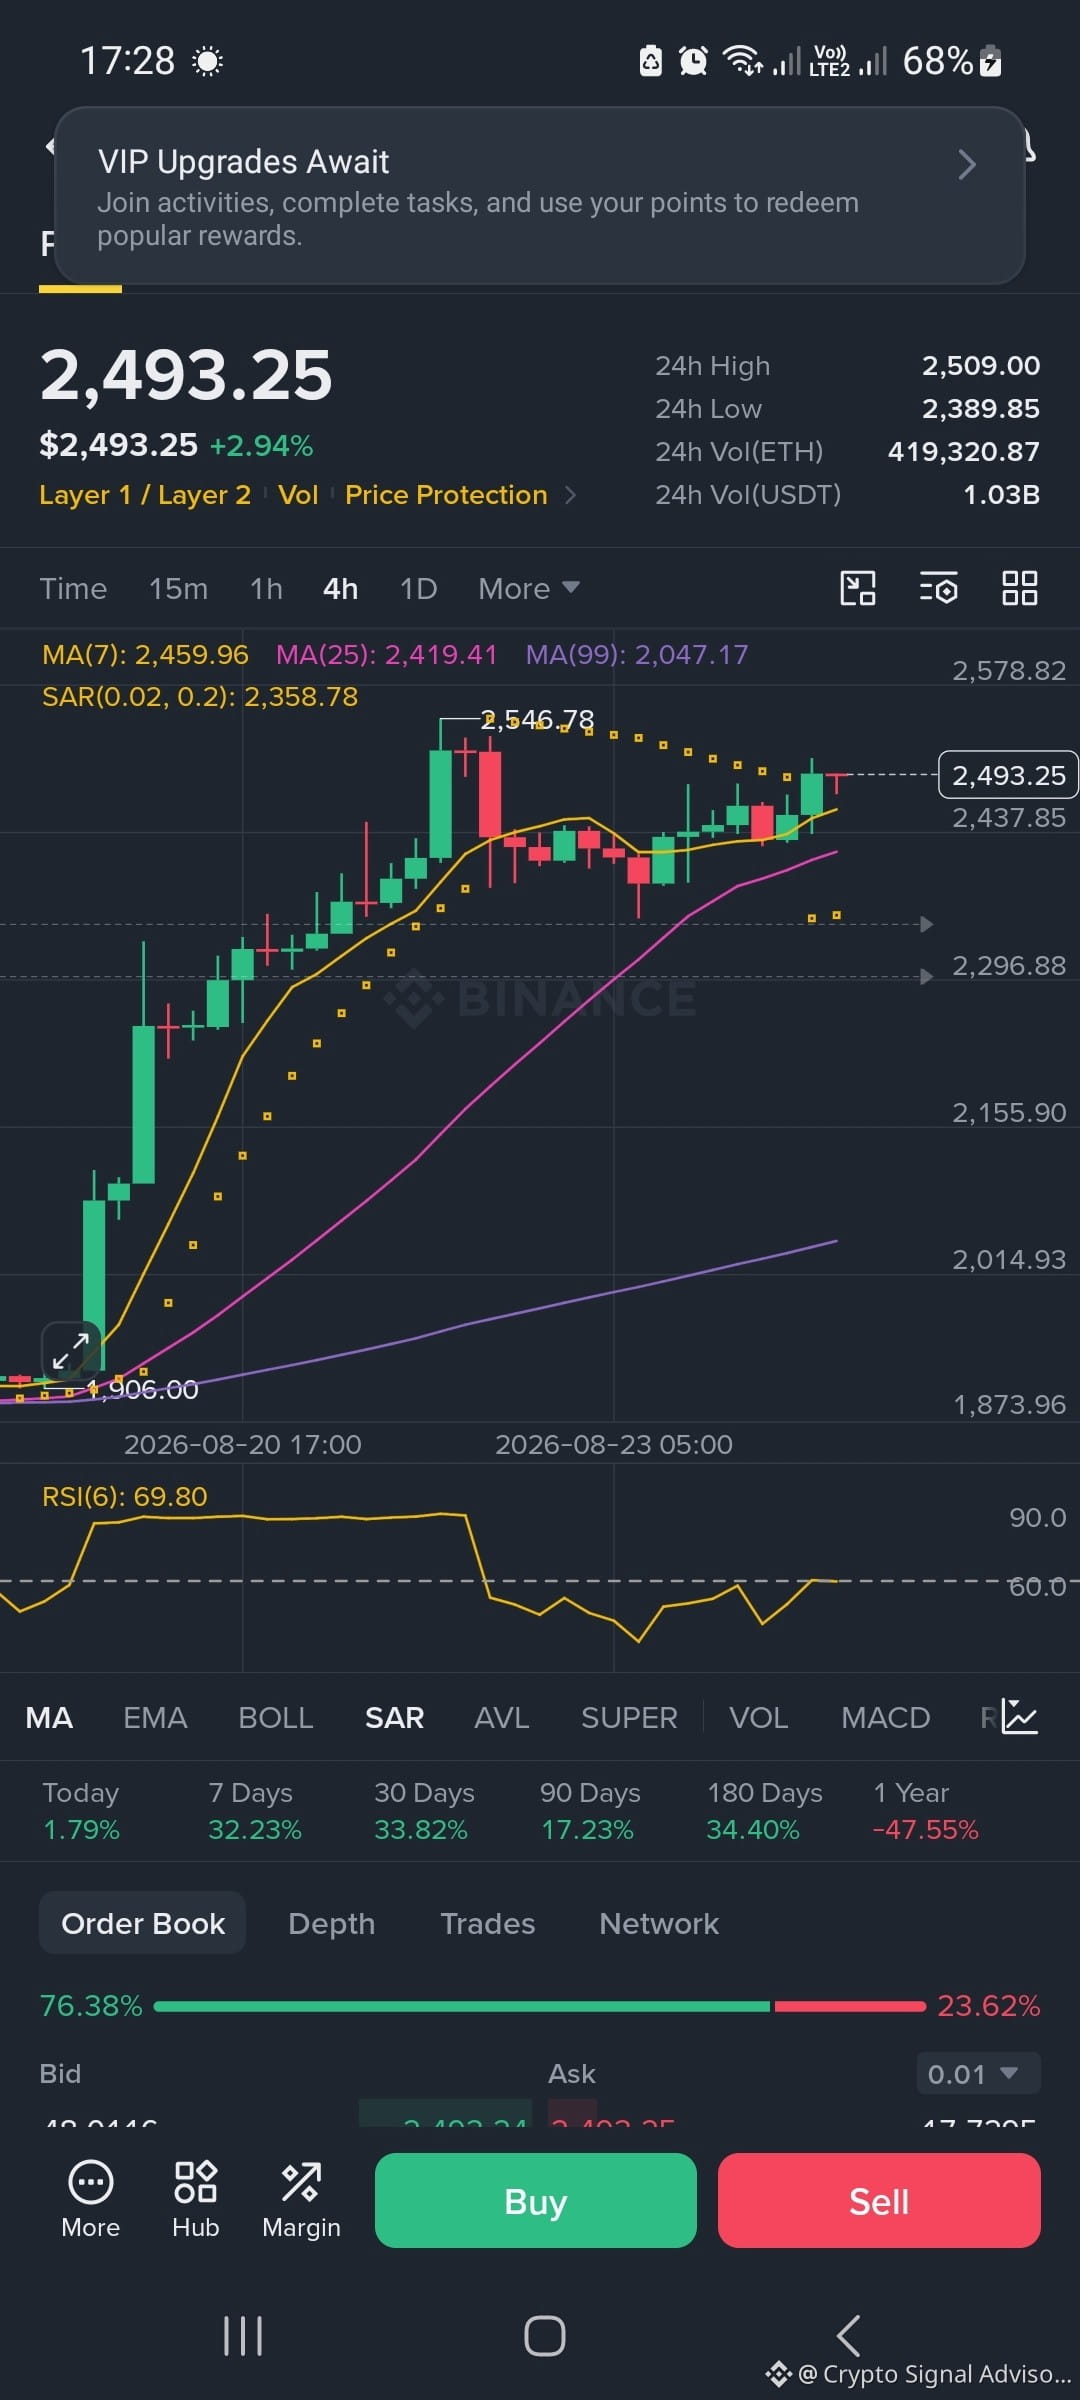
Eth 1st goes up as btc touches 79k, and then going down very fast, best entry zone for eth will be,
entry zone for short trade 2500-2550, as high as possible...
and then 1st t.p will be 2490
2nd will be 2450, if price further drops down then
3rd will be at 2420
4rth will be 2380,
and then price may goes up again and touches 2420-2450 and drops down again really hard 2350,
2320, 2300, 2250 and last will be 2220, eth may touches again 2000 dollars because of very low inflow and out flow for 24h is very large, many traders stay away from market when we have fomc news on 28th August, before this no one want to invest in market but still eth playing with mind and liquidate over 2.4B dollars in just 24 hours.
Frustrated traders going for trade again and this time they open long trade to cover their losses but now market going to kill them and liquidate over 5B historical liquidations if market drops down and touches 70k, here lot of stop losses on 69k-70k, as per my opinion market stuck at 72k-74k and forced them to drops down their stop loss more down.
So market playing with our minds, this is called algorithm. No onw know about this market algorithm even big and many traders so we just predicted market not draw their own.
So beready and becarefull...
Thankyou
$ETH
Eth 1st goes up as btc touches 79k, and then going down very fast, best entry zone for eth will be,
entry zone for short trade 2500-2550, as high as possible...
and then 1st t.p will be 2490
2nd will be 2450, if price further drops down then
3rd will be at 2420
4rth will be 2380,
and then price may goes up again and touches 2420-2450 and drops down again really hard 2350,
2320, 2300, 2250 and last will be 2220, eth may touches again 2000 dollars because of very low inflow and out flow for 24h is very large, many traders stay away from market when we have fomc news on 28th August, before this no one want to invest in market but still eth playing with mind and liquidate over 2.4B dollars in just 24 hours.
Frustrated traders going for trade again and this time they open long trade to cover their losses but now market going to kill them and liquidate over 5B historical liquidations if market drops down and touches 70k, here lot of stop losses on 69k-70k, as per my opinion market stuck at 72k-74k and forced them to drops down their stop loss more down.
So market playing with our minds, this is called algorithm. No onw know about this market algorithm even big and many traders so we just predicted market not draw their own.
So beready and becarefull...
Thankyou
$ETH
Ethereumand Bitcoin price Analysis!!!
Today lot of retail and wholesale traders going for long, many traders think that eth done correction already, 2540 to big dump at near 2380, which is almost 150 dollars pruce dump and btc also their correction already but this is not a correction style.
At weekend when many traders take their profit and market voulme down here then this thing has happened and this happed many times and this is not a correction. Still btc and eth need for more correction.
As per my opinion now today lots of traders open long trade and their t.p will be near at 83k-85k which is not a solid trade when we are wtill waiting for Jackson hole speech.
CPI is good, ppi is good, unemployment rate is good, oil prices never damage inflation, so how could we say Fed still going with same rates, they need to cut their rates or hike rates, 70% hike and 30% cut, because at the end result they need to adress that they want no cut untill Jan 2027. Solid reason.
So ready for some big dump again. over 2.4 b liquidations already they do, and they need more liquidations which is now over 3b dollars if btc dips and drops below 70k. So see what's next!!!
Thankyou
Today lot of retail and wholesale traders going for long, many traders think that eth done correction already, 2540 to big dump at near 2380, which is almost 150 dollars pruce dump and btc also their correction already but this is not a correction style.
At weekend when many traders take their profit and market voulme down here then this thing has happened and this happed many times and this is not a correction. Still btc and eth need for more correction.
As per my opinion now today lots of traders open long trade and their t.p will be near at 83k-85k which is not a solid trade when we are wtill waiting for Jackson hole speech.
CPI is good, ppi is good, unemployment rate is good, oil prices never damage inflation, so how could we say Fed still going with same rates, they need to cut their rates or hike rates, 70% hike and 30% cut, because at the end result they need to adress that they want no cut untill Jan 2027. Solid reason.
So ready for some big dump again. over 2.4 b liquidations already they do, and they need more liquidations which is now over 3b dollars if btc dips and drops below 70k. So see what's next!!!
Thankyou
Market Snapshot: Dollar Down, Gold & Oil Up!!!
The US Dollar is weak near 98.84, pressured by US Treasury bond buybacks and joint intervention with Japan. This weakness is pushing Gold above $4,600/oz and Silver near 70/oz, as investors lose faith in the dollar amid soaring US debt.
Oil prices are climbing again (Brent 94, WTI 87) because of new US sanctions on Iran coming Monday (Aug 24). Iran’s tough stance on the Hormuz Strait keeps supply risks alive.
For interest rates, the Fed is unlikely to cut in September. The real focus is Chair Warsh’s speech at Jackson Hole this Thursday (Aug 28). If he sounds dovish (soft), the dollar will fall further and gold may hit 4,700. If he sounds hawkish (strict), the dollar could bounce back to 100.
Geopolitics remains the wildcard. Some tankers passed Hormuz recently, but Monday’s Iran sanctions announcement could swing oil sharply. Watch Monday’s Iran news and Thursday’s Fed speech—they will decide if gold breaks higher or the dollar recovers.
Thankyou
#MarketMeltdown #BTC #GOLD #Silver #oil
The US Dollar is weak near 98.84, pressured by US Treasury bond buybacks and joint intervention with Japan. This weakness is pushing Gold above $4,600/oz and Silver near 70/oz, as investors lose faith in the dollar amid soaring US debt.
Oil prices are climbing again (Brent 94, WTI 87) because of new US sanctions on Iran coming Monday (Aug 24). Iran’s tough stance on the Hormuz Strait keeps supply risks alive.
For interest rates, the Fed is unlikely to cut in September. The real focus is Chair Warsh’s speech at Jackson Hole this Thursday (Aug 28). If he sounds dovish (soft), the dollar will fall further and gold may hit 4,700. If he sounds hawkish (strict), the dollar could bounce back to 100.
Geopolitics remains the wildcard. Some tankers passed Hormuz recently, but Monday’s Iran sanctions announcement could swing oil sharply. Watch Monday’s Iran news and Thursday’s Fed speech—they will decide if gold breaks higher or the dollar recovers.
Thankyou
#MarketMeltdown #BTC #GOLD #Silver #oil
Trump Coin Amazing Analysis!!!
After trump meeting with many crypto holders and authorities, almost all coins pump very hard, but yet we are waiting for trump coin pump which is not related with market.
Trump meet himself with crypto authorities and keep stockpile alive an continue, so a person who meet with crypto authorities and bitcoin take massive pump which is above 25%, then why his own coin just reach on 2.5 dollars.
Now buy trump coins and waiting for it untill and unless it hit on above 20 dollars, it gives you 1000% increase in your profit margin.
Thanks me later first buy trump coin and now waiting for 20 dollars pump
Thankyou
#TrumpCryptoSupport $TRUMP
After trump meeting with many crypto holders and authorities, almost all coins pump very hard, but yet we are waiting for trump coin pump which is not related with market.
Trump meet himself with crypto authorities and keep stockpile alive an continue, so a person who meet with crypto authorities and bitcoin take massive pump which is above 25%, then why his own coin just reach on 2.5 dollars.
Now buy trump coins and waiting for it untill and unless it hit on above 20 dollars, it gives you 1000% increase in your profit margin.
Thanks me later first buy trump coin and now waiting for 20 dollars pump
Thankyou
#TrumpCryptoSupport $TRUMP
Cow coin Price Analysis for Spot!!!
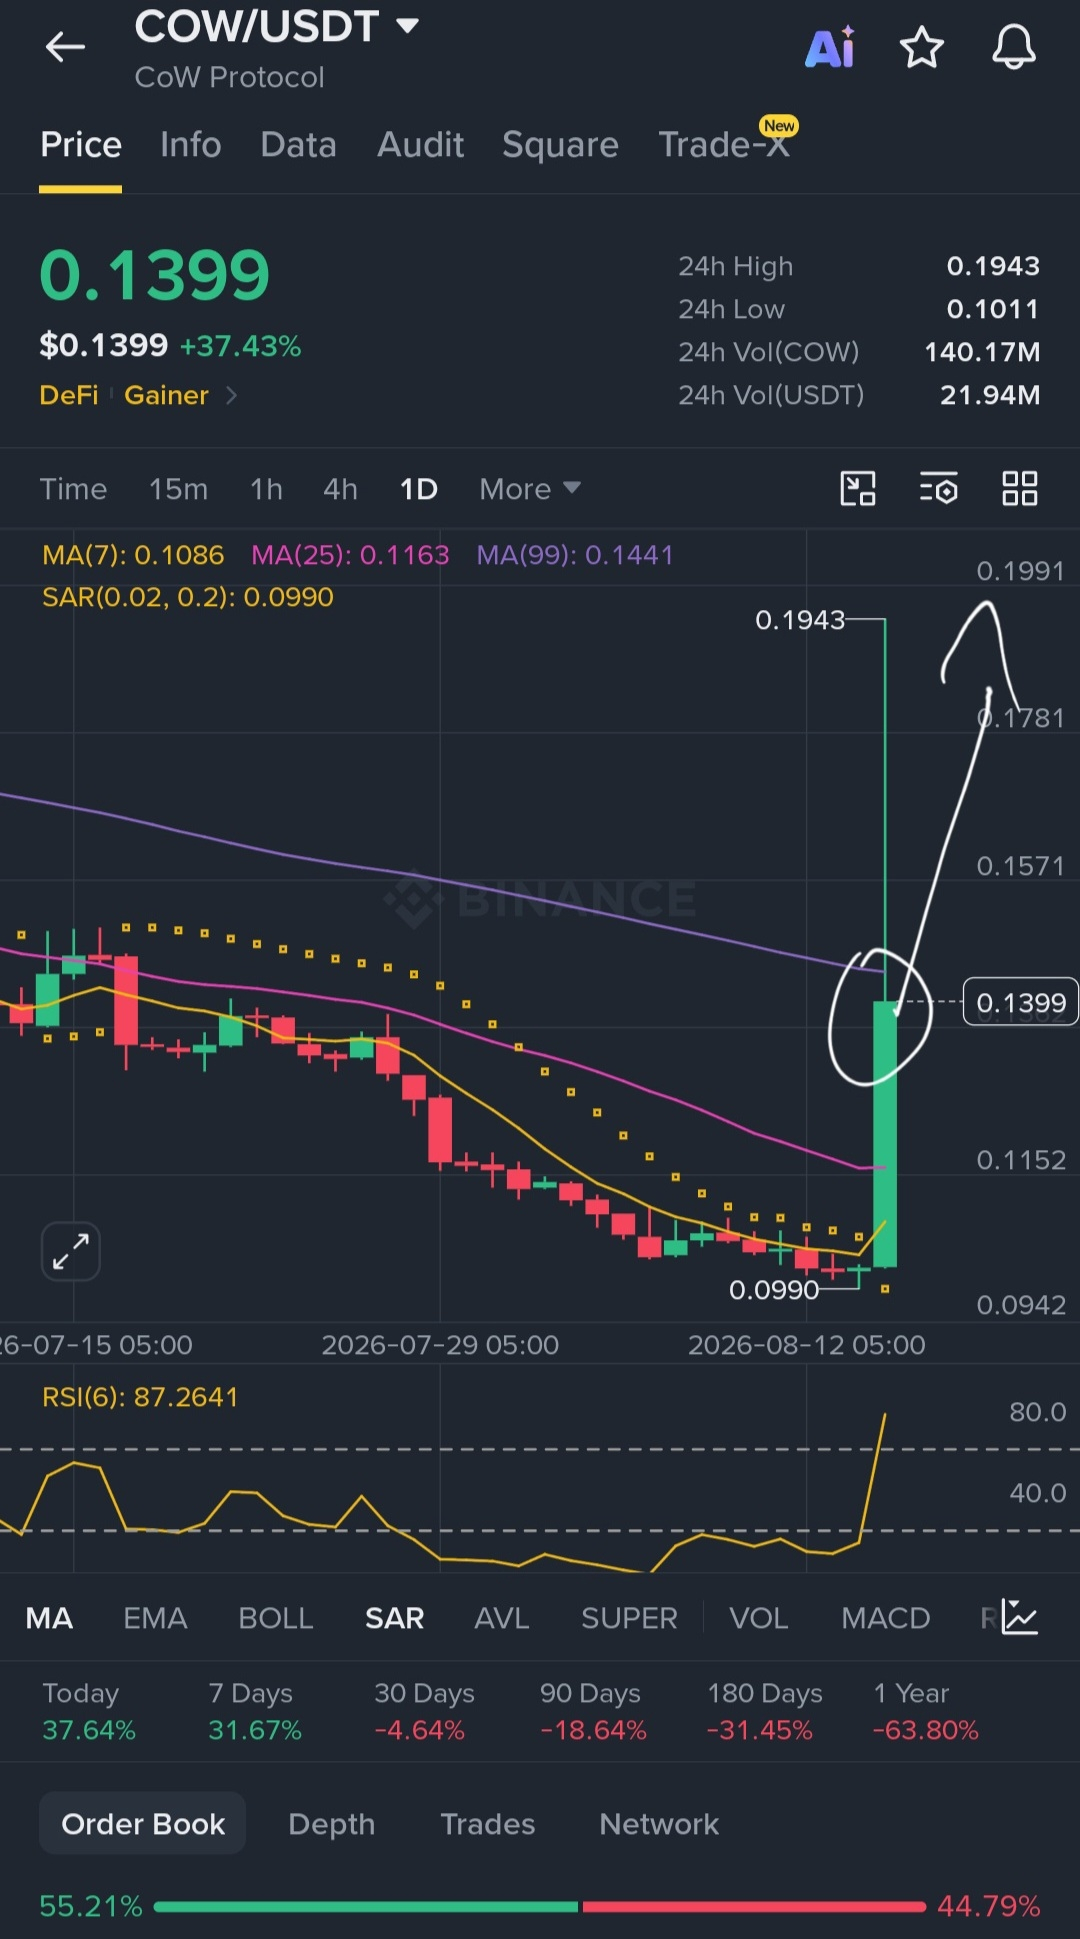
Cow coin is now at 0.13, it break support which is massive 0.1, cow price touches 0.17-0.19 many times but this time on weekend there is a big whale movement, whale take profit about 23M and now more whales invested in this coin which is over 50M in just 24 hours, so let's join the whales party and waiting for cow move on 0.2-0.3, and also maybe it touches 1 dollar.
This is just spot trade for spot traders it gives you extreme profit which is more then 300%, and this is normal for whales but many peoples going for short when funding rate is extremely negative -0.2, so let's see how it touches 0.3 easy target, maximum target will be 0.7-0.9 or maybe 1 dollars. so let's start trading.
After successful trade congrats for those who make above 100%.
Thankyou
#COWRises55.77%In24h $COW
Cow coin is now at 0.13, it break support which is massive 0.1, cow price touches 0.17-0.19 many times but this time on weekend there is a big whale movement, whale take profit about 23M and now more whales invested in this coin which is over 50M in just 24 hours, so let's join the whales party and waiting for cow move on 0.2-0.3, and also maybe it touches 1 dollar.
This is just spot trade for spot traders it gives you extreme profit which is more then 300%, and this is normal for whales but many peoples going for short when funding rate is extremely negative -0.2, so let's see how it touches 0.3 easy target, maximum target will be 0.7-0.9 or maybe 1 dollars. so let's start trading.
After successful trade congrats for those who make above 100%.
Thankyou
#COWRises55.77%In24h $COW
#dusk $DUSK @Dusk
DUST Price Analysis – August 14, 2026
DUST is currently trading around $0.0049 – $0.0050, with a 24-hour range of $0.004852 to $0.00536. The market cap sits at roughly $93K – $100K, ranking around 2900–3000. Circulating supply is 19.14M DUST out of a total max supply of 33.29M. However, 24-hour trading volume is extremely low – often 0 or just a few dollars – signaling very poor liquidity. This means even small trades can cause big price swings.
Historical Performance & Key Levels
DUST hit its all-time high of 6.20 on April 11, 2022 – that's a staggering 99.9% drop from the peak. The all-time low was recorded just recently on July 26, 2026 at 0.005252. So the token is basically hovering near its absolute bottom. It briefly touched 0.00558 in June 2026, but couldn't hold. The price has been in a consistent downtrend for over 4 years, with no real recovery in sight.
Technical Indicators & Risk Warning
Daily technicals are heavily bearish: 16 sell signals vs just 4 buys. Moving averages show 13 sells, 1 buy. RSI is near 23 – oversold, but oversold can stay oversold for a long time. MACD and ROC both show negative momentum.
Bottom line: DUST is a utility token for the Midnight/Cardano privacy ecosystem – not a trading coin. With near-zero volume and a 99.9% drop from ATH, this is extremely high risk. Only consider if you deeply understand the project's fundamentals. Not financial advice. DYOR! 👇
DUST Price Analysis – August 14, 2026
DUST is currently trading around $0.0049 – $0.0050, with a 24-hour range of $0.004852 to $0.00536. The market cap sits at roughly $93K – $100K, ranking around 2900–3000. Circulating supply is 19.14M DUST out of a total max supply of 33.29M. However, 24-hour trading volume is extremely low – often 0 or just a few dollars – signaling very poor liquidity. This means even small trades can cause big price swings.
Historical Performance & Key Levels
DUST hit its all-time high of 6.20 on April 11, 2022 – that's a staggering 99.9% drop from the peak. The all-time low was recorded just recently on July 26, 2026 at 0.005252. So the token is basically hovering near its absolute bottom. It briefly touched 0.00558 in June 2026, but couldn't hold. The price has been in a consistent downtrend for over 4 years, with no real recovery in sight.
Technical Indicators & Risk Warning
Daily technicals are heavily bearish: 16 sell signals vs just 4 buys. Moving averages show 13 sells, 1 buy. RSI is near 23 – oversold, but oversold can stay oversold for a long time. MACD and ROC both show negative momentum.
Bottom line: DUST is a utility token for the Midnight/Cardano privacy ecosystem – not a trading coin. With near-zero volume and a 99.9% drop from ATH, this is extremely high risk. Only consider if you deeply understand the project's fundamentals. Not financial advice. DYOR! 👇
🚀 BNB is Pumping! 📢
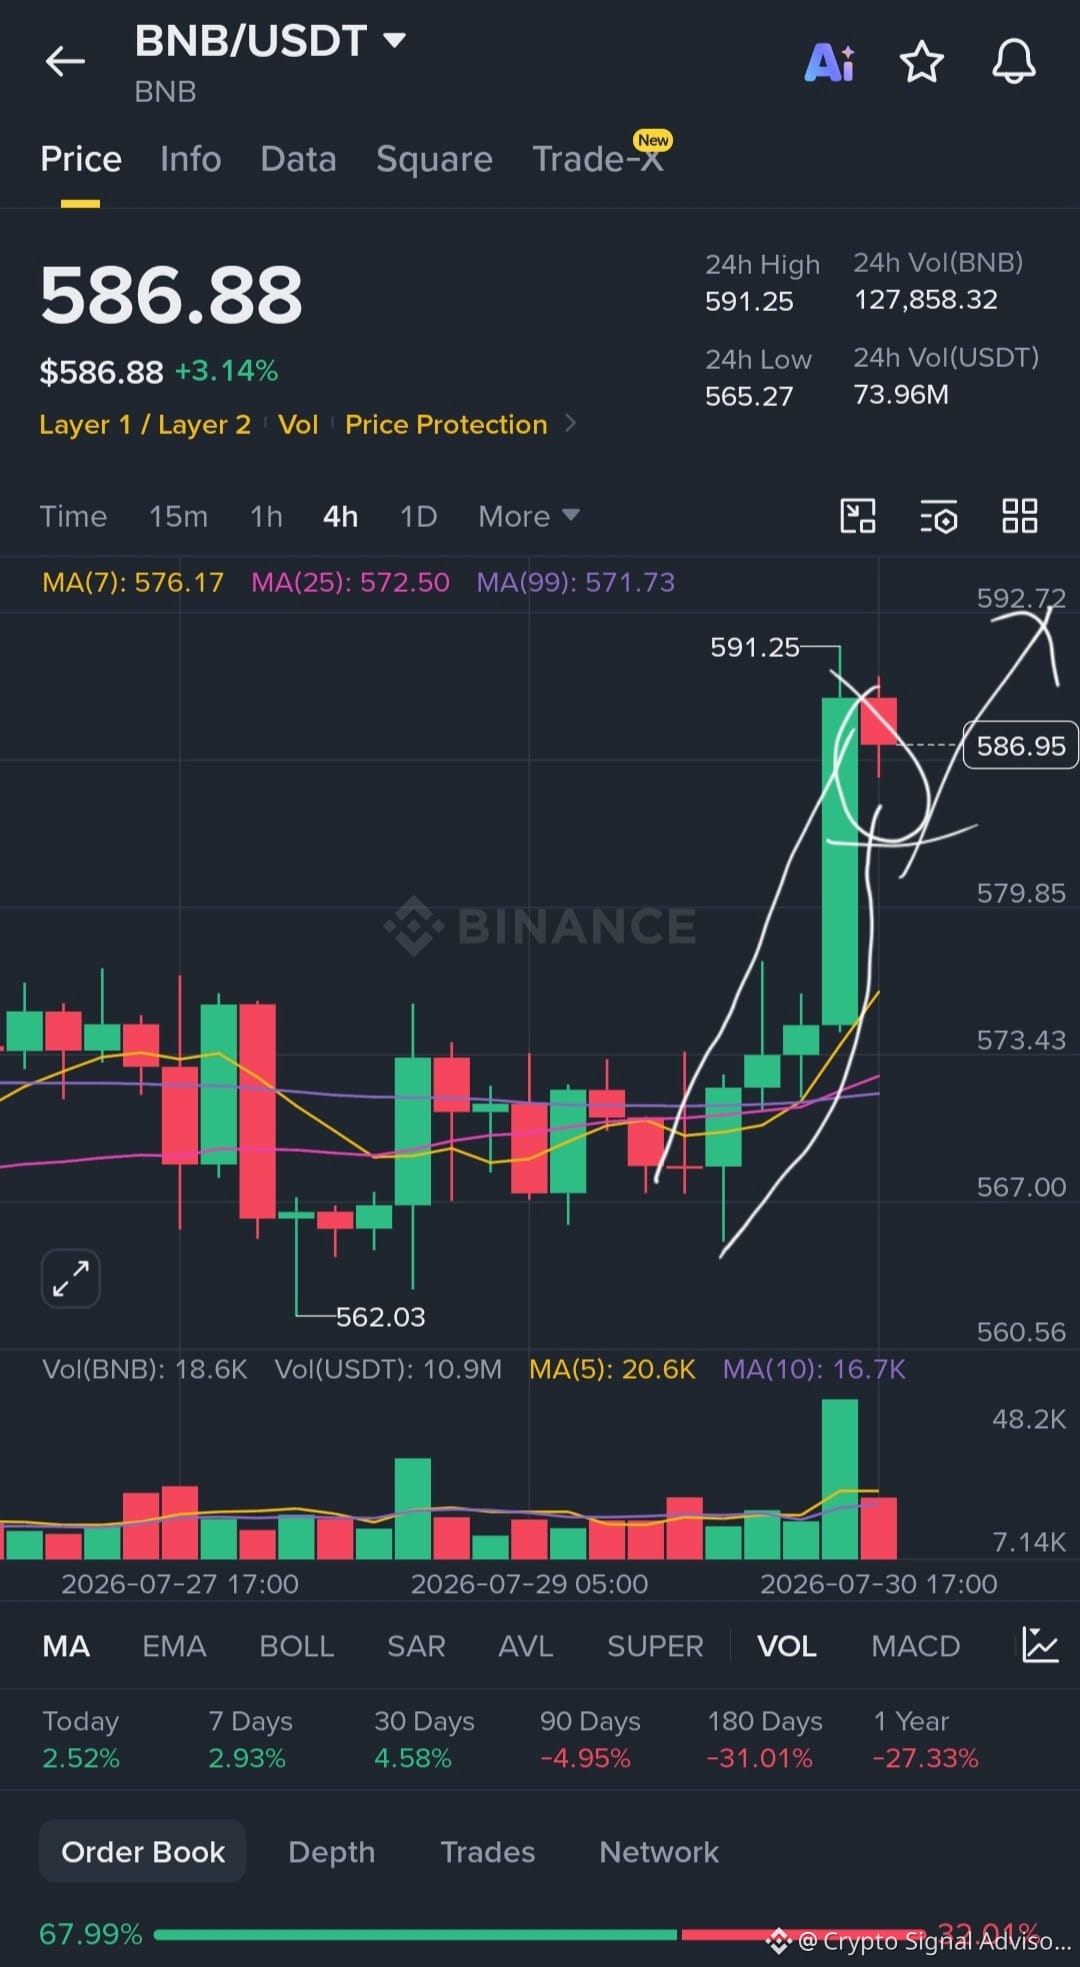
BNB is standing strong at 588 right now! While Bitcoin jumped to 65k, most other altcoins are still falling down. So why is BNB different? The biggest reason is Franklin Templeton, a giant 1.5 Trillion US company. They just moved their1.5 BILLION assets to the BNB Chain. This is huge institutional trust that no other coin got this week.
Secondly, Binance just burned 931 Million worth of BNB tokens a few days ago. This makes the total supply lower, which naturally pushes the price up. At the same time, BNB Chain's DEX trading volume hit a massive 19 Billion, beating even Ethereum and Solana! For Pakistani and Indian traders, the low fees and super-fast speed are a big attraction right now.
Finally, the Binance Launchpad broke records with 10.18 Million BNB staked for new tokens, taking a lot of BNB out of circulation. With new AI tools and privacy features launching, BNB has its own strong game. While global issues like Fed rates and wars are pulling Bitcoin down, BNB's own ecosystem is fighting back. The next big test is 595–605—if it breaks, we can easily see 650! Stay safe, desi traders! 💪
Thankyou
#FOMCWatching #BNBbull $BNB
BNB is standing strong at 588 right now! While Bitcoin jumped to 65k, most other altcoins are still falling down. So why is BNB different? The biggest reason is Franklin Templeton, a giant 1.5 Trillion US company. They just moved their1.5 BILLION assets to the BNB Chain. This is huge institutional trust that no other coin got this week.
Secondly, Binance just burned 931 Million worth of BNB tokens a few days ago. This makes the total supply lower, which naturally pushes the price up. At the same time, BNB Chain's DEX trading volume hit a massive 19 Billion, beating even Ethereum and Solana! For Pakistani and Indian traders, the low fees and super-fast speed are a big attraction right now.
Finally, the Binance Launchpad broke records with 10.18 Million BNB staked for new tokens, taking a lot of BNB out of circulation. With new AI tools and privacy features launching, BNB has its own strong game. While global issues like Fed rates and wars are pulling Bitcoin down, BNB's own ecosystem is fighting back. The next big test is 595–605—if it breaks, we can easily see 650! Stay safe, desi traders! 💪
Thankyou
#FOMCWatching #BNBbull $BNB
FED Effect on Overall market!!!
The FOMC is the group of people who decide U.S. interest rates. They meet about 8 times a year. After each meeting, they announce if rates will go up, down, or stay the same. The "minutes" are the detailed notes released later. The strongest point from their meetings is their tone on inflation. If they sound "hawkish" (worried about high prices), they will raise rates or keep them high. If they sound "dovish" (worried about a weak economy), they will cut rates or pause. Their main tool is changing the cost of borrowing money.
Crypto like Bitcoin likes cheap money and risk-taking. When the FOMC cuts rates or sounds dovish, money becomes cheaper to borrow. This often pushes crypto prices up because investors look for higher returns. But when the FOMC raises rates or sounds hawkish, money gets expensive. Investors then sell risky assets like crypto and move to safer places. So, a "dovish" meeting is good for crypto, and a "hawkish" meeting is bad for crypto.
The stock market also loves low interest rates. When the FOMC cuts rates, companies can borrow cheaply to grow, and their future profits look more valuable. Stock prices usually go up. When the FOMC raises rates, company borrowing costs rise, and future profits look less attractive. Stock prices often fall. However, if the Fed cuts rates because the economy is crashing, stocks might still fall due to fear. The best result for stocks is a "dovish" cut that fights a mild slowdown, not a deep crisis.
Gold and the U.S. dollar usually move opposite to each other. When the FOMC raises rates, the dollar becomes stronger because investors get better returns on dollar savings. A strong dollar makes gold more expensive for other countries, so gold prices usually fall. When the FOMC cuts rates, the dollar becomes weaker. A weak dollar makes gold cheaper for foreign buyers, so gold prices usually rise. In short: hawkish Fed = strong dollar + weak gold. Dovish Fed = weak dollar + strong gold.
#Fed #BTC $BTC
$XAU
The FOMC is the group of people who decide U.S. interest rates. They meet about 8 times a year. After each meeting, they announce if rates will go up, down, or stay the same. The "minutes" are the detailed notes released later. The strongest point from their meetings is their tone on inflation. If they sound "hawkish" (worried about high prices), they will raise rates or keep them high. If they sound "dovish" (worried about a weak economy), they will cut rates or pause. Their main tool is changing the cost of borrowing money.
Crypto like Bitcoin likes cheap money and risk-taking. When the FOMC cuts rates or sounds dovish, money becomes cheaper to borrow. This often pushes crypto prices up because investors look for higher returns. But when the FOMC raises rates or sounds hawkish, money gets expensive. Investors then sell risky assets like crypto and move to safer places. So, a "dovish" meeting is good for crypto, and a "hawkish" meeting is bad for crypto.
The stock market also loves low interest rates. When the FOMC cuts rates, companies can borrow cheaply to grow, and their future profits look more valuable. Stock prices usually go up. When the FOMC raises rates, company borrowing costs rise, and future profits look less attractive. Stock prices often fall. However, if the Fed cuts rates because the economy is crashing, stocks might still fall due to fear. The best result for stocks is a "dovish" cut that fights a mild slowdown, not a deep crisis.
Gold and the U.S. dollar usually move opposite to each other. When the FOMC raises rates, the dollar becomes stronger because investors get better returns on dollar savings. A strong dollar makes gold more expensive for other countries, so gold prices usually fall. When the FOMC cuts rates, the dollar becomes weaker. A weak dollar makes gold cheaper for foreign buyers, so gold prices usually rise. In short: hawkish Fed = strong dollar + weak gold. Dovish Fed = weak dollar + strong gold.
#Fed #BTC $BTC
$XAU
Velvet price Alert!!!
Those who never close short trade on velvet, they ready for see valvet once again above 1-2 dollars. 1st it goes downward side and then go upward side. too many liquidation at 1.4 1.5 so set your positions according.
Still velvet have enough voulme for touches again 1-2 dollars. so wait and watch what they do.
Thankyou
#VELVETUSST
Those who never close short trade on velvet, they ready for see valvet once again above 1-2 dollars. 1st it goes downward side and then go upward side. too many liquidation at 1.4 1.5 so set your positions according.
Still velvet have enough voulme for touches again 1-2 dollars. so wait and watch what they do.
Thankyou
#VELVETUSST
Расталды
Bitcoin Holds Steady as Core Inflation Cools Slightly!!!!
The May inflation report brought a small relief for markets. While overall consumer prices rose 4.2 percent from last year as expected, the core inflation reading came in at 0.2 percent month-on-month, lower than the forecast of 0.3 percent. This suggests that underlying price pressures are not getting worse, even though energy costs remain high.
For the Federal Reserve, this data keeps things complicated but avoids panic. The job market is still strong, with unemployment at 4.3 percent and 172,000 new jobs added in May. As a result, the Fed is expected to hold interest rates steady at its June meeting. However, major banks like Goldman Sachs now say the first rate cut may not come until 2027. Some analysts even see a small chance of another hike if inflation stays high.
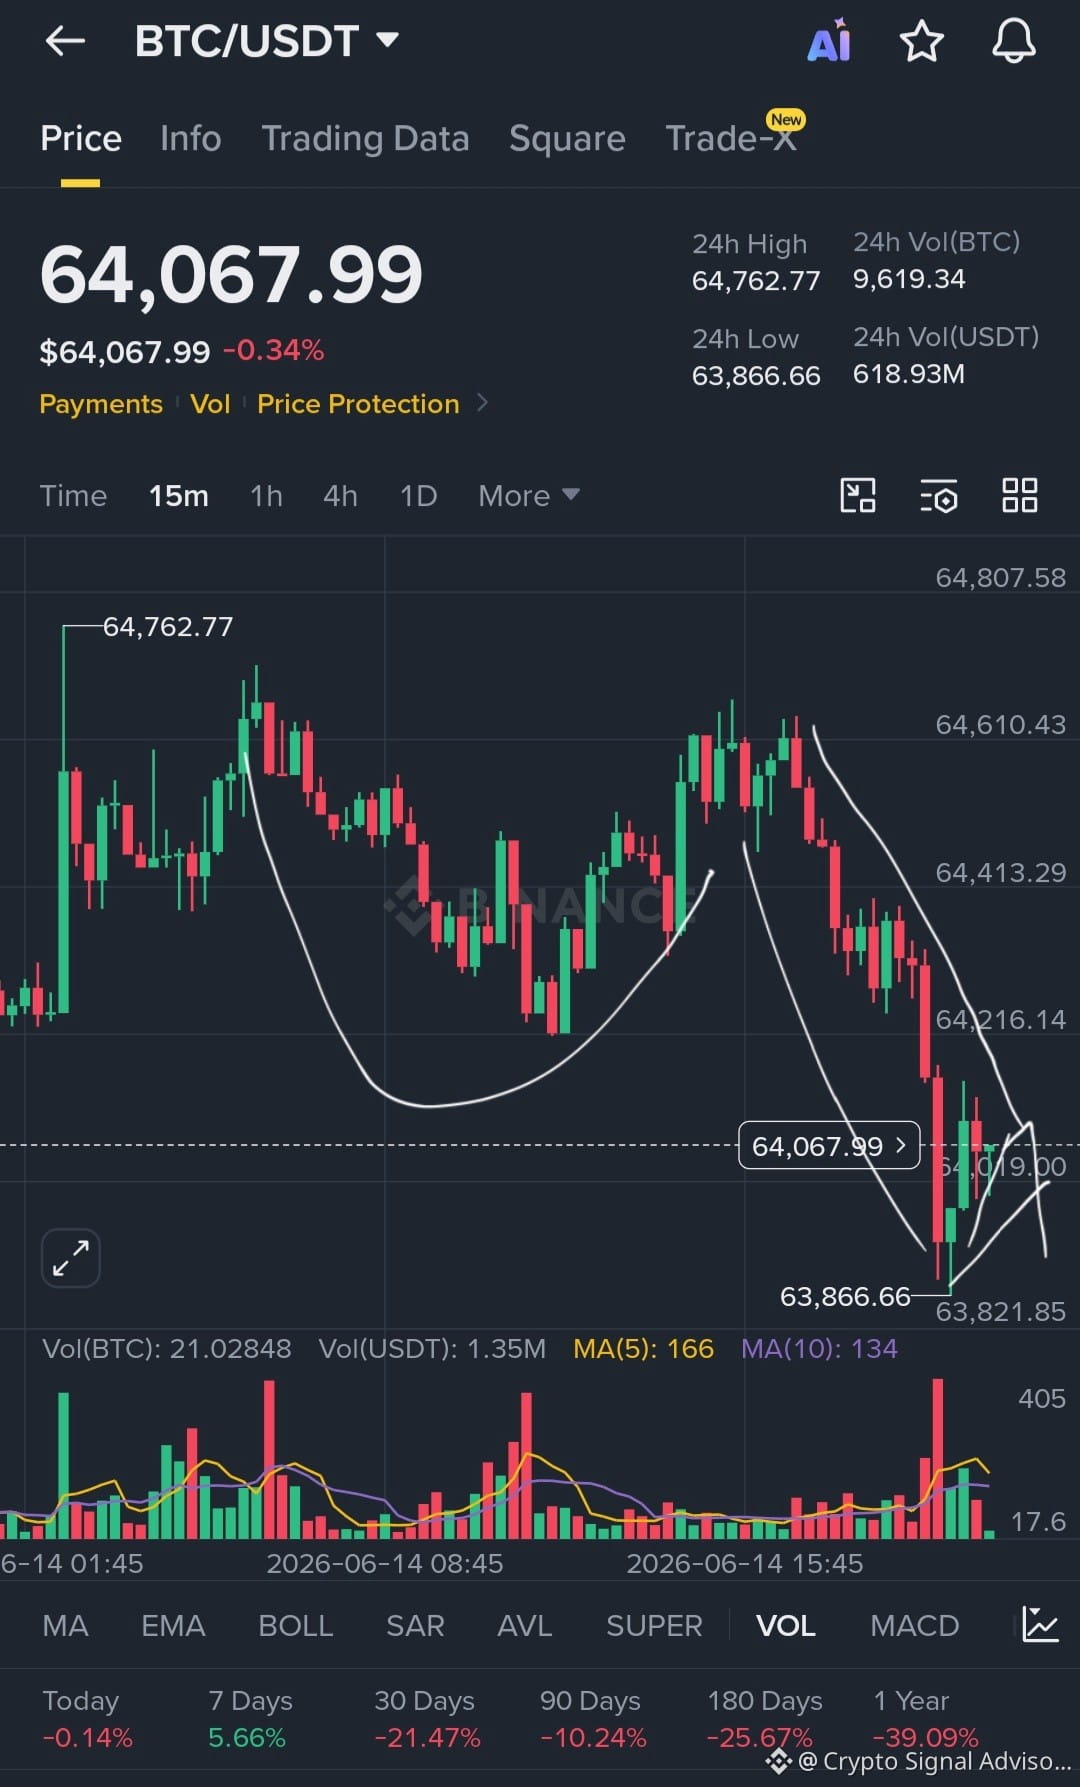
Bitcoin is trading near 61,500, down from last week's highs but holding above the critical 60,000 level. The cooler core CPI reading has removed the immediate risk of a sharp drop. Still, with no easy money coming from the Fed, a big rally is unlikely. Expect Bitcoin to trade in a narrow range between 61,000 and 64,000 until the Fed's next statement on June 17.
#USCPISurgesToThreeYearHighOf4.2% #MayCoreCPISofterThanForecastTreasuriesRise $BTC
The May inflation report brought a small relief for markets. While overall consumer prices rose 4.2 percent from last year as expected, the core inflation reading came in at 0.2 percent month-on-month, lower than the forecast of 0.3 percent. This suggests that underlying price pressures are not getting worse, even though energy costs remain high.
For the Federal Reserve, this data keeps things complicated but avoids panic. The job market is still strong, with unemployment at 4.3 percent and 172,000 new jobs added in May. As a result, the Fed is expected to hold interest rates steady at its June meeting. However, major banks like Goldman Sachs now say the first rate cut may not come until 2027. Some analysts even see a small chance of another hike if inflation stays high.
Bitcoin is trading near 61,500, down from last week's highs but holding above the critical 60,000 level. The cooler core CPI reading has removed the immediate risk of a sharp drop. Still, with no easy money coming from the Fed, a big rally is unlikely. Expect Bitcoin to trade in a narrow range between 61,000 and 64,000 until the Fed's next statement on June 17.
#USCPISurgesToThreeYearHighOf4.2% #MayCoreCPISofterThanForecastTreasuriesRise $BTC
Eth Price Analysis!!!
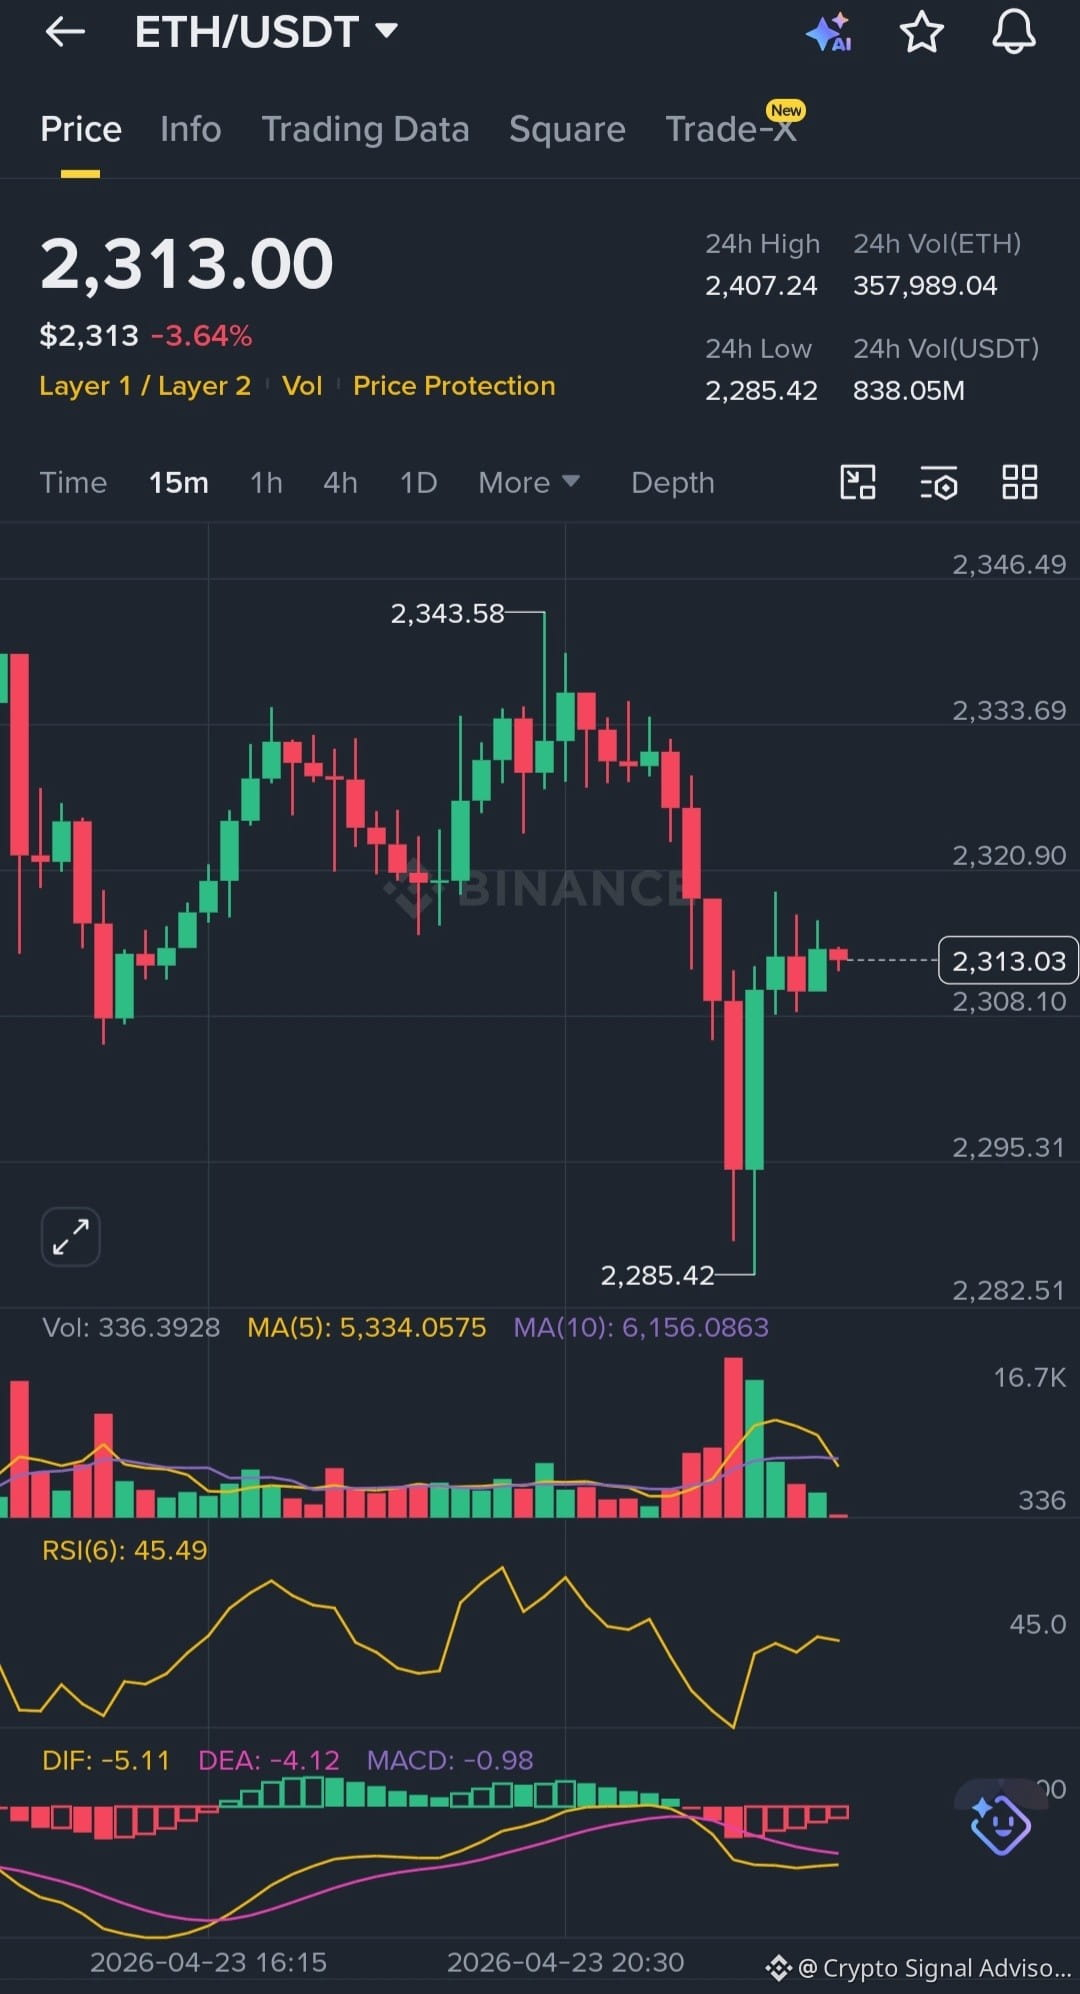
Ethereum is currently trading between 2280 and 2330 after facing a strong rejection near the 2340-2350 level. The short-term trend looks weak, and buyers are losing strength. To become positive again, the price must quickly move above 2420. If it fails, the main support levels are 2300, then 2285, and the important 2250 mark. A fall below 2320 can push the price down to 2200.
On the upside, the first resistance is at 2340, with a big hurdle in the 2380 to 2420 zone. A clear breakout above this zone could open the path toward 2450, 2500, and even 2550. Traders should keep a close eye on these levels for any strong move.
In recent news, a crypto firm named Bitmine purchased 100,000 Ethereum, showing big-player confidence. Also, Ethereum staking has hit a record 32.33 percent, locking over 39 million Ethereum and reducing the freely available supply. Meanwhile, large whale investors are holding heavy short positions while small traders stay steady, creating a tense battle near the 2330 level. Additionally, a large sell wall near 2332 is keeping the price from rising in the spot market.
Thankyou and Thanks for you precious time
#MarketRebound #ETH $ETH
Ethereum is currently trading between 2280 and 2330 after facing a strong rejection near the 2340-2350 level. The short-term trend looks weak, and buyers are losing strength. To become positive again, the price must quickly move above 2420. If it fails, the main support levels are 2300, then 2285, and the important 2250 mark. A fall below 2320 can push the price down to 2200.
On the upside, the first resistance is at 2340, with a big hurdle in the 2380 to 2420 zone. A clear breakout above this zone could open the path toward 2450, 2500, and even 2550. Traders should keep a close eye on these levels for any strong move.
In recent news, a crypto firm named Bitmine purchased 100,000 Ethereum, showing big-player confidence. Also, Ethereum staking has hit a record 32.33 percent, locking over 39 million Ethereum and reducing the freely available supply. Meanwhile, large whale investors are holding heavy short positions while small traders stay steady, creating a tense battle near the 2330 level. Additionally, a large sell wall near 2332 is keeping the price from rising in the spot market.
Thankyou and Thanks for you precious time
#MarketRebound #ETH $ETH
ETHEREUM Signals!!!!
If btc never break 80k zone then it will down very fast. After 3 4 attempts eth reverse back and mever break 2430-2450... if eth break this then it could reach 2520 easily so take your positions accordingly.
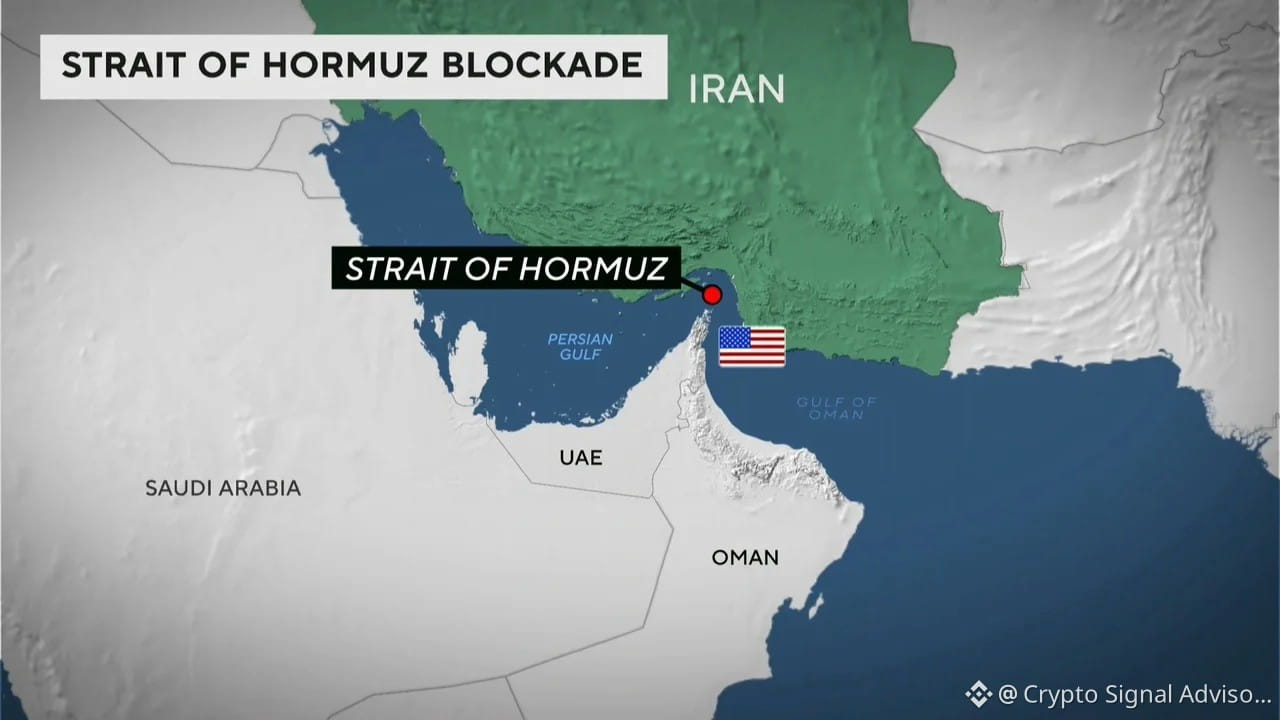
World is in war zone, every country faces economic downfall except U.S, Iran and Russia, China depends on 50% of their oil from strait of Hormuz, now U.S hold on this, and Iran also hold on this zone. China, Japan, Indiq, and all middle east and 30% of Europe oil companies depends on Gulf countries.
Now Iran warn U.S that if they don't open their route then they should heavy bombing and throw mussiles on gulf countries, this war is very dangrous for middle east and asia.
U.S need to stop iran otherwise lot of crices faced all over the world economy, specially Pakistan.
So now if war begin happening again then dollar is the safest haven asset on the global side, so crypto is down if war starts again.
So see newses and prepare your self for every condition.
Thankyou
#MarketRebound $ETH
If btc never break 80k zone then it will down very fast. After 3 4 attempts eth reverse back and mever break 2430-2450... if eth break this then it could reach 2520 easily so take your positions accordingly.
World is in war zone, every country faces economic downfall except U.S, Iran and Russia, China depends on 50% of their oil from strait of Hormuz, now U.S hold on this, and Iran also hold on this zone. China, Japan, Indiq, and all middle east and 30% of Europe oil companies depends on Gulf countries.
Now Iran warn U.S that if they don't open their route then they should heavy bombing and throw mussiles on gulf countries, this war is very dangrous for middle east and asia.
U.S need to stop iran otherwise lot of crices faced all over the world economy, specially Pakistan.
So now if war begin happening again then dollar is the safest haven asset on the global side, so crypto is down if war starts again.
So see newses and prepare your self for every condition.
Thankyou
#MarketRebound $ETH

U.S Iran War Ultimatum and crypto Analysis!!!
Now dead is near to close, after closing this deadline trump starts war against Iran and U.S is more powerfull then iran so big possibility is that U.S power is stonger then Iran.
So, dollar prices is ready to up now, gold prices near for big downfall almost hitting 4000-4200, if negotiation starts again early morning then gold is stop here and waiting for both side response.
Eth prices is going down already, market has strong fear index because of war Ultimatum, if war begins to start again then bitcoin and eth both down, peoples invest in dollar now as compared to crypto and gold.
Dollar is the safe haven asset now, biggest opportunity is that open short or waiting for see that bitcoin again touches 70k again.
So bearish signals is more powerfull then bullish signals,
Eth 1st target 2300
2nd 2250
3rd 2200
4rth 2150
5th 2100
Gold targets
1st 4650
2nd 4600
3rd will be 4550
4rth will be 4500
5th will be 4450
Take your own responsibility for trade my signals accuracy will be 100% till now...
Thankyou
#ETH #XAUUSD #signaladvisor $ETH $XAU
Now dead is near to close, after closing this deadline trump starts war against Iran and U.S is more powerfull then iran so big possibility is that U.S power is stonger then Iran.
So, dollar prices is ready to up now, gold prices near for big downfall almost hitting 4000-4200, if negotiation starts again early morning then gold is stop here and waiting for both side response.
Eth prices is going down already, market has strong fear index because of war Ultimatum, if war begins to start again then bitcoin and eth both down, peoples invest in dollar now as compared to crypto and gold.
Dollar is the safe haven asset now, biggest opportunity is that open short or waiting for see that bitcoin again touches 70k again.
So bearish signals is more powerfull then bullish signals,
Eth 1st target 2300
2nd 2250
3rd 2200
4rth 2150
5th 2100
Gold targets
1st 4650
2nd 4600
3rd will be 4550
4rth will be 4500
5th will be 4450
Take your own responsibility for trade my signals accuracy will be 100% till now...
Thankyou
#ETH #XAUUSD #signaladvisor $ETH $XAU

Strait of Hormuz Closed Again!!! (Ready for Big Dump)
The situation in the Middle East is tense once again. On April 18, Iran closed the Strait of Hormuz just one day after it was opened. This happened because the United States kept its naval blockade on Iranian ports. The current ceasefire between the US and Iran is set to end on April 22. President Trump has warned that if no final peace deal is made by that date, military action will start again. New talks are expected in Islamabad on April 20, but the risk of war remains very high.
This news is causing big changes in the financial markets. Oil prices are going up again because less oil can travel through the blocked strait, creating a fear of shortage in the world. Gold prices are staying strong and high. People are buying gold to keep their money safe during this dangerous time. On the other hand, Cryptocurrency like Bitcoin is going down. Investors see crypto as a risky asset during war times, so they are selling it to buy safer things like gold.
In short, the next few days are very important. If the peace talks in Islamabad fail and the ceasefire ends on April 22, we can expect oil prices to go much higher. Gold will likely reach new record highs, and crypto will likely fall even more. The world is watching to see if a peaceful solution can be found or if the conflict will restart next week.
Thankyou
#IranRejectsSecondRoundTalks $BTC $XAU
The situation in the Middle East is tense once again. On April 18, Iran closed the Strait of Hormuz just one day after it was opened. This happened because the United States kept its naval blockade on Iranian ports. The current ceasefire between the US and Iran is set to end on April 22. President Trump has warned that if no final peace deal is made by that date, military action will start again. New talks are expected in Islamabad on April 20, but the risk of war remains very high.
This news is causing big changes in the financial markets. Oil prices are going up again because less oil can travel through the blocked strait, creating a fear of shortage in the world. Gold prices are staying strong and high. People are buying gold to keep their money safe during this dangerous time. On the other hand, Cryptocurrency like Bitcoin is going down. Investors see crypto as a risky asset during war times, so they are selling it to buy safer things like gold.
In short, the next few days are very important. If the peace talks in Islamabad fail and the ceasefire ends on April 22, we can expect oil prices to go much higher. Gold will likely reach new record highs, and crypto will likely fall even more. The world is watching to see if a peaceful solution can be found or if the conflict will restart next week.
Thankyou
#IranRejectsSecondRoundTalks $BTC $XAU

Strait of Hormuz Reopens!
The Strait of Hormuz is now open. On April 17, 2026, Iran announced that all commercial ships can pass through this important waterway. This decision was made to support the new ceasefire in Lebanon.
However, this opening comes with a condition. US President Donald Trump has said that the naval blockade on Iran is still active. This means the route is open for world trade, but Iran's own ships cannot pass. Ships must also get permission from Iran's Revolutionary Guard (IRGC) to use a specific lane. The opening is only valid until the current ceasefire ends on April 22, 2026.
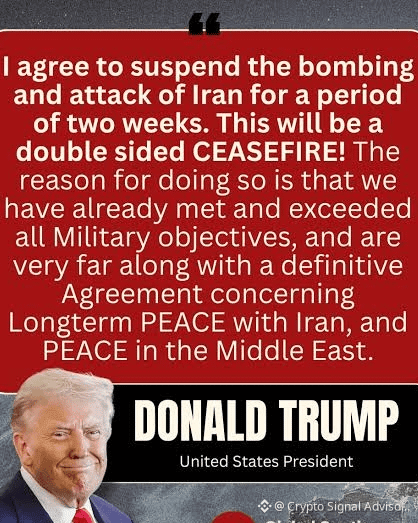
The war is not over; it is just paused. This is a temporary ceasefire, not a peace treaty. First, Pakistan helped arrange a two-week ceasefire between the US and Iran starting April 8. As part of this deal, Iran agreed to open the strait for two weeks. Then, on April 16, Israel and Lebanon agreed to a separate 10-day ceasefire. Following this news, Iran officially reopened the waterway as a "goodwill gesture." Trump himself warned that if a final deal is not reached, "fighting resumes."
Regarding global oil prices, the reopening of the strait has caused a sharp drop in the market. On April 17, WTI Crude (US Oil) fell by 10.8% and Brent Crude (International Standard) fell by 10.3%. However, the current price of Brent Crude is still around 89 per barrel. This is much higher than the pre-war price of about 70, which shows the market is still nervous about the situation. If a permanent peace deal is signed, experts say prices could fall even lower.
The Strait of Hormuz is open for commercial ships until April 22. This happened because of a fragile ceasefire involving the US, Iran, Israel, and Lebanon. The war has NOT been ended by Trump; it is a temporary halt in fighting. Oil prices have gone down because of this news, but they are still high compared to last month. Everyone is now waiting to see if the ceasefire will be extended or if tensions will rise again next week.
#CryptoMarketRebounds #Usiranceasefire
The Strait of Hormuz is now open. On April 17, 2026, Iran announced that all commercial ships can pass through this important waterway. This decision was made to support the new ceasefire in Lebanon.
However, this opening comes with a condition. US President Donald Trump has said that the naval blockade on Iran is still active. This means the route is open for world trade, but Iran's own ships cannot pass. Ships must also get permission from Iran's Revolutionary Guard (IRGC) to use a specific lane. The opening is only valid until the current ceasefire ends on April 22, 2026.
The war is not over; it is just paused. This is a temporary ceasefire, not a peace treaty. First, Pakistan helped arrange a two-week ceasefire between the US and Iran starting April 8. As part of this deal, Iran agreed to open the strait for two weeks. Then, on April 16, Israel and Lebanon agreed to a separate 10-day ceasefire. Following this news, Iran officially reopened the waterway as a "goodwill gesture." Trump himself warned that if a final deal is not reached, "fighting resumes."
Regarding global oil prices, the reopening of the strait has caused a sharp drop in the market. On April 17, WTI Crude (US Oil) fell by 10.8% and Brent Crude (International Standard) fell by 10.3%. However, the current price of Brent Crude is still around 89 per barrel. This is much higher than the pre-war price of about 70, which shows the market is still nervous about the situation. If a permanent peace deal is signed, experts say prices could fall even lower.
The Strait of Hormuz is open for commercial ships until April 22. This happened because of a fragile ceasefire involving the US, Iran, Israel, and Lebanon. The war has NOT been ended by Trump; it is a temporary halt in fighting. Oil prices have gone down because of this news, but they are still high compared to last month. Everyone is now waiting to see if the ceasefire will be extended or if tensions will rise again next week.
#CryptoMarketRebounds #Usiranceasefire


Rave token Signals!!!
Rave going up and down so fast, high liquidations alerts after rave pull back above 2 dollars, due to -0.06 funding rate now after 30-45 minutes rave first going down and touches 10.5-11.5 dollars, this is good entry zone for long trades and then going up above 12 dollars and touches 12.5 13 dollars.
Still rave confirmed over 5B liquidations for short and long both, but now some have again lot of liquidations at around 16-18 dollars, so rave going up again and last time liquidate more...
Due to high volume and very low funding rate after 40 minutes signals, 1st look rave and analyse it's going up after 30minutes or down, if its going up then be ready for short position here and if it's going down then ready for long position.
90% confirmation is that it's going down 1st and the going up
so take your position when rave is around 10.5-11.5 (after 40minutes)
and then 1st t.p will be 11.6
2nd t.p 11.7
3rd t.p 11.8
4rth t.p 11.99
if break done here then 6th t.p will be above 12.5 dollars.
Thankyou
#rave
$RAVE
Rave going up and down so fast, high liquidations alerts after rave pull back above 2 dollars, due to -0.06 funding rate now after 30-45 minutes rave first going down and touches 10.5-11.5 dollars, this is good entry zone for long trades and then going up above 12 dollars and touches 12.5 13 dollars.
Still rave confirmed over 5B liquidations for short and long both, but now some have again lot of liquidations at around 16-18 dollars, so rave going up again and last time liquidate more...
Due to high volume and very low funding rate after 40 minutes signals, 1st look rave and analyse it's going up after 30minutes or down, if its going up then be ready for short position here and if it's going down then ready for long position.
90% confirmation is that it's going down 1st and the going up
so take your position when rave is around 10.5-11.5 (after 40minutes)
and then 1st t.p will be 11.6
2nd t.p 11.7
3rd t.p 11.8
4rth t.p 11.99
if break done here then 6th t.p will be above 12.5 dollars.
Thankyou
#rave
$RAVE
Bitcoin price Analysis!!!!
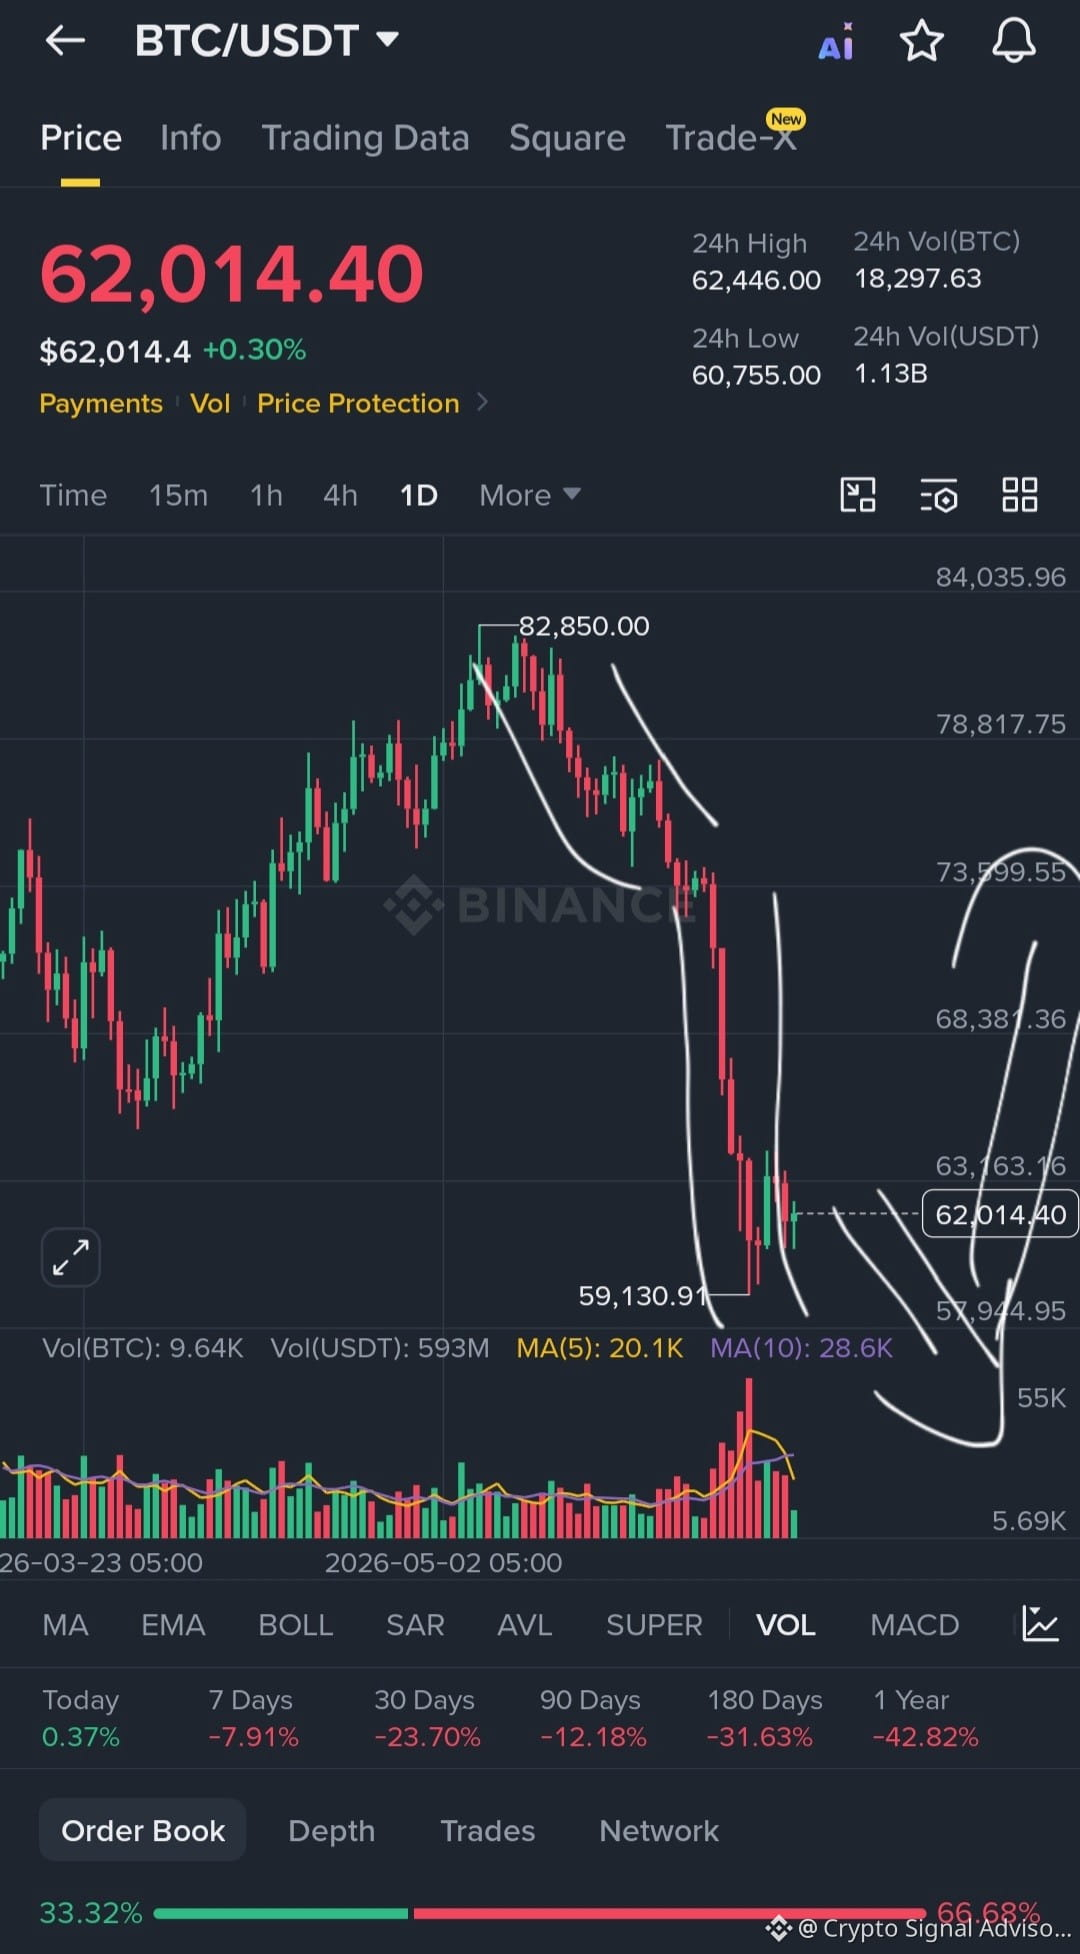
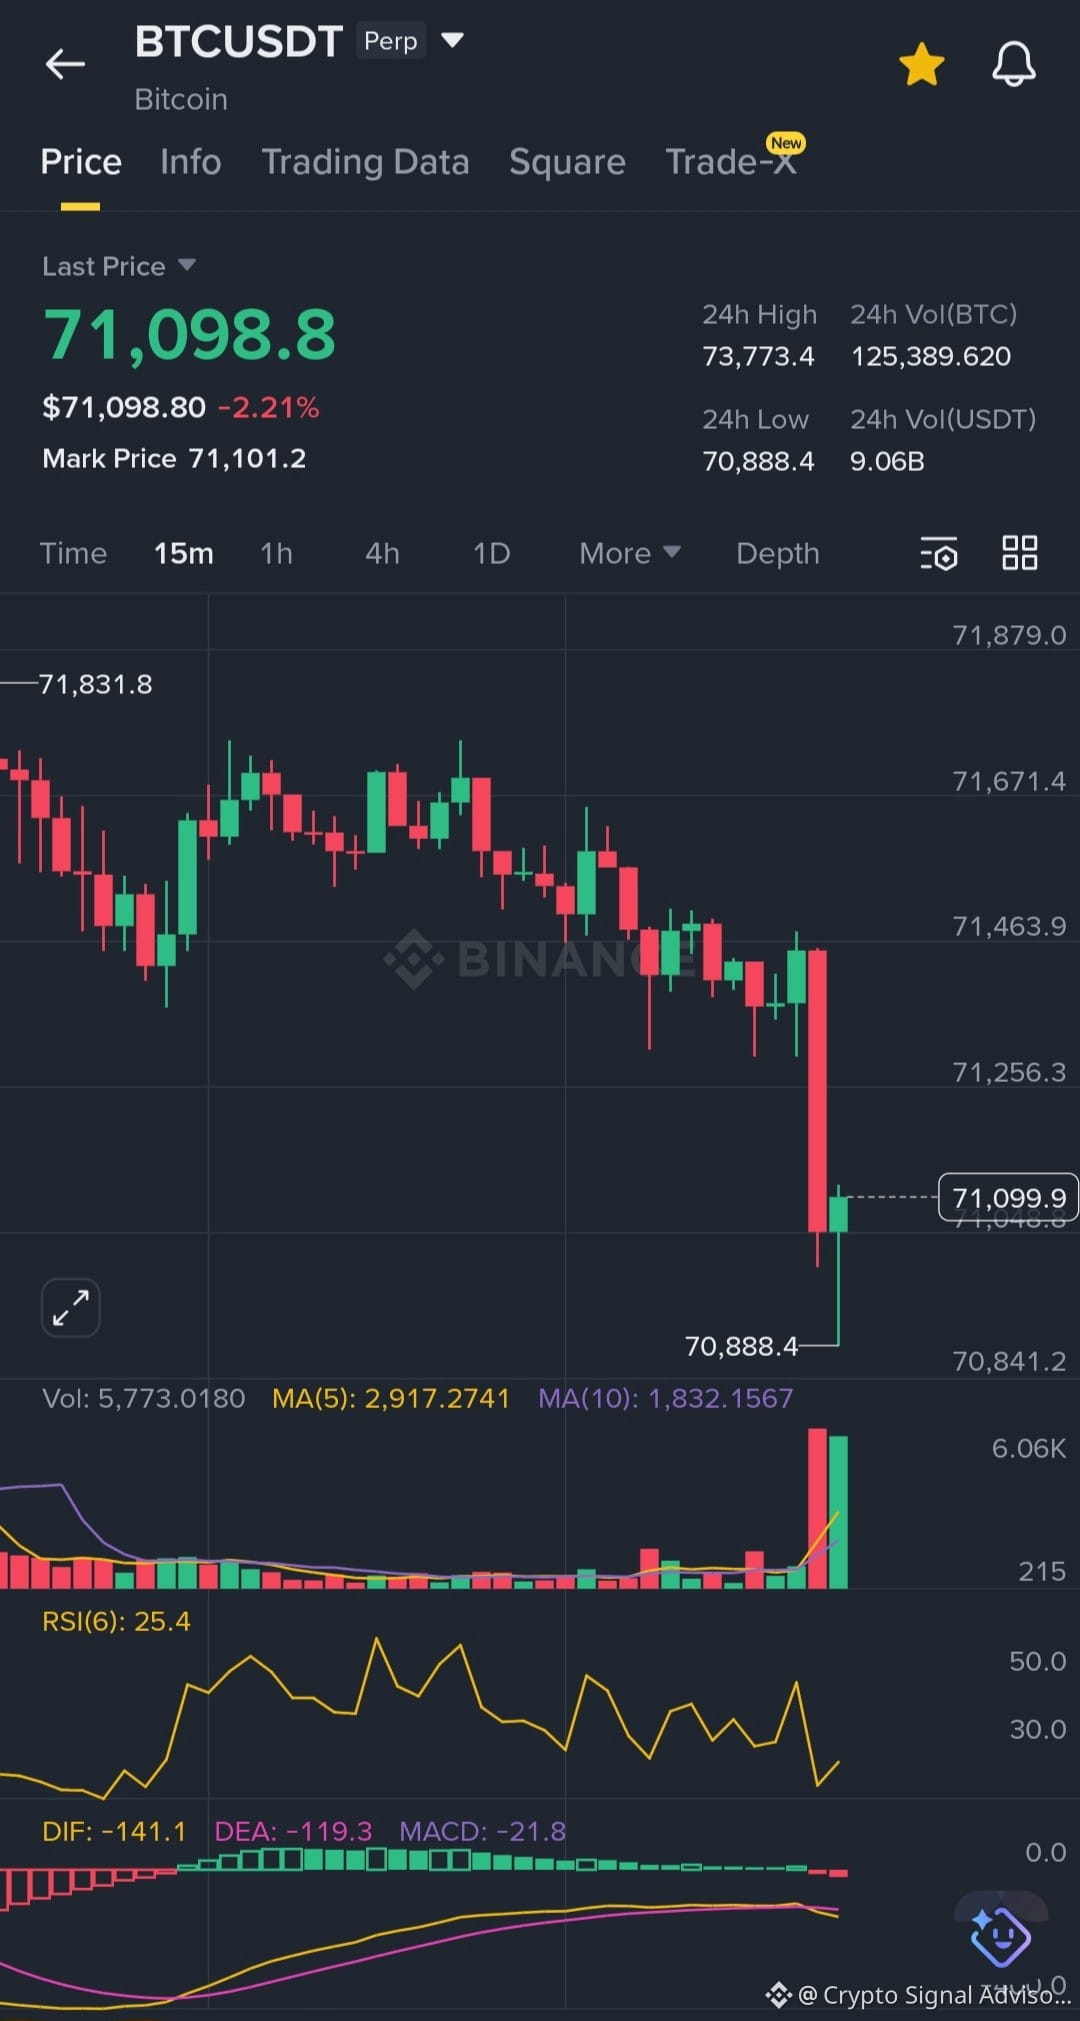
After U.S and Iran meeting closed with no results now again btc in trouble, still war is begin continues. BTC drops down more and more day by day and now touches 70k in weekend, this is very dangerous move for btc because market is still closed, buying and selling is normal but after rejection from U.S side now btc again in trouble.
Now btc standing at 71k-71.5k this is very important zone for btc and also for crypto it self,
BTC buying zone will be for short trade 71000-72000,
Strong selling pressure is on and maybe after opening market btc drops down below 65k becausestrong selling pressure...
T.P will be 70k
t.p 2 will be 69k
t.p 3 will be 68k
and next t.p possible 65k-66k.
If war start again then btc will drops down below 60k.
Look at price chart for btc
Thankyou and Thanks for your precious time
#US-IranTalksFailToReachAgreement #IranClosesHormuzAgain
After U.S and Iran meeting closed with no results now again btc in trouble, still war is begin continues. BTC drops down more and more day by day and now touches 70k in weekend, this is very dangerous move for btc because market is still closed, buying and selling is normal but after rejection from U.S side now btc again in trouble.
Now btc standing at 71k-71.5k this is very important zone for btc and also for crypto it self,
BTC buying zone will be for short trade 71000-72000,
Strong selling pressure is on and maybe after opening market btc drops down below 65k becausestrong selling pressure...
T.P will be 70k
t.p 2 will be 69k
t.p 3 will be 68k
and next t.p possible 65k-66k.
If war start again then btc will drops down below 60k.
Look at price chart for btc
Thankyou and Thanks for your precious time
#US-IranTalksFailToReachAgreement #IranClosesHormuzAgain
Көбірек контент көру үшін кіріңіз