

crypto_crunch
6 Жариялаулар

crypto_crunch
Хабарлау
Пайдаланушыны блоктау
Bitcoin &Altcoin Swing Trader/Sharing Entry/Exit Levels And Risk Management No Hype,Just Chart Follow To Trade Smarter.
Кездейсоқ трейдер
4.3 жыл
13 Жазылым
0 Жазылушылар
5 лайк басылған
Жазбалар
PINNED
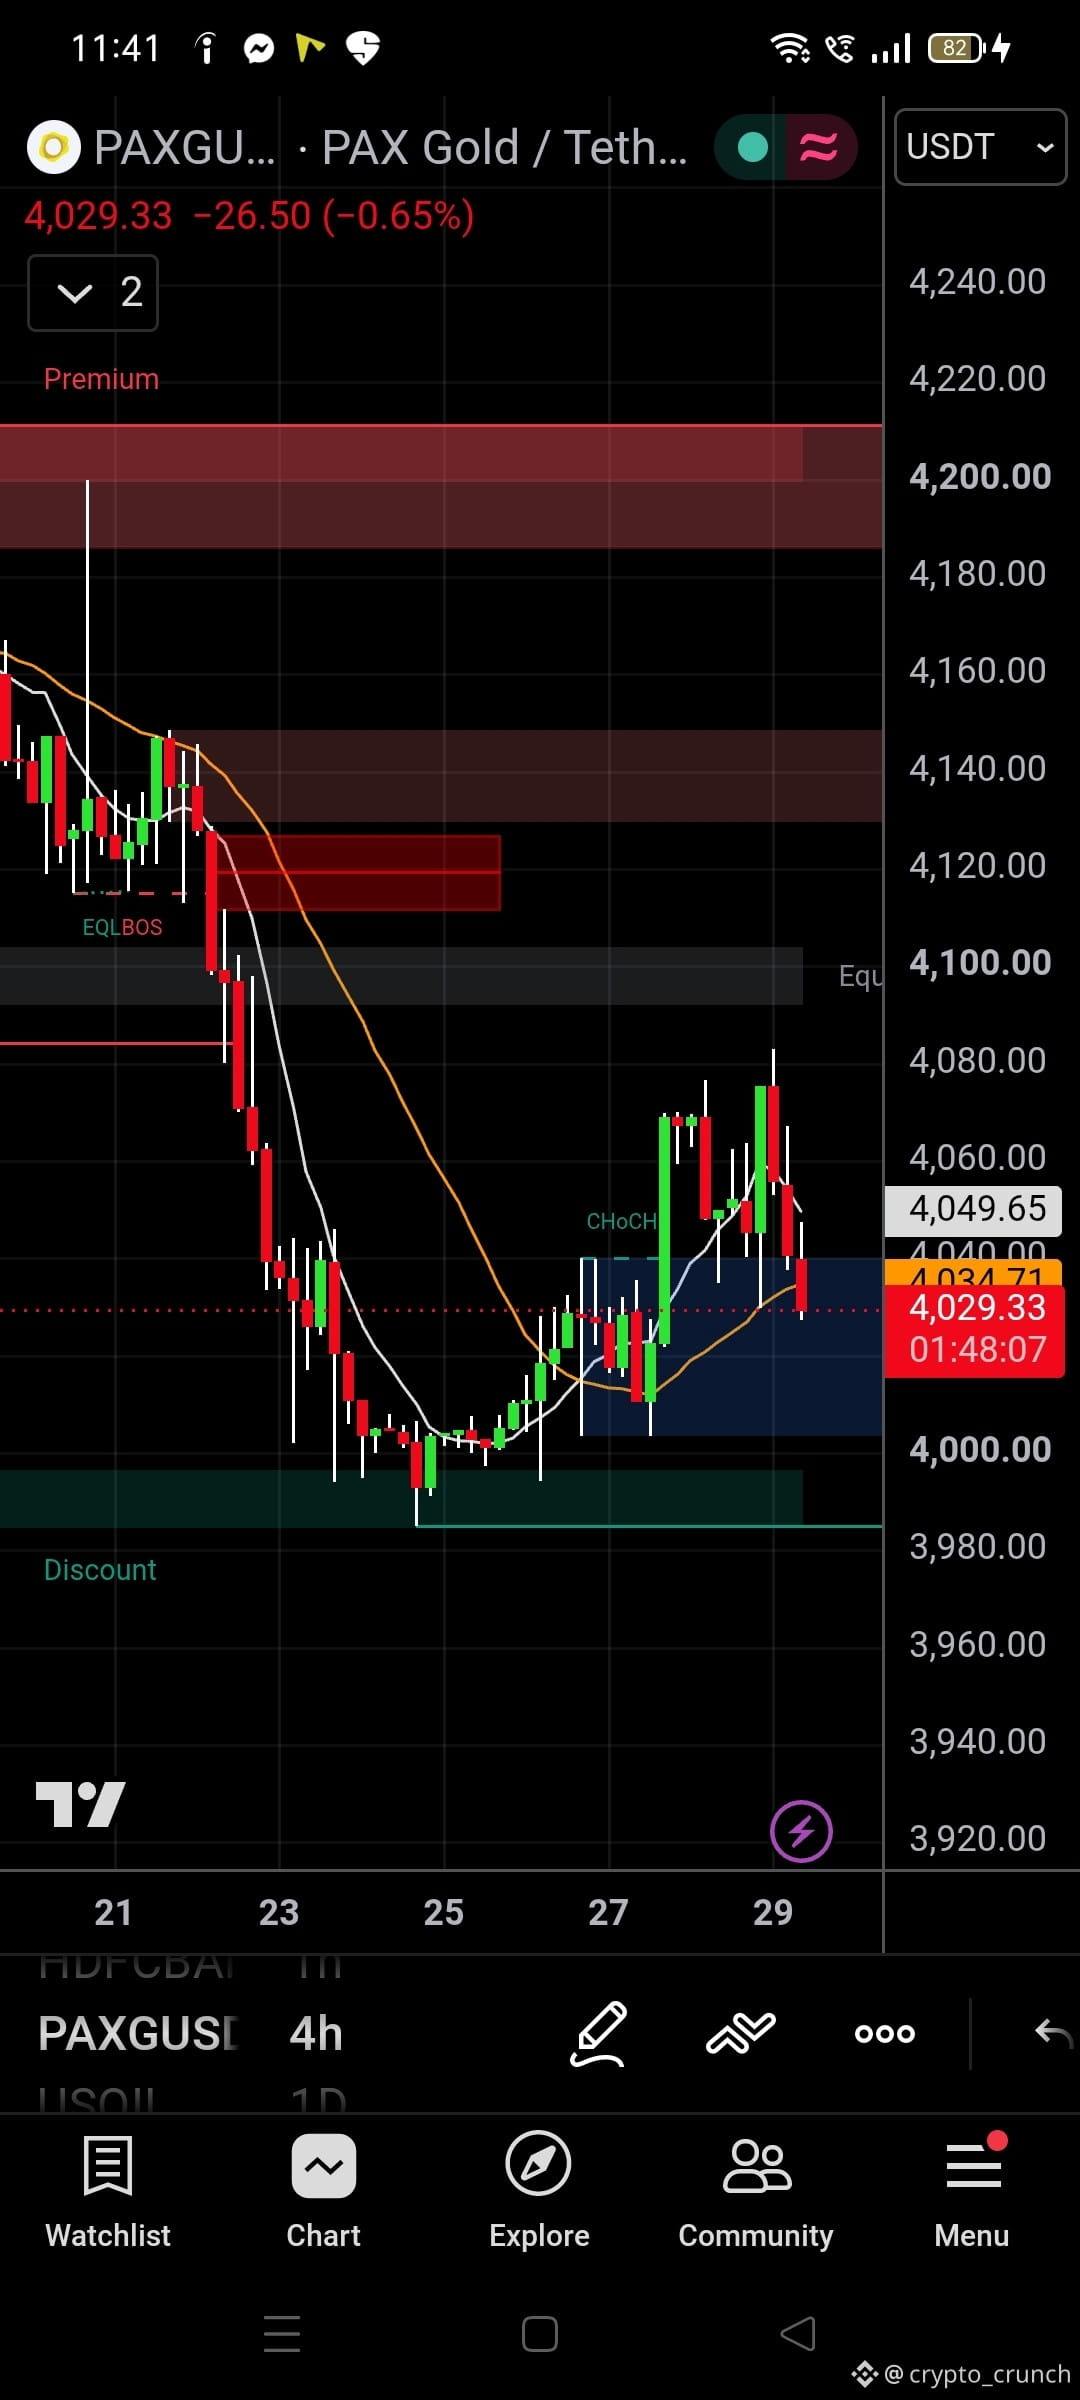
$PAXG 4H Update: Rejection at resistance, now testing support! 🥇📉
In my last update, we saw a bullish CHoCH. However, Gold faced strong resistance near the $4,080 level and got rejected. The price is now pulling back and testing the local demand zone around $4,030.
🔍 Technical Breakdown:
• Market Structure: The overall structure still favors bulls as long as we hold above the $4,000 discount zone. The current move looks like a normal retracement.
• **Key Levels:**
🔴 Resistance: $4,060 - $4,080 (Recent Swing High)
🟢 Support: $4,020 - $4,030 (Current Retest Zone)
⚖️ Equilibrium: $4,100 (Major target if support holds)
👀 What's next?
If this $4,030 support holds, we could see another leg up toward the $4,080 high. But a breakdown here will send the price back to the $3,980 - $4,000 discount zone.
👇 MY QUESTION FOR YOU:
Support ko hold karna chahiye ya break hoga? Aapka next move kya hai—Buy the dip or Wait for a breakdown? Comment below! 💬
⚠️ Always manage your risk. This is not financial advice.
#PAXG #Gold #CryptoAnalysis #TechnicalAnalysis
1
90
PINNED
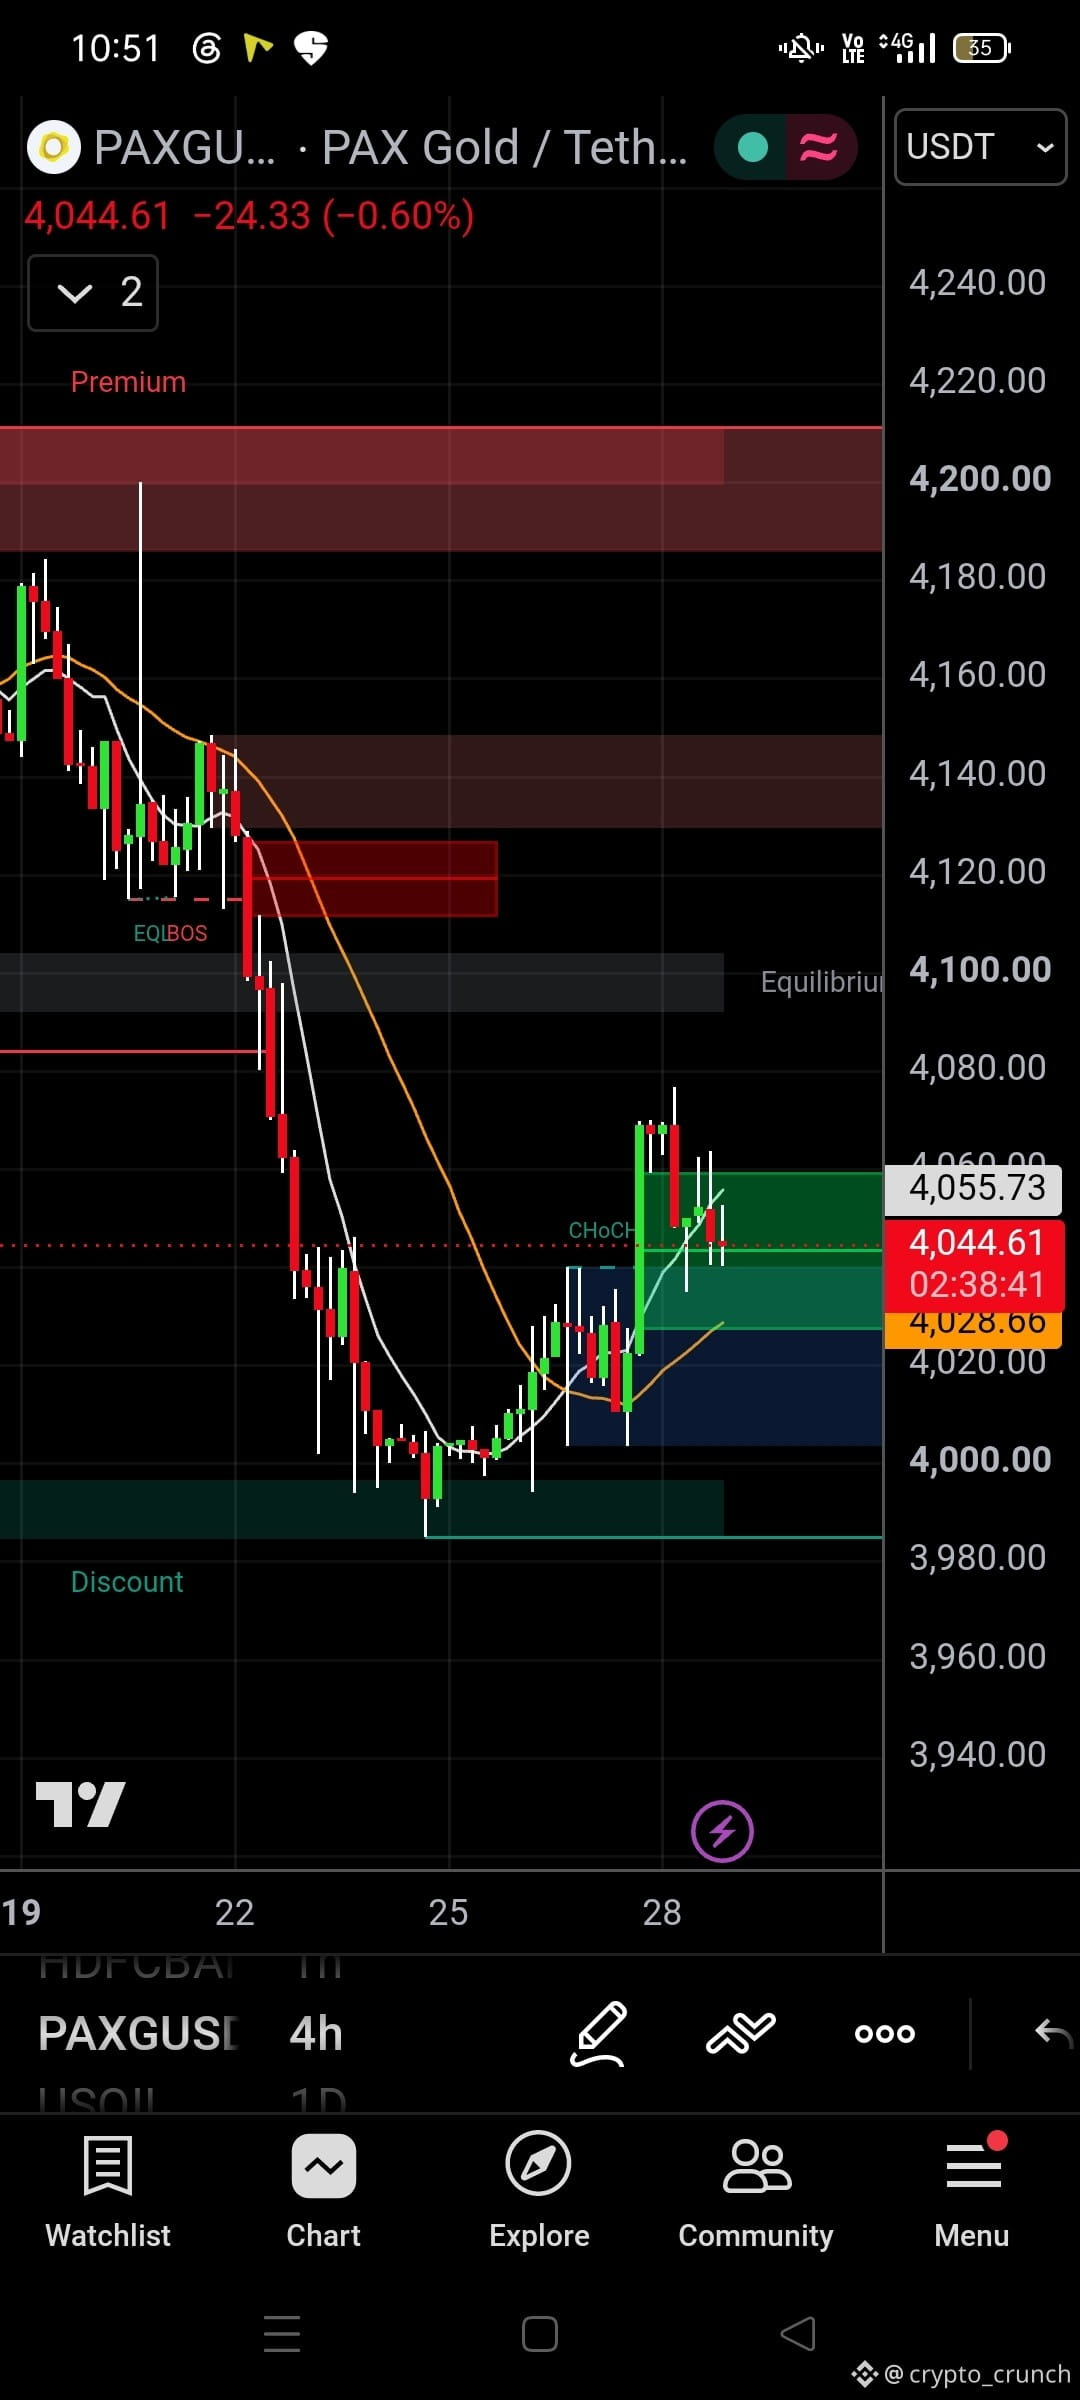
$PAXG 4H Chart Analysis: Gold is bouncing back! 🥇📈
While the crypto market is bleeding, PAX Gold (PAXG) is showing an interesting setup. Looking at the 4-hour timeframe, the price has finally found a bottom after a heavy sell-off. Here is my technical breakdown:
🔴 Market Structure (MS): The price dropped sharply into the "Discount" zone, sweeping liquidity near $3,980. However, we can now see a clear CHoCH (Change of Character) to the upside, indicating a potential shift in momentum.
📉 Key Zones:
• Resistance: The Equilibrium level at $4,100 is the immediate hurdle. Above that, $4,120 - $4,140 is a major supply zone.
• **Support:** Price is currently holding well above the local support of $4,020 - $4,040.
👀 What to watch?
The bulls are trying to reclaim the moving averages. If PAXG holds this support and breaks above the $4,060 level with volume, we could see a relief rally back toward the $4,100 equilibrium. A failure to hold $4,020 could lead to another retest of the discount zone.
Are you trading Gold as a hedge against the crypto market drop? Let me know! 👇
⚠️ Always manage your risk. This is not financial advice.
#PAXG #Gold #CryptoAnalysis #TechnicalAnalysis
1
1
566
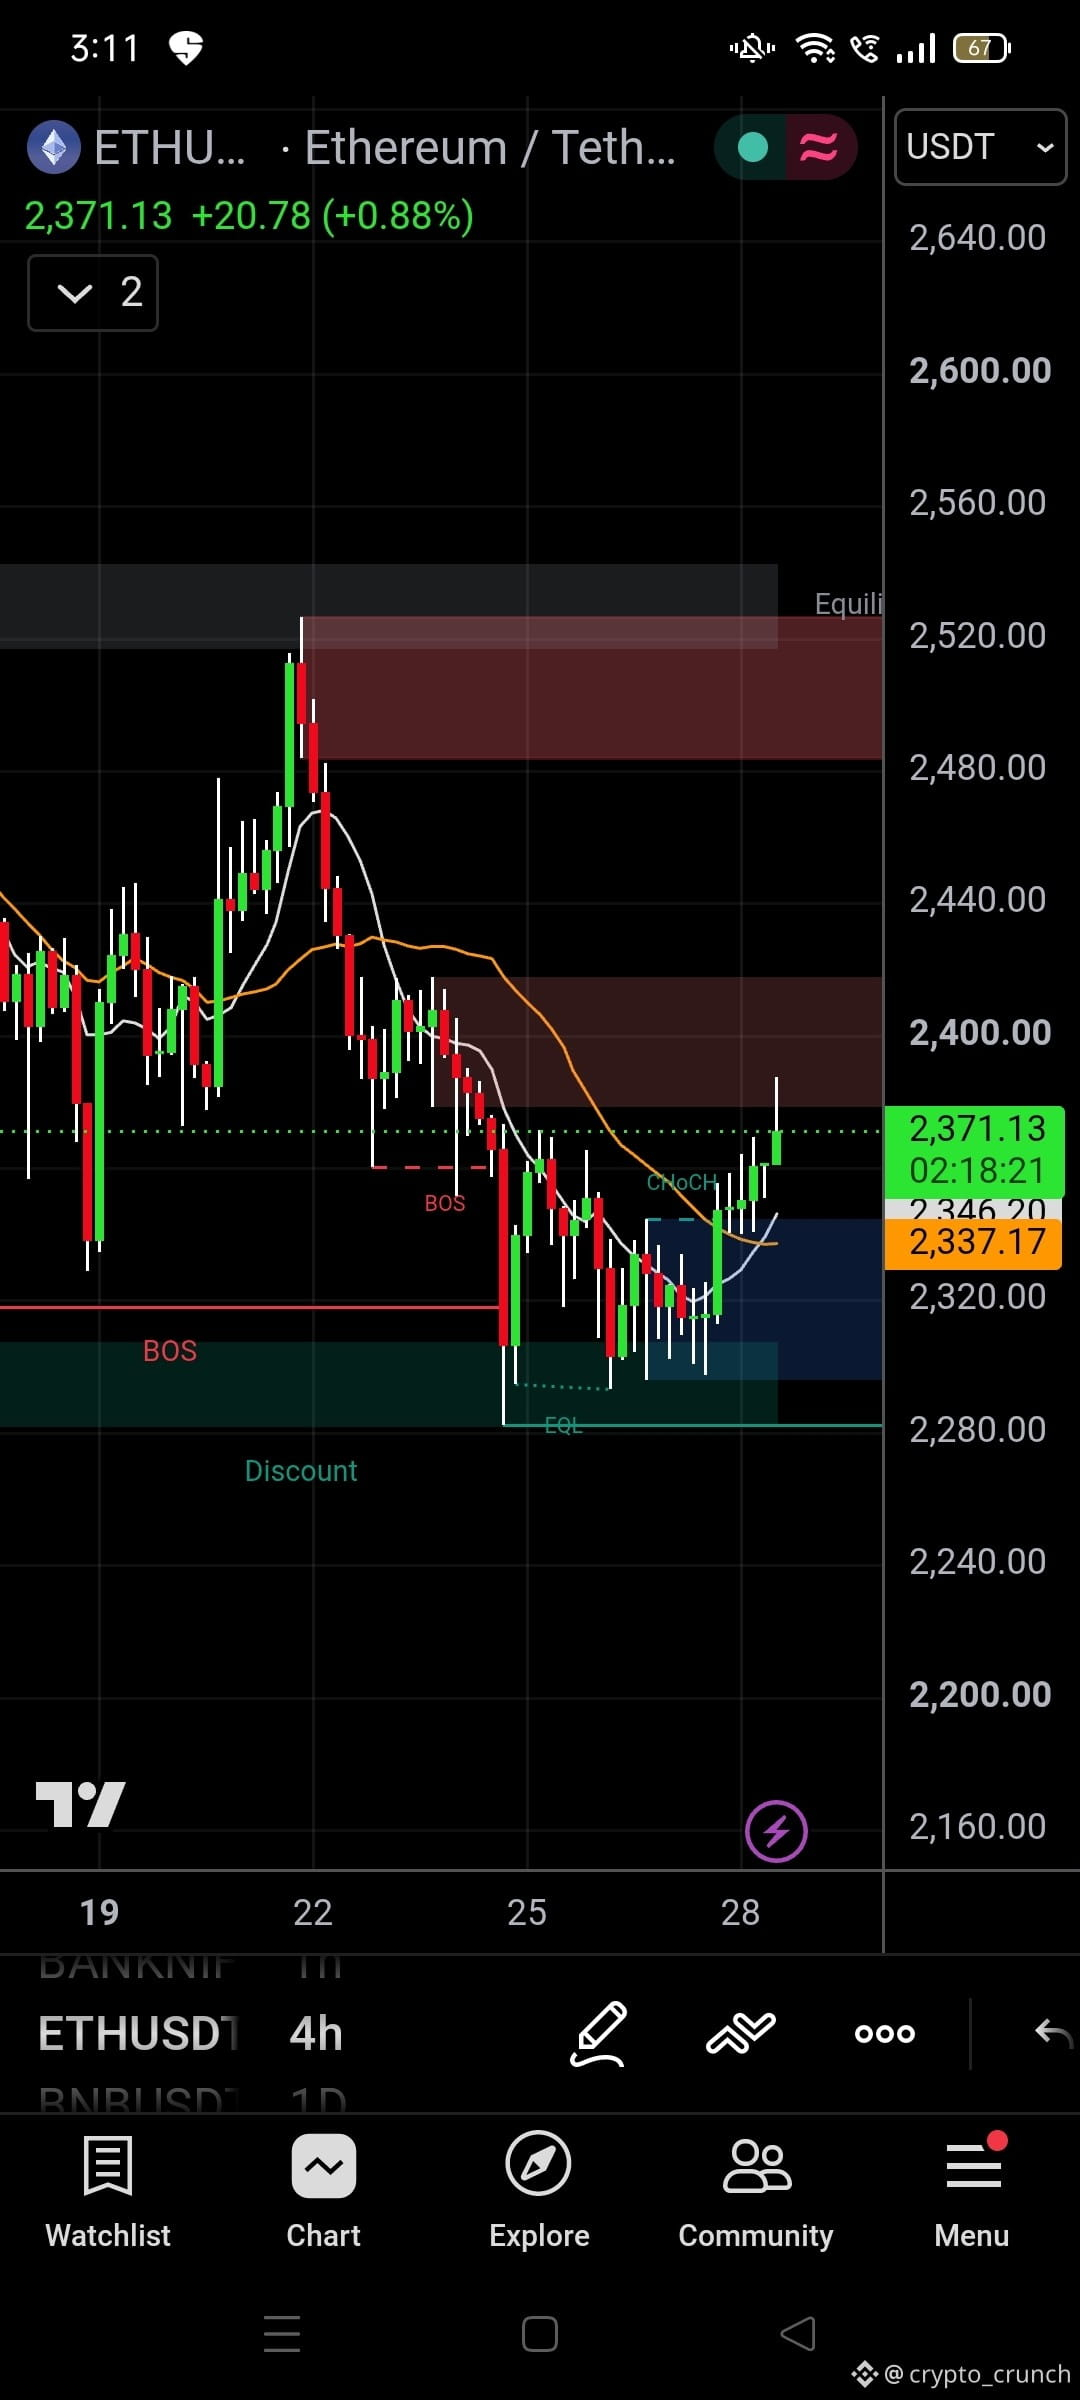
$ETH 4H Chart Update: Bulls are stepping in! 🐂📈
Ethereum is finally showing some strength after sweeping the Equal Lows (EQL). Price has bounced from the Discount zone and is now trading around $2,371. Here is the updated technical breakdown:
🟢 Market Structure (MS): We can clearly see a CHoCH (Change of Character) to the upside. This is a strong signal that the short-term bearish momentum might be shifting.
📉 Key Zones:
• Support: The $2,300 - $2,330 area held perfectly, acting as a strong demand zone.
• Resistance: Price is currently approaching the $2,400 - $2,440 supply zone. The moving average is also acting as immediate resistance here.
👀 What's next?
The price is reacting well to the bullish CHoCH. If we get a 4H candle close above $2,400, we could see a push toward the Equilibrium level at $2,520. However, a rejection here could send us back to retest the local support.
Are you long on $ETH right now? Let me know below! 👇
⚠️ Always manage your risk. This is not financial advice.
#ETH #Ethereum #CryptoAnalysis #TechnicalAnalysis
1
88
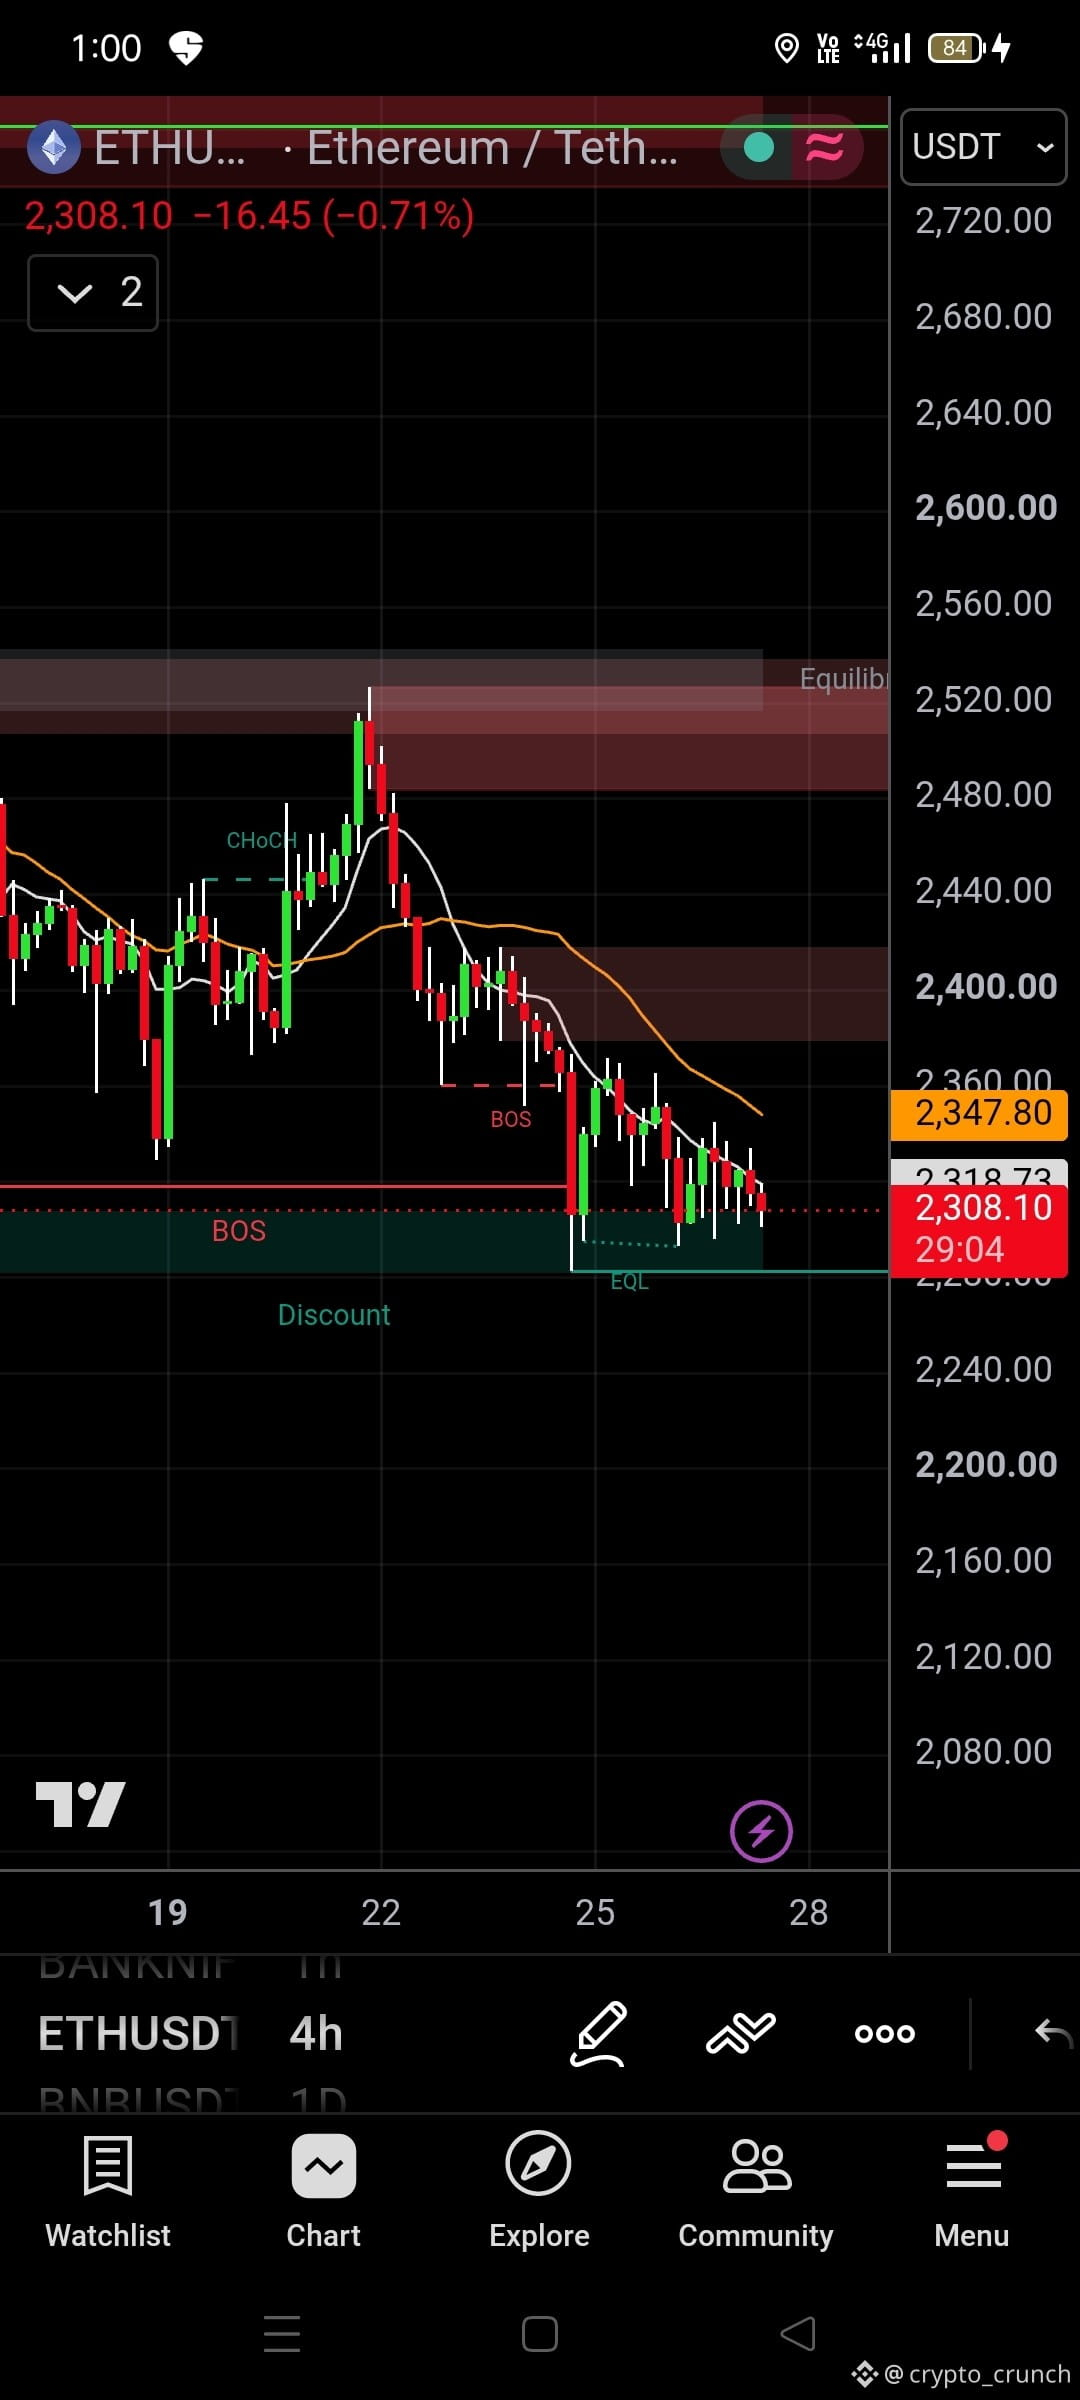
$ETH 4H Chart Analysis 🧠📉
Ethereum is mirroring Bitcoin's weakness. Looking at the 4-hour timeframe, the structure is clearly bearish. Price is currently trading around $2,308 after a significant drop. Here is my technical breakdown:
🔴 Market Structure (MS): We can clearly see a Change of Character (CHoCH) followed by a strong Break of Structure (BOS) to the downside. The trend remains bearish.
📉 Key Zones:
• Resistance: The $2,400 - $2,440 area is acting as a strong supply zone. We also have the Equilibrium level up near $2,520.
• Support: Price is currently testing a local support and is sitting deep in the "Discount" zone. We also have Equal Lows (EQL) near this current price which might act as short-term liquidity.
👀 What to watch?
The price is currently consolidating at the bottom. If it breaks below this EQL support, expect a further drop. However, if we get a short-term relief bounce, the $2,350 - $2,360 area (where the moving average is) could be a great shorting opportunity.
⚠️ Always manage your risk. This is not financial advice.
How low will $ETH go? Let me know your thoughts! 👇
#ETH #Ethereum #CryptoAnalysis #TechnicalAnalysis
1
86
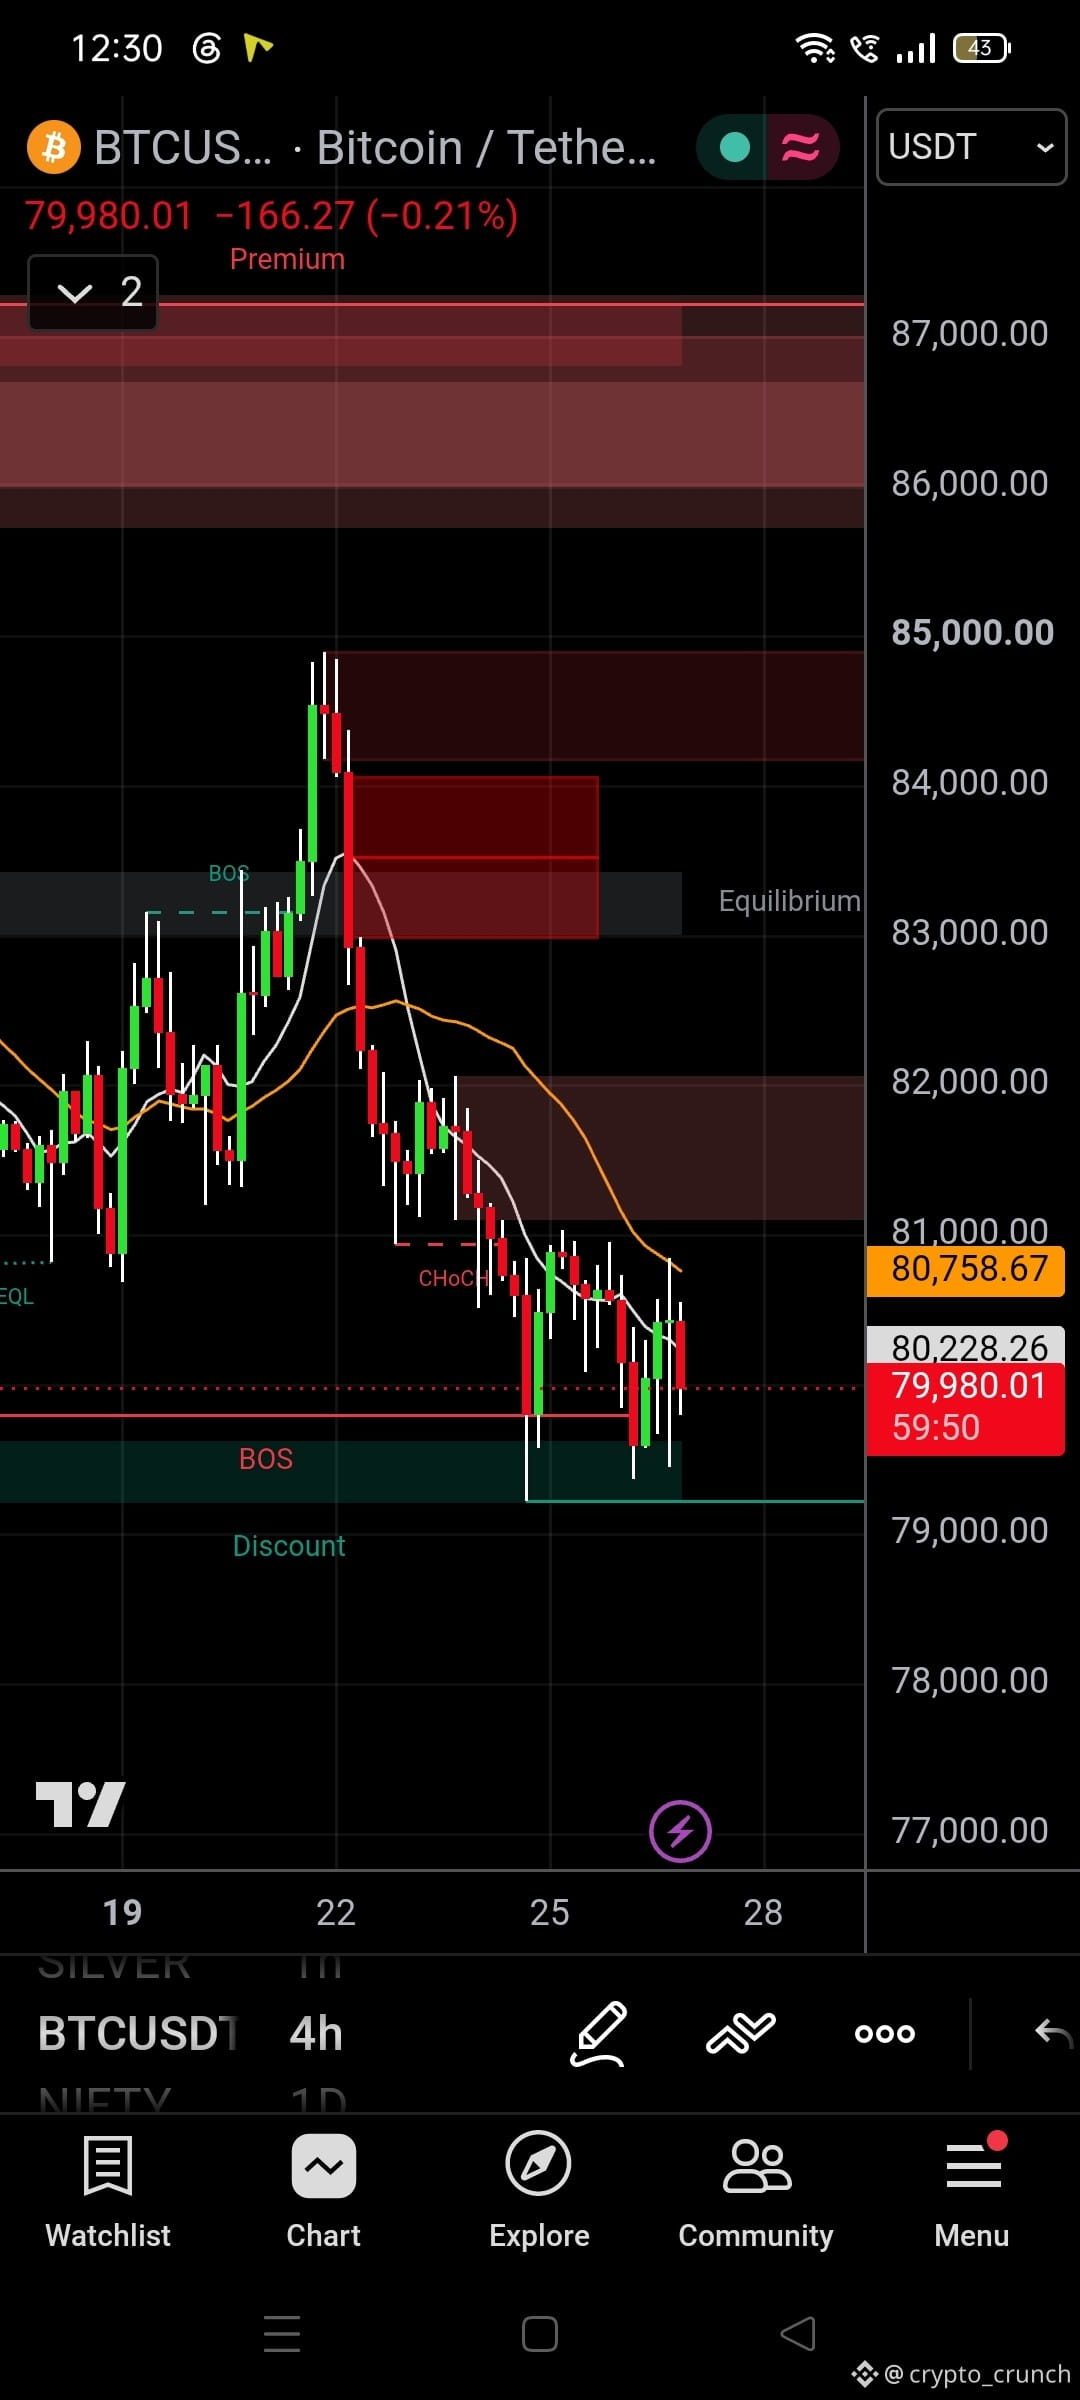
$BTC 4H Chart Analysis 🧠📉
Looking at the 4-hour timeframe, Bitcoin is currently showing a clear bearish structure after a major sell-off. Price is currently trading around $79,980. Here is my technical breakdown using Smart Money Concepts:
🔴 Market Structure (MS): We have seen a clear Change of Character (CHoCH) followed by a Break of Structure (BOS) to the downside. This confirms the short-term trend is bearish.
📉 Key Zones:
• Resistance: The $83,000 - $84,000 area (Equilibrium) is now acting as a strong supply zone.
• Support: Price is currently testing a local support and is hovering in the "Discount" zone (below $80,000).
👀 What to watch?
The price swept liquidity below $80k and is trying to hold. If it loses this current support, the next major demand zone is lower. However, a short-term bounce toward the $81,000 - $81,500 (Premium area) could be a good shorting opportunity if we see rejection.
⚠️ Always manage your risk. This is not financial advice.
What are your thoughts on $BTC? Bullish or Bearish? 👇
#BTC #Bitcoin #CryptoAnalysis #TechnicalAnalysis
1
79
Көбірек контент көру үшін кіріңіз
Binance Square платформасында әлемдік криптоқоғамдастыққа қосылыңыз
⚡️ Криптовалюта туралы ең соңғы және пайдалы ақпаратты алыңыз.
💬 Әлемдегі ең ірі криптобиржаның сеніміне ие.
👍 Расталған авторлардың нақты пікірлерін табыңыз.
Электрондық пошта/телефон нөмірі
Трендтегі тақырыптар
FedWatch
16.1M рет көрілді
37,674 адам талқылап жатыр
ФРС США оставила ставку без изменений, но Уорш не исключает повышение в декабре
BorisBorissss
·3 лайк
·2.3k рет көрілді
Nasdaq100FuturesFall0.9%
343 рет көрілді
31 адам талқылап жатыр
BitcoinCore32.1RaisesPeerConnectionLimit
13,194 рет көрілді
374 адам талқылап жатыр