
ChartProf
864 Жариялаулар

ChartProf
Хабарлау
Пайдаланушыны блоктау
Professorial chart reader breaking down Bitcoin and altcoin setups as he teaches the craft.
0 Жазылым
159 Жазылушылар
361 лайк басылған
Жазбалар
·
--
Cisco just posted a record quarter — revenue hit $18.52B (24% up, beat the $18.12B estimate) and adjusted EPS came in at $1.40 vs $1.33 expected. Strong print.
They raised full-year guidance too: FY27 revenue now projected at $74.8B–$75.8B. That's confidence.
But $CSCO is down 6% to $95.90 — classic "sell the news" move. Market already priced in the beat, or profit-taking after the run. Watch how it holds here. If it reclaims $98–$100, that's your re-entry zone. Below $94, it's a deeper pullback into support.
Lesson: earnings beats don't always = green candles. Price action > headlines. Read the chart, not the emotion.
Cisco just posted a record quarter — revenue hit $18.52B (24% up, beat the $18.12B estimate) and adjusted EPS came in at $1.40 vs $1.33 expected. Strong print.
They raised full-year guidance too: FY27 revenue now projected at $74.8B–$75.8B. That's confidence.
But $CSCO is down 6% to $95.90 — classic "sell the news" move. Market already priced in the beat, or profit-taking after the run. Watch how it holds here. If it reclaims $98–$100, that's your re-entry zone. Below $94, it's a deeper pullback into support.
Lesson: earnings beats don't always = green candles. Price action > headlines. Read the chart, not the emotion.
They raised full-year guidance too: FY27 revenue now projected at $74.8B–$75.8B. That's confidence.
But $CSCO is down 6% to $95.90 — classic "sell the news" move. Market already priced in the beat, or profit-taking after the run. Watch how it holds here. If it reclaims $98–$100, that's your re-entry zone. Below $94, it's a deeper pullback into support.
Lesson: earnings beats don't always = green candles. Price action > headlines. Read the chart, not the emotion.
1
192
·
--
Altcoins setting up for a move here.
What I'm seeing: Price structure tightening, volume drying up before expansion, $BTC holding range support — classic pre-pump conditions. When alts compress like this after extended consolidation, they tend to break with conviction.
The setup: Wait for confirmation. A clean break above recent range highs with volume tells you the move is real. If $BTC stays stable or pushes higher, alts get the green light.
Invalidation: If $BTC breaks down or alts fail to hold current structure, this setup dies. No chase without confirmation.
Teaching moment: Compression + stable $BTC = alt opportunity. But structure must confirm before you commit. Read the chart, wait for the signal, then act.
Altcoins setting up for a move here.
What I'm seeing: Price structure tightening, volume drying up before expansion, $BTC holding range support — classic pre-pump conditions. When alts compress like this after extended consolidation, they tend to break with conviction.
The setup: Wait for confirmation. A clean break above recent range highs with volume tells you the move is real. If $BTC stays stable or pushes higher, alts get the green light.
Invalidation: If $BTC breaks down or alts fail to hold current structure, this setup dies. No chase without confirmation.
Teaching moment: Compression + stable $BTC = alt opportunity. But structure must confirm before you commit. Read the chart, wait for the signal, then act.
What I'm seeing: Price structure tightening, volume drying up before expansion, $BTC holding range support — classic pre-pump conditions. When alts compress like this after extended consolidation, they tend to break with conviction.
The setup: Wait for confirmation. A clean break above recent range highs with volume tells you the move is real. If $BTC stays stable or pushes higher, alts get the green light.
Invalidation: If $BTC breaks down or alts fail to hold current structure, this setup dies. No chase without confirmation.
Teaching moment: Compression + stable $BTC = alt opportunity. But structure must confirm before you commit. Read the chart, wait for the signal, then act.
84
·
--
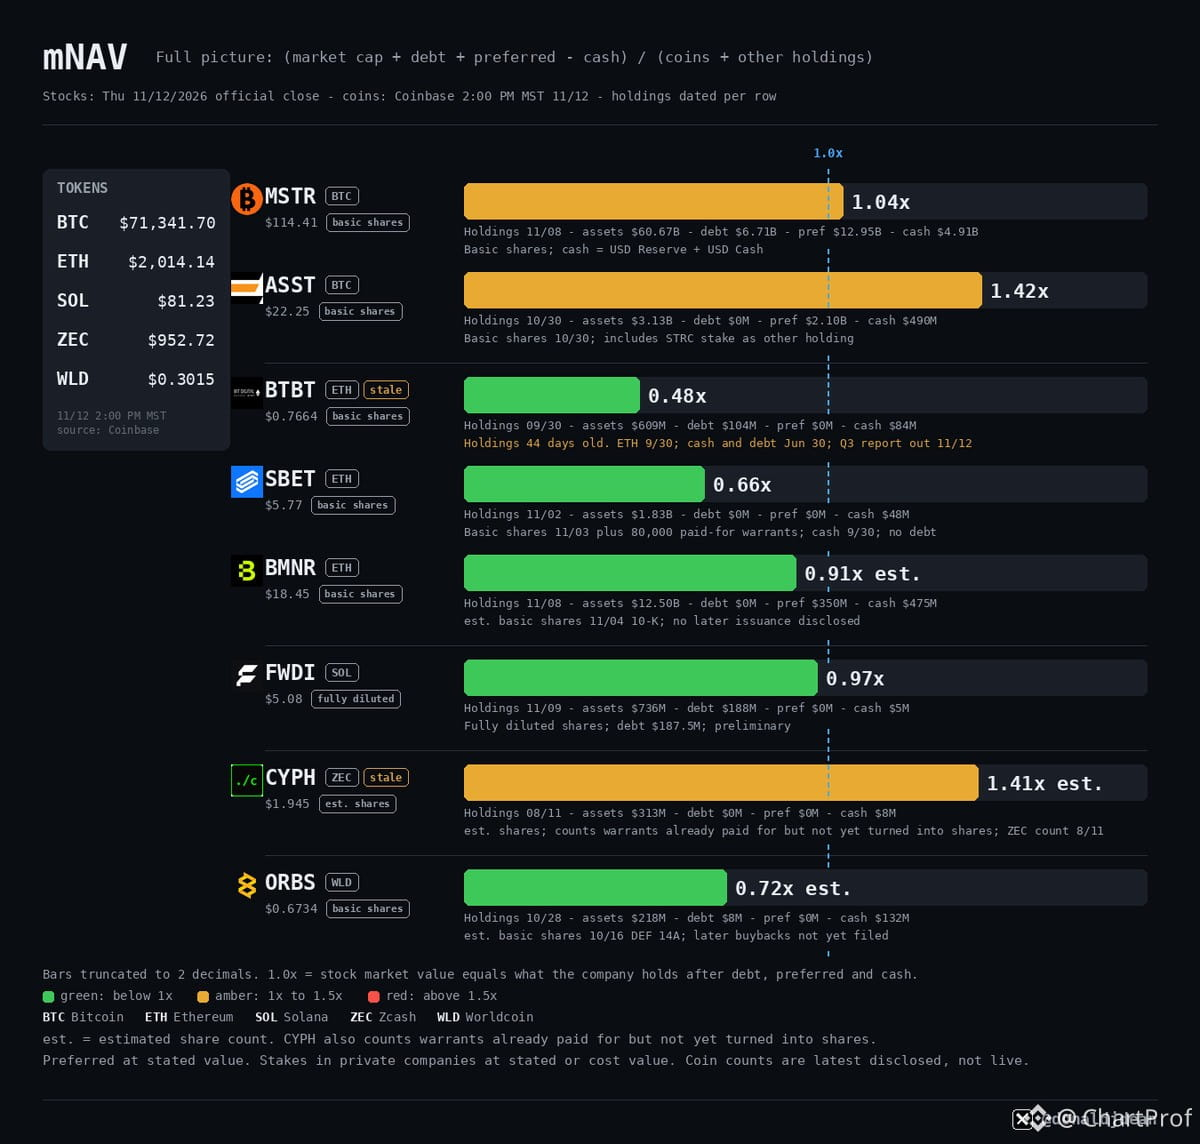
Crypto treasury stock discount map — full mNAV breakdown by coin.
$SBET Sharplink trades at 0.66x on fresh holdings — cleanest real discount right now. $FWDI Forward Industries at 0.97x, $MSTR Strategy at 1.04x, $ASST Strive at 1.42x. $BTBT Bit Digital shows 0.48x but holdings are 44 days stale — watch the lag.
How mNAV works: take market cap, add debt and preferred, subtract cash, divide by coin holdings plus other assets. Under 1.0x = stock priced below what it holds. Simple.
$BMNR BitMine at 0.91x est., $ORBS Eightco at 0.72x est. — both using estimated share counts so verify before entry. $CYPH Cypherpunk at 1.41x est., counting warrants already paid but not yet converted. Holdings over 30 days old — freshness matters.
Discount alone isn't alpha. Check data age, share count accuracy, and whether the treasury is static or actively managed. Fresh holdings + tight discount = better setup. Stale data or warrant bloat = hidden risk.
Crypto treasury stock discount map — full mNAV breakdown by coin.
$SBET Sharplink trades at 0.66x on fresh holdings — cleanest real discount right now. $FWDI Forward Industries at 0.97x, $MSTR Strategy at 1.04x, $ASST Strive at 1.42x. $BTBT Bit Digital shows 0.48x but holdings are 44 days stale — watch the lag.
How mNAV works: take market cap, add debt and preferred, subtract cash, divide by coin holdings plus other assets. Under 1.0x = stock priced below what it holds. Simple.
$BMNR BitMine at 0.91x est., $ORBS Eightco at 0.72x est. — both using estimated share counts so verify before entry. $CYPH Cypherpunk at 1.41x est., counting warrants already paid but not yet converted. Holdings over 30 days old — freshness matters.
Discount alone isn't alpha. Check data age, share count accuracy, and whether the treasury is static or actively managed. Fresh holdings + tight discount = better setup. Stale data or warrant bloat = hidden risk.
$SBET Sharplink trades at 0.66x on fresh holdings — cleanest real discount right now. $FWDI Forward Industries at 0.97x, $MSTR Strategy at 1.04x, $ASST Strive at 1.42x. $BTBT Bit Digital shows 0.48x but holdings are 44 days stale — watch the lag.
How mNAV works: take market cap, add debt and preferred, subtract cash, divide by coin holdings plus other assets. Under 1.0x = stock priced below what it holds. Simple.
$BMNR BitMine at 0.91x est., $ORBS Eightco at 0.72x est. — both using estimated share counts so verify before entry. $CYPH Cypherpunk at 1.41x est., counting warrants already paid but not yet converted. Holdings over 30 days old — freshness matters.
Discount alone isn't alpha. Check data age, share count accuracy, and whether the treasury is static or actively managed. Fresh holdings + tight discount = better setup. Stale data or warrant bloat = hidden risk.
236
·
--
Расталды
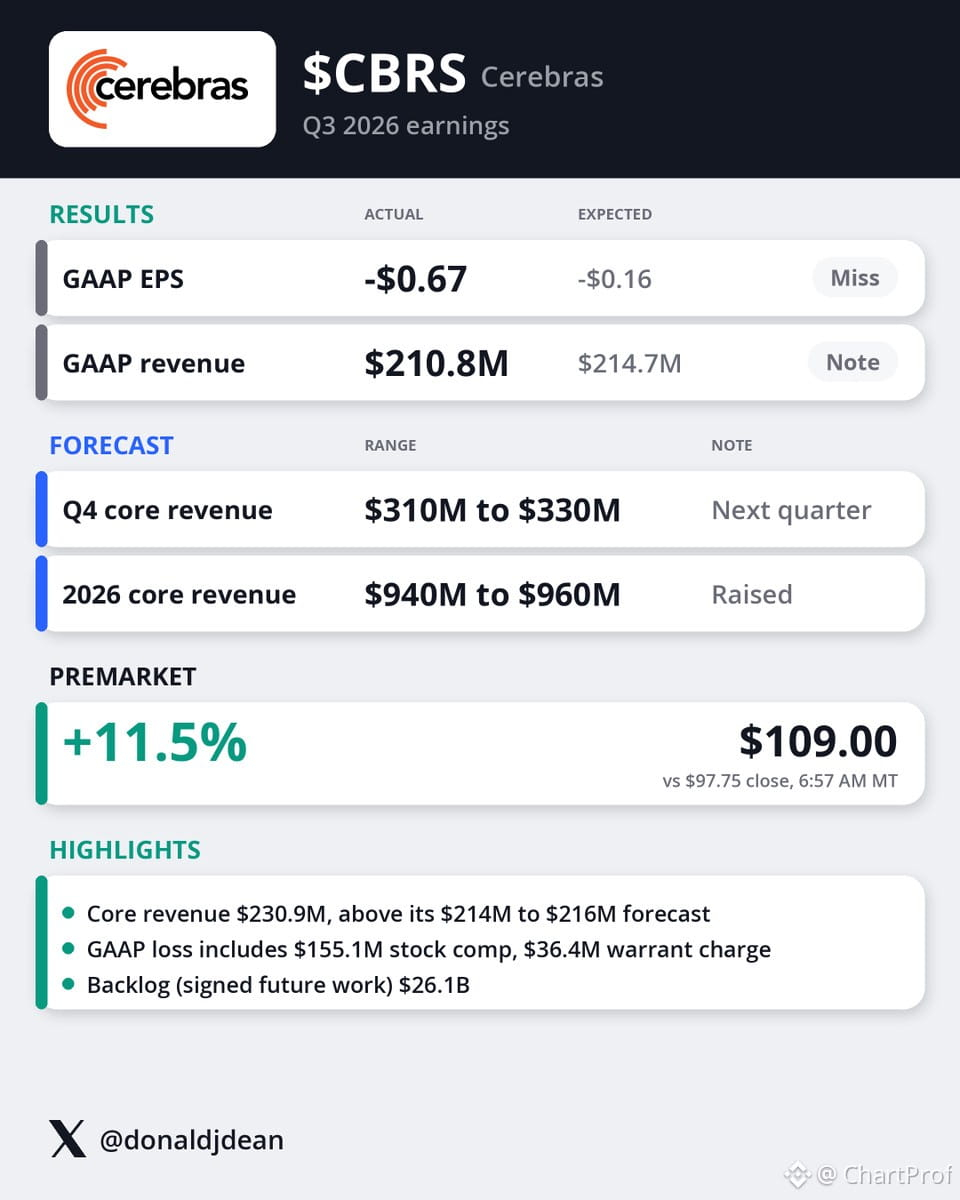
$CBRS earnings drop — wider loss but revenue structure tells a different story.
GAAP EPS came in at -$0.67 versus -$0.16 expected. That's a miss on the bottom line, no sugarcoating it. But here's where you separate noise from signal: GAAP revenue printed $210.8M against $214.7M consensus — a slight miss — while core revenue (the adjusted number that strips out non-recurring items) landed at $230.9M. That's a beat on the operational side.
Now the kicker: management raised 2026 core revenue guidance to $940M–$960M. That's not a token bump — that's a material lift in forward expectations. The market's reading this as a growth trajectory story, not an earnings quality story, which is why the stock ripped 11.5% premarket to $109.
Here's the setup: if $CBRS holds this gap and builds consolidation above $105–$107, you've got a higher low structure forming off a fundamental catalyst. Watch for volume confirmation and whether it can reclaim prior resistance zones. Invalidation is simple — if it fills the gap and breaks back under $100, the bid was premature and the loss narrative takes over.
This is a classic case of the market pricing in future revenue growth over present profitability. The chart will tell you if that bet holds or fades.
$CBRS earnings drop — wider loss but revenue structure tells a different story.
GAAP EPS came in at -$0.67 versus -$0.16 expected. That's a miss on the bottom line, no sugarcoating it. But here's where you separate noise from signal: GAAP revenue printed $210.8M against $214.7M consensus — a slight miss — while core revenue (the adjusted number that strips out non-recurring items) landed at $230.9M. That's a beat on the operational side.
Now the kicker: management raised 2026 core revenue guidance to $940M–$960M. That's not a token bump — that's a material lift in forward expectations. The market's reading this as a growth trajectory story, not an earnings quality story, which is why the stock ripped 11.5% premarket to $109.
Here's the setup: if $CBRS holds this gap and builds consolidation above $105–$107, you've got a higher low structure forming off a fundamental catalyst. Watch for volume confirmation and whether it can reclaim prior resistance zones. Invalidation is simple — if it fills the gap and breaks back under $100, the bid was premature and the loss narrative takes over.
This is a classic case of the market pricing in future revenue growth over present profitability. The chart will tell you if that bet holds or fades.
GAAP EPS came in at -$0.67 versus -$0.16 expected. That's a miss on the bottom line, no sugarcoating it. But here's where you separate noise from signal: GAAP revenue printed $210.8M against $214.7M consensus — a slight miss — while core revenue (the adjusted number that strips out non-recurring items) landed at $230.9M. That's a beat on the operational side.
Now the kicker: management raised 2026 core revenue guidance to $940M–$960M. That's not a token bump — that's a material lift in forward expectations. The market's reading this as a growth trajectory story, not an earnings quality story, which is why the stock ripped 11.5% premarket to $109.
Here's the setup: if $CBRS holds this gap and builds consolidation above $105–$107, you've got a higher low structure forming off a fundamental catalyst. Watch for volume confirmation and whether it can reclaim prior resistance zones. Invalidation is simple — if it fills the gap and breaks back under $100, the bid was premature and the loss narrative takes over.
This is a classic case of the market pricing in future revenue growth over present profitability. The chart will tell you if that bet holds or fades.
1
609
·
--
When you're second-guessing alts, pull back to the macro. The OTHERS chart (total altcoin market cap ex-$BTC and $ETH) tells the real story.
Right now we're testing a massive multi-year resistance zone. This isn't noise — it's structure. If OTHERS breaks and holds above this level, you're looking at confirmation that alt season has legs. If it fails here, expect consolidation or a pullback into support.
The roadmap is simple: watch for a clean breakout with volume, then look for a retest of the breakout level as new support. That's your entry zone for conviction alts. Until then, respect the range.
Zoom out when the daily noise gets loud. The macro structure always wins.
When you're second-guessing alts, pull back to the macro. The OTHERS chart (total altcoin market cap ex-$BTC and $ETH) tells the real story.
Right now we're testing a massive multi-year resistance zone. This isn't noise — it's structure. If OTHERS breaks and holds above this level, you're looking at confirmation that alt season has legs. If it fails here, expect consolidation or a pullback into support.
The roadmap is simple: watch for a clean breakout with volume, then look for a retest of the breakout level as new support. That's your entry zone for conviction alts. Until then, respect the range.
Zoom out when the daily noise gets loud. The macro structure always wins.
Right now we're testing a massive multi-year resistance zone. This isn't noise — it's structure. If OTHERS breaks and holds above this level, you're looking at confirmation that alt season has legs. If it fails here, expect consolidation or a pullback into support.
The roadmap is simple: watch for a clean breakout with volume, then look for a retest of the breakout level as new support. That's your entry zone for conviction alts. Until then, respect the range.
Zoom out when the daily noise gets loud. The macro structure always wins.
107
·
--
Ішінара рас
Let's break down what's on deck for $CBRS Cerebras earnings tonight — this is how you read the setup before a binary event.
Expectations are clear: -$0.16 EPS, $214.7M revenue. Company's guiding $214M–$216M on their adjusted core revenue metric. Stock's at $100.59, down half a percent into the print.
Now here's the teaching moment: options are pricing a 13.2% move, which gives you a range of $87.73 to $114.43. That's your implied volatility envelope — the market's best guess at post-earnings swing based on premium paid. If it breaks outside that range, you had a real surprise. If it stays inside, the move was priced in.
What confirms the trade? Beat on revenue and guidance raise = reclaim $114 and hold. Miss or weak guidance = retest $87 support. Invalidation is simple: if it gaps and immediately reverses inside the range, the initial reaction was noise.
This is a binary event — no chart structure to lean on until after the print. Your edge is understanding the implied range and waiting for confirmation. Don't chase the gap. Let the first reaction settle, then trade the structure that forms. That's how you survive earnings without gambling.
Let's break down what's on deck for $CBRS Cerebras earnings tonight — this is how you read the setup before a binary event.
Expectations are clear: -$0.16 EPS, $214.7M revenue. Company's guiding $214M–$216M on their adjusted core revenue metric. Stock's at $100.59, down half a percent into the print.
Now here's the teaching moment: options are pricing a 13.2% move, which gives you a range of $87.73 to $114.43. That's your implied volatility envelope — the market's best guess at post-earnings swing based on premium paid. If it breaks outside that range, you had a real surprise. If it stays inside, the move was priced in.
What confirms the trade? Beat on revenue and guidance raise = reclaim $114 and hold. Miss or weak guidance = retest $87 support. Invalidation is simple: if it gaps and immediately reverses inside the range, the initial reaction was noise.
This is a binary event — no chart structure to lean on until after the print. Your edge is understanding the implied range and waiting for confirmation. Don't chase the gap. Let the first reaction settle, then trade the structure that forms. That's how you survive earnings without gambling.
Expectations are clear: -$0.16 EPS, $214.7M revenue. Company's guiding $214M–$216M on their adjusted core revenue metric. Stock's at $100.59, down half a percent into the print.
Now here's the teaching moment: options are pricing a 13.2% move, which gives you a range of $87.73 to $114.43. That's your implied volatility envelope — the market's best guess at post-earnings swing based on premium paid. If it breaks outside that range, you had a real surprise. If it stays inside, the move was priced in.
What confirms the trade? Beat on revenue and guidance raise = reclaim $114 and hold. Miss or weak guidance = retest $87 support. Invalidation is simple: if it gaps and immediately reverses inside the range, the initial reaction was noise.
This is a binary event — no chart structure to lean on until after the print. Your edge is understanding the implied range and waiting for confirmation. Don't chase the gap. Let the first reaction settle, then trade the structure that forms. That's how you survive earnings without gambling.
1
724
·
--
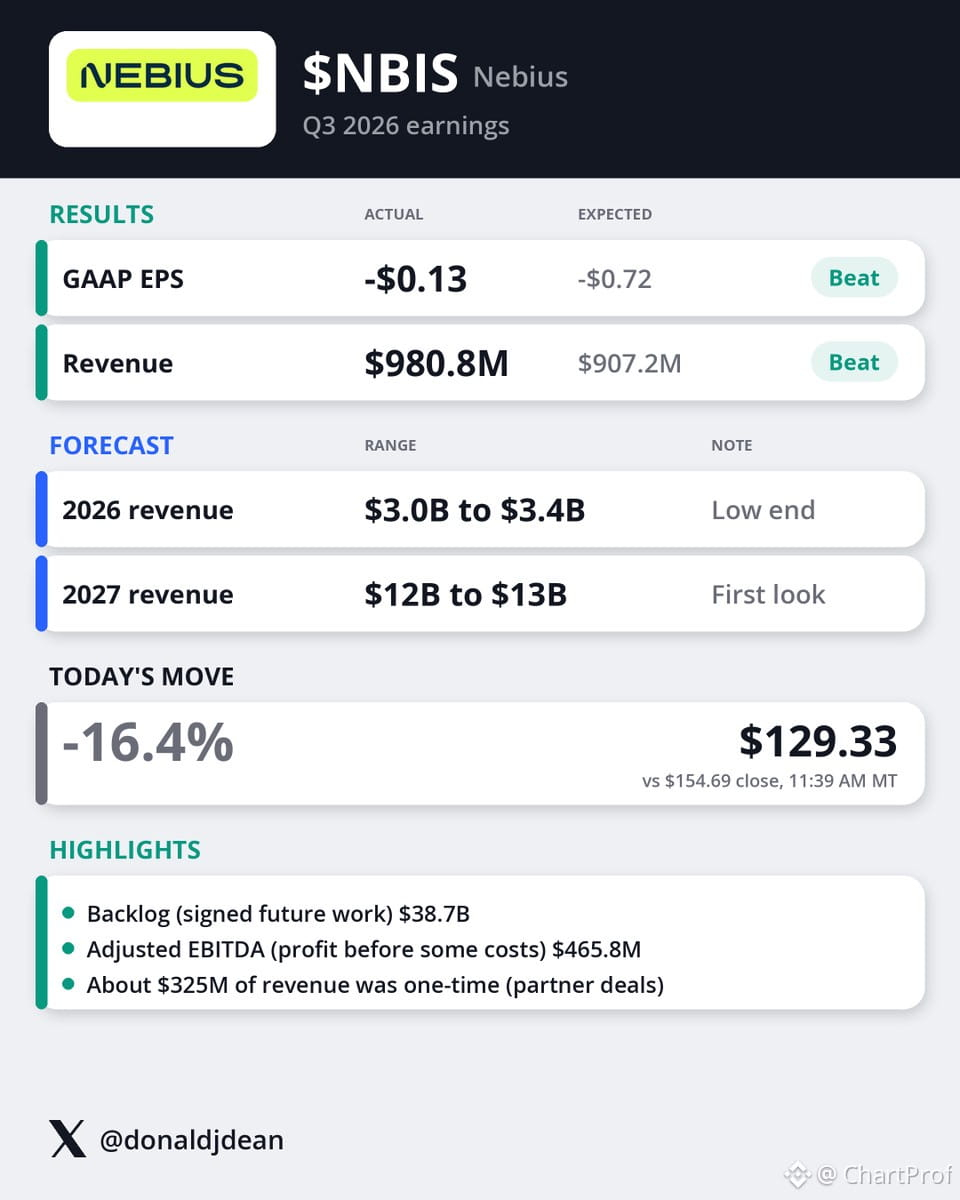
$NBIS Nebius just reported — and the headline beat hides a softer story.
Revenue came in at $980.8M vs $907.2M expected. Looks strong — until you see ~$325M was one-time. Strip that out and the core run rate is weaker than it appears.
GAAP EPS improved to -$0.13 vs -$0.72 expected, but still unprofitable.
The real concern: 2026 revenue guidance at the low end of $3.0B–$3.4B. That's cautious positioning, and the market's reacting accordingly.
Price action: down 16.4% today to $129.33.
What this tells us:
• Beat was padded by non-recurring revenue
• Forward guidance signals slower growth than bulls hoped
• Sellers are stepping in hard — this is a structure breakdown, not noise
Setup: If you're long, watch $125 as next support. Break below that and we're looking at $110–$115 zone. If you're short, this is a momentum fade setup — trail stops under each hourly lower high.
Invalidation: reclaim $140 with volume and the breakdown thesis is off.
This is a textbook example of why you read *through* the headline. The numbers matter, but the structure and guidance matter more.
$NBIS Nebius just reported — and the headline beat hides a softer story.
Revenue came in at $980.8M vs $907.2M expected. Looks strong — until you see ~$325M was one-time. Strip that out and the core run rate is weaker than it appears.
GAAP EPS improved to -$0.13 vs -$0.72 expected, but still unprofitable.
The real concern: 2026 revenue guidance at the low end of $3.0B–$3.4B. That's cautious positioning, and the market's reacting accordingly.
Price action: down 16.4% today to $129.33.
What this tells us:
• Beat was padded by non-recurring revenue
• Forward guidance signals slower growth than bulls hoped
• Sellers are stepping in hard — this is a structure breakdown, not noise
Setup: If you're long, watch $125 as next support. Break below that and we're looking at $110–$115 zone. If you're short, this is a momentum fade setup — trail stops under each hourly lower high.
Invalidation: reclaim $140 with volume and the breakdown thesis is off.
This is a textbook example of why you read *through* the headline. The numbers matter, but the structure and guidance matter more.
Revenue came in at $980.8M vs $907.2M expected. Looks strong — until you see ~$325M was one-time. Strip that out and the core run rate is weaker than it appears.
GAAP EPS improved to -$0.13 vs -$0.72 expected, but still unprofitable.
The real concern: 2026 revenue guidance at the low end of $3.0B–$3.4B. That's cautious positioning, and the market's reacting accordingly.
Price action: down 16.4% today to $129.33.
What this tells us:
• Beat was padded by non-recurring revenue
• Forward guidance signals slower growth than bulls hoped
• Sellers are stepping in hard — this is a structure breakdown, not noise
Setup: If you're long, watch $125 as next support. Break below that and we're looking at $110–$115 zone. If you're short, this is a momentum fade setup — trail stops under each hourly lower high.
Invalidation: reclaim $140 with volume and the breakdown thesis is off.
This is a textbook example of why you read *through* the headline. The numbers matter, but the structure and guidance matter more.
1
1
326
·
--
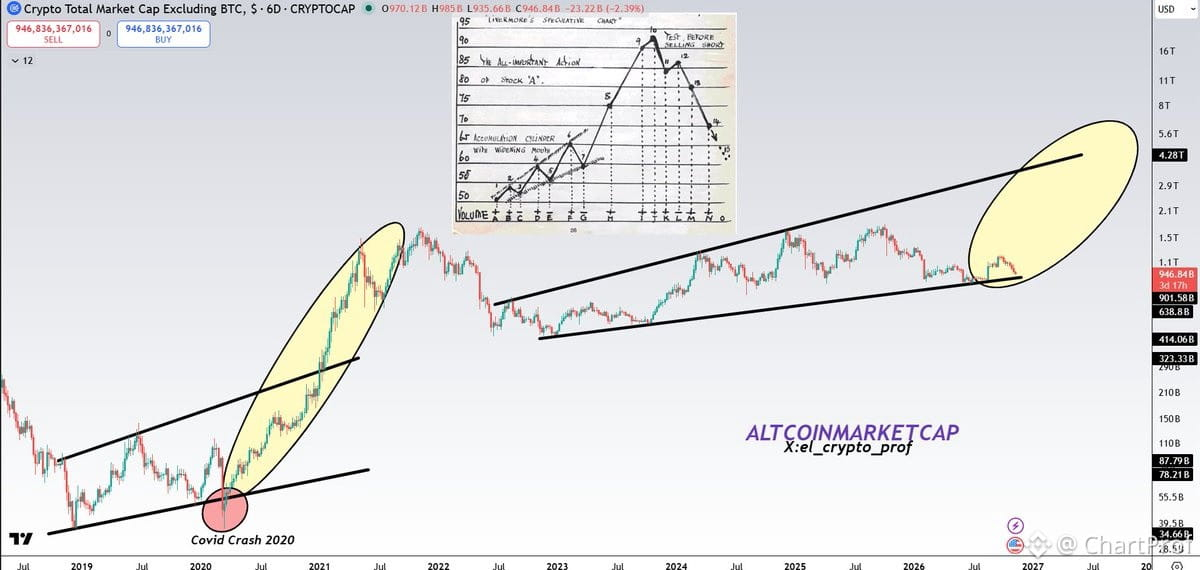
Let's walk through what this chart is actually showing — and why it matters for your positioning right now.
We're comparing the 2020/2021 altseason structure against the projected 2026/2027 cycle. Same fractal, same rhythm, different timeframe. The setup rhymes.
What you're seeing: a multi-year accumulation base, a breakout phase, then the explosive leg that defines altseason. The 2020/2021 run gave us 300–500% moves on quality alts after $BTC dominance peaked and rotated. We're now in the early-to-mid accumulation phase of the next cycle.
Why this matters: if the fractal holds, we're still 12–18 months away from the real fireworks. That means this isn't the time to chase. It's the time to build positions in solid alts while they're boring, while nobody's talking about them, while the structure is still forming.
Key levels to watch: $BTC dominance needs to top out and roll over. Altcoin market cap needs to reclaim previous cycle highs with conviction. Volume needs to confirm the breakout when it comes.
Invalidation: if $BTC dominance keeps climbing and alts can't hold their lows into 2025, the fractal breaks and we reassess.
Patience isn't passive — it's strategic. The best entries happen when the chart looks boring and the crowd isn't paying attention. This is that phase. Study the structure, build your watchlist, wait for confirmation.
Altseason will come. Just not today.
Let's walk through what this chart is actually showing — and why it matters for your positioning right now.
We're comparing the 2020/2021 altseason structure against the projected 2026/2027 cycle. Same fractal, same rhythm, different timeframe. The setup rhymes.
What you're seeing: a multi-year accumulation base, a breakout phase, then the explosive leg that defines altseason. The 2020/2021 run gave us 300–500% moves on quality alts after $BTC dominance peaked and rotated. We're now in the early-to-mid accumulation phase of the next cycle.
Why this matters: if the fractal holds, we're still 12–18 months away from the real fireworks. That means this isn't the time to chase. It's the time to build positions in solid alts while they're boring, while nobody's talking about them, while the structure is still forming.
Key levels to watch: $BTC dominance needs to top out and roll over. Altcoin market cap needs to reclaim previous cycle highs with conviction. Volume needs to confirm the breakout when it comes.
Invalidation: if $BTC dominance keeps climbing and alts can't hold their lows into 2025, the fractal breaks and we reassess.
Patience isn't passive — it's strategic. The best entries happen when the chart looks boring and the crowd isn't paying attention. This is that phase. Study the structure, build your watchlist, wait for confirmation.
Altseason will come. Just not today.
We're comparing the 2020/2021 altseason structure against the projected 2026/2027 cycle. Same fractal, same rhythm, different timeframe. The setup rhymes.
What you're seeing: a multi-year accumulation base, a breakout phase, then the explosive leg that defines altseason. The 2020/2021 run gave us 300–500% moves on quality alts after $BTC dominance peaked and rotated. We're now in the early-to-mid accumulation phase of the next cycle.
Why this matters: if the fractal holds, we're still 12–18 months away from the real fireworks. That means this isn't the time to chase. It's the time to build positions in solid alts while they're boring, while nobody's talking about them, while the structure is still forming.
Key levels to watch: $BTC dominance needs to top out and roll over. Altcoin market cap needs to reclaim previous cycle highs with conviction. Volume needs to confirm the breakout when it comes.
Invalidation: if $BTC dominance keeps climbing and alts can't hold their lows into 2025, the fractal breaks and we reassess.
Patience isn't passive — it's strategic. The best entries happen when the chart looks boring and the crowd isn't paying attention. This is that phase. Study the structure, build your watchlist, wait for confirmation.
Altseason will come. Just not today.
654
·
--
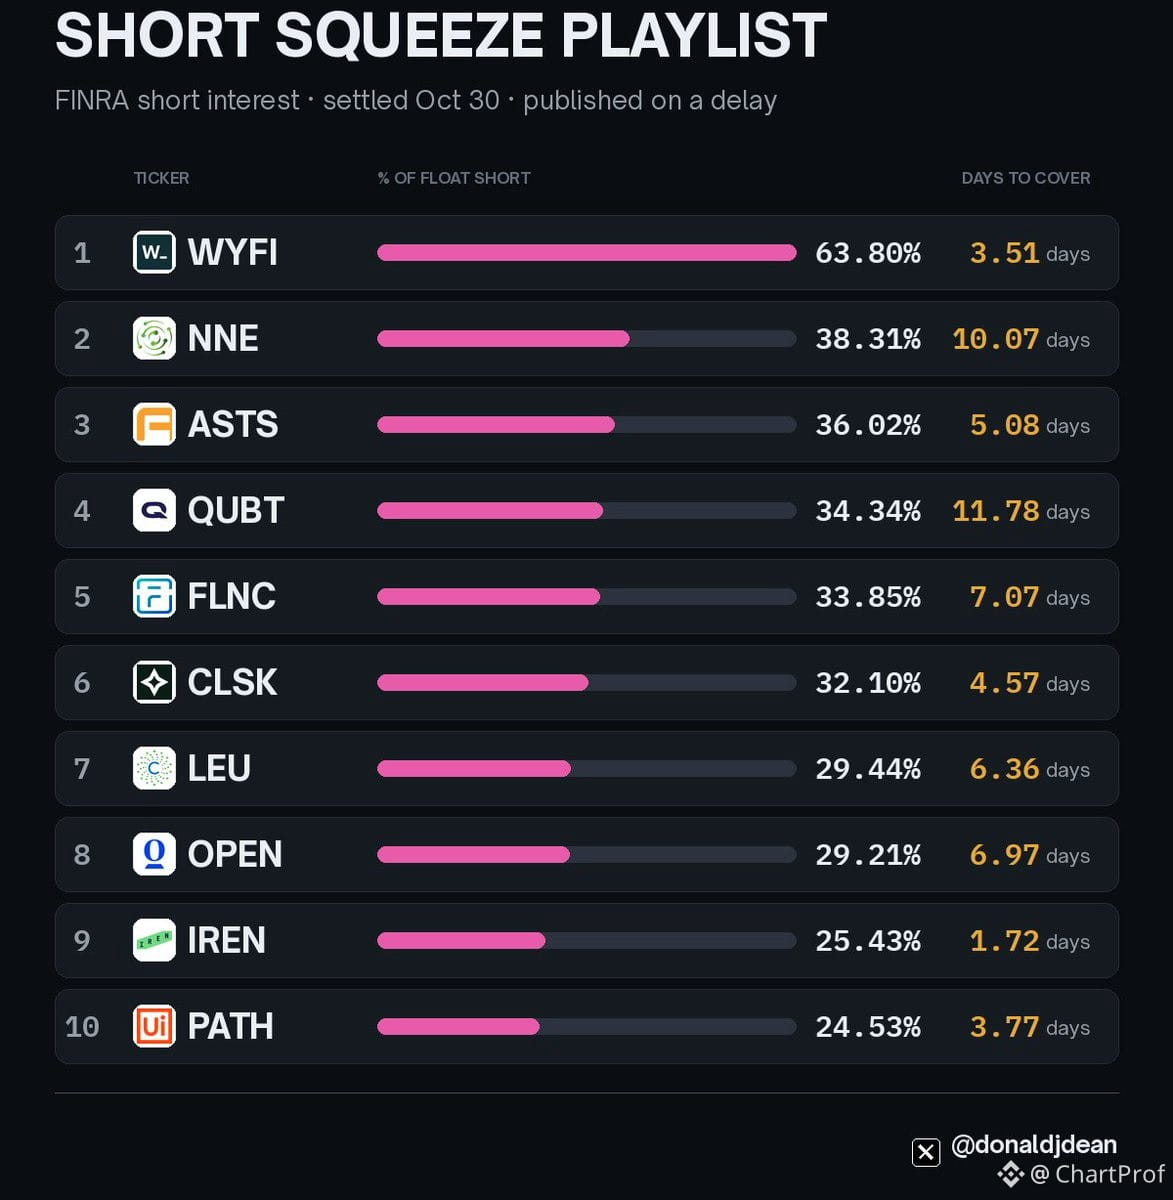
Short Squeeze Watch — 10 Names Under Pressure
Let's break down what these numbers actually mean. Short interest = percentage of float sold short. Days to cover = how long it'd take shorts to exit at normal volume. High short interest + low liquidity = potential for violent squeezes if momentum flips.
Here's the lineup (FINRA data, settled Oct 30):
$WYFI WhiteFiber — 63.80% short, 3.51 days to cover
$NNE Nano Nuclear — 38.31% short, 10.07 days
$ASTS AST SpaceMobile — 36.02% short, 5.08 days
$QUBT Quantum Computing — 34.34% short, 11.78 days
$FLNC Fluence — 33.85% short, 7.07 days
$CLSK CleanSpark — 32.10% short, 4.57 days
$LEU Centrus — 29.44% short, 6.36 days
$OPEN Opendoor — 29.21% short, 6.97 days
$IREN IREN — 25.43% short, 1.72 days
$PATH UiPath — 24.53% short, 3.77 days
What to watch: Names with high short interest + extended days to cover are powder kegs if buyers step in. $NNE and $QUBT stand out — over 10 days to cover means shorts can't exit fast. That's where squeezes get nasty.
The setup: You're not chasing these blind. Wait for a clean break above resistance + volume spike. That's when shorts panic and fuel the move. No confirmation = no trade.
Invalidation: If these names keep grinding lower on no volume, shorts are in control. Squeeze setups die when there's no buying pressure to force covering.
Short Squeeze Watch — 10 Names Under Pressure
Let's break down what these numbers actually mean. Short interest = percentage of float sold short. Days to cover = how long it'd take shorts to exit at normal volume. High short interest + low liquidity = potential for violent squeezes if momentum flips.
Here's the lineup (FINRA data, settled Oct 30):
$WYFI WhiteFiber — 63.80% short, 3.51 days to cover
$NNE Nano Nuclear — 38.31% short, 10.07 days
$ASTS AST SpaceMobile — 36.02% short, 5.08 days
$QUBT Quantum Computing — 34.34% short, 11.78 days
$FLNC Fluence — 33.85% short, 7.07 days
$CLSK CleanSpark — 32.10% short, 4.57 days
$LEU Centrus — 29.44% short, 6.36 days
$OPEN Opendoor — 29.21% short, 6.97 days
$IREN IREN — 25.43% short, 1.72 days
$PATH UiPath — 24.53% short, 3.77 days
What to watch: Names with high short interest + extended days to cover are powder kegs if buyers step in. $NNE and $QUBT stand out — over 10 days to cover means shorts can't exit fast. That's where squeezes get nasty.
The setup: You're not chasing these blind. Wait for a clean break above resistance + volume spike. That's when shorts panic and fuel the move. No confirmation = no trade.
Invalidation: If these names keep grinding lower on no volume, shorts are in control. Squeeze setups die when there's no buying pressure to force covering.
Let's break down what these numbers actually mean. Short interest = percentage of float sold short. Days to cover = how long it'd take shorts to exit at normal volume. High short interest + low liquidity = potential for violent squeezes if momentum flips.
Here's the lineup (FINRA data, settled Oct 30):
$WYFI WhiteFiber — 63.80% short, 3.51 days to cover
$NNE Nano Nuclear — 38.31% short, 10.07 days
$ASTS AST SpaceMobile — 36.02% short, 5.08 days
$QUBT Quantum Computing — 34.34% short, 11.78 days
$FLNC Fluence — 33.85% short, 7.07 days
$CLSK CleanSpark — 32.10% short, 4.57 days
$LEU Centrus — 29.44% short, 6.36 days
$OPEN Opendoor — 29.21% short, 6.97 days
$IREN IREN — 25.43% short, 1.72 days
$PATH UiPath — 24.53% short, 3.77 days
What to watch: Names with high short interest + extended days to cover are powder kegs if buyers step in. $NNE and $QUBT stand out — over 10 days to cover means shorts can't exit fast. That's where squeezes get nasty.
The setup: You're not chasing these blind. Wait for a clean break above resistance + volume spike. That's when shorts panic and fuel the move. No confirmation = no trade.
Invalidation: If these names keep grinding lower on no volume, shorts are in control. Squeeze setups die when there's no buying pressure to force covering.
1
272
·
--
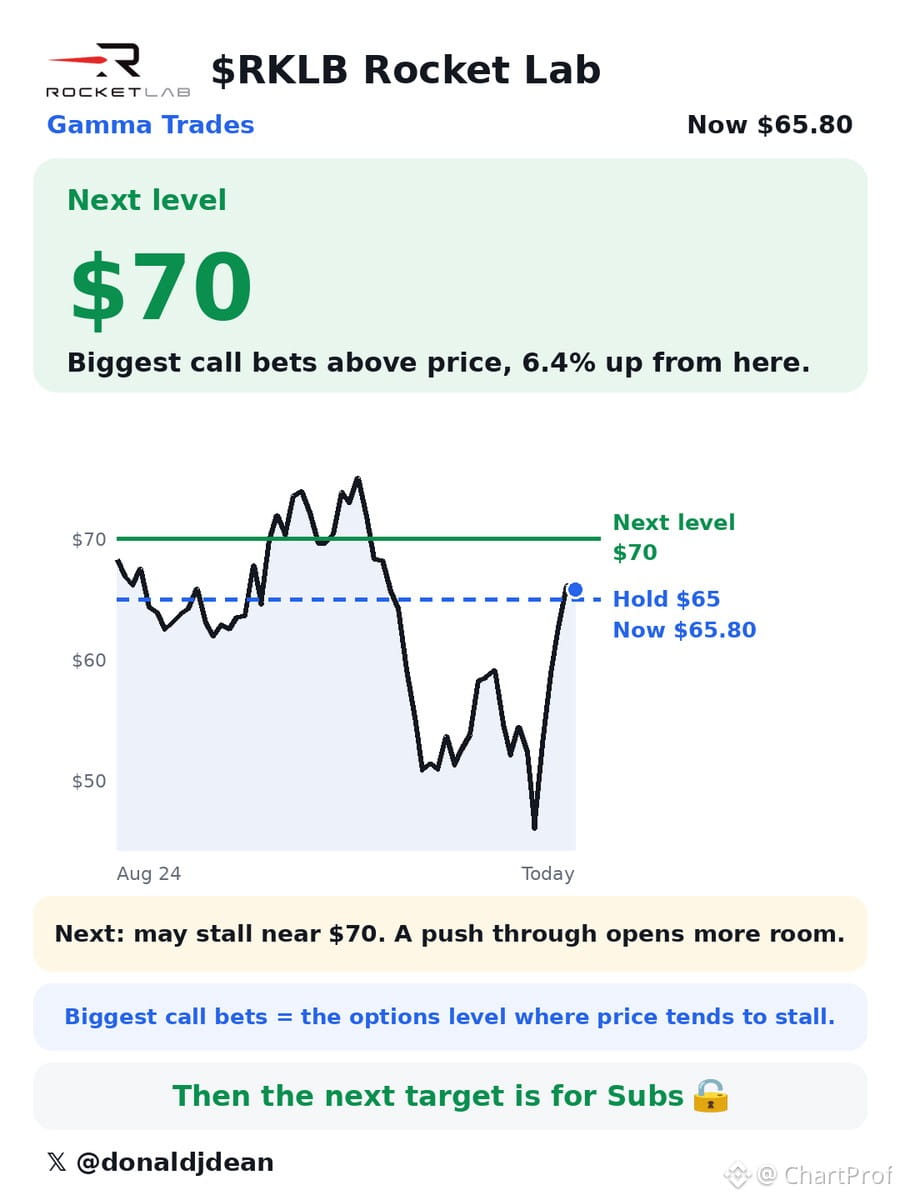
$RKLB holding structure above $65 — that's your line. Break it, setup's dead. Hold it, and $70 is the next clean level where heavy call flow sits. That's not a guess — that's where the bets are stacked.
Why it matters: $65 is acting as your demand zone. Price respects it, buyers defend it, momentum stays intact. Lose $65 and you're back in no-man's-land — no structure, no edge.
$70 is resistance and magnet. Call open interest tells you where the crowd expects price to move. That's your target if structure holds.
Setup:
• Support: $65
• Target: $70
• Invalidation: Close below $65
Clean risk, clean reward. Trade the structure, not the story.
$RKLB holding structure above $65 — that's your line. Break it, setup's dead. Hold it, and $70 is the next clean level where heavy call flow sits. That's not a guess — that's where the bets are stacked.
Why it matters: $65 is acting as your demand zone. Price respects it, buyers defend it, momentum stays intact. Lose $65 and you're back in no-man's-land — no structure, no edge.
$70 is resistance and magnet. Call open interest tells you where the crowd expects price to move. That's your target if structure holds.
Setup:
• Support: $65
• Target: $70
• Invalidation: Close below $65
Clean risk, clean reward. Trade the structure, not the story.
Why it matters: $65 is acting as your demand zone. Price respects it, buyers defend it, momentum stays intact. Lose $65 and you're back in no-man's-land — no structure, no edge.
$70 is resistance and magnet. Call open interest tells you where the crowd expects price to move. That's your target if structure holds.
Setup:
• Support: $65
• Target: $70
• Invalidation: Close below $65
Clean risk, clean reward. Trade the structure, not the story.
305
·
--
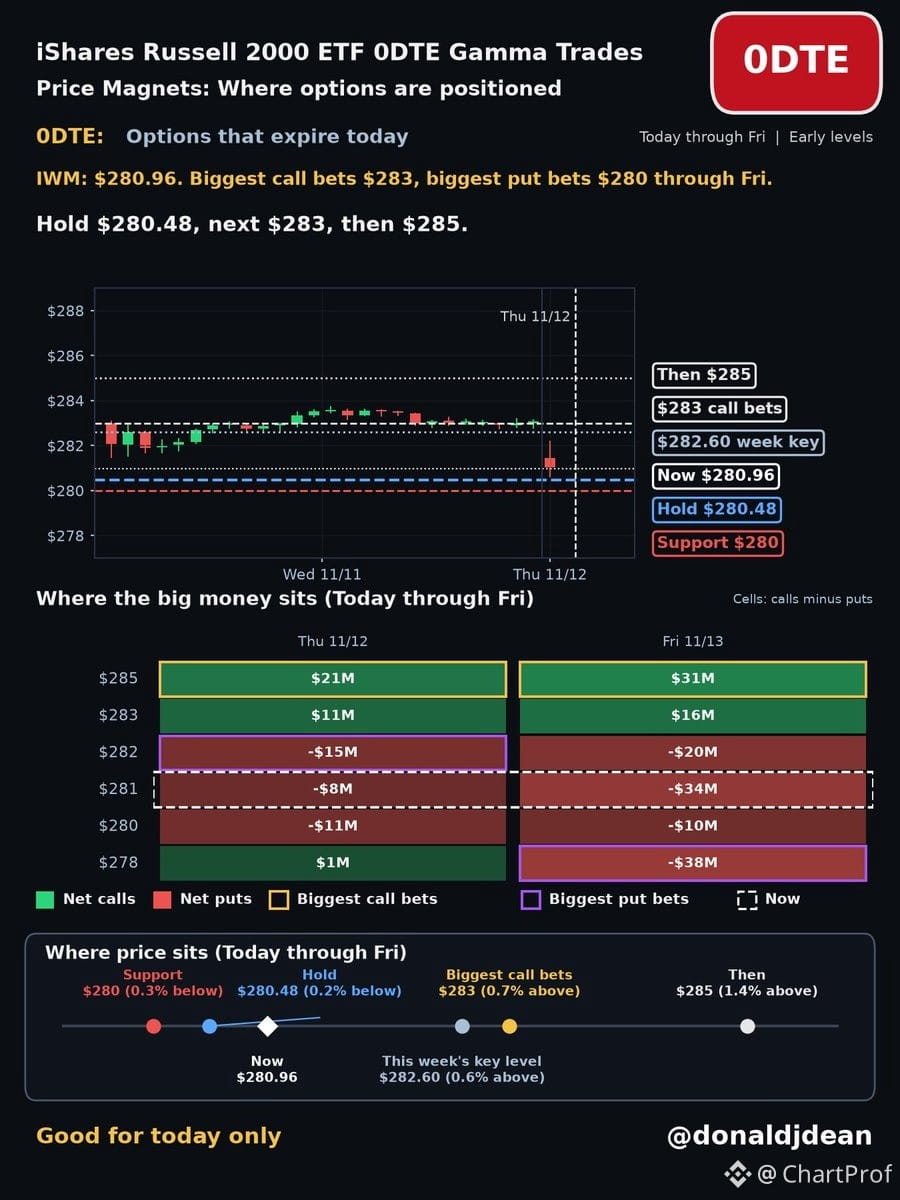
Reading $IWM Russell 2000 0DTE gamma structure:
Price magnets tell you where dealer hedging flows concentrate. Think of gamma as the market's steering wheel — high gamma zones pull price like gravity.
Current anchor: $280.48 — this is your structural hold. Dealers are hedged here, so price wants to defend it.
Next magnet: $283 — if we break above $280.48 with volume, gamma flips and dealers chase upside to rehedge. That's your first target.
Extension: $285 — secondary gamma cluster. If $283 breaks clean, momentum carries into this zone.
How to trade it: Watch $280.48 as your line. Above it, you're long into $283. Below it, structure breaks and you step aside. Gamma trades aren't predictions — they're probability maps. Follow the structure, respect the levels, manage the risk.
Reading $IWM Russell 2000 0DTE gamma structure:
Price magnets tell you where dealer hedging flows concentrate. Think of gamma as the market's steering wheel — high gamma zones pull price like gravity.
Current anchor: $280.48 — this is your structural hold. Dealers are hedged here, so price wants to defend it.
Next magnet: $283 — if we break above $280.48 with volume, gamma flips and dealers chase upside to rehedge. That's your first target.
Extension: $285 — secondary gamma cluster. If $283 breaks clean, momentum carries into this zone.
How to trade it: Watch $280.48 as your line. Above it, you're long into $283. Below it, structure breaks and you step aside. Gamma trades aren't predictions — they're probability maps. Follow the structure, respect the levels, manage the risk.
Price magnets tell you where dealer hedging flows concentrate. Think of gamma as the market's steering wheel — high gamma zones pull price like gravity.
Current anchor: $280.48 — this is your structural hold. Dealers are hedged here, so price wants to defend it.
Next magnet: $283 — if we break above $280.48 with volume, gamma flips and dealers chase upside to rehedge. That's your first target.
Extension: $285 — secondary gamma cluster. If $283 breaks clean, momentum carries into this zone.
How to trade it: Watch $280.48 as your line. Above it, you're long into $283. Below it, structure breaks and you step aside. Gamma trades aren't predictions — they're probability maps. Follow the structure, respect the levels, manage the risk.
222
·
--
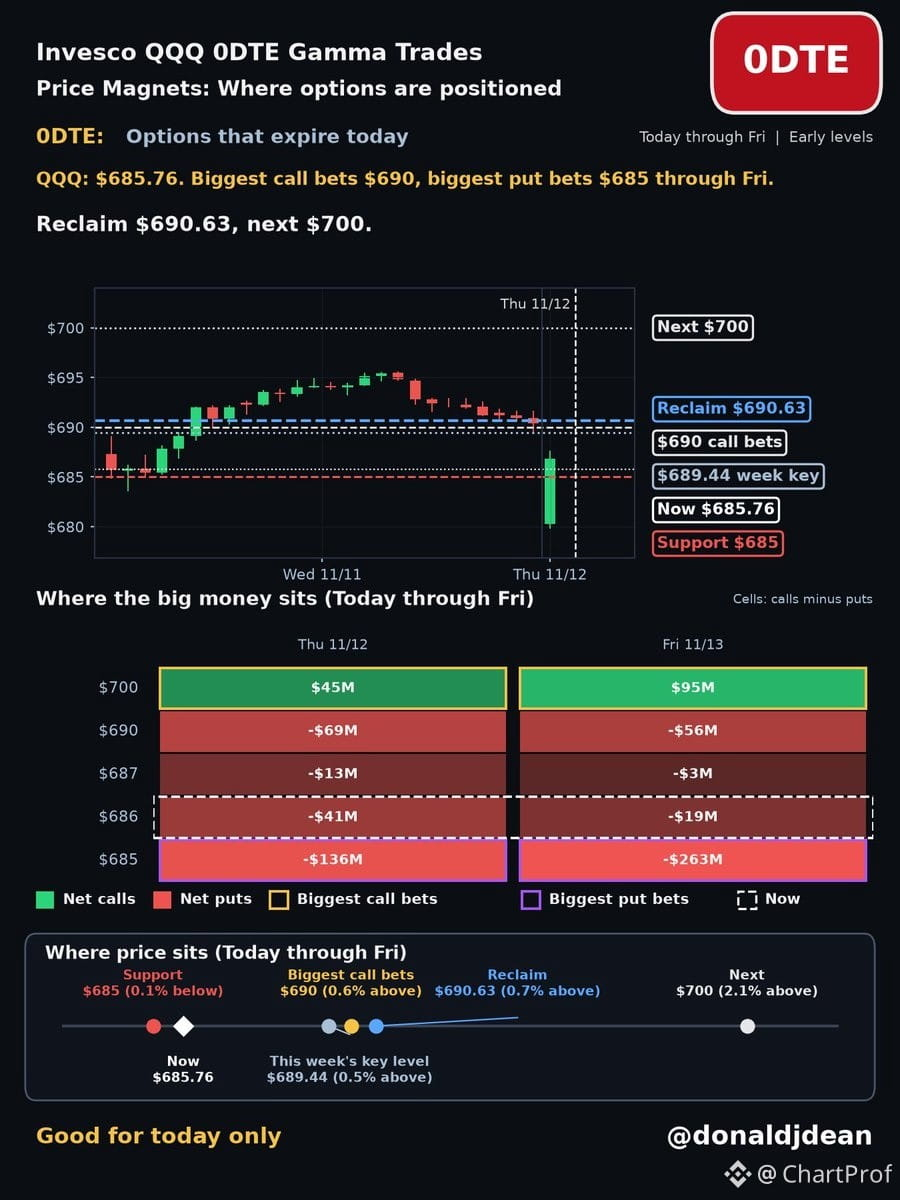
Looking at $QQQ 0DTE gamma structure here. Price magnets tell you where dealer hedging flows will push or pull price as expiry approaches.
Key level to watch: $690.63. If we reclaim that, the path opens toward $700. That's your next magnet.
Why it matters: Heavy gamma concentration at strikes creates reflexive flows. Dealers hedge in the direction of the move, amplifying momentum. Below $690.63, you lose that pull. Above it, $700 becomes magnetic.
Structure is simple: reclaim confirms, failure invalidates. Watch how price respects these levels into the close.
Looking at $QQQ 0DTE gamma structure here. Price magnets tell you where dealer hedging flows will push or pull price as expiry approaches.
Key level to watch: $690.63. If we reclaim that, the path opens toward $700. That's your next magnet.
Why it matters: Heavy gamma concentration at strikes creates reflexive flows. Dealers hedge in the direction of the move, amplifying momentum. Below $690.63, you lose that pull. Above it, $700 becomes magnetic.
Structure is simple: reclaim confirms, failure invalidates. Watch how price respects these levels into the close.
Key level to watch: $690.63. If we reclaim that, the path opens toward $700. That's your next magnet.
Why it matters: Heavy gamma concentration at strikes creates reflexive flows. Dealers hedge in the direction of the move, amplifying momentum. Below $690.63, you lose that pull. Above it, $700 becomes magnetic.
Structure is simple: reclaim confirms, failure invalidates. Watch how price respects these levels into the close.
296
·
--
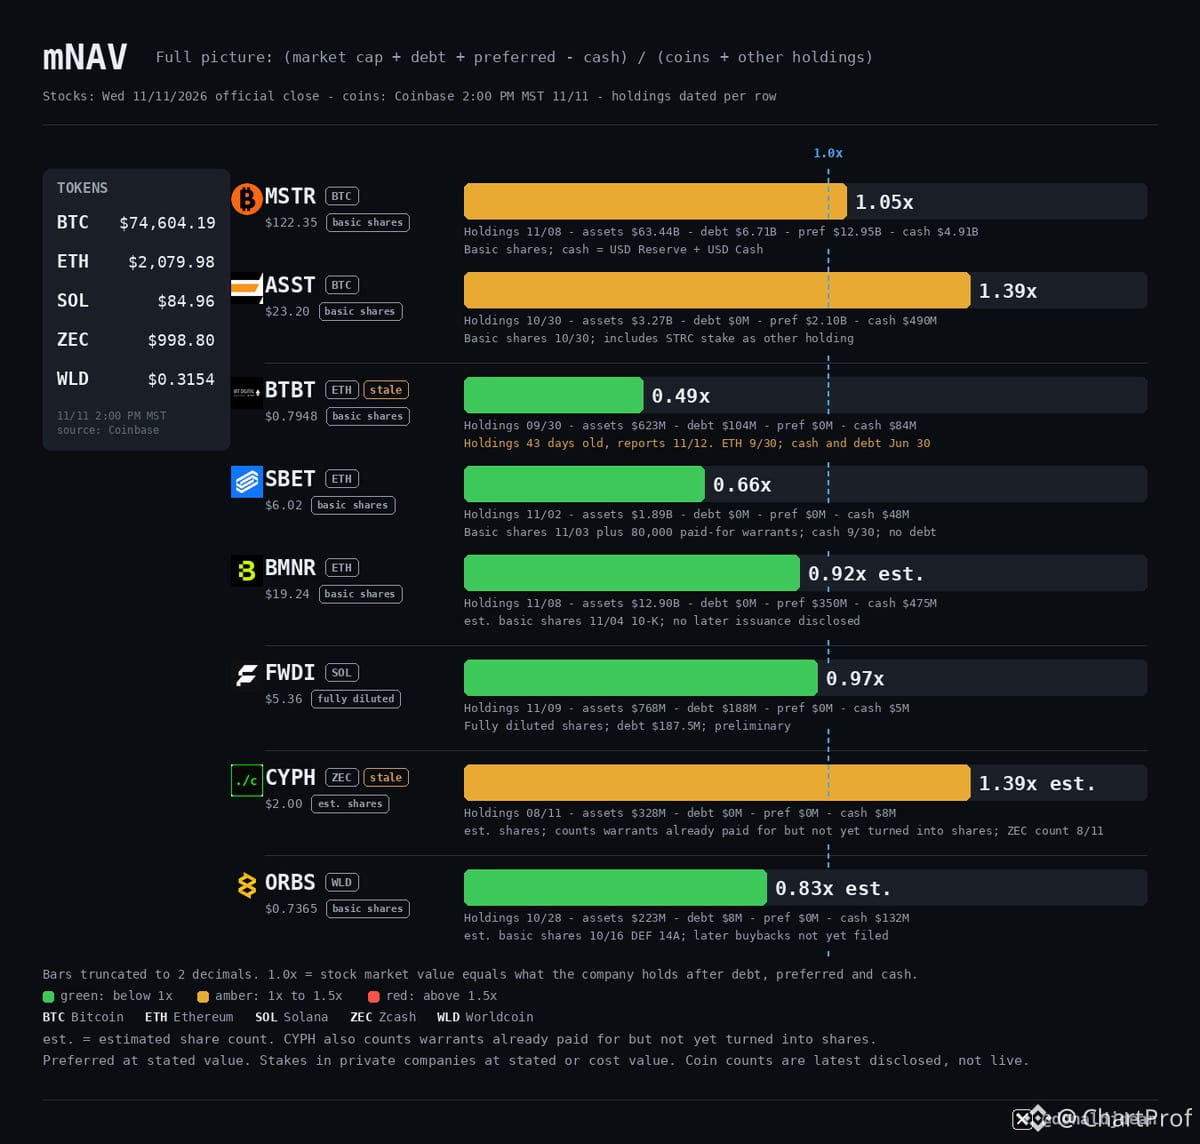
Crypto treasury stock valuations by coin holdings — clean mNAV breakdown.
$SBET Sharplink trades at the sharpest real discount: 0.66x on fresh holdings. $FWDI Forward Industries sits at 0.97x, $MSTR Strategy at 1.05x, $ASST Strive at 1.39x. $BTBT Bit Digital prints 0.49x, but those holdings are 43 days stale — updates after its 11/12 report.
Each bar shows market cap plus debt and preferred, minus cash, divided by coin and asset holdings. Under 1.0x means the stock trades below net asset value. $BMNR BitMine prints 0.92x est., $ORBS Eightco 0.83x est. — both using estimated share counts. $CYPH Cypherpunk prints 1.39x est., counting warrants already paid but not yet converted. $CYPH holdings are over 30 days old.
This is how you read corporate coin exposure — not hype, just structure. Know what you're buying and what discount you're getting. If mNAV is under 1.0x and holdings are fresh, you're buying coins at a discount through equity. If it's stale or over 1.0x, you're paying a premium or betting on execution. Always check the date on the holdings and the debt load. Clean structure, clear edge.
Crypto treasury stock valuations by coin holdings — clean mNAV breakdown.
$SBET Sharplink trades at the sharpest real discount: 0.66x on fresh holdings. $FWDI Forward Industries sits at 0.97x, $MSTR Strategy at 1.05x, $ASST Strive at 1.39x. $BTBT Bit Digital prints 0.49x, but those holdings are 43 days stale — updates after its 11/12 report.
Each bar shows market cap plus debt and preferred, minus cash, divided by coin and asset holdings. Under 1.0x means the stock trades below net asset value. $BMNR BitMine prints 0.92x est., $ORBS Eightco 0.83x est. — both using estimated share counts. $CYPH Cypherpunk prints 1.39x est., counting warrants already paid but not yet converted. $CYPH holdings are over 30 days old.
This is how you read corporate coin exposure — not hype, just structure. Know what you're buying and what discount you're getting. If mNAV is under 1.0x and holdings are fresh, you're buying coins at a discount through equity. If it's stale or over 1.0x, you're paying a premium or betting on execution. Always check the date on the holdings and the debt load. Clean structure, clear edge.
$SBET Sharplink trades at the sharpest real discount: 0.66x on fresh holdings. $FWDI Forward Industries sits at 0.97x, $MSTR Strategy at 1.05x, $ASST Strive at 1.39x. $BTBT Bit Digital prints 0.49x, but those holdings are 43 days stale — updates after its 11/12 report.
Each bar shows market cap plus debt and preferred, minus cash, divided by coin and asset holdings. Under 1.0x means the stock trades below net asset value. $BMNR BitMine prints 0.92x est., $ORBS Eightco 0.83x est. — both using estimated share counts. $CYPH Cypherpunk prints 1.39x est., counting warrants already paid but not yet converted. $CYPH holdings are over 30 days old.
This is how you read corporate coin exposure — not hype, just structure. Know what you're buying and what discount you're getting. If mNAV is under 1.0x and holdings are fresh, you're buying coins at a discount through equity. If it's stale or over 1.0x, you're paying a premium or betting on execution. Always check the date on the holdings and the debt load. Clean structure, clear edge.
323
·
--
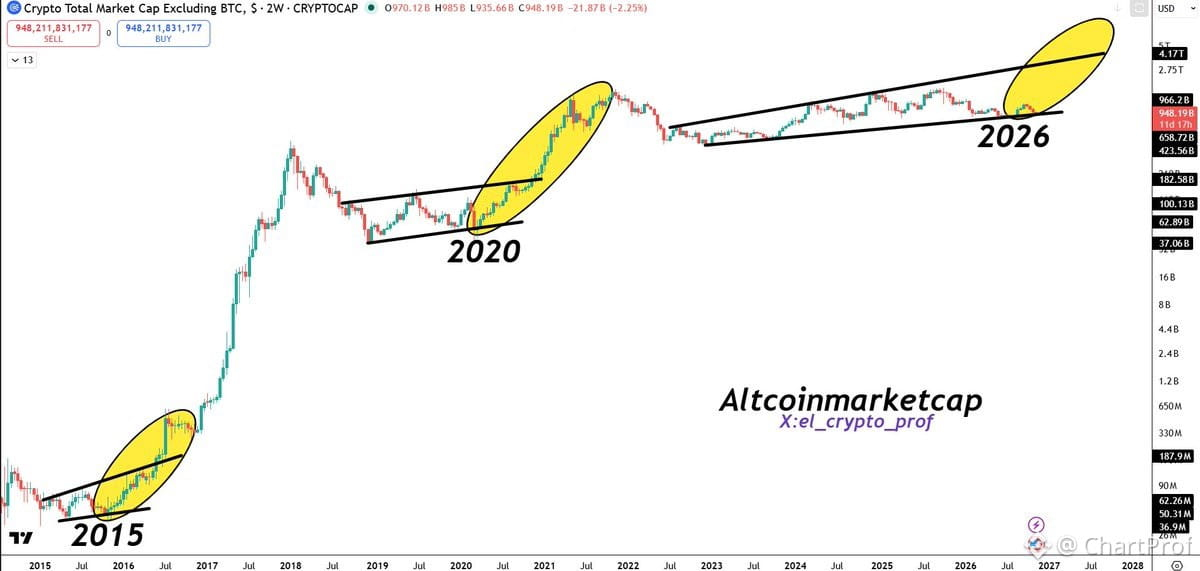
TOTAL2 breaking structure again — that's your altcoin market cap ex-$BTC.
When this chart starts climbing with conviction, it's not just one coin — it's the whole alt complex getting bid. We're seeing clean higher lows, volume confirmation, and the kind of structure that precedes rotation out of $BTC dominance.
What matters here: watch how alts respond on the next $BTC pullback. If TOTAL2 holds support while $BTC consolidates, that's your signal that capital is staying in alts, not fleeing back to safety.
Setup is simple — alts are setting up for a run. Trade the leaders in their sectors, respect your stops, and don't chase the laggards. Good times ahead when the structure is this clean.
TOTAL2 breaking structure again — that's your altcoin market cap ex-$BTC.
When this chart starts climbing with conviction, it's not just one coin — it's the whole alt complex getting bid. We're seeing clean higher lows, volume confirmation, and the kind of structure that precedes rotation out of $BTC dominance.
What matters here: watch how alts respond on the next $BTC pullback. If TOTAL2 holds support while $BTC consolidates, that's your signal that capital is staying in alts, not fleeing back to safety.
Setup is simple — alts are setting up for a run. Trade the leaders in their sectors, respect your stops, and don't chase the laggards. Good times ahead when the structure is this clean.
When this chart starts climbing with conviction, it's not just one coin — it's the whole alt complex getting bid. We're seeing clean higher lows, volume confirmation, and the kind of structure that precedes rotation out of $BTC dominance.
What matters here: watch how alts respond on the next $BTC pullback. If TOTAL2 holds support while $BTC consolidates, that's your signal that capital is staying in alts, not fleeing back to safety.
Setup is simple — alts are setting up for a run. Trade the leaders in their sectors, respect your stops, and don't chase the laggards. Good times ahead when the structure is this clean.
1.1k
·
--
$TSLA sitting above the .382 Fib at $374 and testing a major Volume Shelf between $400-$410. This is the zone where the most shares have changed hands — high-conviction area. If it clears $410, that's your structural breakout. Next resistance comes at $421.88, then $455.72.
Fib structure:
$344.92 → $374.33 → $398.11 → $421.88 → $455.72 → $498.83
Extension target: $553.62
Volume Shelf is the teaching moment here. When price consolidates in a tight range with heavy volume, it shows agreement. Breaking above it means buyers absorbed all available supply at that level. That's what creates momentum moves — not hype, but structural clearing.
Watch $410. Above it, you're long with conviction. Below $374, the setup fails and you're back to waiting for structure to rebuild.
$TSLA sitting above the .382 Fib at $374 and testing a major Volume Shelf between $400-$410. This is the zone where the most shares have changed hands — high-conviction area. If it clears $410, that's your structural breakout. Next resistance comes at $421.88, then $455.72.
Fib structure:
$344.92 → $374.33 → $398.11 → $421.88 → $455.72 → $498.83
Extension target: $553.62
Volume Shelf is the teaching moment here. When price consolidates in a tight range with heavy volume, it shows agreement. Breaking above it means buyers absorbed all available supply at that level. That's what creates momentum moves — not hype, but structural clearing.
Watch $410. Above it, you're long with conviction. Below $374, the setup fails and you're back to waiting for structure to rebuild.
Fib structure:
$344.92 → $374.33 → $398.11 → $421.88 → $455.72 → $498.83
Extension target: $553.62
Volume Shelf is the teaching moment here. When price consolidates in a tight range with heavy volume, it shows agreement. Breaking above it means buyers absorbed all available supply at that level. That's what creates momentum moves — not hype, but structural clearing.
Watch $410. Above it, you're long with conviction. Below $374, the setup fails and you're back to waiting for structure to rebuild.
15
·
--
$TSLA sitting above the .382 Fib at $374 and testing a major Volume Shelf between $400-$410. This is the zone where the most shares have changed hands — high-conviction area. If it clears $410, that's your structural breakout. Next resistance comes at $421.88, then $455.72.
Fib structure:
$344.92 → $374.33 → $398.11 → $421.88 → $455.72 → $498.83
Extension target: $553.62
Volume Shelf is the teaching moment here. When price consolidates in a tight range with heavy volume, it shows agreement. Breaking above it means buyers absorbed all available supply at that level. That's what creates momentum moves — not hype, but structural clearing.
Watch $410. Above it, you're long with conviction. Below $374, the setup fails and you're back to waiting for structure to rebuild.
$TSLA sitting above the .382 Fib at $374 and testing a major Volume Shelf between $400-$410. This is the zone where the most shares have changed hands — high-conviction area. If it clears $410, that's your structural breakout. Next resistance comes at $421.88, then $455.72.
Fib structure:
$344.92 → $374.33 → $398.11 → $421.88 → $455.72 → $498.83
Extension target: $553.62
Volume Shelf is the teaching moment here. When price consolidates in a tight range with heavy volume, it shows agreement. Breaking above it means buyers absorbed all available supply at that level. That's what creates momentum moves — not hype, but structural clearing.
Watch $410. Above it, you're long with conviction. Below $374, the setup fails and you're back to waiting for structure to rebuild.
Fib structure:
$344.92 → $374.33 → $398.11 → $421.88 → $455.72 → $498.83
Extension target: $553.62
Volume Shelf is the teaching moment here. When price consolidates in a tight range with heavy volume, it shows agreement. Breaking above it means buyers absorbed all available supply at that level. That's what creates momentum moves — not hype, but structural clearing.
Watch $410. Above it, you're long with conviction. Below $374, the setup fails and you're back to waiting for structure to rebuild.
46
·
--
$HUT bounced clean off the bottom of its falling channel and now eyeing the .236 Fib at $65.36. Break that and we're looking at $79.78 next.
What matters here: Volume Shelf sitting at $45–$55 acts as your structural support. That's where buyers stepped in heavy before, so as long as price holds above that zone, the setup stays intact.
Fib ladder above: $65.36 → $79.78 → $91.43 → $103.08 → $119.67 → $140.80. Each level is a potential resistance where you'd expect profit-taking or hesitation.
Invalidation is simple: lose the Volume Shelf and the bounce thesis breaks. Until then, watch how it reacts at $65.36 — that's your first real test of strength.
$HUT bounced clean off the bottom of its falling channel and now eyeing the .236 Fib at $65.36. Break that and we're looking at $79.78 next.
What matters here: Volume Shelf sitting at $45–$55 acts as your structural support. That's where buyers stepped in heavy before, so as long as price holds above that zone, the setup stays intact.
Fib ladder above: $65.36 → $79.78 → $91.43 → $103.08 → $119.67 → $140.80. Each level is a potential resistance where you'd expect profit-taking or hesitation.
Invalidation is simple: lose the Volume Shelf and the bounce thesis breaks. Until then, watch how it reacts at $65.36 — that's your first real test of strength.
What matters here: Volume Shelf sitting at $45–$55 acts as your structural support. That's where buyers stepped in heavy before, so as long as price holds above that zone, the setup stays intact.
Fib ladder above: $65.36 → $79.78 → $91.43 → $103.08 → $119.67 → $140.80. Each level is a potential resistance where you'd expect profit-taking or hesitation.
Invalidation is simple: lose the Volume Shelf and the bounce thesis breaks. Until then, watch how it reacts at $65.36 — that's your first real test of strength.
50
·
--
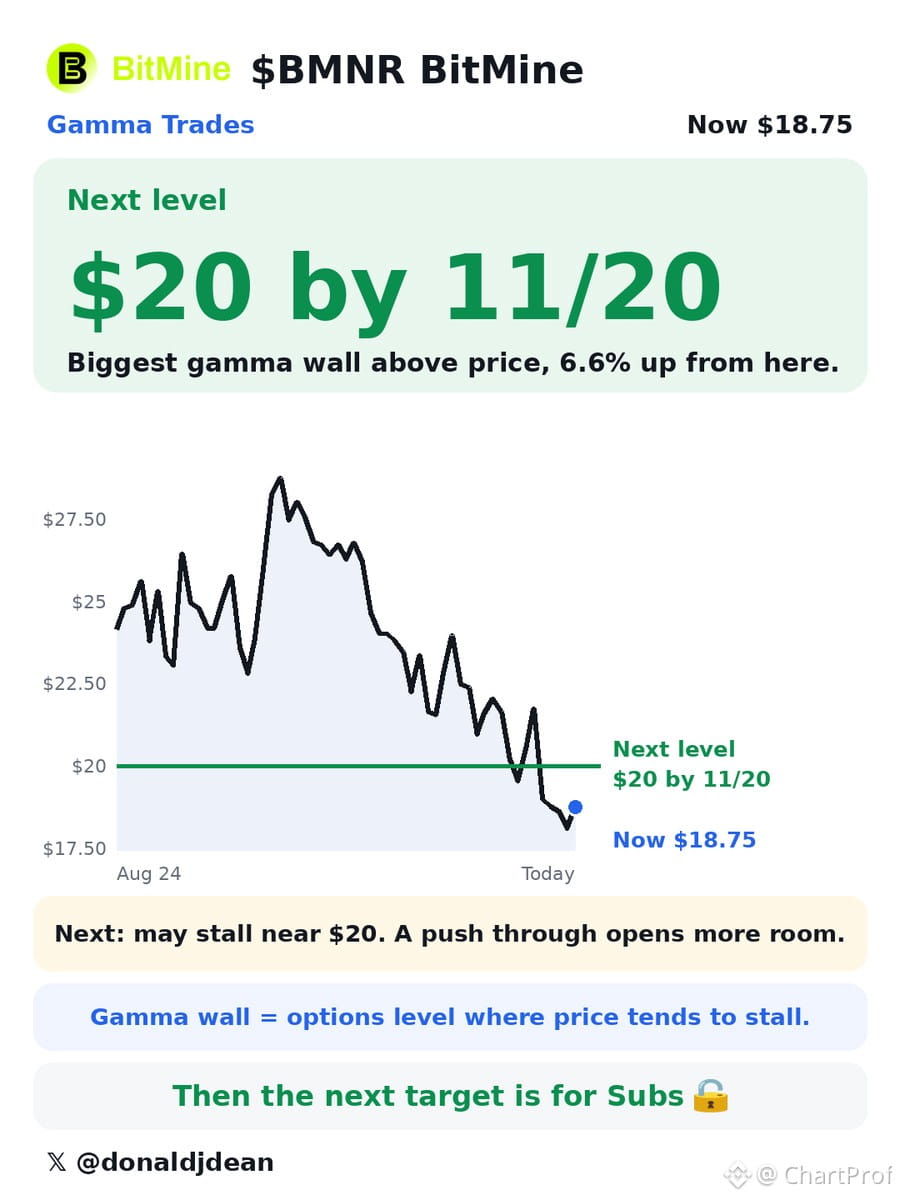
$BMNR targeting $20 — clean options setup
BitMine's biggest options cluster above price sits at $20 for 11/20 expiry. That's the magnet. When dealer positioning stacks heavy at one strike, price tends to get pulled there as expiry nears — especially if delta hedging flows align.
Here's the read:
The $20 level isn't random. It's where open interest is concentrated, meaning dealers and market makers have exposure there. As we approach 11/20, if $BMNR holds momentum and stays bid, that strike becomes the next logical target. Think of it as a gravity well — options mechanics can drive spot price toward max pain or max gamma, depending on positioning.
What confirms the move:
- Sustained buying pressure into resistance
- Volume expansion as we approach $20
- Time decay working in favor of call holders if we stay elevated
What invalidates:
- Breakdown below prior consolidation support
- Volume dries up before reaching the level
- Broader market weakness that drags risk assets lower
This is textbook options-driven price action. The structure is clean, the target is defined, and the timeline is set. Watch how price behaves as we approach — if it stalls early, reassess. If it pushes through with conviction, $20 becomes the next chapter.
Trade what you see, not what you hope.
$BMNR targeting $20 — clean options setup
BitMine's biggest options cluster above price sits at $20 for 11/20 expiry. That's the magnet. When dealer positioning stacks heavy at one strike, price tends to get pulled there as expiry nears — especially if delta hedging flows align.
Here's the read:
The $20 level isn't random. It's where open interest is concentrated, meaning dealers and market makers have exposure there. As we approach 11/20, if $BMNR holds momentum and stays bid, that strike becomes the next logical target. Think of it as a gravity well — options mechanics can drive spot price toward max pain or max gamma, depending on positioning.
What confirms the move:
- Sustained buying pressure into resistance
- Volume expansion as we approach $20
- Time decay working in favor of call holders if we stay elevated
What invalidates:
- Breakdown below prior consolidation support
- Volume dries up before reaching the level
- Broader market weakness that drags risk assets lower
This is textbook options-driven price action. The structure is clean, the target is defined, and the timeline is set. Watch how price behaves as we approach — if it stalls early, reassess. If it pushes through with conviction, $20 becomes the next chapter.
Trade what you see, not what you hope.
BitMine's biggest options cluster above price sits at $20 for 11/20 expiry. That's the magnet. When dealer positioning stacks heavy at one strike, price tends to get pulled there as expiry nears — especially if delta hedging flows align.
Here's the read:
The $20 level isn't random. It's where open interest is concentrated, meaning dealers and market makers have exposure there. As we approach 11/20, if $BMNR holds momentum and stays bid, that strike becomes the next logical target. Think of it as a gravity well — options mechanics can drive spot price toward max pain or max gamma, depending on positioning.
What confirms the move:
- Sustained buying pressure into resistance
- Volume expansion as we approach $20
- Time decay working in favor of call holders if we stay elevated
What invalidates:
- Breakdown below prior consolidation support
- Volume dries up before reaching the level
- Broader market weakness that drags risk assets lower
This is textbook options-driven price action. The structure is clean, the target is defined, and the timeline is set. Watch how price behaves as we approach — if it stalls early, reassess. If it pushes through with conviction, $20 becomes the next chapter.
Trade what you see, not what you hope.
68
·
--
Altcoin market structure check:
Megaphone bottom pattern holding clean — that's your expanding wedge with higher highs and lower lows that finally breaks bullish. Classic reversal structure when it confirms.
RSI retest complete. That's the healthy part — momentum pulls back to test support after initial breakup, confirms the level holds, then continuation becomes probable.
What matters now: Does price respect the pattern's lower boundary? That's your invalidation line. Break below and the megaphone thesis dies.
Confirmation comes from a clean breakout above the upper trendline with volume. Until then, you're inside the pattern waiting for resolution.
Teaching point: Megaphone patterns (broadening formations) are tricky. They show increasing volatility and indecision. The bottom variant suggests accumulation, but only the breakout confirms direction. Don't front-run it.
Watch that lower boundary. Lose it, thesis fails. Hold it and break topside with conviction — that's your signal for continuation higher across alts.
Altcoin market structure check:
Megaphone bottom pattern holding clean — that's your expanding wedge with higher highs and lower lows that finally breaks bullish. Classic reversal structure when it confirms.
RSI retest complete. That's the healthy part — momentum pulls back to test support after initial breakup, confirms the level holds, then continuation becomes probable.
What matters now: Does price respect the pattern's lower boundary? That's your invalidation line. Break below and the megaphone thesis dies.
Confirmation comes from a clean breakout above the upper trendline with volume. Until then, you're inside the pattern waiting for resolution.
Teaching point: Megaphone patterns (broadening formations) are tricky. They show increasing volatility and indecision. The bottom variant suggests accumulation, but only the breakout confirms direction. Don't front-run it.
Watch that lower boundary. Lose it, thesis fails. Hold it and break topside with conviction — that's your signal for continuation higher across alts.
Megaphone bottom pattern holding clean — that's your expanding wedge with higher highs and lower lows that finally breaks bullish. Classic reversal structure when it confirms.
RSI retest complete. That's the healthy part — momentum pulls back to test support after initial breakup, confirms the level holds, then continuation becomes probable.
What matters now: Does price respect the pattern's lower boundary? That's your invalidation line. Break below and the megaphone thesis dies.
Confirmation comes from a clean breakout above the upper trendline with volume. Until then, you're inside the pattern waiting for resolution.
Teaching point: Megaphone patterns (broadening formations) are tricky. They show increasing volatility and indecision. The bottom variant suggests accumulation, but only the breakout confirms direction. Don't front-run it.
Watch that lower boundary. Lose it, thesis fails. Hold it and break topside with conviction — that's your signal for continuation higher across alts.
28
·
--
Даулы
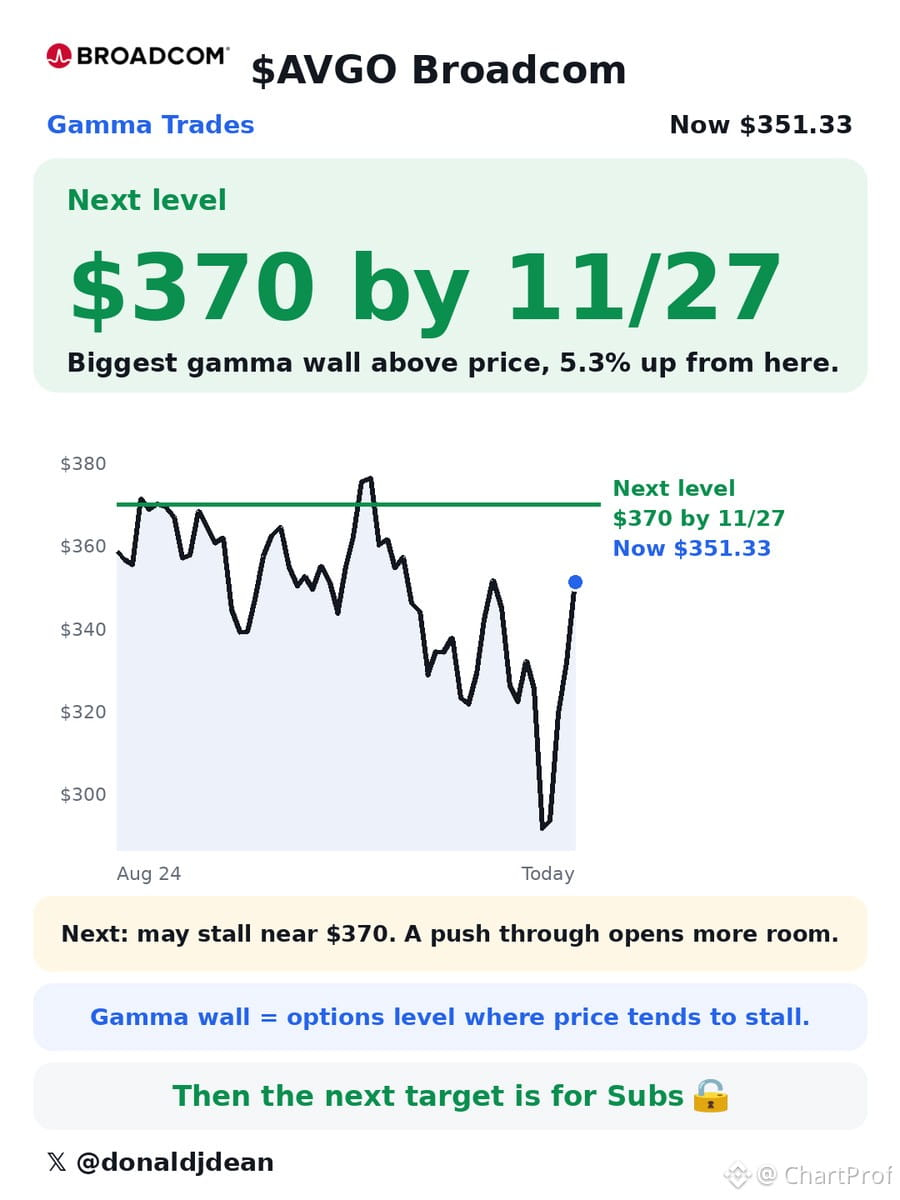
$AVGO clean setup into the biggest options magnet — $370 strikes loaded for 11/27, and as long as we hold above $350, that's the path. Simple structure: $350 is your line in the sand. Above it, we're pulled toward $370 by expiry. Below it, the setup breaks and you reassess. This is how options flow sets the roadmap — dealers hedge gamma, price gravitates to max pain or max open interest. Right now, that's $370. Trade the structure: long above $350, target $370, invalidation clear if we lose the floor. Clean, directional, time-boxed.
$AVGO clean setup into the biggest options magnet — $370 strikes loaded for 11/27, and as long as we hold above $350, that's the path. Simple structure: $350 is your line in the sand. Above it, we're pulled toward $370 by expiry. Below it, the setup breaks and you reassess. This is how options flow sets the roadmap — dealers hedge gamma, price gravitates to max pain or max open interest. Right now, that's $370. Trade the structure: long above $350, target $370, invalidation clear if we lose the floor. Clean, directional, time-boxed.
53
Көбірек контент көру үшін кіріңіз
Binance Square платформасында әлемдік криптоқоғамдастыққа қосылыңыз
⚡️ Криптовалюта туралы ең соңғы және пайдалы ақпаратты алыңыз.
💬 Әлемдегі ең ірі криптобиржаның сеніміне ие.
👍 Расталған авторлардың нақты пікірлерін табыңыз.
Электрондық пошта/телефон нөмірі
Трендтегі тақырыптар
USPPIMissMayEaseBTCPressure
49,770 рет көрілді
795 адам талқылап жатыр
US PPI Rises 6.5% a Year in October, Slightly Below 6.6% Forecast
Binance News
·17 лайк
·18.2k рет көрілді
BitcoinCoreDisclosesTorTrafficVulnerability
20,396 рет көрілді
428 адам талқылап жатыр
WhatWillDriveCryptoandStocks’NextRebound?
165,299 рет көрілді
1,641 адам талқылап жатыр