
Cat_Bosss
83 Жариялаулар

Cat_Bosss
Хабарлау
Пайдаланушыны блоктау
2 Жазылым
7 Жазылушылар
62 лайк басылған
Жазбалар
·
--
Жоғары (өспелі)
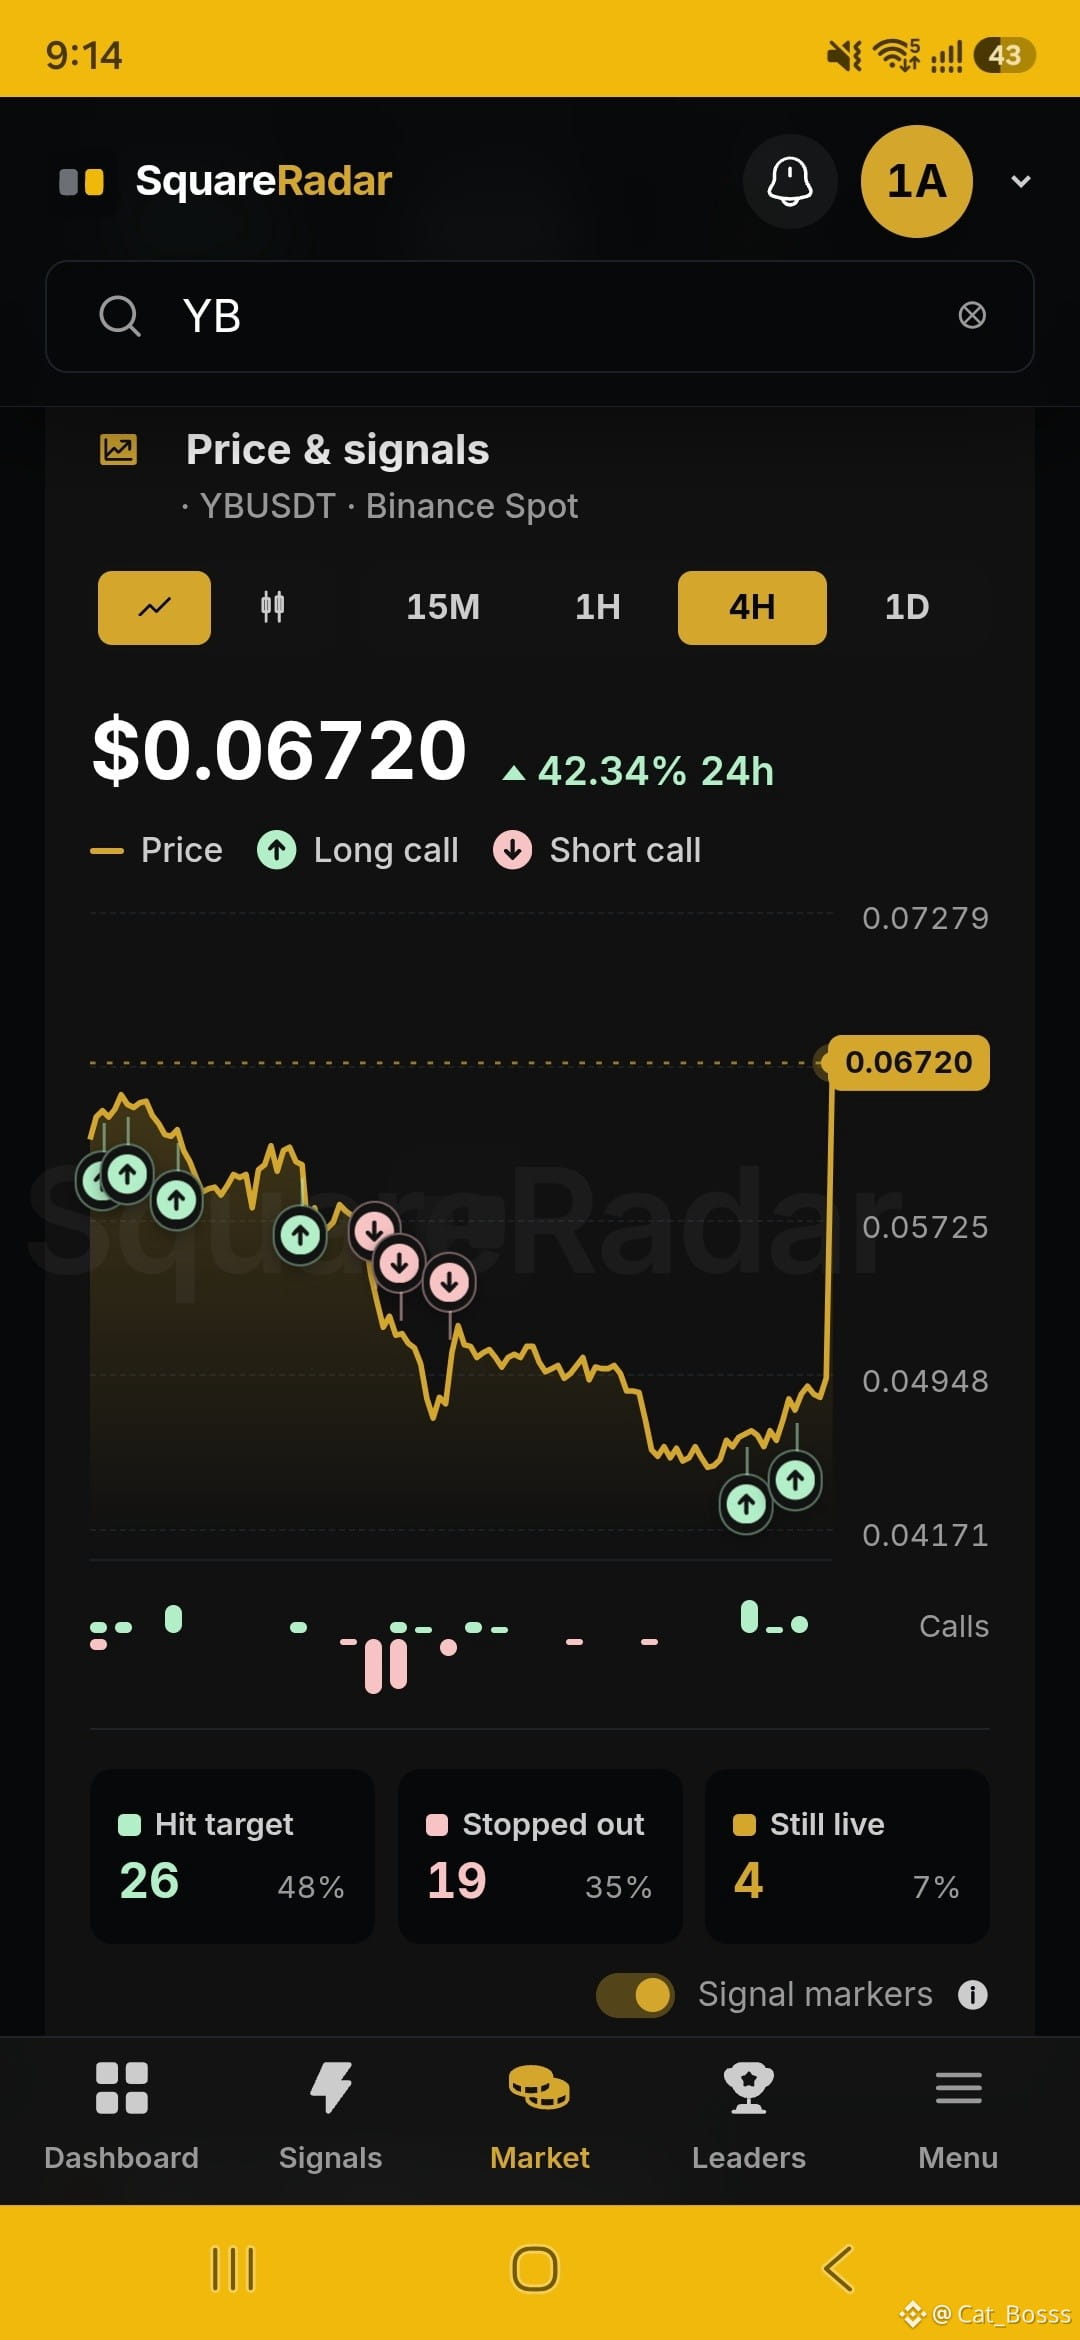
$YB $YB is up 42.34% in 24h. Check the calls, entries and outcomes for yourself at SquareRadar AI. 📊
$YB $YB is up 42.34% in 24h. Check the calls, entries and outcomes for yourself at SquareRadar AI. 📊
217
·
--
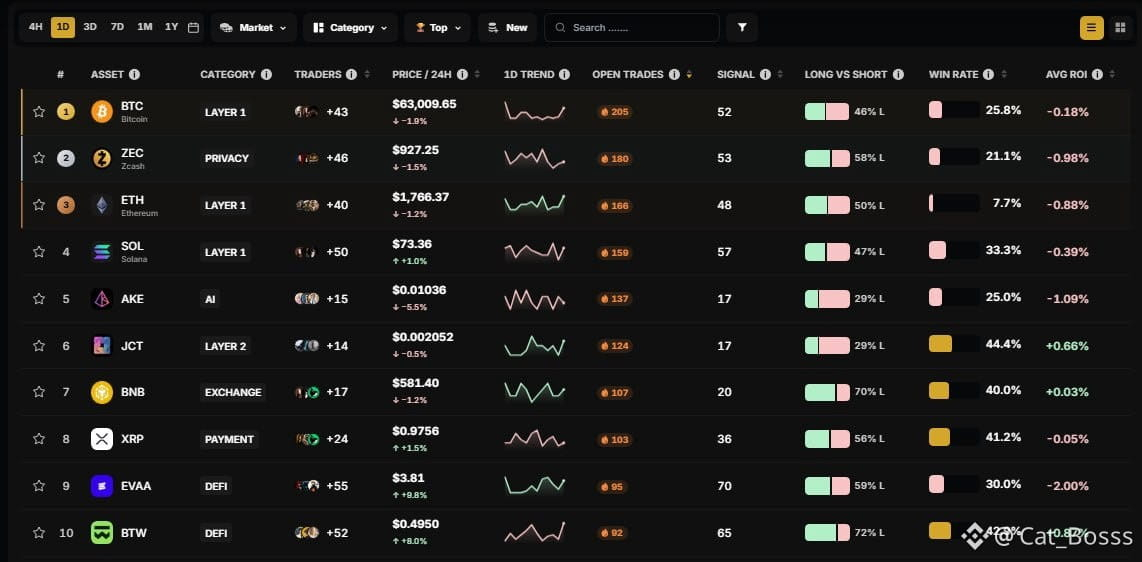
SquareRadar AI's 24-hour leaderboard reveals some interesting trends.
$BTC leads with 205 open trades, followed by $ZEC (180), $ETH (166), and SOL (159). But high trading activity doesn't necessarily mean better performance.
For example, ETH has a 7.7% win rate and -0.88% average ROI, while JCT shows a 44.4% win rate and +0.66% average ROI.
Another interesting observation BTW has 72% LONG signals, a 42.9% win rate, and +0.87% average ROI.
SquareRadar AI's 24-hour leaderboard reveals some interesting trends.
$BTC leads with 205 open trades, followed by $ZEC (180), $ETH (166), and SOL (159). But high trading activity doesn't necessarily mean better performance.
For example, ETH has a 7.7% win rate and -0.88% average ROI, while JCT shows a 44.4% win rate and +0.66% average ROI.
Another interesting observation BTW has 72% LONG signals, a 42.9% win rate, and +0.87% average ROI.
$BTC leads with 205 open trades, followed by $ZEC (180), $ETH (166), and SOL (159). But high trading activity doesn't necessarily mean better performance.
For example, ETH has a 7.7% win rate and -0.88% average ROI, while JCT shows a 44.4% win rate and +0.66% average ROI.
Another interesting observation BTW has 72% LONG signals, a 42.9% win rate, and +0.87% average ROI.
319
·
--
$NEAR protocol reportedly climbed nearly 4% to $3.38 after a proposal to reduce annual token issuance to 1.6% was ratified.
Why does this matter? Lower token issuance means fewer new tokens entering circulation each year, potentially reducing inflationary selling pressure.
Meanwhile, BitMEX co-founder Arthur Hayes has identified $6 as a potential price target for $NEAR.
$NEAR protocol reportedly climbed nearly 4% to $3.38 after a proposal to reduce annual token issuance to 1.6% was ratified.
Why does this matter? Lower token issuance means fewer new tokens entering circulation each year, potentially reducing inflationary selling pressure.
Meanwhile, BitMEX co-founder Arthur Hayes has identified $6 as a potential price target for $NEAR .
Why does this matter? Lower token issuance means fewer new tokens entering circulation each year, potentially reducing inflationary selling pressure.
Meanwhile, BitMEX co-founder Arthur Hayes has identified $6 as a potential price target for $NEAR .
378
·
--
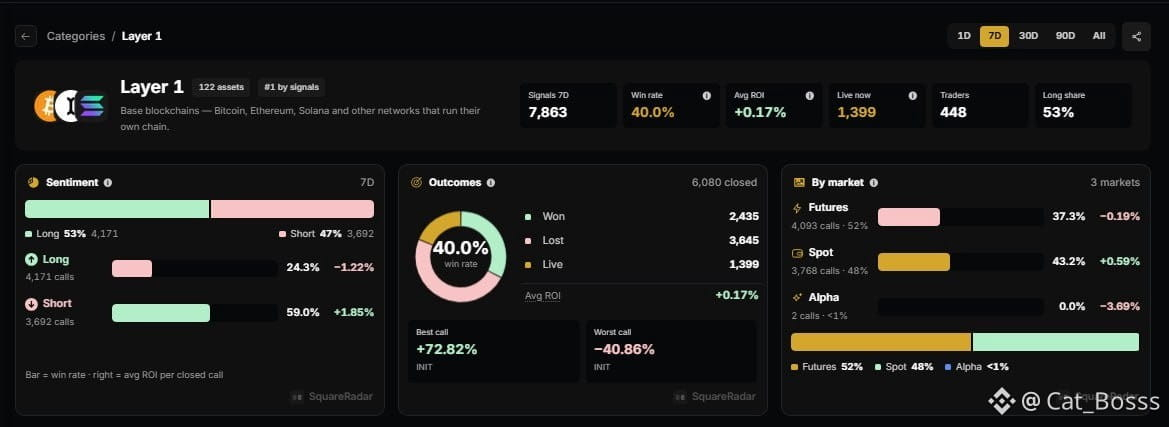
Layer 1 tokens are seeing heavy trading activity on Binance Square, but the results tell an interesting story. 📊
Over the last 7 days, SquareRadar AI tracked 7,863 signals from 448 traders across 122 Layer 1 assets.
53% of calls were LONG, yet SHORT signals performed significantly better, with a 59% win rate and +1.85% average ROI, compared to 24.3% and -1.22% for LONG calls.
Across 6,080 closed signals, the overall win rate stands at 40%, with an average ROI of just +0.17%.
Interestingly, Spot calls outperformed Futures on both win rate and average ROI.
Layer 1 tokens are seeing heavy trading activity on Binance Square, but the results tell an interesting story. 📊
Over the last 7 days, SquareRadar AI tracked 7,863 signals from 448 traders across 122 Layer 1 assets.
53% of calls were LONG, yet SHORT signals performed significantly better, with a 59% win rate and +1.85% average ROI, compared to 24.3% and -1.22% for LONG calls.
Across 6,080 closed signals, the overall win rate stands at 40%, with an average ROI of just +0.17%.
Interestingly, Spot calls outperformed Futures on both win rate and average ROI.
Over the last 7 days, SquareRadar AI tracked 7,863 signals from 448 traders across 122 Layer 1 assets.
53% of calls were LONG, yet SHORT signals performed significantly better, with a 59% win rate and +1.85% average ROI, compared to 24.3% and -1.22% for LONG calls.
Across 6,080 closed signals, the overall win rate stands at 40%, with an average ROI of just +0.17%.
Interestingly, Spot calls outperformed Futures on both win rate and average ROI.
1
30
·
--
There's a growing debate around whether capital rotating into $NIGHT is creating additional pressure on $ADA rather than bringing fresh liquidity into the Cardano ecosystem.
In the longer term, both projects could benefit from working together. But that depends on sustainable adoption, liquidity, and the broader health of Cardano's ecosystem and treasury.
The key question isn't which token gets the attention today. It's whether $NIGHT can create new value for the ecosystem instead of simply redistributing existing capital.
There's a growing debate around whether capital rotating into $NIGHT is creating additional pressure on $ADA rather than bringing fresh liquidity into the Cardano ecosystem.
In the longer term, both projects could benefit from working together. But that depends on sustainable adoption, liquidity, and the broader health of Cardano's ecosystem and treasury.
The key question isn't which token gets the attention today. It's whether $NIGHT can create new value for the ecosystem instead of simply redistributing existing capital.
In the longer term, both projects could benefit from working together. But that depends on sustainable adoption, liquidity, and the broader health of Cardano's ecosystem and treasury.
The key question isn't which token gets the attention today. It's whether $NIGHT can create new value for the ecosystem instead of simply redistributing existing capital.
1
405
·
--
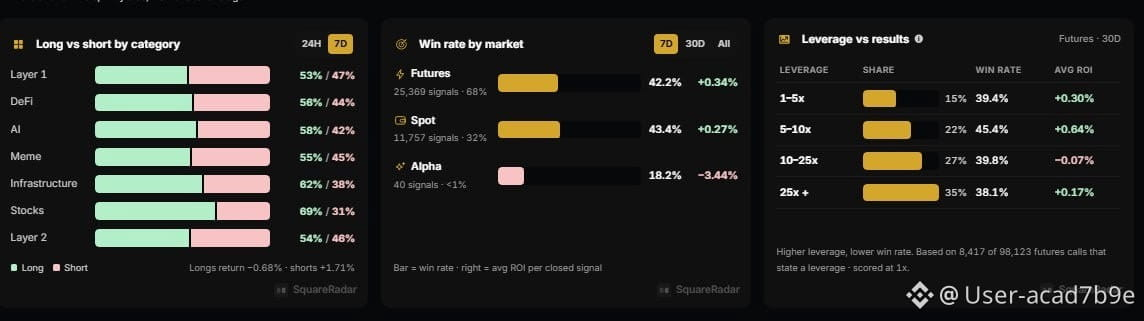
More LONG calls, but are traders actually getting better results? 📊SquareRadar AI's latest data reveals an interesting gap between market sentiment and performance.
Over the past 7 days, LONG signals dominated every tracked category, with stocks showing the strongest bullish bias at 69%. Yet SHORT calls delivered +1.71% average returns, compared with -0.68% for LONGs.
Futures and Spot recorded similar win rates at 42.2% and 43.4%, respectively. The leverage data tells another story. Over the last 30 days, 5–10x leverage produced the highest win rate at 45.4%, while 25x+ dropped to 38.1%.
More LONG calls, but are traders actually getting better results? 📊SquareRadar AI's latest data reveals an interesting gap between market sentiment and performance.
Over the past 7 days, LONG signals dominated every tracked category, with stocks showing the strongest bullish bias at 69%. Yet SHORT calls delivered +1.71% average returns, compared with -0.68% for LONGs.
Futures and Spot recorded similar win rates at 42.2% and 43.4%, respectively. The leverage data tells another story. Over the last 30 days, 5–10x leverage produced the highest win rate at 45.4%, while 25x+ dropped to 38.1%.
Over the past 7 days, LONG signals dominated every tracked category, with stocks showing the strongest bullish bias at 69%. Yet SHORT calls delivered +1.71% average returns, compared with -0.68% for LONGs.
Futures and Spot recorded similar win rates at 42.2% and 43.4%, respectively. The leverage data tells another story. Over the last 30 days, 5–10x leverage produced the highest win rate at 45.4%, while 25x+ dropped to 38.1%.
1
79
·
--
$QNT recovery is starting to look interesting. 👀
After briefly dropping below $140, price reclaimed $150 and has continued printing higher lows on each pullback.
Now it's consolidating just below $160, with $155 holding firm through the morning session.
The panic selling seems to have cooled off. The next test is whether buyers can push through $160 and turn it into support.
A clean breakout would strengthen the recovery structure, but losing $155 could bring sellers back into the picture.
$QNT recovery is starting to look interesting. 👀
After briefly dropping below $140, price reclaimed $150 and has continued printing higher lows on each pullback.
Now it's consolidating just below $160, with $155 holding firm through the morning session.
The panic selling seems to have cooled off. The next test is whether buyers can push through $160 and turn it into support.
A clean breakout would strengthen the recovery structure, but losing $155 could bring sellers back into the picture.
After briefly dropping below $140, price reclaimed $150 and has continued printing higher lows on each pullback.
Now it's consolidating just below $160, with $155 holding firm through the morning session.
The panic selling seems to have cooled off. The next test is whether buyers can push through $160 and turn it into support.
A clean breakout would strengthen the recovery structure, but losing $155 could bring sellers back into the picture.
214
·
--
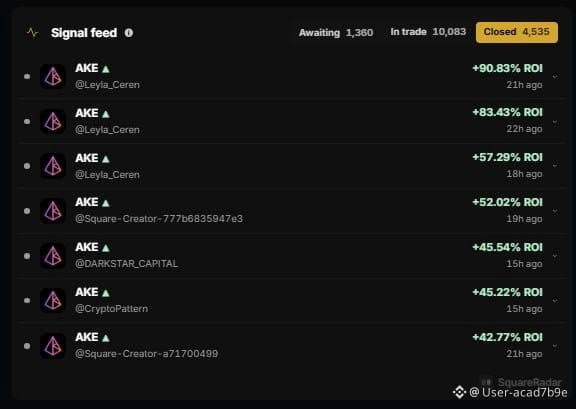
$AKE continues to stand out in SquareRadar AI’s closed signal feed.
Multiple LONG calls on AKE have recorded positive outcomes, with the seven visible closed signals showing ROIs ranging from +42.77% to +90.83%.
The highest recorded return is +90.83%, followed by +83.43% and +57.29%. Interestingly, the calls come from multiple Binance Square traders, with some repeat activity from the same account.
This highlights an important part of tracking market activity: looking beyond a token’s price movement to see how different traders' calls actually perform.
$AKE continues to stand out in SquareRadar AI’s closed signal feed.
Multiple LONG calls on AKE have recorded positive outcomes, with the seven visible closed signals showing ROIs ranging from +42.77% to +90.83%.
The highest recorded return is +90.83%, followed by +83.43% and +57.29%. Interestingly, the calls come from multiple Binance Square traders, with some repeat activity from the same account.
This highlights an important part of tracking market activity: looking beyond a token’s price movement to see how different traders' calls actually perform.
Multiple LONG calls on AKE have recorded positive outcomes, with the seven visible closed signals showing ROIs ranging from +42.77% to +90.83%.
The highest recorded return is +90.83%, followed by +83.43% and +57.29%. Interestingly, the calls come from multiple Binance Square traders, with some repeat activity from the same account.
This highlights an important part of tracking market activity: looking beyond a token’s price movement to see how different traders' calls actually perform.
1
234
·
--
$SHELL just pulled off a 3x move, climbing from $0.018 to $0.052 in a single daily candle. Now it's retraced to around $0.032.
The big question is what comes next.
Can buyers defend this pullback and build enough momentum for another leg higher, or will SHELL follow the same pattern we saw with $IOST and $INIT after their explosive rallies?
$SHELL just pulled off a 3x move, climbing from $0.018 to $0.052 in a single daily candle. Now it's retraced to around $0.032.
The big question is what comes next.
Can buyers defend this pullback and build enough momentum for another leg higher, or will SHELL follow the same pattern we saw with $IOST and $INIT after their explosive rallies?
The big question is what comes next.
Can buyers defend this pullback and build enough momentum for another leg higher, or will SHELL follow the same pattern we saw with $IOST and $INIT after their explosive rallies?
1
220
·
--
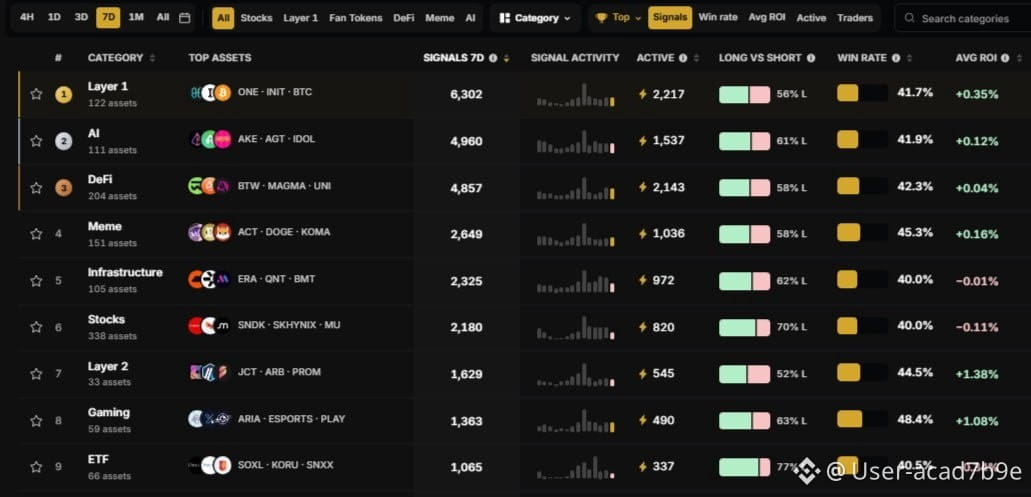
Which crypto sectors are attracting the most trading signals this week? 📊
SquareRadar AI's 7-day category leaderboard reveals some interesting differences between signal activity and performance.
Layer 1 leads with 6,302 signals, followed by AI with 4,960 and DeFi with 4,857. But the highest activity doesn't necessarily translate into the strongest results.
A few standouts:
• Gaming: Highest win rate at 48.4%, with +1.08% average ROI.
• Layer 2: Strongest average ROI at +1.38%, with a 44.5% win rate.
• Meme: 45.3% win rate and +0.16% average ROI.
• Stocks: 70% LONG bias, but average ROI stands at -0.11%.
Another interesting observation: LONG calls dominate across every category, ranging from 52% in Layer 2 to 77% in ETFs.
Which crypto sectors are attracting the most trading signals this week? 📊
SquareRadar AI's 7-day category leaderboard reveals some interesting differences between signal activity and performance.
Layer 1 leads with 6,302 signals, followed by AI with 4,960 and DeFi with 4,857. But the highest activity doesn't necessarily translate into the strongest results.
A few standouts:
• Gaming: Highest win rate at 48.4%, with +1.08% average ROI.
• Layer 2: Strongest average ROI at +1.38%, with a 44.5% win rate.
• Meme: 45.3% win rate and +0.16% average ROI.
• Stocks: 70% LONG bias, but average ROI stands at -0.11%.
Another interesting observation: LONG calls dominate across every category, ranging from 52% in Layer 2 to 77% in ETFs.
SquareRadar AI's 7-day category leaderboard reveals some interesting differences between signal activity and performance.
Layer 1 leads with 6,302 signals, followed by AI with 4,960 and DeFi with 4,857. But the highest activity doesn't necessarily translate into the strongest results.
A few standouts:
• Gaming: Highest win rate at 48.4%, with +1.08% average ROI.
• Layer 2: Strongest average ROI at +1.38%, with a 44.5% win rate.
• Meme: 45.3% win rate and +0.16% average ROI.
• Stocks: 70% LONG bias, but average ROI stands at -0.11%.
Another interesting observation: LONG calls dominate across every category, ranging from 52% in Layer 2 to 77% in ETFs.
4
1.3k
·
--
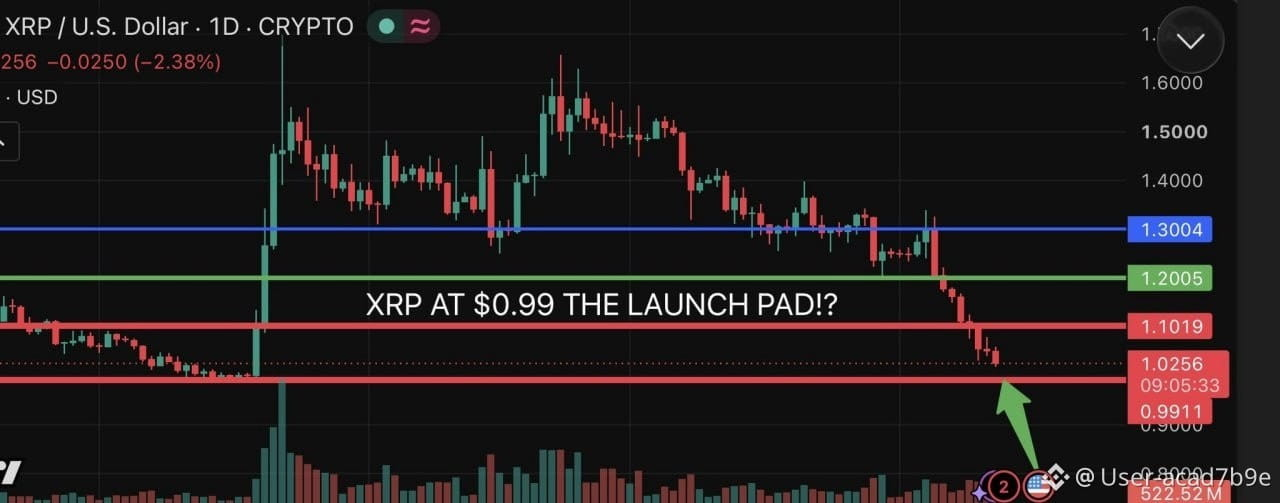
$XRP is approaching a critical support zone around $0.99–$1.02. 👀
After losing the $1.30 and $1.20 levels, XRP has continued making lower highs and lower lows, keeping the daily structure firmly under pressure.
Now all eyes are on the $0.99 area. This zone could become an important decision point for buyers.
If support holds and buyers manage to reclaim $1.10, it could be the first indication of a potential recovery. A move back above $1.20 would provide stronger confirmation.
However, a decisive breakdown below $0.99 could open the door to further downside.
$XRP is approaching a critical support zone around $0.99–$1.02. 👀
After losing the $1.30 and $1.20 levels, XRP has continued making lower highs and lower lows, keeping the daily structure firmly under pressure.
Now all eyes are on the $0.99 area. This zone could become an important decision point for buyers.
If support holds and buyers manage to reclaim $1.10, it could be the first indication of a potential recovery. A move back above $1.20 would provide stronger confirmation.
However, a decisive breakdown below $0.99 could open the door to further downside.
After losing the $1.30 and $1.20 levels, XRP has continued making lower highs and lower lows, keeping the daily structure firmly under pressure.
Now all eyes are on the $0.99 area. This zone could become an important decision point for buyers.
If support holds and buyers manage to reclaim $1.10, it could be the first indication of a potential recovery. A move back above $1.20 would provide stronger confirmation.
However, a decisive breakdown below $0.99 could open the door to further downside.
1
1
221
·
--
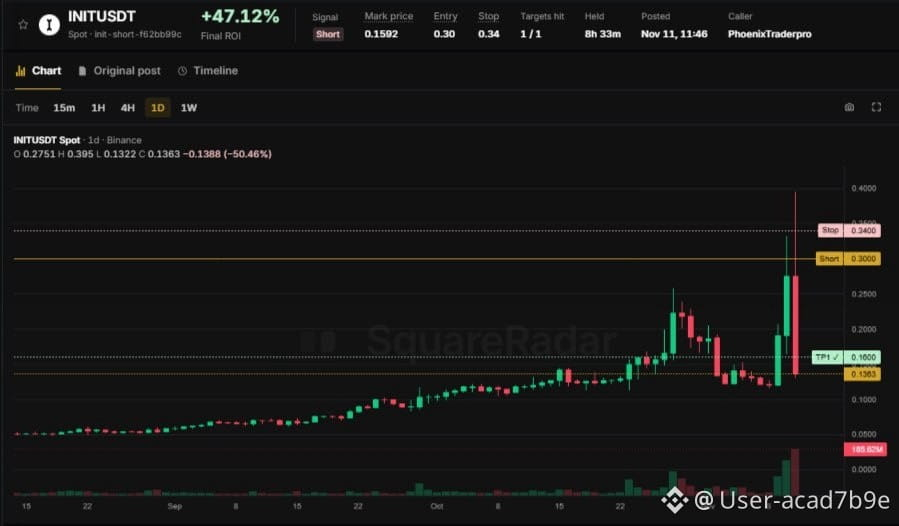
Another completed $INIT signal worth highlighting.
A SHORT call tracked on SquareRadar AI entered at $0.30 and successfully reached its $0.16 take-profit target, with a stop-loss set at $0.34.
The final recorded result: +47.12% ROI over 8 hours and 33 minutes. With $INIT experiencing significant price volatility, this trade highlights the importance of timing, direction and defined risk levels.
Another completed $INIT signal worth highlighting.
A SHORT call tracked on SquareRadar AI entered at $0.30 and successfully reached its $0.16 take-profit target, with a stop-loss set at $0.34.
The final recorded result: +47.12% ROI over 8 hours and 33 minutes. With $INIT experiencing significant price volatility, this trade highlights the importance of timing, direction and defined risk levels.
A SHORT call tracked on SquareRadar AI entered at $0.30 and successfully reached its $0.16 take-profit target, with a stop-loss set at $0.34.
The final recorded result: +47.12% ROI over 8 hours and 33 minutes. With $INIT experiencing significant price volatility, this trade highlights the importance of timing, direction and defined risk levels.
1
139
·
--
Midnight overtaking Cardano wouldn't necessarily mean $ADA is losing. According to Charles Hoskinson, it could represent growth across the broader ecosystem.
He points to $NIGHT rapid growth, driven by increasing demand for privacy and regulatory compliance, even as the wider crypto market faces pressure.
Hoskinson also believes Midnight is approaching the point where it can compete among the top 3–5 major privacy networks.
Midnight overtaking Cardano wouldn't necessarily mean $ADA is losing. According to Charles Hoskinson, it could represent growth across the broader ecosystem.
He points to $NIGHT rapid growth, driven by increasing demand for privacy and regulatory compliance, even as the wider crypto market faces pressure.
Hoskinson also believes Midnight is approaching the point where it can compete among the top 3–5 major privacy networks.
He points to $NIGHT rapid growth, driven by increasing demand for privacy and regulatory compliance, even as the wider crypto market faces pressure.
Hoskinson also believes Midnight is approaching the point where it can compete among the top 3–5 major privacy networks.
2
453
·
--
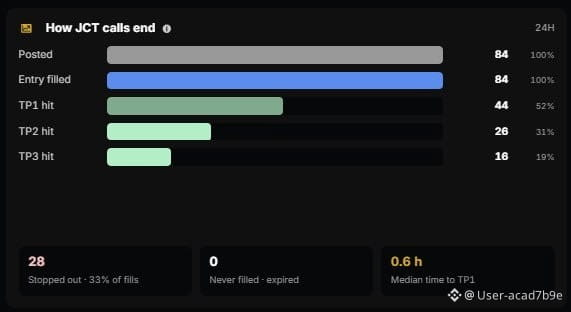
How did $JCT signals perform over the last 24 hours? Here's the breakdown from SquareRadar AI. 📊
A total of 84 signals were posted, and all 84 had their entries filled.
Of those calls, 44 reached TP1 (52%), 26 progressed to TP2 (31%), and 16 made it all the way to TP3 (19%). Meanwhile, 28 signals hit their stop-loss, representing 33% of filled calls.
One notable detail: the median time to reach TP1 was just 0.6 hours.
The numbers show strong initial target execution, but performance dropped as higher targets came into play. Not every signal reached the final target, and stop-losses remain part of the picture.
How did $JCT signals perform over the last 24 hours? Here's the breakdown from SquareRadar AI. 📊
A total of 84 signals were posted, and all 84 had their entries filled.
Of those calls, 44 reached TP1 (52%), 26 progressed to TP2 (31%), and 16 made it all the way to TP3 (19%). Meanwhile, 28 signals hit their stop-loss, representing 33% of filled calls.
One notable detail: the median time to reach TP1 was just 0.6 hours.
The numbers show strong initial target execution, but performance dropped as higher targets came into play. Not every signal reached the final target, and stop-losses remain part of the picture.
A total of 84 signals were posted, and all 84 had their entries filled.
Of those calls, 44 reached TP1 (52%), 26 progressed to TP2 (31%), and 16 made it all the way to TP3 (19%). Meanwhile, 28 signals hit their stop-loss, representing 33% of filled calls.
One notable detail: the median time to reach TP1 was just 0.6 hours.
The numbers show strong initial target execution, but performance dropped as higher targets came into play. Not every signal reached the final target, and stop-losses remain part of the picture.
1
413
·
--
$ARB may be attracting buyers, but that doesn't automatically make it a good entry.
The focus should be on confirmation rather than chasing the initial move. A sustained hold above reclaimed support, consistent spot buying and a higher low would strengthen the bullish setup.
On the other hand, a move back below reclaimed support would weaken the thesis and signal that buyers are losing control.
The approach is simple: define the invalidation level first, wait for confirmation, and keep risk under control.
$ARB may be attracting buyers, but that doesn't automatically make it a good entry.
The focus should be on confirmation rather than chasing the initial move. A sustained hold above reclaimed support, consistent spot buying and a higher low would strengthen the bullish setup.
On the other hand, a move back below reclaimed support would weaken the thesis and signal that buyers are losing control.
The approach is simple: define the invalidation level first, wait for confirmation, and keep risk under control.
The focus should be on confirmation rather than chasing the initial move. A sustained hold above reclaimed support, consistent spot buying and a higher low would strengthen the bullish setup.
On the other hand, a move back below reclaimed support would weaken the thesis and signal that buyers are losing control.
The approach is simple: define the invalidation level first, wait for confirmation, and keep risk under control.
1
294
·
--
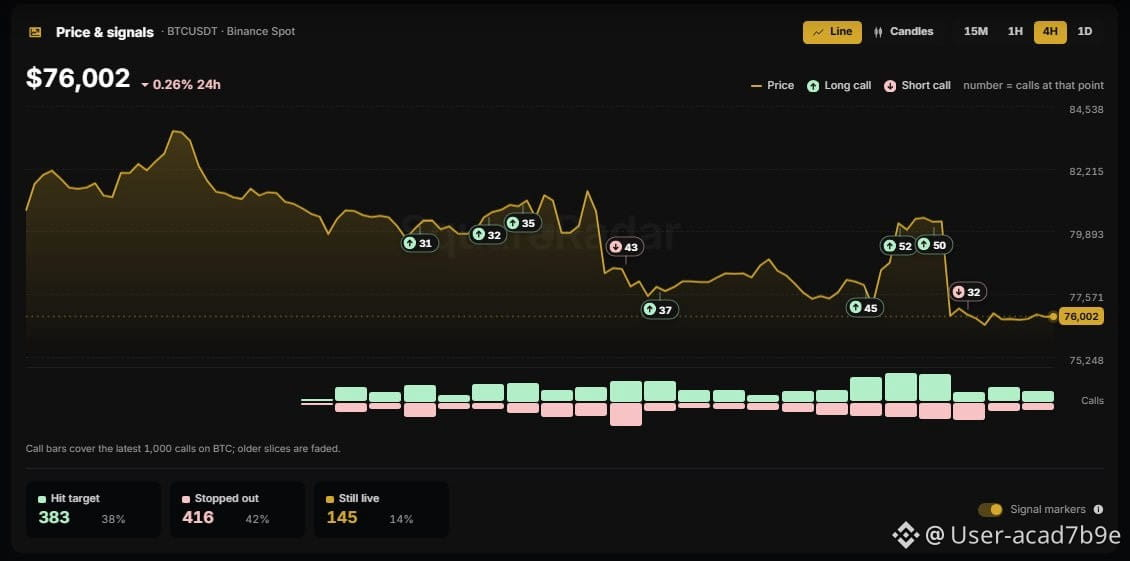
SquareRadar’s 4H $BTC dashboard shows a market where bearish outcomes have slightly outnumbered successful targets.
Across the displayed signal results, 383 calls hit their targets (38%), while 416 were stopped out (42%). Another 145 signals (14%) remain live.
Price action also tells an interesting story. Bitcoin has pulled back from the $82K region toward $76K, while both LONG and SHORT calls have appeared throughout the move.
The takeaway: calling market direction is one thing; getting the timing right is another.
SquareRadar’s 4H $BTC dashboard shows a market where bearish outcomes have slightly outnumbered successful targets.
Across the displayed signal results, 383 calls hit their targets (38%), while 416 were stopped out (42%). Another 145 signals (14%) remain live.
Price action also tells an interesting story. Bitcoin has pulled back from the $82K region toward $76K, while both LONG and SHORT calls have appeared throughout the move.
The takeaway: calling market direction is one thing; getting the timing right is another.
Across the displayed signal results, 383 calls hit their targets (38%), while 416 were stopped out (42%). Another 145 signals (14%) remain live.
Price action also tells an interesting story. Bitcoin has pulled back from the $82K region toward $76K, while both LONG and SHORT calls have appeared throughout the move.
The takeaway: calling market direction is one thing; getting the timing right is another.
1
82
·
--
$MET is approaching a potentially important technical zone. Price is nearing the apex of a descending triangle, where a breakout or breakdown could determine the next move.
A bounce from this area could be the first sign of buyers stepping in. However, the bullish setup needs confirmation: a clear break above descending resistance, supported by volume, would strengthen the case for further upside.
$MET is approaching a potentially important technical zone. Price is nearing the apex of a descending triangle, where a breakout or breakdown could determine the next move.
A bounce from this area could be the first sign of buyers stepping in. However, the bullish setup needs confirmation: a clear break above descending resistance, supported by volume, would strengthen the case for further upside.
A bounce from this area could be the first sign of buyers stepping in. However, the bullish setup needs confirmation: a clear break above descending resistance, supported by volume, would strengthen the case for further upside.
2
186
·
--
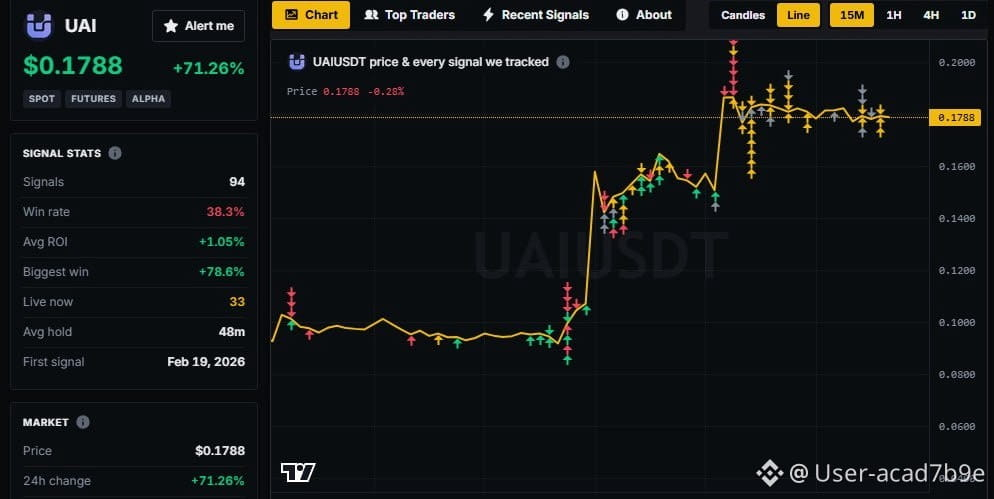
$UAI has made a sharp move, gaining 71.26% and climbing from around $0.09 to $0.1788. 📈But the signal data tells a more interesting story.
SquareRadar AI across 94 tracked Binance Square calls, UAI currently shows a 38.3% win rate and +1.05% average ROI. Its biggest recorded win stands at +78.6%, with 33 signals still live.
Price has surged significantly and is now consolidating around $0.178–$0.18. The interesting question is whether buyers can sustain this momentum or if profit-taking follows the rally.
Strong price action doesn't always translate into consistent signal performance. Both sides deserve attention.
$UAI has made a sharp move, gaining 71.26% and climbing from around $0.09 to $0.1788. 📈But the signal data tells a more interesting story.
SquareRadar AI across 94 tracked Binance Square calls, UAI currently shows a 38.3% win rate and +1.05% average ROI. Its biggest recorded win stands at +78.6%, with 33 signals still live.
Price has surged significantly and is now consolidating around $0.178–$0.18. The interesting question is whether buyers can sustain this momentum or if profit-taking follows the rally.
Strong price action doesn't always translate into consistent signal performance. Both sides deserve attention.
SquareRadar AI across 94 tracked Binance Square calls, UAI currently shows a 38.3% win rate and +1.05% average ROI. Its biggest recorded win stands at +78.6%, with 33 signals still live.
Price has surged significantly and is now consolidating around $0.178–$0.18. The interesting question is whether buyers can sustain this momentum or if profit-taking follows the rally.
Strong price action doesn't always translate into consistent signal performance. Both sides deserve attention.
1
287
·
--
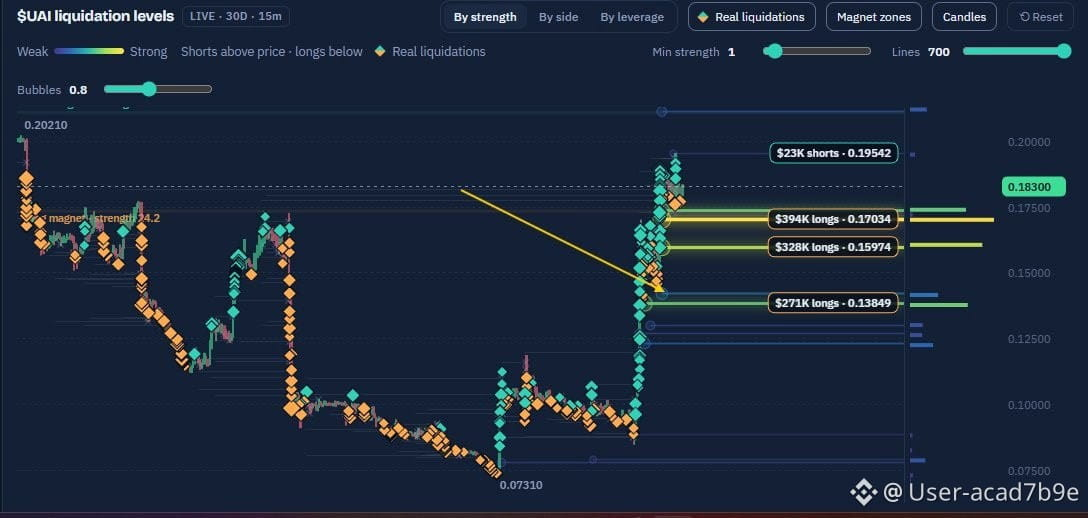
$UAI has some interesting liquidation levels building around its current price. 👀
With price near $0.183, the liquidation map highlights several notable liquidity clusters below:
$394K in long liquidations around $0.17034
$328K around $0.15974
$271K around $0.13849
Above the current price, roughly $23K in short liquidations sits near $0.19542. The imbalance is worth watching. There is considerably more visible liquidation liquidity
$UAI has some interesting liquidation levels building around its current price. 👀
With price near $0.183, the liquidation map highlights several notable liquidity clusters below:
$394K in long liquidations around $0.17034
$328K around $0.15974
$271K around $0.13849
Above the current price, roughly $23K in short liquidations sits near $0.19542. The imbalance is worth watching. There is considerably more visible liquidation liquidity
With price near $0.183, the liquidation map highlights several notable liquidity clusters below:
$394K in long liquidations around $0.17034
$328K around $0.15974
$271K around $0.13849
Above the current price, roughly $23K in short liquidations sits near $0.19542. The imbalance is worth watching. There is considerably more visible liquidation liquidity
269
·
--
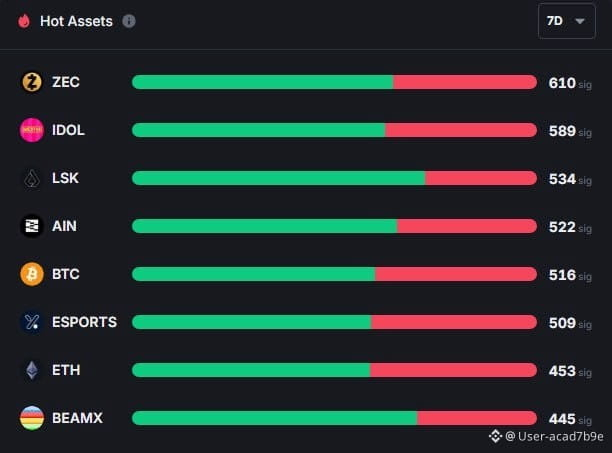
Which assets are attracting the most trading signals on Binance Square this week?
SquareRadar AI's 7-day Hot Assets data shows $ZEC leading with 610 signals, followed by $IDOL with 589 and $LSK with 534.
$AIN, $BTC and $ESPORTS are also seeing strong activity, with more than 500 signals each.
One interesting detail: the green bars represent LONG calls, while red represents SHORT calls. Across these assets, LONG signals currently account for the larger share of activity.
Signal volume shows where traders are focusing their attention, while the long/short split offers a glimpse into market positioning.
Which assets are attracting the most trading signals on Binance Square this week?
SquareRadar AI's 7-day Hot Assets data shows $ZEC leading with 610 signals, followed by $IDOL with 589 and $LSK with 534.
$AIN, $BTC and $ESPORTS are also seeing strong activity, with more than 500 signals each.
One interesting detail: the green bars represent LONG calls, while red represents SHORT calls. Across these assets, LONG signals currently account for the larger share of activity.
Signal volume shows where traders are focusing their attention, while the long/short split offers a glimpse into market positioning.
SquareRadar AI's 7-day Hot Assets data shows $ZEC leading with 610 signals, followed by $IDOL with 589 and $LSK with 534.
$AIN, $BTC and $ESPORTS are also seeing strong activity, with more than 500 signals each.
One interesting detail: the green bars represent LONG calls, while red represents SHORT calls. Across these assets, LONG signals currently account for the larger share of activity.
Signal volume shows where traders are focusing their attention, while the long/short split offers a glimpse into market positioning.
3
1.2k
Көбірек контент көру үшін кіріңіз
Binance Square платформасында әлемдік криптоқоғамдастыққа қосылыңыз
⚡️ Криптовалюта туралы ең соңғы және пайдалы ақпаратты алыңыз.
💬 Әлемдегі ең ірі криптобиржаның сеніміне ие.
👍 Расталған авторлардың нақты пікірлерін табыңыз.
Электрондық пошта/телефон нөмірі
Трендтегі тақырыптар
BTCReboundsAbove$60KAmidWhaleDipBuying
95,087 рет көрілді
416 адам талқылап жатыр
Abraxas Capital, Other Whales Buy the BTC Dip as Bitcoin Briefly Reclaims $60,000
Binance News
·38 лайк
·86.5k рет көрілді
SolanaSets2027RoadmapToDoubleComputeCapacity
79,255 рет көрілді
1,187 адам талқылап жатыр
CaliforniaNvidiaProbeExaminesPotentialCriminalViolations
21,820 рет көрілді
177 адам талқылап жатыр