
asiftahsin
2.3k Жариялаулар

asiftahsin
Хабарлау
Пайдаланушыны блоктау
Share Crypto Related Market Analysis, Share Crypto Related knowledge for my follower(brother and Sister)
32 Жазылым
335 Жазылушылар
1.3K+ лайк басылған
Жазбалар
Барлығы
Баға ұсыныстары
·
--
Мақала
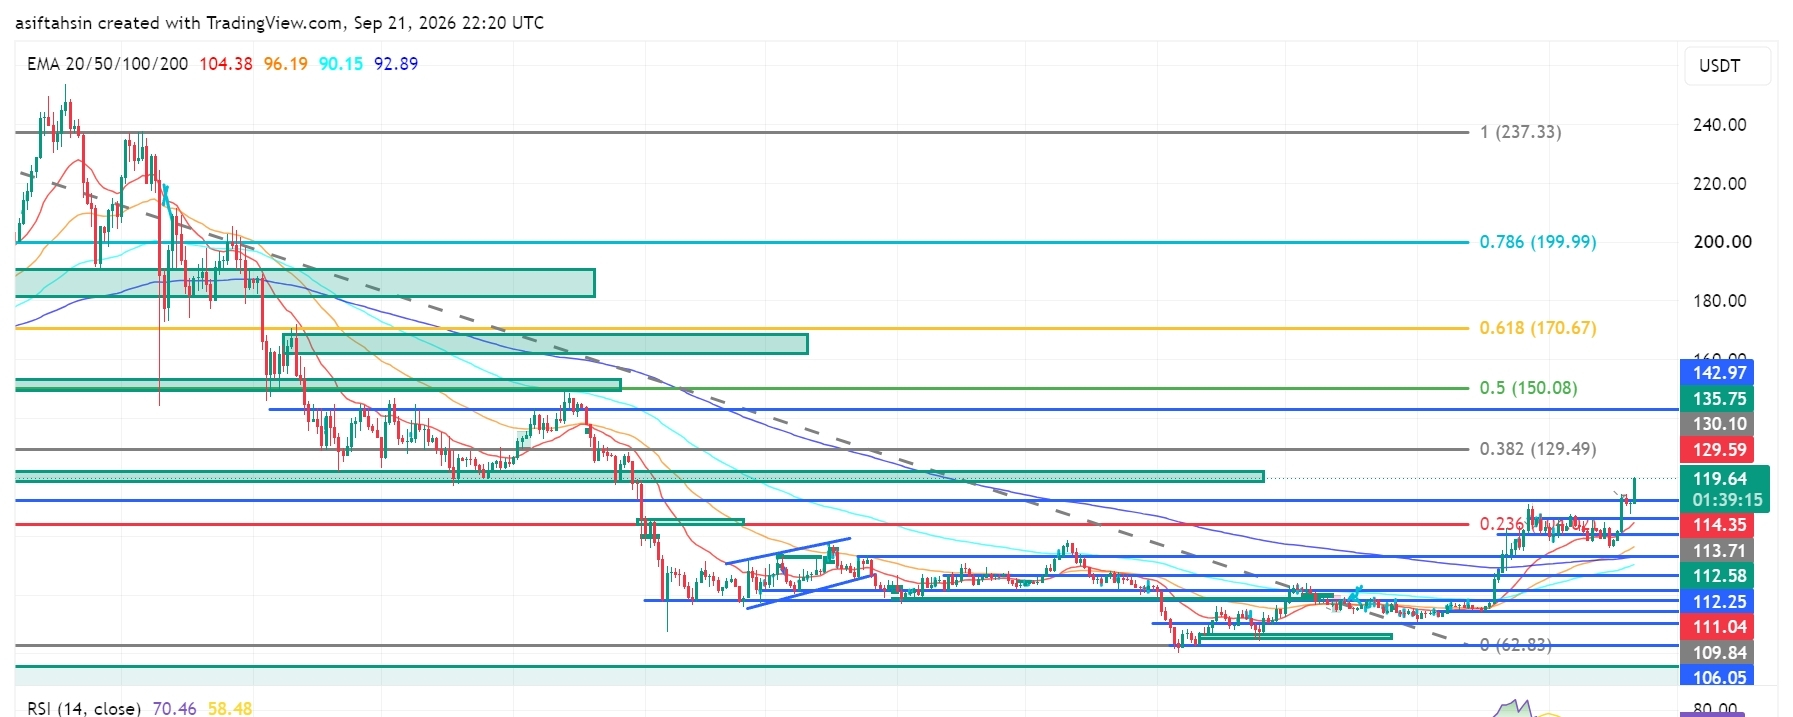
SOL Technical Outlook: Solana Pushes Toward $120 as Breakout Structure StrengthensSOL is currently trading around $119.61, holding well above the $112–$114 region after a strong recovery from the $104–$110 support zone.
The broader structure has improved significantly, with SOL reclaiming the $110–$114 area and now testing the $119–$120 resistance zone. A sustained breakout above this region would bring the higher Fibonacci levels back into focus.
📈 EMA Structure
20 EMA: $104.38
50 EMA: $96.19
100 EMA: $90.15
200 EMA: $92.89
SOL is trading significantly above all four major EMAs.
The 20 EMA remains above the 50 EMA, while the 50 EMA is also above the 200 EMA. This alignment reflects a strong recovery structure and improving medium-term trend.
The $104–$106 region is now an important deeper support zone, while the $110–$114 area has developed into a key structural support region after the recent breakout.
📐 Fibonacci Levels
0.236: $114.35
0.382: $129.49
0.5: $150.08
0.618: $170.67
0.786: $199.99
1.0: $237.33
SOL has reclaimed the 0.236 Fibonacci level around $114.35 and is now trading above it.
The next major Fibonacci resistance is $129.49, followed by $150.08.
🟢 Bullish Scenario
Immediate resistance is around:
$119.61 → $120
A clean breakout and sustained close above the $119–$120 zone could open the path toward:
$129.49 → $135.75 → $142.97 → $150.08
The $129.49 level is the next major Fibonacci resistance. A successful breakout and retest above $129.49 would strengthen the continuation structure and put the $150.08 level into focus.
Above $150.08, the higher Fibonacci references are:
$170.67 → $199.99 → $237.33
🔴 Pullback Scenario
Key support levels:
$114.35
$113.71
$112.58
$112.25
$111.04
$109.84
$106.05
$104.38
$96.19
$92.89
$90.15
The $111–$114 zone is particularly important.
A pullback into this area followed by a successful hold would keep the breakout structure constructive. Losing $109.84–$106.05 would indicate deeper consolidation, while a sustained move below the $104.38 20 EMA would significantly weaken the current recovery structure.
🧠 Market Structure & Liquidity
Liquidity Sweep → Accumulation → Higher Lows → Breakout → Expansion → Retest → Consolidation → Continuation
SOL has moved through several important structural phases, recovering from the June low around $62.83, building higher lows, reclaiming the $100 area, and then breaking above the previous $110–$114 resistance region.
The current move toward $120 represents another expansion phase, with $119–$120 acting as the immediate decision zone.
📊 RSI Momentum
RSI: 70.46
RSI MA: 58.48
RSI has moved above 70, showing strong bullish momentum but also entering an overbought region.
This does not automatically mean a reversal. However, after the recent expansion, SOL could experience short-term consolidation or a pullback before attempting another leg higher.
The key will be whether RSI can remain elevated while price holds the $114–$119 structure.
🎯 Key Levels
Resistance:
$119.61 → $120 → $129.49 → $135.75 → $142.97 → $150.08 → $170.67 → $199.99
Support:
$114.35 → $113.71 → $112.58 → $112.25 → $111.04 → $109.84 → $106.05 → $104.38
Major EMA Support:
$104.38 / $96.19 / $92.89 / $90.15
📌 Final Outlook
SOL has strengthened considerably after reclaiming the $110–$114 region and pushing toward $120.
The key battle now is $119–$120.
A sustained breakout above this zone could open the path toward $129.49, followed by $135.75–$142.97 and the major $150.08 Fibonacci level.
On the downside, $111–$114 is the first major retest zone. Holding this area would keep the breakout structure intact, while a deeper move below $106.05–$104.38 would weaken the current setup.
Bias: Recovery structure remains strong above $104.38. A sustained breakout above $119–$120 could open the path toward $129.49, with $150.08 as the next major Fibonacci objective.
$SOL
{future}(SOLUSDT)
SOL Technical Outlook: Solana Pushes Toward $120 as Breakout Structure Strengthens
SOL is currently trading around $119.61, holding well above the $112–$114 region after a strong recovery from the $104–$110 support zone.
The broader structure has improved significantly, with SOL reclaiming the $110–$114 area and now testing the $119–$120 resistance zone. A sustained breakout above this region would bring the higher Fibonacci levels back into focus.
📈 EMA Structure
20 EMA: $104.38
50 EMA: $96.19
100 EMA: $90.15
200 EMA: $92.89
SOL is trading significantly above all four major EMAs.
The 20 EMA remains above the 50 EMA, while the 50 EMA is also above the 200 EMA. This alignment reflects a strong recovery structure and improving medium-term trend.
The $104–$106 region is now an important deeper support zone, while the $110–$114 area has developed into a key structural support region after the recent breakout.
📐 Fibonacci Levels
0.236: $114.35
0.382: $129.49
0.5: $150.08
0.618: $170.67
0.786: $199.99
1.0: $237.33
SOL has reclaimed the 0.236 Fibonacci level around $114.35 and is now trading above it.
The next major Fibonacci resistance is $129.49, followed by $150.08.
🟢 Bullish Scenario
Immediate resistance is around:
$119.61 → $120
A clean breakout and sustained close above the $119–$120 zone could open the path toward:
$129.49 → $135.75 → $142.97 → $150.08
The $129.49 level is the next major Fibonacci resistance. A successful breakout and retest above $129.49 would strengthen the continuation structure and put the $150.08 level into focus.
Above $150.08, the higher Fibonacci references are:
$170.67 → $199.99 → $237.33
🔴 Pullback Scenario
Key support levels:
$114.35
$113.71
$112.58
$112.25
$111.04
$109.84
$106.05
$104.38
$96.19
$92.89
$90.15
The $111–$114 zone is particularly important.
A pullback into this area followed by a successful hold would keep the breakout structure constructive. Losing $109.84–$106.05 would indicate deeper consolidation, while a sustained move below the $104.38 20 EMA would significantly weaken the current recovery structure.
🧠 Market Structure & Liquidity
Liquidity Sweep → Accumulation → Higher Lows → Breakout → Expansion → Retest → Consolidation → Continuation
SOL has moved through several important structural phases, recovering from the June low around $62.83, building higher lows, reclaiming the $100 area, and then breaking above the previous $110–$114 resistance region.
The current move toward $120 represents another expansion phase, with $119–$120 acting as the immediate decision zone.
📊 RSI Momentum
RSI: 70.46
RSI MA: 58.48
RSI has moved above 70, showing strong bullish momentum but also entering an overbought region.
This does not automatically mean a reversal. However, after the recent expansion, SOL could experience short-term consolidation or a pullback before attempting another leg higher.
The key will be whether RSI can remain elevated while price holds the $114–$119 structure.
🎯 Key Levels
Resistance:
$119.61 → $120 → $129.49 → $135.75 → $142.97 → $150.08 → $170.67 → $199.99
Support:
$114.35 → $113.71 → $112.58 → $112.25 → $111.04 → $109.84 → $106.05 → $104.38
Major EMA Support:
$104.38 / $96.19 / $92.89 / $90.15
📌 Final Outlook
SOL has strengthened considerably after reclaiming the $110–$114 region and pushing toward $120.
The key battle now is $119–$120.
A sustained breakout above this zone could open the path toward $129.49, followed by $135.75–$142.97 and the major $150.08 Fibonacci level.
On the downside, $111–$114 is the first major retest zone. Holding this area would keep the breakout structure intact, while a deeper move below $106.05–$104.38 would weaken the current setup.
Bias: Recovery structure remains strong above $104.38. A sustained breakout above $119–$120 could open the path toward $129.49, with $150.08 as the next major Fibonacci objective.
$SOL
The broader structure has improved significantly, with SOL reclaiming the $110–$114 area and now testing the $119–$120 resistance zone. A sustained breakout above this region would bring the higher Fibonacci levels back into focus.
📈 EMA Structure
20 EMA: $104.38
50 EMA: $96.19
100 EMA: $90.15
200 EMA: $92.89
SOL is trading significantly above all four major EMAs.
The 20 EMA remains above the 50 EMA, while the 50 EMA is also above the 200 EMA. This alignment reflects a strong recovery structure and improving medium-term trend.
The $104–$106 region is now an important deeper support zone, while the $110–$114 area has developed into a key structural support region after the recent breakout.
📐 Fibonacci Levels
0.236: $114.35
0.382: $129.49
0.5: $150.08
0.618: $170.67
0.786: $199.99
1.0: $237.33
SOL has reclaimed the 0.236 Fibonacci level around $114.35 and is now trading above it.
The next major Fibonacci resistance is $129.49, followed by $150.08.
🟢 Bullish Scenario
Immediate resistance is around:
$119.61 → $120
A clean breakout and sustained close above the $119–$120 zone could open the path toward:
$129.49 → $135.75 → $142.97 → $150.08
The $129.49 level is the next major Fibonacci resistance. A successful breakout and retest above $129.49 would strengthen the continuation structure and put the $150.08 level into focus.
Above $150.08, the higher Fibonacci references are:
$170.67 → $199.99 → $237.33
🔴 Pullback Scenario
Key support levels:
$114.35
$113.71
$112.58
$112.25
$111.04
$109.84
$106.05
$104.38
$96.19
$92.89
$90.15
The $111–$114 zone is particularly important.
A pullback into this area followed by a successful hold would keep the breakout structure constructive. Losing $109.84–$106.05 would indicate deeper consolidation, while a sustained move below the $104.38 20 EMA would significantly weaken the current recovery structure.
🧠 Market Structure & Liquidity
Liquidity Sweep → Accumulation → Higher Lows → Breakout → Expansion → Retest → Consolidation → Continuation
SOL has moved through several important structural phases, recovering from the June low around $62.83, building higher lows, reclaiming the $100 area, and then breaking above the previous $110–$114 resistance region.
The current move toward $120 represents another expansion phase, with $119–$120 acting as the immediate decision zone.
📊 RSI Momentum
RSI: 70.46
RSI MA: 58.48
RSI has moved above 70, showing strong bullish momentum but also entering an overbought region.
This does not automatically mean a reversal. However, after the recent expansion, SOL could experience short-term consolidation or a pullback before attempting another leg higher.
The key will be whether RSI can remain elevated while price holds the $114–$119 structure.
🎯 Key Levels
Resistance:
$119.61 → $120 → $129.49 → $135.75 → $142.97 → $150.08 → $170.67 → $199.99
Support:
$114.35 → $113.71 → $112.58 → $112.25 → $111.04 → $109.84 → $106.05 → $104.38
Major EMA Support:
$104.38 / $96.19 / $92.89 / $90.15
📌 Final Outlook
SOL has strengthened considerably after reclaiming the $110–$114 region and pushing toward $120.
The key battle now is $119–$120.
A sustained breakout above this zone could open the path toward $129.49, followed by $135.75–$142.97 and the major $150.08 Fibonacci level.
On the downside, $111–$114 is the first major retest zone. Holding this area would keep the breakout structure intact, while a deeper move below $106.05–$104.38 would weaken the current setup.
Bias: Recovery structure remains strong above $104.38. A sustained breakout above $119–$120 could open the path toward $129.49, with $150.08 as the next major Fibonacci objective.
$SOL
35
·
--
Мақала
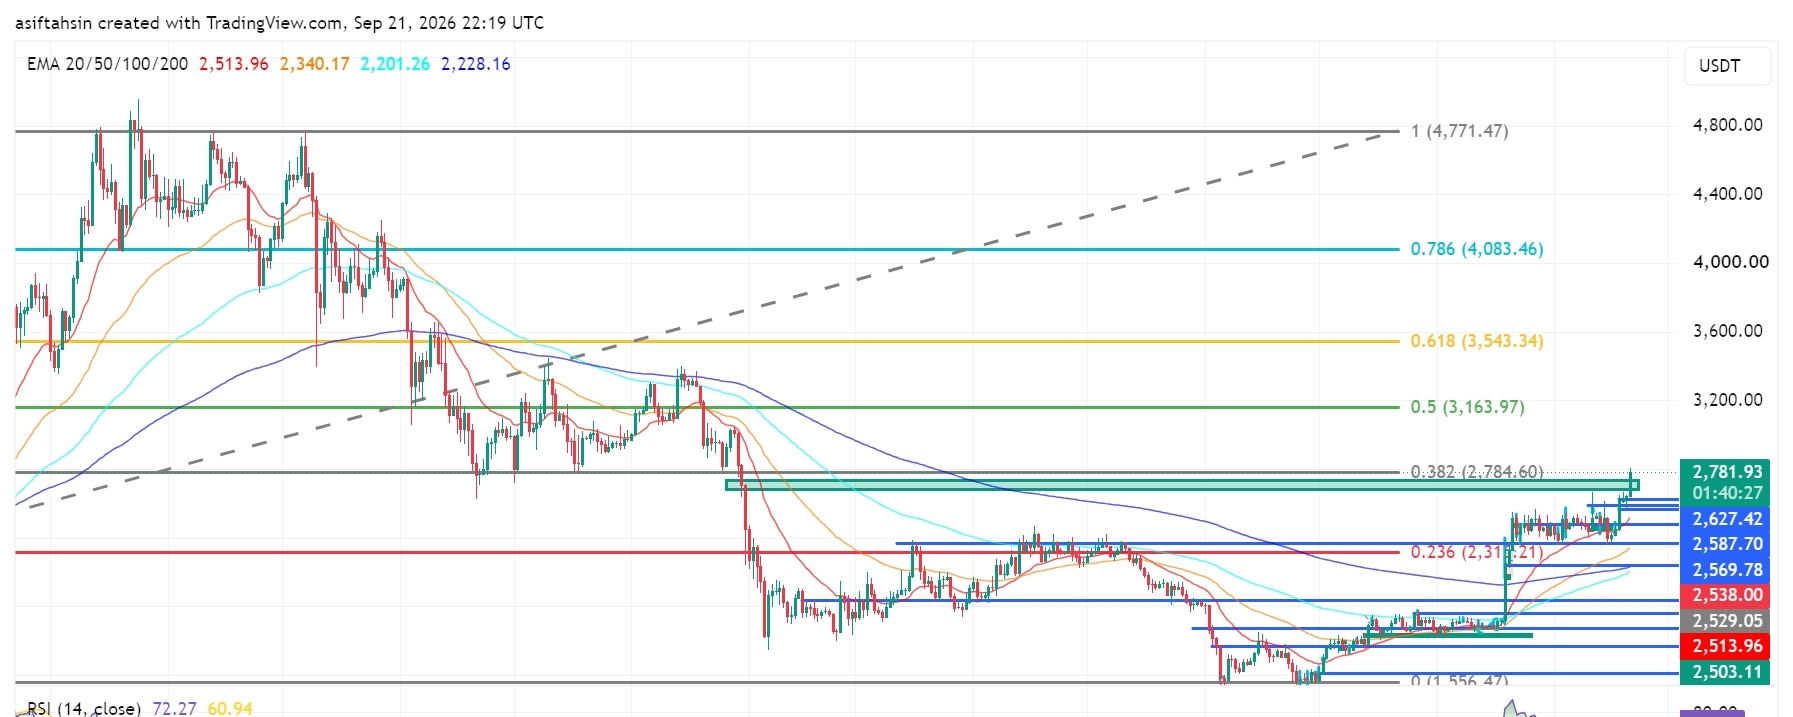
ETH Technical Outlook: Ethereum Reclaims $2.78K as Breakout Structure StrengthensETH is currently trading around $2,781.93, pushing into the major $2,784.60 Fibonacci resistance after a strong recovery from the $2,475–$2,500 area.
The broader structure has improved significantly, with ETH reclaiming the $2,500–$2,600 region and breaking above the previous consolidation range. A sustained breakout above $2,784.60 would bring the higher Fibonacci levels into focus.
📈 EMA Structure
20 EMA: $2,513.96
50 EMA: $2,340.17
100 EMA: $2,201.26
200 EMA: $2,228.16
ETH is trading well above all four major EMAs.
The 20 EMA remains above the 50 EMA, while the 100 EMA and 200 EMA are positioned significantly lower. This alignment reflects a strong recovery structure and improving medium-term momentum.
The $2,500–$2,540 region is now an important EMA/support zone.
📐 Fibonacci Levels
0.236: $2,315.21
0.382: $2,784.60
0.5: $3,163.97
0.618: $3,543.34
0.786: $4,083.46
1.0: $4,771.47
ETH is currently testing the 0.382 Fibonacci level at $2,784.60.
A clean breakout and sustained close above this level would shift attention toward $3,163.97, followed by the higher Fibonacci extensions.
🟢 Bullish Scenario
Immediate resistance sits around:
$2,784.60 → $2,800
A confirmed breakout above this area could open the path toward:
$3,163.97 → $3,543.34 → $4,083.46 → $4,771.47
The first major objective is the 0.5 Fibonacci level at $3,163.97. If ETH can establish support above $2,784.60 after the breakout, the recovery structure would become substantially stronger.
🔴 Pullback Scenario
Key support levels:
$2,672.47
$2,627.42
$2,587.70
$2,569.78
$2,538.00
$2,529.05
$2,513.96
$2,503.11
$2,479.06
$2,475.84
The $2,570–$2,630 zone is particularly important for a healthy retest.
Holding this area after a breakout would allow ETH to consolidate before another attempt higher. A deeper move below $2,500 would weaken the current breakout structure and bring the lower support zone back into focus.
🧠 Market Structure & Liquidity
Liquidity Sweep → Accumulation → Higher Lows → Breakout → Expansion → Retest → Consolidation → Continuation
ETH has transitioned from the prolonged decline into a clear recovery structure. The recent move above the $2,600–$2,670 region represents an important expansion phase, while the current move toward $2,784.60 is testing the next major structural resistance.
📊 RSI Momentum
RSI: 72.27
RSI MA: 60.94
RSI has moved above 70, showing strong momentum but also indicating that ETH is entering an overbought zone on this chart.
That does not automatically mean a reversal; however, after such a strong expansion, a short-term consolidation or pullback would be technically normal before another continuation attempt.
🎯 Key Levels
Resistance:
$2,784.60 → $2,800 → $3,163.97 → $3,543.34 → $4,083.46 → $4,771.47
Support:
$2,672.47 → $2,627.42 → $2,587.70 → $2,569.78 → $2,538 → $2,513.96 → $2,503.11 → $2,479.06
Major EMA Support:
$2,513.96 / $2,340.17 / $2,228.16 / $2,201.26
📌 Final Outlook
ETH has strengthened considerably after reclaiming the $2,500–$2,600 region and pushing toward the $2,784.60 Fibonacci resistance.
The key battle now is $2,784.60–$2,800.
A sustained breakout above this zone could open the path toward $3,163.97, followed by $3,543.34 and potentially $4,083.46.
On the downside, $2,570–$2,630 is the first major retest zone, while $2,500–$2,514 remains critical structural support.
Bias: Recovery structure remains strong above $2,500. A sustained breakout above $2,784.60 could open the path toward $3,163.97, with $3,543.34 as the next major Fibonacci level.
$ETH
{future}(ETHUSDT)
ETH Technical Outlook: Ethereum Reclaims $2.78K as Breakout Structure Strengthens
ETH is currently trading around $2,781.93, pushing into the major $2,784.60 Fibonacci resistance after a strong recovery from the $2,475–$2,500 area.
The broader structure has improved significantly, with ETH reclaiming the $2,500–$2,600 region and breaking above the previous consolidation range. A sustained breakout above $2,784.60 would bring the higher Fibonacci levels into focus.
📈 EMA Structure
20 EMA: $2,513.96
50 EMA: $2,340.17
100 EMA: $2,201.26
200 EMA: $2,228.16
ETH is trading well above all four major EMAs.
The 20 EMA remains above the 50 EMA, while the 100 EMA and 200 EMA are positioned significantly lower. This alignment reflects a strong recovery structure and improving medium-term momentum.
The $2,500–$2,540 region is now an important EMA/support zone.
📐 Fibonacci Levels
0.236: $2,315.21
0.382: $2,784.60
0.5: $3,163.97
0.618: $3,543.34
0.786: $4,083.46
1.0: $4,771.47
ETH is currently testing the 0.382 Fibonacci level at $2,784.60.
A clean breakout and sustained close above this level would shift attention toward $3,163.97, followed by the higher Fibonacci extensions.
🟢 Bullish Scenario
Immediate resistance sits around:
$2,784.60 → $2,800
A confirmed breakout above this area could open the path toward:
$3,163.97 → $3,543.34 → $4,083.46 → $4,771.47
The first major objective is the 0.5 Fibonacci level at $3,163.97. If ETH can establish support above $2,784.60 after the breakout, the recovery structure would become substantially stronger.
🔴 Pullback Scenario
Key support levels:
$2,672.47
$2,627.42
$2,587.70
$2,569.78
$2,538.00
$2,529.05
$2,513.96
$2,503.11
$2,479.06
$2,475.84
The $2,570–$2,630 zone is particularly important for a healthy retest.
Holding this area after a breakout would allow ETH to consolidate before another attempt higher. A deeper move below $2,500 would weaken the current breakout structure and bring the lower support zone back into focus.
🧠 Market Structure & Liquidity
Liquidity Sweep → Accumulation → Higher Lows → Breakout → Expansion → Retest → Consolidation → Continuation
ETH has transitioned from the prolonged decline into a clear recovery structure. The recent move above the $2,600–$2,670 region represents an important expansion phase, while the current move toward $2,784.60 is testing the next major structural resistance.
📊 RSI Momentum
RSI: 72.27
RSI MA: 60.94
RSI has moved above 70, showing strong momentum but also indicating that ETH is entering an overbought zone on this chart.
That does not automatically mean a reversal; however, after such a strong expansion, a short-term consolidation or pullback would be technically normal before another continuation attempt.
🎯 Key Levels
Resistance:
$2,784.60 → $2,800 → $3,163.97 → $3,543.34 → $4,083.46 → $4,771.47
Support:
$2,672.47 → $2,627.42 → $2,587.70 → $2,569.78 → $2,538 → $2,513.96 → $2,503.11 → $2,479.06
Major EMA Support:
$2,513.96 / $2,340.17 / $2,228.16 / $2,201.26
📌 Final Outlook
ETH has strengthened considerably after reclaiming the $2,500–$2,600 region and pushing toward the $2,784.60 Fibonacci resistance.
The key battle now is $2,784.60–$2,800.
A sustained breakout above this zone could open the path toward $3,163.97, followed by $3,543.34 and potentially $4,083.46.
On the downside, $2,570–$2,630 is the first major retest zone, while $2,500–$2,514 remains critical structural support.
Bias: Recovery structure remains strong above $2,500. A sustained breakout above $2,784.60 could open the path toward $3,163.97, with $3,543.34 as the next major Fibonacci level.
$ETH
The broader structure has improved significantly, with ETH reclaiming the $2,500–$2,600 region and breaking above the previous consolidation range. A sustained breakout above $2,784.60 would bring the higher Fibonacci levels into focus.
📈 EMA Structure
20 EMA: $2,513.96
50 EMA: $2,340.17
100 EMA: $2,201.26
200 EMA: $2,228.16
ETH is trading well above all four major EMAs.
The 20 EMA remains above the 50 EMA, while the 100 EMA and 200 EMA are positioned significantly lower. This alignment reflects a strong recovery structure and improving medium-term momentum.
The $2,500–$2,540 region is now an important EMA/support zone.
📐 Fibonacci Levels
0.236: $2,315.21
0.382: $2,784.60
0.5: $3,163.97
0.618: $3,543.34
0.786: $4,083.46
1.0: $4,771.47
ETH is currently testing the 0.382 Fibonacci level at $2,784.60.
A clean breakout and sustained close above this level would shift attention toward $3,163.97, followed by the higher Fibonacci extensions.
🟢 Bullish Scenario
Immediate resistance sits around:
$2,784.60 → $2,800
A confirmed breakout above this area could open the path toward:
$3,163.97 → $3,543.34 → $4,083.46 → $4,771.47
The first major objective is the 0.5 Fibonacci level at $3,163.97. If ETH can establish support above $2,784.60 after the breakout, the recovery structure would become substantially stronger.
🔴 Pullback Scenario
Key support levels:
$2,672.47
$2,627.42
$2,587.70
$2,569.78
$2,538.00
$2,529.05
$2,513.96
$2,503.11
$2,479.06
$2,475.84
The $2,570–$2,630 zone is particularly important for a healthy retest.
Holding this area after a breakout would allow ETH to consolidate before another attempt higher. A deeper move below $2,500 would weaken the current breakout structure and bring the lower support zone back into focus.
🧠 Market Structure & Liquidity
Liquidity Sweep → Accumulation → Higher Lows → Breakout → Expansion → Retest → Consolidation → Continuation
ETH has transitioned from the prolonged decline into a clear recovery structure. The recent move above the $2,600–$2,670 region represents an important expansion phase, while the current move toward $2,784.60 is testing the next major structural resistance.
📊 RSI Momentum
RSI: 72.27
RSI MA: 60.94
RSI has moved above 70, showing strong momentum but also indicating that ETH is entering an overbought zone on this chart.
That does not automatically mean a reversal; however, after such a strong expansion, a short-term consolidation or pullback would be technically normal before another continuation attempt.
🎯 Key Levels
Resistance:
$2,784.60 → $2,800 → $3,163.97 → $3,543.34 → $4,083.46 → $4,771.47
Support:
$2,672.47 → $2,627.42 → $2,587.70 → $2,569.78 → $2,538 → $2,513.96 → $2,503.11 → $2,479.06
Major EMA Support:
$2,513.96 / $2,340.17 / $2,228.16 / $2,201.26
📌 Final Outlook
ETH has strengthened considerably after reclaiming the $2,500–$2,600 region and pushing toward the $2,784.60 Fibonacci resistance.
The key battle now is $2,784.60–$2,800.
A sustained breakout above this zone could open the path toward $3,163.97, followed by $3,543.34 and potentially $4,083.46.
On the downside, $2,570–$2,630 is the first major retest zone, while $2,500–$2,514 remains critical structural support.
Bias: Recovery structure remains strong above $2,500. A sustained breakout above $2,784.60 could open the path toward $3,163.97, with $3,543.34 as the next major Fibonacci level.
$ETH
58
·
--
Мақала
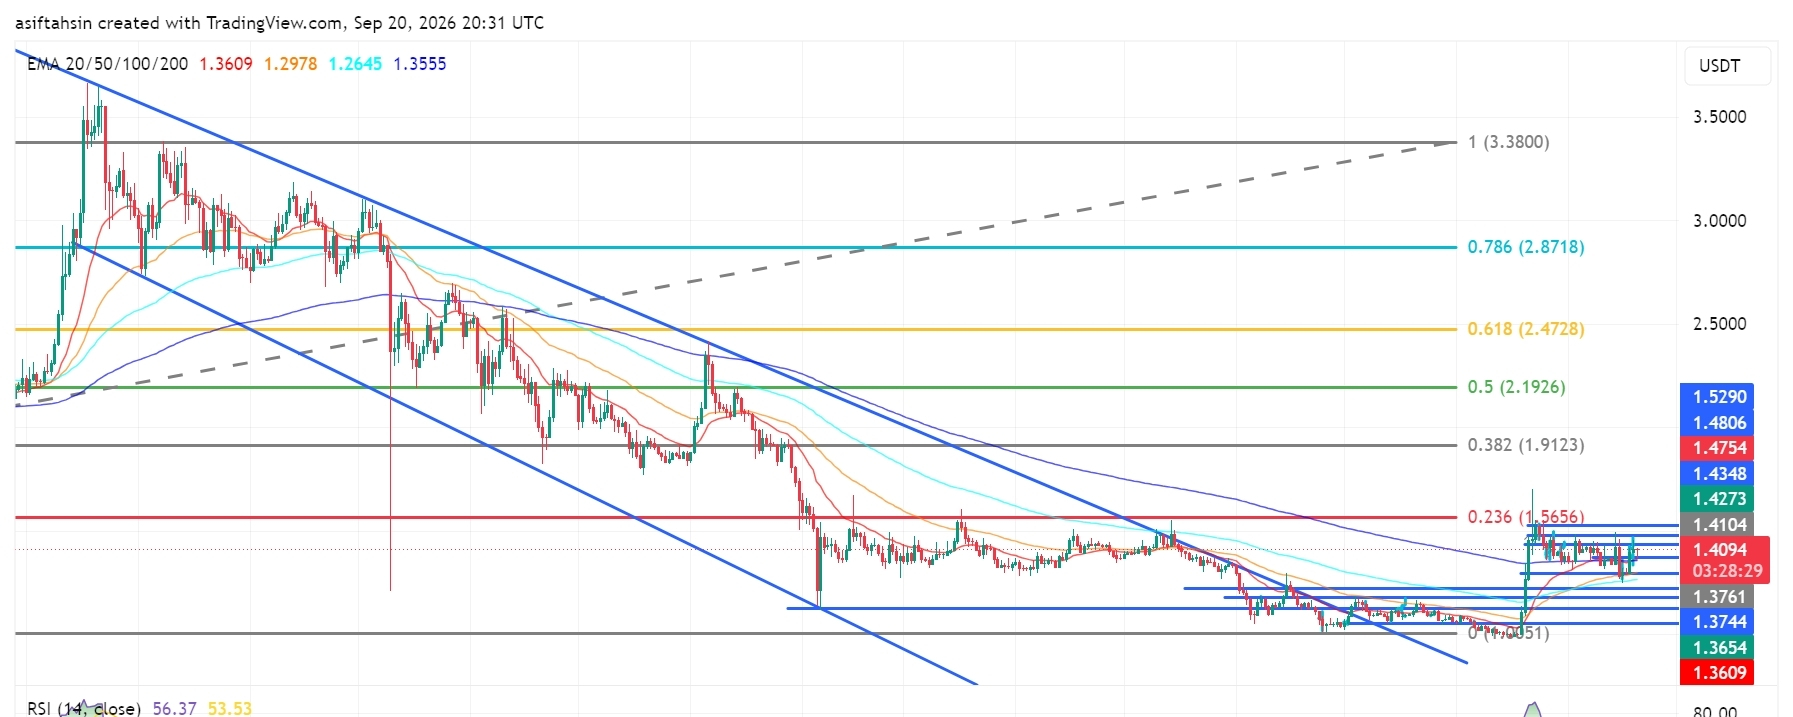
XRP Technical Outlook: XRP Holds Above $1.40 as Recovery Structure StrengthensXRP Technical Outlook: XRP Holds Above $1.40 as Recovery Structure Strengthens
XRP is currently trading around $1.41, holding above the $1.37–$1.40 region after the recent recovery from the $1.25–$1.30 support area.
The broader structure has improved, with price reclaiming the $1.40 area and moving back toward the major $1.41–$1.48 resistance zone. A sustained move through this area would put the higher Fibonacci levels back into focus.
Recent market commentary has also identified the $1.40 area as an important resistance/reclaim level, although short-term momentum remains sensitive around this zone.
📈 EMA Structure
20 EMA: $1.3609
50 EMA: $1.2978
100 EMA: $1.2646
200 EMA: $1.3555
XRP is currently trading well above the 20 EMA at $1.3609.
The recovery above the 50 EMA at $1.2978, 100 EMA at $1.2646, and 200 EMA at $1.3555 keeps the broader recovery structure constructive.
The 20 EMA remains above the 50 and 100 EMA, while price is also holding above the 200 EMA. This shows that the short-term recovery structure has strengthened considerably.
The $1.35–$1.36 area is now an important dynamic support zone during any pullback.
📐 Fibonacci Levels
Key Fibonacci levels:
0.236: $1.5656
0.382: $1.9123
0.5: $2.1926
0.618: $2.4728
0.786: $2.8718
1.0: $3.3800
XRP is currently trading below the 0.236 Fibonacci level at $1.5656, which remains the first major higher-timeframe Fibonacci resistance.
The next major Fibonacci reference above that is $1.9123 — 0.382 Fib.
A sustained move through the $1.41–$1.48 resistance structure could bring $1.5656 into focus, followed by $1.9123.
🟢 Bullish Scenario
XRP has recovered strongly from the lower support structure and is now consolidating around $1.40–$1.41.
Immediate resistance:
$1.4104
$1.4273
$1.4348
$1.4754
$1.4806
$1.5290
$1.5656 — 0.236 Fibonacci
A clean breakout and sustained close above $1.43–$1.48 would provide stronger confirmation of continued recovery.
🎯 Target 1: $1.4273
🎯 Target 2: $1.4348
🎯 Target 3: $1.4754
🎯 Target 4: $1.4806
🎯 Target 5: $1.5290
🎯 Target 6: $1.5656 — 0.236 Fibonacci
🎯 Target 7: $1.9123 — 0.382 Fibonacci
A confirmed move through the $1.48 zone could strengthen the medium-term recovery structure and bring the $1.53–$1.56 region into focus.
🔴 Pullback Scenario
After the recent expansion above $1.40, a retest of the breakout area would be normal.
Key supports:
$1.3761
$1.3744
$1.3654
$1.3609 — 20 EMA
$1.3575
$1.3555 — 200 EMA
$1.2978 — 50 EMA
$1.2646 — 100 EMA
The $1.36–$1.38 zone is particularly important.
If XRP continues to hold this area during a pullback, the current recovery structure remains active.
A sustained loss of $1.35 would weaken the current recovery structure and bring the lower EMA region back into focus.
🧠 Market Structure & Liquidity
XRP has formed a recovery structure after sweeping liquidity around the $1.25–$1.30 region.
The recent move produced a strong recovery through $1.35, followed by a breakout toward $1.40–$1.43.
XRP is now moving through an important:
Liquidity Sweep → Accumulation → Breakout → Recovery → Retest → Consolidation → Continuation
structure.
The major upside liquidity and resistance are concentrated around the $1.41–$1.48 region.
A decisive move through this area would place $1.5656 as the next major Fibonacci reference.
📊 RSI Momentum
RSI (14): 56.37
RSI MA: 53.53
RSI has moved above the neutral 50 level and remains in positive territory after the recent recovery.
The current reading of 56.37 shows constructive short-term momentum while remaining below the traditional 70 overbought threshold.
RSI is also above its moving average at 53.53, which supports the current recovery structure.
A sustained RSI above 60 would indicate stronger momentum, while a move back below 50 would signal increasing short-term weakness.
🎯 Key Levels
🔴 Major Resistance:
$1.4104 → $1.4273 → $1.4348 → $1.4754 → $1.4806 → $1.5290 → $1.5656
🟢 Major Support:
$1.3761 → $1.3744 → $1.3654 → $1.3609 → $1.3575
📉 Dynamic EMA Support:
$1.3609 — 20 EMA | $1.2978 — 50 EMA | $1.3555 — 200 EMA | $1.2646 — 100 EMA
🚀 Upside References:
$1.4348 → $1.4754 → $1.5290 → $1.5656 → $1.9123 → $2.1926
📌 Final Outlook
XRP's broader structure has strengthened after the recent recovery, with price now holding around $1.41 and above the major $1.35–$1.38 support structure.
The $1.36–$1.38 area is now an important short-term support region, while $1.41–$1.48 remains the immediate major resistance zone.
A confirmed move above $1.4806 could open the path toward $1.5290, followed by $1.5656 and eventually $1.9123.
However, rejection from the upper resistance area followed by a sustained loss of $1.35 would weaken the current recovery structure and bring the lower support zones back into focus.
Bias: 🟢 Recovery structure intact above $1.35. A sustained move above $1.4806 could open the path toward $1.5290, with $1.5656 as the next major Fibonacci reference.
$XRP
{future}(XRPUSDT)
XRP Technical Outlook: XRP Holds Above $1.40 as Recovery Structure Strengthens
XRP Technical Outlook: XRP Holds Above $1.40 as Recovery Structure Strengthens
XRP is currently trading around $1.41, holding above the $1.37–$1.40 region after the recent recovery from the $1.25–$1.30 support area.
The broader structure has improved, with price reclaiming the $1.40 area and moving back toward the major $1.41–$1.48 resistance zone. A sustained move through this area would put the higher Fibonacci levels back into focus.
Recent market commentary has also identified the $1.40 area as an important resistance/reclaim level, although short-term momentum remains sensitive around this zone.
📈 EMA Structure
20 EMA: $1.3609
50 EMA: $1.2978
100 EMA: $1.2646
200 EMA: $1.3555
XRP is currently trading well above the 20 EMA at $1.3609.
The recovery above the 50 EMA at $1.2978, 100 EMA at $1.2646, and 200 EMA at $1.3555 keeps the broader recovery structure constructive.
The 20 EMA remains above the 50 and 100 EMA, while price is also holding above the 200 EMA. This shows that the short-term recovery structure has strengthened considerably.
The $1.35–$1.36 area is now an important dynamic support zone during any pullback.
📐 Fibonacci Levels
Key Fibonacci levels:
0.236: $1.5656
0.382: $1.9123
0.5: $2.1926
0.618: $2.4728
0.786: $2.8718
1.0: $3.3800
XRP is currently trading below the 0.236 Fibonacci level at $1.5656, which remains the first major higher-timeframe Fibonacci resistance.
The next major Fibonacci reference above that is $1.9123 — 0.382 Fib.
A sustained move through the $1.41–$1.48 resistance structure could bring $1.5656 into focus, followed by $1.9123.
🟢 Bullish Scenario
XRP has recovered strongly from the lower support structure and is now consolidating around $1.40–$1.41.
Immediate resistance:
$1.4104
$1.4273
$1.4348
$1.4754
$1.4806
$1.5290
$1.5656 — 0.236 Fibonacci
A clean breakout and sustained close above $1.43–$1.48 would provide stronger confirmation of continued recovery.
🎯 Target 1: $1.4273
🎯 Target 2: $1.4348
🎯 Target 3: $1.4754
🎯 Target 4: $1.4806
🎯 Target 5: $1.5290
🎯 Target 6: $1.5656 — 0.236 Fibonacci
🎯 Target 7: $1.9123 — 0.382 Fibonacci
A confirmed move through the $1.48 zone could strengthen the medium-term recovery structure and bring the $1.53–$1.56 region into focus.
🔴 Pullback Scenario
After the recent expansion above $1.40, a retest of the breakout area would be normal.
Key supports:
$1.3761
$1.3744
$1.3654
$1.3609 — 20 EMA
$1.3575
$1.3555 — 200 EMA
$1.2978 — 50 EMA
$1.2646 — 100 EMA
The $1.36–$1.38 zone is particularly important.
If XRP continues to hold this area during a pullback, the current recovery structure remains active.
A sustained loss of $1.35 would weaken the current recovery structure and bring the lower EMA region back into focus.
🧠 Market Structure & Liquidity
XRP has formed a recovery structure after sweeping liquidity around the $1.25–$1.30 region.
The recent move produced a strong recovery through $1.35, followed by a breakout toward $1.40–$1.43.
XRP is now moving through an important:
Liquidity Sweep → Accumulation → Breakout → Recovery → Retest → Consolidation → Continuation
structure.
The major upside liquidity and resistance are concentrated around the $1.41–$1.48 region.
A decisive move through this area would place $1.5656 as the next major Fibonacci reference.
📊 RSI Momentum
RSI (14): 56.37
RSI MA: 53.53
RSI has moved above the neutral 50 level and remains in positive territory after the recent recovery.
The current reading of 56.37 shows constructive short-term momentum while remaining below the traditional 70 overbought threshold.
RSI is also above its moving average at 53.53, which supports the current recovery structure.
A sustained RSI above 60 would indicate stronger momentum, while a move back below 50 would signal increasing short-term weakness.
🎯 Key Levels
🔴 Major Resistance:
$1.4104 → $1.4273 → $1.4348 → $1.4754 → $1.4806 → $1.5290 → $1.5656
🟢 Major Support:
$1.3761 → $1.3744 → $1.3654 → $1.3609 → $1.3575
📉 Dynamic EMA Support:
$1.3609 — 20 EMA | $1.2978 — 50 EMA | $1.3555 — 200 EMA | $1.2646 — 100 EMA
🚀 Upside References:
$1.4348 → $1.4754 → $1.5290 → $1.5656 → $1.9123 → $2.1926
📌 Final Outlook
XRP's broader structure has strengthened after the recent recovery, with price now holding around $1.41 and above the major $1.35–$1.38 support structure.
The $1.36–$1.38 area is now an important short-term support region, while $1.41–$1.48 remains the immediate major resistance zone.
A confirmed move above $1.4806 could open the path toward $1.5290, followed by $1.5656 and eventually $1.9123.
However, rejection from the upper resistance area followed by a sustained loss of $1.35 would weaken the current recovery structure and bring the lower support zones back into focus.
Bias: 🟢 Recovery structure intact above $1.35. A sustained move above $1.4806 could open the path toward $1.5290, with $1.5656 as the next major Fibonacci reference.
$XRP
XRP is currently trading around $1.41, holding above the $1.37–$1.40 region after the recent recovery from the $1.25–$1.30 support area.
The broader structure has improved, with price reclaiming the $1.40 area and moving back toward the major $1.41–$1.48 resistance zone. A sustained move through this area would put the higher Fibonacci levels back into focus.
Recent market commentary has also identified the $1.40 area as an important resistance/reclaim level, although short-term momentum remains sensitive around this zone.
📈 EMA Structure
20 EMA: $1.3609
50 EMA: $1.2978
100 EMA: $1.2646
200 EMA: $1.3555
XRP is currently trading well above the 20 EMA at $1.3609.
The recovery above the 50 EMA at $1.2978, 100 EMA at $1.2646, and 200 EMA at $1.3555 keeps the broader recovery structure constructive.
The 20 EMA remains above the 50 and 100 EMA, while price is also holding above the 200 EMA. This shows that the short-term recovery structure has strengthened considerably.
The $1.35–$1.36 area is now an important dynamic support zone during any pullback.
📐 Fibonacci Levels
Key Fibonacci levels:
0.236: $1.5656
0.382: $1.9123
0.5: $2.1926
0.618: $2.4728
0.786: $2.8718
1.0: $3.3800
XRP is currently trading below the 0.236 Fibonacci level at $1.5656, which remains the first major higher-timeframe Fibonacci resistance.
The next major Fibonacci reference above that is $1.9123 — 0.382 Fib.
A sustained move through the $1.41–$1.48 resistance structure could bring $1.5656 into focus, followed by $1.9123.
🟢 Bullish Scenario
XRP has recovered strongly from the lower support structure and is now consolidating around $1.40–$1.41.
Immediate resistance:
$1.4104
$1.4273
$1.4348
$1.4754
$1.4806
$1.5290
$1.5656 — 0.236 Fibonacci
A clean breakout and sustained close above $1.43–$1.48 would provide stronger confirmation of continued recovery.
🎯 Target 1: $1.4273
🎯 Target 2: $1.4348
🎯 Target 3: $1.4754
🎯 Target 4: $1.4806
🎯 Target 5: $1.5290
🎯 Target 6: $1.5656 — 0.236 Fibonacci
🎯 Target 7: $1.9123 — 0.382 Fibonacci
A confirmed move through the $1.48 zone could strengthen the medium-term recovery structure and bring the $1.53–$1.56 region into focus.
🔴 Pullback Scenario
After the recent expansion above $1.40, a retest of the breakout area would be normal.
Key supports:
$1.3761
$1.3744
$1.3654
$1.3609 — 20 EMA
$1.3575
$1.3555 — 200 EMA
$1.2978 — 50 EMA
$1.2646 — 100 EMA
The $1.36–$1.38 zone is particularly important.
If XRP continues to hold this area during a pullback, the current recovery structure remains active.
A sustained loss of $1.35 would weaken the current recovery structure and bring the lower EMA region back into focus.
🧠 Market Structure & Liquidity
XRP has formed a recovery structure after sweeping liquidity around the $1.25–$1.30 region.
The recent move produced a strong recovery through $1.35, followed by a breakout toward $1.40–$1.43.
XRP is now moving through an important:
Liquidity Sweep → Accumulation → Breakout → Recovery → Retest → Consolidation → Continuation
structure.
The major upside liquidity and resistance are concentrated around the $1.41–$1.48 region.
A decisive move through this area would place $1.5656 as the next major Fibonacci reference.
📊 RSI Momentum
RSI (14): 56.37
RSI MA: 53.53
RSI has moved above the neutral 50 level and remains in positive territory after the recent recovery.
The current reading of 56.37 shows constructive short-term momentum while remaining below the traditional 70 overbought threshold.
RSI is also above its moving average at 53.53, which supports the current recovery structure.
A sustained RSI above 60 would indicate stronger momentum, while a move back below 50 would signal increasing short-term weakness.
🎯 Key Levels
🔴 Major Resistance:
$1.4104 → $1.4273 → $1.4348 → $1.4754 → $1.4806 → $1.5290 → $1.5656
🟢 Major Support:
$1.3761 → $1.3744 → $1.3654 → $1.3609 → $1.3575
📉 Dynamic EMA Support:
$1.3609 — 20 EMA | $1.2978 — 50 EMA | $1.3555 — 200 EMA | $1.2646 — 100 EMA
🚀 Upside References:
$1.4348 → $1.4754 → $1.5290 → $1.5656 → $1.9123 → $2.1926
📌 Final Outlook
XRP's broader structure has strengthened after the recent recovery, with price now holding around $1.41 and above the major $1.35–$1.38 support structure.
The $1.36–$1.38 area is now an important short-term support region, while $1.41–$1.48 remains the immediate major resistance zone.
A confirmed move above $1.4806 could open the path toward $1.5290, followed by $1.5656 and eventually $1.9123.
However, rejection from the upper resistance area followed by a sustained loss of $1.35 would weaken the current recovery structure and bring the lower support zones back into focus.
Bias: 🟢 Recovery structure intact above $1.35. A sustained move above $1.4806 could open the path toward $1.5290, with $1.5656 as the next major Fibonacci reference.
$XRP
2
1.2k
·
--
Мақала
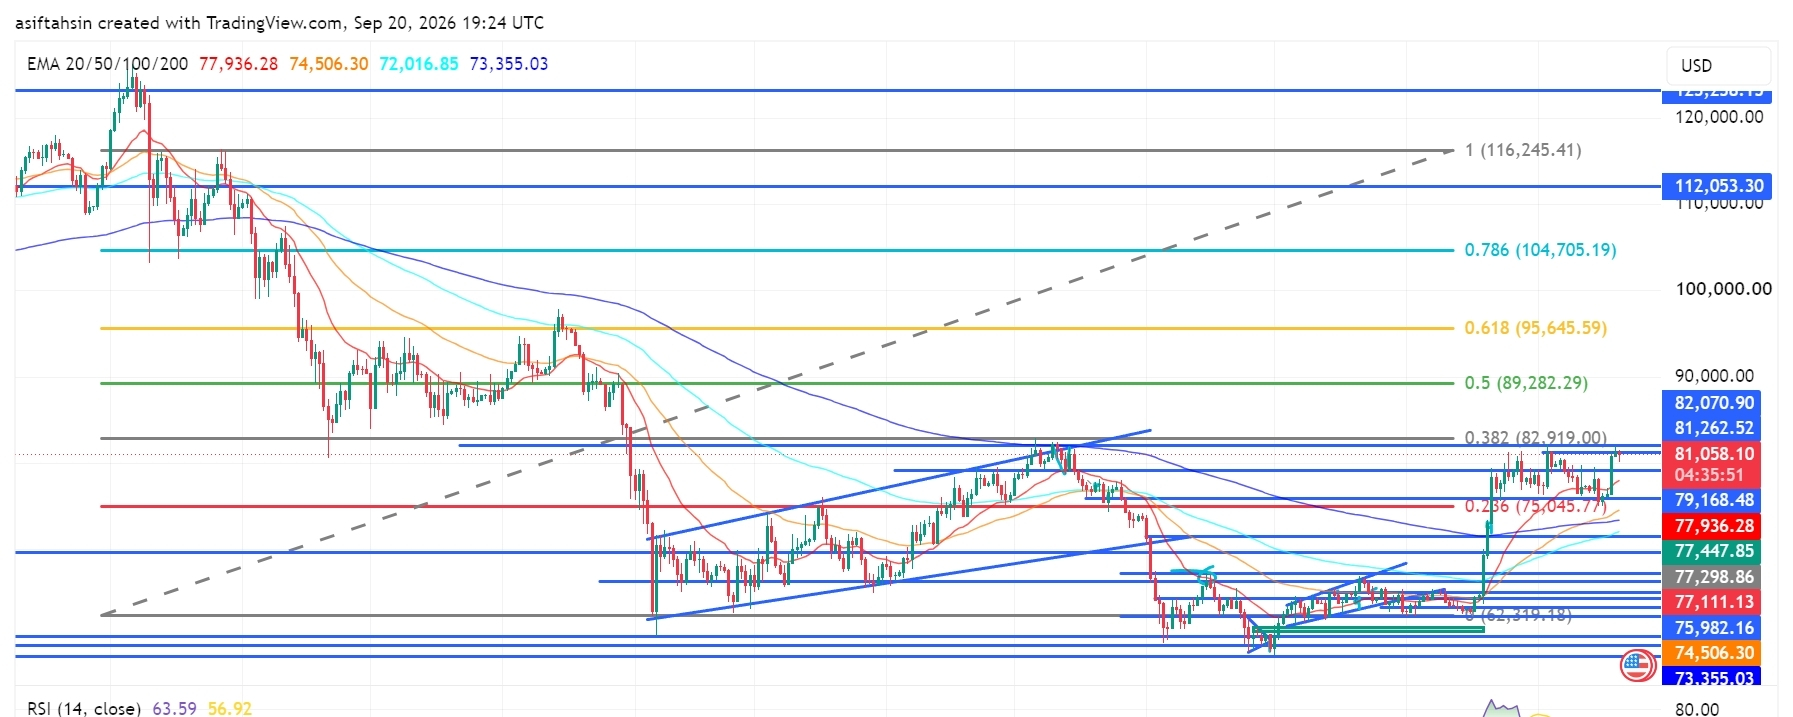
BTC Technical Outlook: Bitcoin Reclaims $81K as Recovery Structure StrengthensBTC is currently trading around $81,058, holding above the $79K–$80K region after the recent recovery from the $72K–$75K support area.
The broader structure has improved, with price reclaiming the $80K area and moving back toward the major $81.26K–$82.92K resistance zone. A sustained move through this area would put the higher Fibonacci levels back into focus.
📈 EMA Structure
20 EMA: $77,936.12
50 EMA: $74,506.24
100 EMA: $72,016.82
200 EMA: $73,355.02
BTC is currently trading well above the 20 EMA at $77,936.
The recovery above the 50 EMA at $74,506, 100 EMA at $72,016, and 200 EMA at $73,355 keeps the broader recovery structure constructive.
The 20 EMA remains above the longer-term EMA levels, showing improving short-term structure.
The $77.9K area remains an important dynamic support during any short-term pullback.
📐 Fibonacci Levels
Key Fibonacci levels:
0.236: $75,045.77
0.382: $82,919.00
0.5: $89,282.29
0.618: $95,645.59
0.786: $104,705.19
1.0: $116,245.41
BTC is currently trading above the 0.236 Fibonacci level at $75,045.77.
The next major Fibonacci reference is $82,919 — 0.382 Fib.
A sustained move above the $81K–$82.9K resistance area could bring $89,282 into focus, followed by $95,645.
🟢 Bullish Scenario
BTC has recovered strongly from the lower support structure and is now consolidating around $80K–$81K.
Immediate resistance:
$81,262.52
$82,070.90
$82,919.00 — 0.382 Fibonacci
$89,282.29 — 0.5 Fibonacci
$95,645.59 — 0.618 Fibonacci
A clean breakout and sustained close above $82K–$82.92K would provide stronger confirmation of continued recovery.
🎯 Target 1: $82,070.90
🎯 Target 2: $82,919.00 — 0.382 Fibonacci
🎯 Target 3: $89,282.29 — 0.5 Fibonacci
🎯 Target 4: $95,645.59 — 0.618 Fibonacci
🎯 Target 5: $104,705.19 — 0.786 Fibonacci
🎯 Target 6: $112,053.30
🎯 Target 7: $116,245.41 — 1.0 Fibonacci
A confirmed move through the $82.92K zone could strengthen the medium-term recovery structure and bring the $89K–$95K region into focus.
🔴 Pullback Scenario
After the recent expansion from the $75K region toward $81K, a retest of the breakout area would be normal.
Key supports:
$79,168.48
$77,936.12 — 20 EMA
$77,447.85
$77,298.86
$77,111.13
$75,982.16
$75,045.77 — 0.236 Fibonacci
$74,506.24 — 50 EMA
$73,355.02 — 200 EMA
$72,016.82 — 100 EMA
The $77K–$79K zone is particularly important.
If BTC continues to hold this area during a pullback, the current recovery structure remains active.
A sustained loss of $75,045 would weaken the current structure and bring the lower EMA support region back into focus.
🧠 Market Structure & Liquidity
BTC has formed a recovery structure after sweeping liquidity around the $72K–$75K region.
The recent move produced a strong recovery through $75K, followed by a breakout toward $80K–$81K.
BTC is now moving through an important:
Liquidity Sweep → Accumulation → Higher Lows → Breakout → Expansion → Retest → Consolidation → Continuation
structure.
The major upside liquidity and resistance are concentrated around the $81.26K–$82.92K region.
A decisive move through this area would place $89,282 as the next major Fibonacci reference.
📊 RSI Momentum
RSI (14): 63.59
RSI MA: 56.92
RSI has moved above the neutral 50 level and remains firmly in positive territory after the recent expansion.
The current reading around 63.59 shows stronger short-term momentum while remaining below the traditional 70 overbought threshold.
A sustained RSI above 60 would keep momentum supportive, while a move back below 50 would indicate increasing short-term weakness.
🎯 Key Levels
🔴 Major Resistance:
$81,262.52 → $82,070.90 → $82,919.00 → $89,282.29 → $95,645.59
🟢 Major Support:
$79,168.48 → $77,936.12 → $77,447.85 → $77,298.86 → $77,111.13 → $75,982.16 → $75,045.77
📉 Dynamic EMA Support:
$77,936.12 — 20 EMA | $74,506.24 — 50 EMA | $73,355.02 — 200 EMA | $72,016.82 — 100 EMA
🚀 Upside References:
$82,919 → $89,282 → $95,645 → $104,705 → $112,053 → $116,245
📌 Final Outlook
BTC's broader structure has strengthened after the recent recovery, with price now holding around $81K and above the major $75K–$79K support structure.
The $77K–$79K area is now an important short-term support region, while $81.26K–$82.92K remains the immediate major resistance zone.
A confirmed move above $82,919 could open the path toward $89,282, followed by $95,645 and $104,705.
However, rejection from the upper resistance area followed by a sustained loss of $75,045 would weaken the current recovery structure and bring the lower support zones back into focus.
Bias: 🟢 Recovery structure intact above $75,045. A sustained move above $82,919 could open the path toward $89,282, with $95,645 as the next major Fibonacci reference.
$BTC
{future}(BTCUSDT)
BTC Technical Outlook: Bitcoin Reclaims $81K as Recovery Structure Strengthens
BTC is currently trading around $81,058, holding above the $79K–$80K region after the recent recovery from the $72K–$75K support area.
The broader structure has improved, with price reclaiming the $80K area and moving back toward the major $81.26K–$82.92K resistance zone. A sustained move through this area would put the higher Fibonacci levels back into focus.
📈 EMA Structure
20 EMA: $77,936.12
50 EMA: $74,506.24
100 EMA: $72,016.82
200 EMA: $73,355.02
BTC is currently trading well above the 20 EMA at $77,936.
The recovery above the 50 EMA at $74,506, 100 EMA at $72,016, and 200 EMA at $73,355 keeps the broader recovery structure constructive.
The 20 EMA remains above the longer-term EMA levels, showing improving short-term structure.
The $77.9K area remains an important dynamic support during any short-term pullback.
📐 Fibonacci Levels
Key Fibonacci levels:
0.236: $75,045.77
0.382: $82,919.00
0.5: $89,282.29
0.618: $95,645.59
0.786: $104,705.19
1.0: $116,245.41
BTC is currently trading above the 0.236 Fibonacci level at $75,045.77.
The next major Fibonacci reference is $82,919 — 0.382 Fib.
A sustained move above the $81K–$82.9K resistance area could bring $89,282 into focus, followed by $95,645.
🟢 Bullish Scenario
BTC has recovered strongly from the lower support structure and is now consolidating around $80K–$81K.
Immediate resistance:
$81,262.52
$82,070.90
$82,919.00 — 0.382 Fibonacci
$89,282.29 — 0.5 Fibonacci
$95,645.59 — 0.618 Fibonacci
A clean breakout and sustained close above $82K–$82.92K would provide stronger confirmation of continued recovery.
🎯 Target 1: $82,070.90
🎯 Target 2: $82,919.00 — 0.382 Fibonacci
🎯 Target 3: $89,282.29 — 0.5 Fibonacci
🎯 Target 4: $95,645.59 — 0.618 Fibonacci
🎯 Target 5: $104,705.19 — 0.786 Fibonacci
🎯 Target 6: $112,053.30
🎯 Target 7: $116,245.41 — 1.0 Fibonacci
A confirmed move through the $82.92K zone could strengthen the medium-term recovery structure and bring the $89K–$95K region into focus.
🔴 Pullback Scenario
After the recent expansion from the $75K region toward $81K, a retest of the breakout area would be normal.
Key supports:
$79,168.48
$77,936.12 — 20 EMA
$77,447.85
$77,298.86
$77,111.13
$75,982.16
$75,045.77 — 0.236 Fibonacci
$74,506.24 — 50 EMA
$73,355.02 — 200 EMA
$72,016.82 — 100 EMA
The $77K–$79K zone is particularly important.
If BTC continues to hold this area during a pullback, the current recovery structure remains active.
A sustained loss of $75,045 would weaken the current structure and bring the lower EMA support region back into focus.
🧠 Market Structure & Liquidity
BTC has formed a recovery structure after sweeping liquidity around the $72K–$75K region.
The recent move produced a strong recovery through $75K, followed by a breakout toward $80K–$81K.
BTC is now moving through an important:
Liquidity Sweep → Accumulation → Higher Lows → Breakout → Expansion → Retest → Consolidation → Continuation
structure.
The major upside liquidity and resistance are concentrated around the $81.26K–$82.92K region.
A decisive move through this area would place $89,282 as the next major Fibonacci reference.
📊 RSI Momentum
RSI (14): 63.59
RSI MA: 56.92
RSI has moved above the neutral 50 level and remains firmly in positive territory after the recent expansion.
The current reading around 63.59 shows stronger short-term momentum while remaining below the traditional 70 overbought threshold.
A sustained RSI above 60 would keep momentum supportive, while a move back below 50 would indicate increasing short-term weakness.
🎯 Key Levels
🔴 Major Resistance:
$81,262.52 → $82,070.90 → $82,919.00 → $89,282.29 → $95,645.59
🟢 Major Support:
$79,168.48 → $77,936.12 → $77,447.85 → $77,298.86 → $77,111.13 → $75,982.16 → $75,045.77
📉 Dynamic EMA Support:
$77,936.12 — 20 EMA | $74,506.24 — 50 EMA | $73,355.02 — 200 EMA | $72,016.82 — 100 EMA
🚀 Upside References:
$82,919 → $89,282 → $95,645 → $104,705 → $112,053 → $116,245
📌 Final Outlook
BTC's broader structure has strengthened after the recent recovery, with price now holding around $81K and above the major $75K–$79K support structure.
The $77K–$79K area is now an important short-term support region, while $81.26K–$82.92K remains the immediate major resistance zone.
A confirmed move above $82,919 could open the path toward $89,282, followed by $95,645 and $104,705.
However, rejection from the upper resistance area followed by a sustained loss of $75,045 would weaken the current recovery structure and bring the lower support zones back into focus.
Bias: 🟢 Recovery structure intact above $75,045. A sustained move above $82,919 could open the path toward $89,282, with $95,645 as the next major Fibonacci reference.
$BTC
The broader structure has improved, with price reclaiming the $80K area and moving back toward the major $81.26K–$82.92K resistance zone. A sustained move through this area would put the higher Fibonacci levels back into focus.
📈 EMA Structure
20 EMA: $77,936.12
50 EMA: $74,506.24
100 EMA: $72,016.82
200 EMA: $73,355.02
BTC is currently trading well above the 20 EMA at $77,936.
The recovery above the 50 EMA at $74,506, 100 EMA at $72,016, and 200 EMA at $73,355 keeps the broader recovery structure constructive.
The 20 EMA remains above the longer-term EMA levels, showing improving short-term structure.
The $77.9K area remains an important dynamic support during any short-term pullback.
📐 Fibonacci Levels
Key Fibonacci levels:
0.236: $75,045.77
0.382: $82,919.00
0.5: $89,282.29
0.618: $95,645.59
0.786: $104,705.19
1.0: $116,245.41
BTC is currently trading above the 0.236 Fibonacci level at $75,045.77.
The next major Fibonacci reference is $82,919 — 0.382 Fib.
A sustained move above the $81K–$82.9K resistance area could bring $89,282 into focus, followed by $95,645.
🟢 Bullish Scenario
BTC has recovered strongly from the lower support structure and is now consolidating around $80K–$81K.
Immediate resistance:
$81,262.52
$82,070.90
$82,919.00 — 0.382 Fibonacci
$89,282.29 — 0.5 Fibonacci
$95,645.59 — 0.618 Fibonacci
A clean breakout and sustained close above $82K–$82.92K would provide stronger confirmation of continued recovery.
🎯 Target 1: $82,070.90
🎯 Target 2: $82,919.00 — 0.382 Fibonacci
🎯 Target 3: $89,282.29 — 0.5 Fibonacci
🎯 Target 4: $95,645.59 — 0.618 Fibonacci
🎯 Target 5: $104,705.19 — 0.786 Fibonacci
🎯 Target 6: $112,053.30
🎯 Target 7: $116,245.41 — 1.0 Fibonacci
A confirmed move through the $82.92K zone could strengthen the medium-term recovery structure and bring the $89K–$95K region into focus.
🔴 Pullback Scenario
After the recent expansion from the $75K region toward $81K, a retest of the breakout area would be normal.
Key supports:
$79,168.48
$77,936.12 — 20 EMA
$77,447.85
$77,298.86
$77,111.13
$75,982.16
$75,045.77 — 0.236 Fibonacci
$74,506.24 — 50 EMA
$73,355.02 — 200 EMA
$72,016.82 — 100 EMA
The $77K–$79K zone is particularly important.
If BTC continues to hold this area during a pullback, the current recovery structure remains active.
A sustained loss of $75,045 would weaken the current structure and bring the lower EMA support region back into focus.
🧠 Market Structure & Liquidity
BTC has formed a recovery structure after sweeping liquidity around the $72K–$75K region.
The recent move produced a strong recovery through $75K, followed by a breakout toward $80K–$81K.
BTC is now moving through an important:
Liquidity Sweep → Accumulation → Higher Lows → Breakout → Expansion → Retest → Consolidation → Continuation
structure.
The major upside liquidity and resistance are concentrated around the $81.26K–$82.92K region.
A decisive move through this area would place $89,282 as the next major Fibonacci reference.
📊 RSI Momentum
RSI (14): 63.59
RSI MA: 56.92
RSI has moved above the neutral 50 level and remains firmly in positive territory after the recent expansion.
The current reading around 63.59 shows stronger short-term momentum while remaining below the traditional 70 overbought threshold.
A sustained RSI above 60 would keep momentum supportive, while a move back below 50 would indicate increasing short-term weakness.
🎯 Key Levels
🔴 Major Resistance:
$81,262.52 → $82,070.90 → $82,919.00 → $89,282.29 → $95,645.59
🟢 Major Support:
$79,168.48 → $77,936.12 → $77,447.85 → $77,298.86 → $77,111.13 → $75,982.16 → $75,045.77
📉 Dynamic EMA Support:
$77,936.12 — 20 EMA | $74,506.24 — 50 EMA | $73,355.02 — 200 EMA | $72,016.82 — 100 EMA
🚀 Upside References:
$82,919 → $89,282 → $95,645 → $104,705 → $112,053 → $116,245
📌 Final Outlook
BTC's broader structure has strengthened after the recent recovery, with price now holding around $81K and above the major $75K–$79K support structure.
The $77K–$79K area is now an important short-term support region, while $81.26K–$82.92K remains the immediate major resistance zone.
A confirmed move above $82,919 could open the path toward $89,282, followed by $95,645 and $104,705.
However, rejection from the upper resistance area followed by a sustained loss of $75,045 would weaken the current recovery structure and bring the lower support zones back into focus.
Bias: 🟢 Recovery structure intact above $75,045. A sustained move above $82,919 could open the path toward $89,282, with $95,645 as the next major Fibonacci reference.
$BTC
43
·
--
Мақала
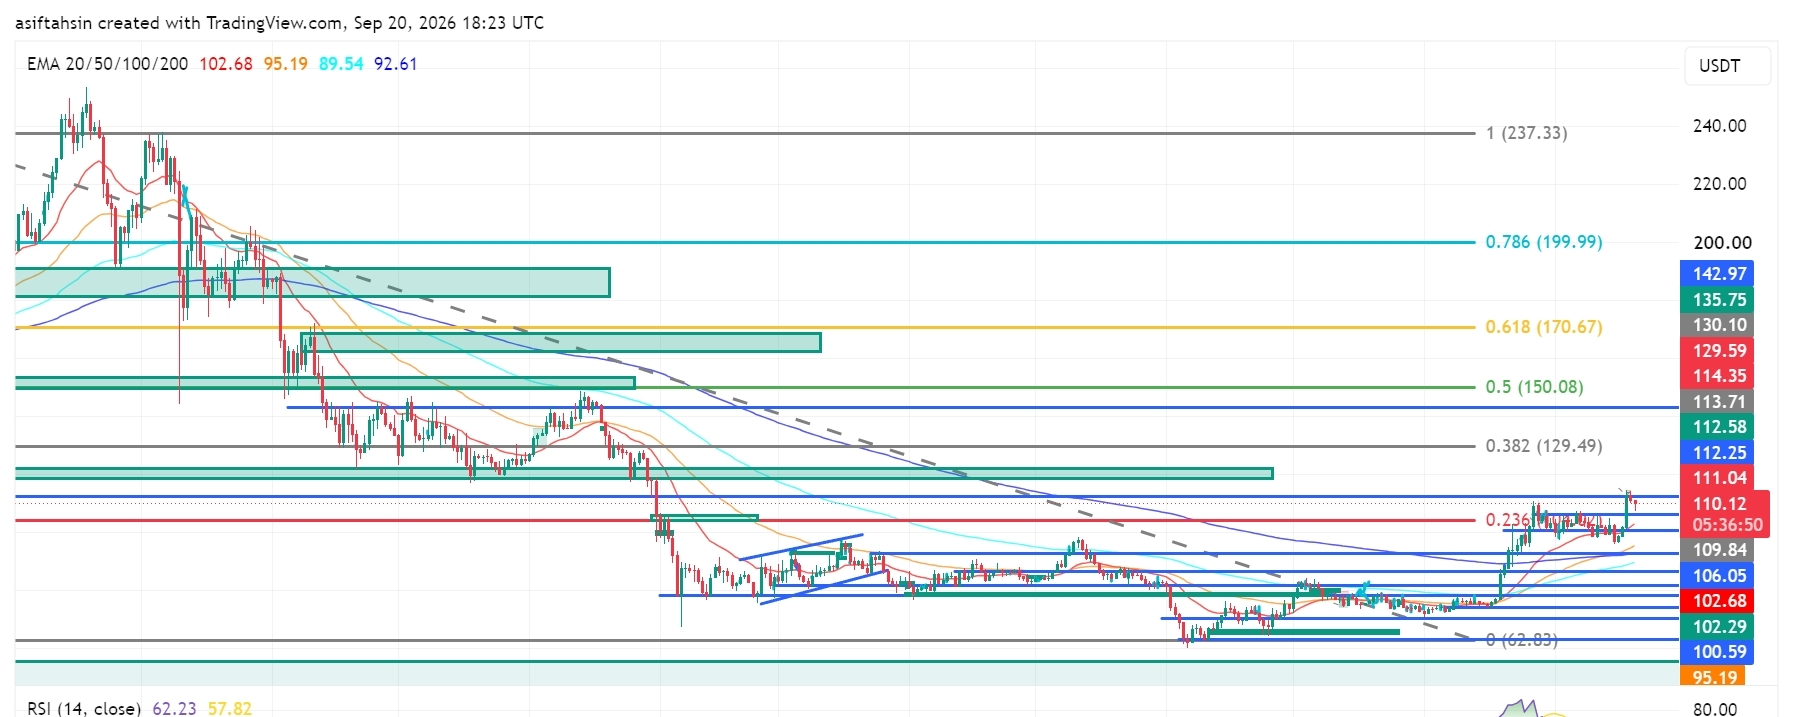
SOL Technical Outlook: Solana Reclaims $110 as Recovery Structure StrengthensSOL is currently trading around $110.1, holding above the $106–$109 region after the recent recovery from the $92–$100 support area.
The broader structure has improved, with price reclaiming the $100 area and moving back toward the major $111–$114 resistance zone. A sustained move through this area would put the higher Fibonacci levels back into focus.
📈 EMA Structure
20 EMA: $102.68
50 EMA: $95.19
100 EMA: $89.54
200 EMA: $92.61
SOL is currently trading well above the 20 EMA at $102.68.
The recovery above the 50 EMA at $95.19, 100 EMA at $89.54, and 200 EMA at $92.61 keeps the broader recovery structure constructive.
The 20 EMA remains above the longer-term EMA levels, showing improving short-term structure.
📐 Fibonacci Levels
Key Fibonacci levels:
0.236: $104.64
0.382: $129.49
0.5: $150.08
0.618: $170.67
0.786: $199.99
1.0: $237.33
SOL is currently trading above the 0.236 Fibonacci level at $104.64.
The next major Fibonacci reference is $129.49 — 0.382 Fib.
A sustained move above the $111–$114 zone could bring $129.49 into focus, followed by $150.08.
🟢 Bullish Scenario
SOL has recovered strongly from the lower support structure and is now consolidating around $109–$111.
Immediate resistance:
$111.04
$112.25
$112.58
$113.71
$129.49 — 0.382 Fibonacci
$150.08 — 0.5 Fibonacci
A clean breakout and sustained close above $112–$114 would provide stronger confirmation of continued recovery.
🎯 Target 1: $112.58
🎯 Target 2: $113.71
🎯 Target 3: $129.49 — 0.382 Fibonacci
🎯 Target 4: $150.08 — 0.5 Fibonacci
🎯 Target 5: $170.67 — 0.618 Fibonacci
🎯 Target 6: $199.99 — 0.786 Fibonacci
🎯 Target 7: $237.33 — 1.0 Fibonacci
A confirmed move through the $112–$114 zone could strengthen the medium-term recovery structure and bring the $129–$150 region into focus.
🔴 Pullback Scenario
After the recent expansion above $100, a retest of the breakout area would be normal.
Key supports:
$109.84
$106.05
$104.64 — 0.236 Fibonacci
$102.68 — 20 EMA
$100.59
$95.19 — 50 EMA
$92.61 — 200 EMA
$89.54 — 100 EMA
The $102–$106 zone is particularly important.
If SOL continues to hold this area during a pullback, the current recovery structure remains active.
A sustained loss of $100.59 would weaken the current recovery structure and bring the lower EMA region back into focus.
🧠 Market Structure & Liquidity
SOL has formed a recovery structure after sweeping liquidity around the $92–$100 region.
The recent move produced a strong recovery through $100, followed by a breakout toward $110–$113.
SOL is now moving through an important:
Recovery → Breakout → Retest → Consolidation → Continuation
structure.
The major upside liquidity is concentrated around the $111–$114 region. A decisive move through this area would place $129.49 as the next major Fibonacci reference.
📊 RSI Momentum
RSI (14): 62.23
RSI has moved above the neutral 50 level and remains in positive territory after the recent expansion.
The current reading shows stronger short-term momentum, while still remaining below the traditional 70 overbought threshold.
A sustained RSI above 60 would keep momentum supportive, while a move back below 50 would indicate increasing short-term weakness.
🎯 Key Levels
🔴 Major Resistance: $111.04 → $112.25 → $112.58 → $113.71 → $129.49 → $150.08
🟢 Major Support: $109.84 → $106.05 → $104.64 → $102.68 → $100.59 → $95.19
📉 Dynamic EMA Support: $102.68 — 20 EMA | $95.19 — 50 EMA | $92.61 — 200 EMA | $89.54 — 100 EMA
🚀 Upside References: $113.71 → $129.49 → $150.08 → $170.67 → $199.99 → $237.33
📌 Final Outlook
SOL's broader structure has strengthened after the recent recovery, with price now holding around $110 and above the major $100–$106 support structure.
The $102–$106 area is now an important short-term support region, while $111–$114 remains the immediate major resistance zone.
A confirmed move above $113.71 could open the path toward $129.49, followed by $150.08 and $170.67.
However, rejection from the upper resistance area followed by a sustained loss of $100.59 would weaken the current recovery structure and bring the lower support zones back into focus.
Bias: 🟢 Recovery structure intact above $100.59. A sustained move above $113.71 could open the path toward $129.49, with $150.08 as the next major Fibonacci reference.
$SOL
{future}(SOLUSDT)
SOL Technical Outlook: Solana Reclaims $110 as Recovery Structure Strengthens
SOL is currently trading around $110.1, holding above the $106–$109 region after the recent recovery from the $92–$100 support area.
The broader structure has improved, with price reclaiming the $100 area and moving back toward the major $111–$114 resistance zone. A sustained move through this area would put the higher Fibonacci levels back into focus.
📈 EMA Structure
20 EMA: $102.68
50 EMA: $95.19
100 EMA: $89.54
200 EMA: $92.61
SOL is currently trading well above the 20 EMA at $102.68.
The recovery above the 50 EMA at $95.19, 100 EMA at $89.54, and 200 EMA at $92.61 keeps the broader recovery structure constructive.
The 20 EMA remains above the longer-term EMA levels, showing improving short-term structure.
📐 Fibonacci Levels
Key Fibonacci levels:
0.236: $104.64
0.382: $129.49
0.5: $150.08
0.618: $170.67
0.786: $199.99
1.0: $237.33
SOL is currently trading above the 0.236 Fibonacci level at $104.64.
The next major Fibonacci reference is $129.49 — 0.382 Fib.
A sustained move above the $111–$114 zone could bring $129.49 into focus, followed by $150.08.
🟢 Bullish Scenario
SOL has recovered strongly from the lower support structure and is now consolidating around $109–$111.
Immediate resistance:
$111.04
$112.25
$112.58
$113.71
$129.49 — 0.382 Fibonacci
$150.08 — 0.5 Fibonacci
A clean breakout and sustained close above $112–$114 would provide stronger confirmation of continued recovery.
🎯 Target 1: $112.58
🎯 Target 2: $113.71
🎯 Target 3: $129.49 — 0.382 Fibonacci
🎯 Target 4: $150.08 — 0.5 Fibonacci
🎯 Target 5: $170.67 — 0.618 Fibonacci
🎯 Target 6: $199.99 — 0.786 Fibonacci
🎯 Target 7: $237.33 — 1.0 Fibonacci
A confirmed move through the $112–$114 zone could strengthen the medium-term recovery structure and bring the $129–$150 region into focus.
🔴 Pullback Scenario
After the recent expansion above $100, a retest of the breakout area would be normal.
Key supports:
$109.84
$106.05
$104.64 — 0.236 Fibonacci
$102.68 — 20 EMA
$100.59
$95.19 — 50 EMA
$92.61 — 200 EMA
$89.54 — 100 EMA
The $102–$106 zone is particularly important.
If SOL continues to hold this area during a pullback, the current recovery structure remains active.
A sustained loss of $100.59 would weaken the current recovery structure and bring the lower EMA region back into focus.
🧠 Market Structure & Liquidity
SOL has formed a recovery structure after sweeping liquidity around the $92–$100 region.
The recent move produced a strong recovery through $100, followed by a breakout toward $110–$113.
SOL is now moving through an important:
Recovery → Breakout → Retest → Consolidation → Continuation
structure.
The major upside liquidity is concentrated around the $111–$114 region. A decisive move through this area would place $129.49 as the next major Fibonacci reference.
📊 RSI Momentum
RSI (14): 62.23
RSI has moved above the neutral 50 level and remains in positive territory after the recent expansion.
The current reading shows stronger short-term momentum, while still remaining below the traditional 70 overbought threshold.
A sustained RSI above 60 would keep momentum supportive, while a move back below 50 would indicate increasing short-term weakness.
🎯 Key Levels
🔴 Major Resistance: $111.04 → $112.25 → $112.58 → $113.71 → $129.49 → $150.08
🟢 Major Support: $109.84 → $106.05 → $104.64 → $102.68 → $100.59 → $95.19
📉 Dynamic EMA Support: $102.68 — 20 EMA | $95.19 — 50 EMA | $92.61 — 200 EMA | $89.54 — 100 EMA
🚀 Upside References: $113.71 → $129.49 → $150.08 → $170.67 → $199.99 → $237.33
📌 Final Outlook
SOL's broader structure has strengthened after the recent recovery, with price now holding around $110 and above the major $100–$106 support structure.
The $102–$106 area is now an important short-term support region, while $111–$114 remains the immediate major resistance zone.
A confirmed move above $113.71 could open the path toward $129.49, followed by $150.08 and $170.67.
However, rejection from the upper resistance area followed by a sustained loss of $100.59 would weaken the current recovery structure and bring the lower support zones back into focus.
Bias: 🟢 Recovery structure intact above $100.59. A sustained move above $113.71 could open the path toward $129.49, with $150.08 as the next major Fibonacci reference.
$SOL
The broader structure has improved, with price reclaiming the $100 area and moving back toward the major $111–$114 resistance zone. A sustained move through this area would put the higher Fibonacci levels back into focus.
📈 EMA Structure
20 EMA: $102.68
50 EMA: $95.19
100 EMA: $89.54
200 EMA: $92.61
SOL is currently trading well above the 20 EMA at $102.68.
The recovery above the 50 EMA at $95.19, 100 EMA at $89.54, and 200 EMA at $92.61 keeps the broader recovery structure constructive.
The 20 EMA remains above the longer-term EMA levels, showing improving short-term structure.
📐 Fibonacci Levels
Key Fibonacci levels:
0.236: $104.64
0.382: $129.49
0.5: $150.08
0.618: $170.67
0.786: $199.99
1.0: $237.33
SOL is currently trading above the 0.236 Fibonacci level at $104.64.
The next major Fibonacci reference is $129.49 — 0.382 Fib.
A sustained move above the $111–$114 zone could bring $129.49 into focus, followed by $150.08.
🟢 Bullish Scenario
SOL has recovered strongly from the lower support structure and is now consolidating around $109–$111.
Immediate resistance:
$111.04
$112.25
$112.58
$113.71
$129.49 — 0.382 Fibonacci
$150.08 — 0.5 Fibonacci
A clean breakout and sustained close above $112–$114 would provide stronger confirmation of continued recovery.
🎯 Target 1: $112.58
🎯 Target 2: $113.71
🎯 Target 3: $129.49 — 0.382 Fibonacci
🎯 Target 4: $150.08 — 0.5 Fibonacci
🎯 Target 5: $170.67 — 0.618 Fibonacci
🎯 Target 6: $199.99 — 0.786 Fibonacci
🎯 Target 7: $237.33 — 1.0 Fibonacci
A confirmed move through the $112–$114 zone could strengthen the medium-term recovery structure and bring the $129–$150 region into focus.
🔴 Pullback Scenario
After the recent expansion above $100, a retest of the breakout area would be normal.
Key supports:
$109.84
$106.05
$104.64 — 0.236 Fibonacci
$102.68 — 20 EMA
$100.59
$95.19 — 50 EMA
$92.61 — 200 EMA
$89.54 — 100 EMA
The $102–$106 zone is particularly important.
If SOL continues to hold this area during a pullback, the current recovery structure remains active.
A sustained loss of $100.59 would weaken the current recovery structure and bring the lower EMA region back into focus.
🧠 Market Structure & Liquidity
SOL has formed a recovery structure after sweeping liquidity around the $92–$100 region.
The recent move produced a strong recovery through $100, followed by a breakout toward $110–$113.
SOL is now moving through an important:
Recovery → Breakout → Retest → Consolidation → Continuation
structure.
The major upside liquidity is concentrated around the $111–$114 region. A decisive move through this area would place $129.49 as the next major Fibonacci reference.
📊 RSI Momentum
RSI (14): 62.23
RSI has moved above the neutral 50 level and remains in positive territory after the recent expansion.
The current reading shows stronger short-term momentum, while still remaining below the traditional 70 overbought threshold.
A sustained RSI above 60 would keep momentum supportive, while a move back below 50 would indicate increasing short-term weakness.
🎯 Key Levels
🔴 Major Resistance: $111.04 → $112.25 → $112.58 → $113.71 → $129.49 → $150.08
🟢 Major Support: $109.84 → $106.05 → $104.64 → $102.68 → $100.59 → $95.19
📉 Dynamic EMA Support: $102.68 — 20 EMA | $95.19 — 50 EMA | $92.61 — 200 EMA | $89.54 — 100 EMA
🚀 Upside References: $113.71 → $129.49 → $150.08 → $170.67 → $199.99 → $237.33
📌 Final Outlook
SOL's broader structure has strengthened after the recent recovery, with price now holding around $110 and above the major $100–$106 support structure.
The $102–$106 area is now an important short-term support region, while $111–$114 remains the immediate major resistance zone.
A confirmed move above $113.71 could open the path toward $129.49, followed by $150.08 and $170.67.
However, rejection from the upper resistance area followed by a sustained loss of $100.59 would weaken the current recovery structure and bring the lower support zones back into focus.
Bias: 🟢 Recovery structure intact above $100.59. A sustained move above $113.71 could open the path toward $129.49, with $150.08 as the next major Fibonacci reference.
$SOL
1.1k
·
--
Мақала
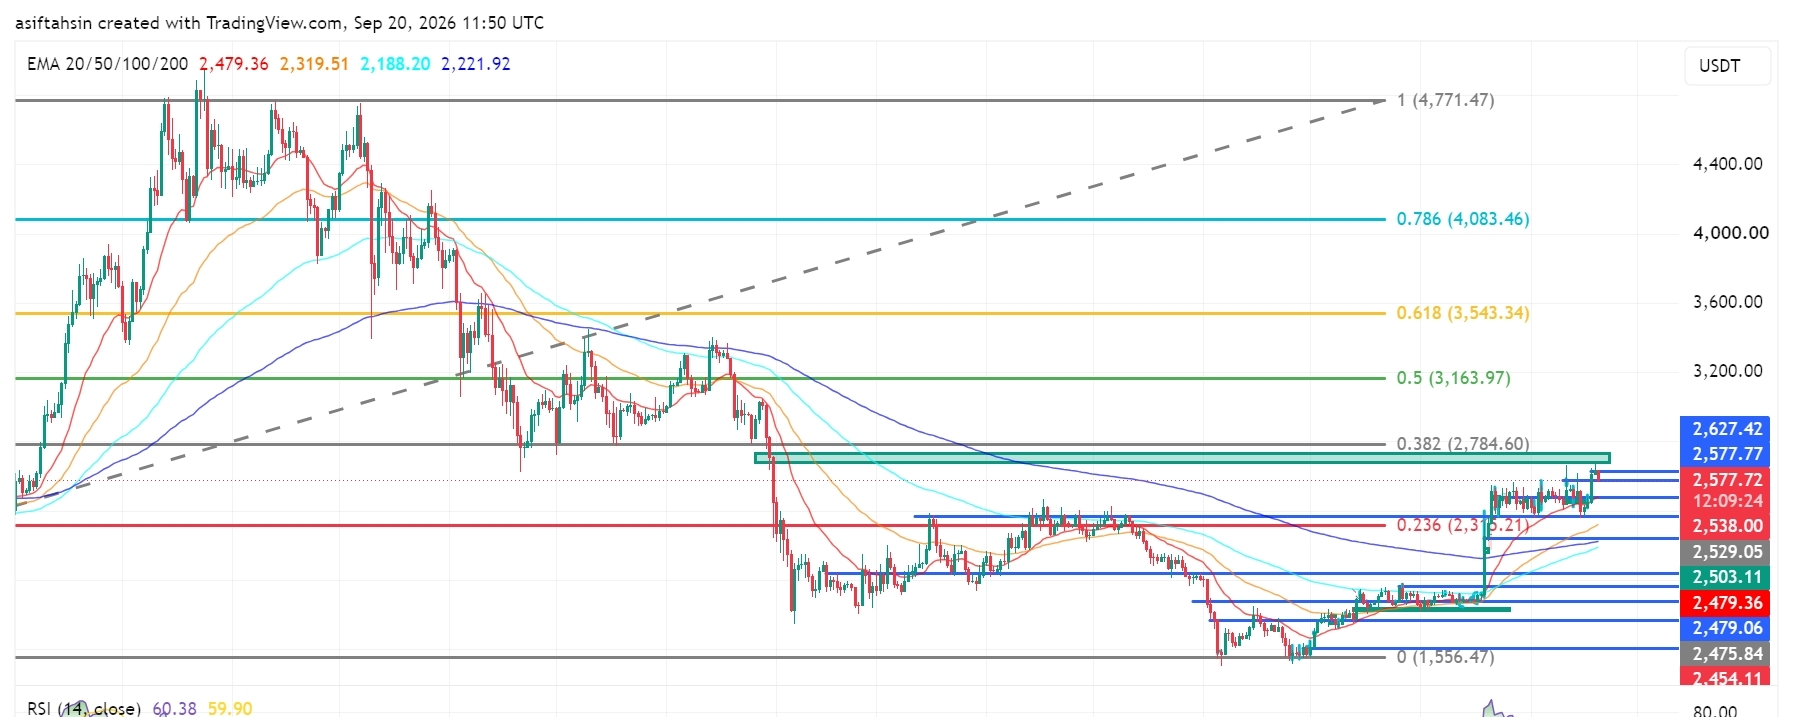
ETH Technical Outlook: Ethereum Holds Near $2.58K as Recovery ContinuesETH is currently trading around $2,577, holding above the $2,500–$2,540 support area after the recent recovery from the $2,280–$2,360 demand zone.
The broader recovery structure remains constructive, with price now approaching the important $2,627–$2,785 resistance zone. The $2,784.60 level is the major 0.382 Fibonacci reference on the chart.
📈 EMA Structure
20 EMA: $2,479.36
50 EMA: $2,319.51
100 EMA: $2,188.20
200 EMA: $2,221.92
ETH is currently trading well above the 20 EMA at $2,479.36.
The recovery above the 50 EMA at $2,319.51, 100 EMA at $2,188.20, and 200 EMA at $2,221.92 keeps the broader recovery structure constructive.
The 20 EMA is now acting as an important dynamic reference. A sustained hold above this level would keep the short-term structure supported.
📐 Fibonacci Levels
Key Fibonacci levels:
0.236: $2,315.21
0.382: $2,784.60
0.5: $3,163.97
0.618: $3,543.34
0.786: $4,083.46
1.0: $4,771.47
ETH has moved significantly above the 0.236 Fibonacci level at $2,315.21.
The next major Fibonacci resistance is $2,784.60 — 0.382 Fib.
A sustained move through the $2,627–$2,785 resistance structure would bring the higher Fibonacci levels into focus.
🟢 Upside Scenario
ETH is consolidating near $2,577 after the recent recovery and is now approaching the upper resistance structure.
Immediate resistance:
$2,577.77
$2,627.42
$2,784.60 — 0.382 Fibonacci
$3,163.97 — 0.5 Fibonacci
$3,543.34 — 0.618 Fibonacci
A clean breakout and sustained close above the $2,627–$2,785 zone would provide stronger confirmation of continued recovery.
🎯 Target 1: $2,627.42
🎯 Target 2: $2,784.60 — 0.382 Fibonacci
🎯 Target 3: $3,163.97 — 0.5 Fibonacci
🎯 Target 4: $3,543.34 — 0.618 Fibonacci
🎯 Target 5: $4,083.46 — 0.786 Fibonacci
🎯 Target 6: $4,771.47 — 1.0 Fibonacci
A sustained move above $2,784.60 could strengthen the medium-term recovery structure and bring the $3,164–$3,543 region into focus.
🔴 Pullback Scenario
After the recent expansion, a retest of the breakout area would be normal.
Key supports:
$2,538.00
$2,529.05
$2,503.11
$2,479.36 — 20 EMA
$2,479.06
$2,475.84
$2,454.11
$2,405.75
$2,319.51 — 50 EMA
The $2,475–$2,540 zone is particularly important.
If ETH continues to hold this area during a pullback, the current recovery structure remains active.
A sustained loss of the $2,475–$2,454 area would weaken the short-term structure and could expose the lower $2,405–$2,320 region.
🧠 Market Structure & Liquidity
ETH has formed a clear recovery structure after sweeping liquidity around the $2,280–$2,360 region.
The recent move produced a strong breakout from the previous consolidation and pushed price toward the $2,600 area.
ETH is now moving through an important:
Recovery → Breakout → Consolidation → Continuation
structure.
The major upside liquidity is concentrated around $2,627–$2,785. A decisive move through this zone would place $3,163.97 as the next major Fibonacci reference.
📊 RSI Momentum
RSI (14): 60.38
RSI remains above the neutral 50 level and is currently around 60, showing positive momentum.
The RSI signal line is around 59.90, keeping momentum relatively balanced near the 60 area.
A sustained RSI above 60 would support continued momentum, while a move back below 50 would indicate increasing short-term weakness.
🎯 Key Levels
🔴 Major Resistance: $2,627.42 → $2,784.60 → $3,163.97 → $3,543.34
🟢 Major Support: $2,538.00 → $2,529.05 → $2,503.11 → $2,479.36 → $2,454.11
📉 Dynamic EMA Support: $2,479.36 — 20 EMA | $2,319.51 — 50 EMA | $2,221.92 — 200 EMA | $2,188.20 — 100 EMA
🚀 Upside References: $2,784.60 → $3,163.97 → $3,543.34 → $4,083.46
📌 Final Outlook
ETH's broader structure remains constructive after the recent recovery, with price now holding around $2,577 and above the major $2,475–$2,540 support structure.
The $2,475–$2,540 area is now an important short-term support region, while $2,627–$2,785 remains the immediate major resistance zone.
A confirmed move above $2,784.60 could open the path toward $3,163.97, followed by $3,543.34 and potentially $4,083.46.
However, rejection from the upper resistance area followed by a sustained loss of $2,454.11 would weaken the current structure and bring the lower support zones back into focus.
Bias: 🟢 Recovery structure intact above $2,454.11. A sustained move above $2,784.60 could open the path toward $3,163.97, with $3,543.34 as the next major Fibonacci reference.
$ETH
{future}(ETHUSDT)
ETH Technical Outlook: Ethereum Holds Near $2.58K as Recovery Continues
ETH is currently trading around $2,577, holding above the $2,500–$2,540 support area after the recent recovery from the $2,280–$2,360 demand zone.
The broader recovery structure remains constructive, with price now approaching the important $2,627–$2,785 resistance zone. The $2,784.60 level is the major 0.382 Fibonacci reference on the chart.
📈 EMA Structure
20 EMA: $2,479.36
50 EMA: $2,319.51
100 EMA: $2,188.20
200 EMA: $2,221.92
ETH is currently trading well above the 20 EMA at $2,479.36.
The recovery above the 50 EMA at $2,319.51, 100 EMA at $2,188.20, and 200 EMA at $2,221.92 keeps the broader recovery structure constructive.
The 20 EMA is now acting as an important dynamic reference. A sustained hold above this level would keep the short-term structure supported.
📐 Fibonacci Levels
Key Fibonacci levels:
0.236: $2,315.21
0.382: $2,784.60
0.5: $3,163.97
0.618: $3,543.34
0.786: $4,083.46
1.0: $4,771.47
ETH has moved significantly above the 0.236 Fibonacci level at $2,315.21.
The next major Fibonacci resistance is $2,784.60 — 0.382 Fib.
A sustained move through the $2,627–$2,785 resistance structure would bring the higher Fibonacci levels into focus.
🟢 Upside Scenario
ETH is consolidating near $2,577 after the recent recovery and is now approaching the upper resistance structure.
Immediate resistance:
$2,577.77
$2,627.42
$2,784.60 — 0.382 Fibonacci
$3,163.97 — 0.5 Fibonacci
$3,543.34 — 0.618 Fibonacci
A clean breakout and sustained close above the $2,627–$2,785 zone would provide stronger confirmation of continued recovery.
🎯 Target 1: $2,627.42
🎯 Target 2: $2,784.60 — 0.382 Fibonacci
🎯 Target 3: $3,163.97 — 0.5 Fibonacci
🎯 Target 4: $3,543.34 — 0.618 Fibonacci
🎯 Target 5: $4,083.46 — 0.786 Fibonacci
🎯 Target 6: $4,771.47 — 1.0 Fibonacci
A sustained move above $2,784.60 could strengthen the medium-term recovery structure and bring the $3,164–$3,543 region into focus.
🔴 Pullback Scenario
After the recent expansion, a retest of the breakout area would be normal.
Key supports:
$2,538.00
$2,529.05
$2,503.11
$2,479.36 — 20 EMA
$2,479.06
$2,475.84
$2,454.11
$2,405.75
$2,319.51 — 50 EMA
The $2,475–$2,540 zone is particularly important.
If ETH continues to hold this area during a pullback, the current recovery structure remains active.
A sustained loss of the $2,475–$2,454 area would weaken the short-term structure and could expose the lower $2,405–$2,320 region.
🧠 Market Structure & Liquidity
ETH has formed a clear recovery structure after sweeping liquidity around the $2,280–$2,360 region.
The recent move produced a strong breakout from the previous consolidation and pushed price toward the $2,600 area.
ETH is now moving through an important:
Recovery → Breakout → Consolidation → Continuation
structure.
The major upside liquidity is concentrated around $2,627–$2,785. A decisive move through this zone would place $3,163.97 as the next major Fibonacci reference.
📊 RSI Momentum
RSI (14): 60.38
RSI remains above the neutral 50 level and is currently around 60, showing positive momentum.
The RSI signal line is around 59.90, keeping momentum relatively balanced near the 60 area.
A sustained RSI above 60 would support continued momentum, while a move back below 50 would indicate increasing short-term weakness.
🎯 Key Levels
🔴 Major Resistance: $2,627.42 → $2,784.60 → $3,163.97 → $3,543.34
🟢 Major Support: $2,538.00 → $2,529.05 → $2,503.11 → $2,479.36 → $2,454.11
📉 Dynamic EMA Support: $2,479.36 — 20 EMA | $2,319.51 — 50 EMA | $2,221.92 — 200 EMA | $2,188.20 — 100 EMA
🚀 Upside References: $2,784.60 → $3,163.97 → $3,543.34 → $4,083.46
📌 Final Outlook
ETH's broader structure remains constructive after the recent recovery, with price now holding around $2,577 and above the major $2,475–$2,540 support structure.
The $2,475–$2,540 area is now an important short-term support region, while $2,627–$2,785 remains the immediate major resistance zone.
A confirmed move above $2,784.60 could open the path toward $3,163.97, followed by $3,543.34 and potentially $4,083.46.
However, rejection from the upper resistance area followed by a sustained loss of $2,454.11 would weaken the current structure and bring the lower support zones back into focus.
Bias: 🟢 Recovery structure intact above $2,454.11. A sustained move above $2,784.60 could open the path toward $3,163.97, with $3,543.34 as the next major Fibonacci reference.
$ETH
The broader recovery structure remains constructive, with price now approaching the important $2,627–$2,785 resistance zone. The $2,784.60 level is the major 0.382 Fibonacci reference on the chart.
📈 EMA Structure
20 EMA: $2,479.36
50 EMA: $2,319.51
100 EMA: $2,188.20
200 EMA: $2,221.92
ETH is currently trading well above the 20 EMA at $2,479.36.
The recovery above the 50 EMA at $2,319.51, 100 EMA at $2,188.20, and 200 EMA at $2,221.92 keeps the broader recovery structure constructive.
The 20 EMA is now acting as an important dynamic reference. A sustained hold above this level would keep the short-term structure supported.
📐 Fibonacci Levels
Key Fibonacci levels:
0.236: $2,315.21
0.382: $2,784.60
0.5: $3,163.97
0.618: $3,543.34
0.786: $4,083.46
1.0: $4,771.47
ETH has moved significantly above the 0.236 Fibonacci level at $2,315.21.
The next major Fibonacci resistance is $2,784.60 — 0.382 Fib.
A sustained move through the $2,627–$2,785 resistance structure would bring the higher Fibonacci levels into focus.
🟢 Upside Scenario
ETH is consolidating near $2,577 after the recent recovery and is now approaching the upper resistance structure.
Immediate resistance:
$2,577.77
$2,627.42
$2,784.60 — 0.382 Fibonacci
$3,163.97 — 0.5 Fibonacci
$3,543.34 — 0.618 Fibonacci
A clean breakout and sustained close above the $2,627–$2,785 zone would provide stronger confirmation of continued recovery.
🎯 Target 1: $2,627.42
🎯 Target 2: $2,784.60 — 0.382 Fibonacci
🎯 Target 3: $3,163.97 — 0.5 Fibonacci
🎯 Target 4: $3,543.34 — 0.618 Fibonacci
🎯 Target 5: $4,083.46 — 0.786 Fibonacci
🎯 Target 6: $4,771.47 — 1.0 Fibonacci
A sustained move above $2,784.60 could strengthen the medium-term recovery structure and bring the $3,164–$3,543 region into focus.
🔴 Pullback Scenario
After the recent expansion, a retest of the breakout area would be normal.
Key supports:
$2,538.00
$2,529.05
$2,503.11
$2,479.36 — 20 EMA
$2,479.06
$2,475.84
$2,454.11
$2,405.75
$2,319.51 — 50 EMA
The $2,475–$2,540 zone is particularly important.
If ETH continues to hold this area during a pullback, the current recovery structure remains active.
A sustained loss of the $2,475–$2,454 area would weaken the short-term structure and could expose the lower $2,405–$2,320 region.
🧠 Market Structure & Liquidity
ETH has formed a clear recovery structure after sweeping liquidity around the $2,280–$2,360 region.
The recent move produced a strong breakout from the previous consolidation and pushed price toward the $2,600 area.
ETH is now moving through an important:
Recovery → Breakout → Consolidation → Continuation
structure.
The major upside liquidity is concentrated around $2,627–$2,785. A decisive move through this zone would place $3,163.97 as the next major Fibonacci reference.
📊 RSI Momentum
RSI (14): 60.38
RSI remains above the neutral 50 level and is currently around 60, showing positive momentum.
The RSI signal line is around 59.90, keeping momentum relatively balanced near the 60 area.
A sustained RSI above 60 would support continued momentum, while a move back below 50 would indicate increasing short-term weakness.
🎯 Key Levels
🔴 Major Resistance: $2,627.42 → $2,784.60 → $3,163.97 → $3,543.34
🟢 Major Support: $2,538.00 → $2,529.05 → $2,503.11 → $2,479.36 → $2,454.11
📉 Dynamic EMA Support: $2,479.36 — 20 EMA | $2,319.51 — 50 EMA | $2,221.92 — 200 EMA | $2,188.20 — 100 EMA
🚀 Upside References: $2,784.60 → $3,163.97 → $3,543.34 → $4,083.46
📌 Final Outlook
ETH's broader structure remains constructive after the recent recovery, with price now holding around $2,577 and above the major $2,475–$2,540 support structure.
The $2,475–$2,540 area is now an important short-term support region, while $2,627–$2,785 remains the immediate major resistance zone.
A confirmed move above $2,784.60 could open the path toward $3,163.97, followed by $3,543.34 and potentially $4,083.46.
However, rejection from the upper resistance area followed by a sustained loss of $2,454.11 would weaken the current structure and bring the lower support zones back into focus.
Bias: 🟢 Recovery structure intact above $2,454.11. A sustained move above $2,784.60 could open the path toward $3,163.97, with $3,543.34 as the next major Fibonacci reference.
$ETH
65
·
--
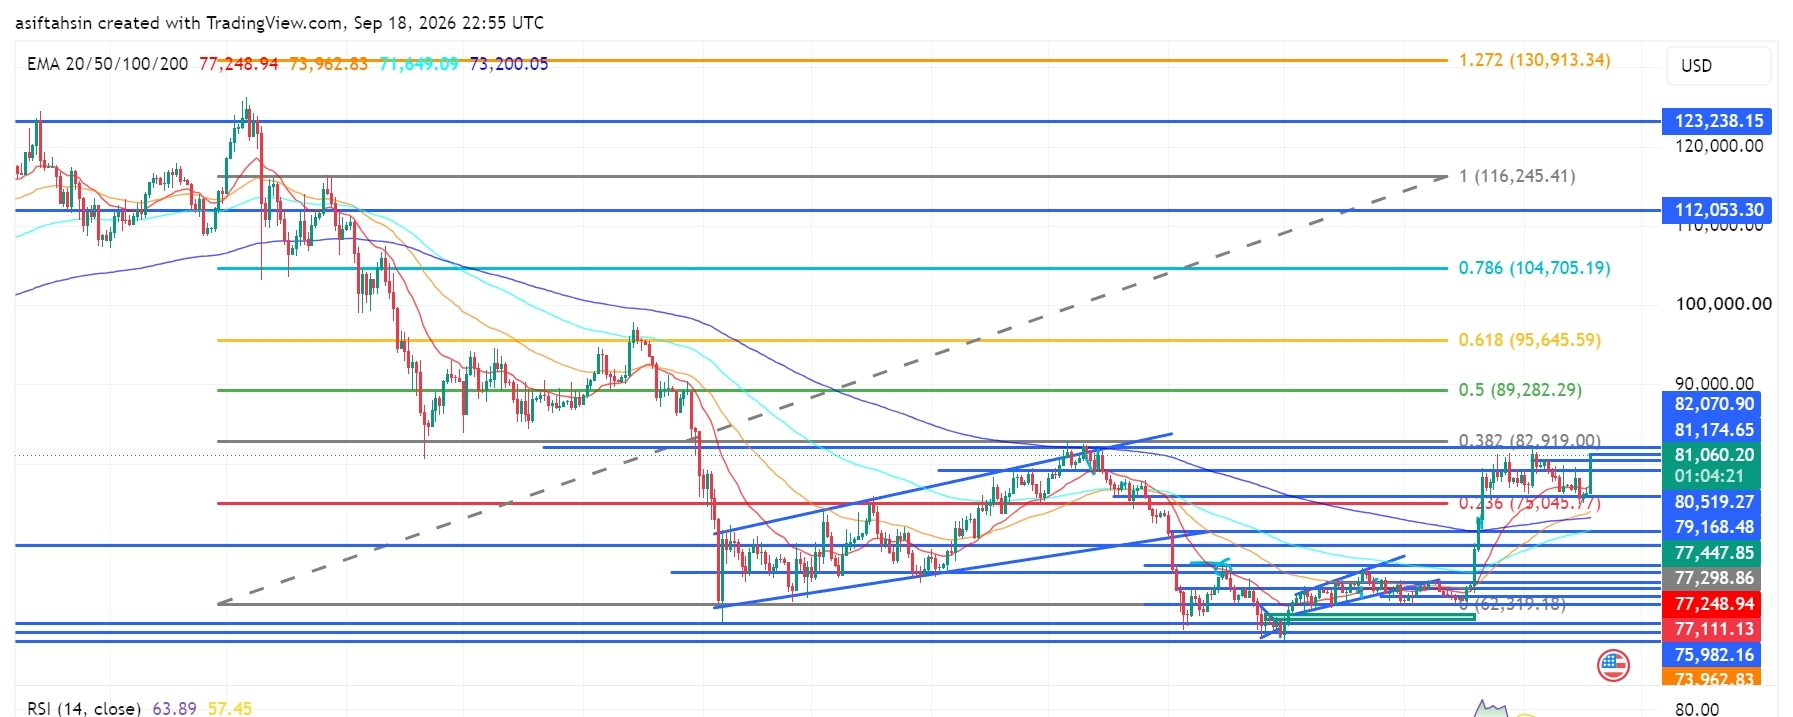
Мақала
BTC Technical Outlook: Bitcoin Reclaims $81K as Recovery Structure StrengthensBTC is currently trading around $81,060, holding above the $79,000–$80,000 region after the recent recovery from the $73,000–$76,000 demand area.
The broader structure has improved, with price reclaiming the $80K area and moving back toward the major $82,070–$82,919 resistance zone. A sustained move through this area would put the higher Fibonacci levels back into focus.
📈 EMA Structure
20 EMA: $77,248.95
50 EMA: $73,962.83
100 EMA: $71,649.09
200 EMA: $73,200.05
BTC is currently trading well above the 20 EMA at $77,248.95.
The recovery above the 50 EMA at $73,962.83, 100 EMA at $71,649.09, and 200 EMA at $73,200.05 keeps the broader recovery structure constructive.
The 20 EMA has moved above the longer-term EMA levels, showing improving short-term structure.
📐 Fibonacci Levels
Key Fibonacci levels:
0.236: $75,045.77
0.382: $82,919.00
0.5: $89,282.29
0.618: $95,645.59
0.786: $104,705.19
1.0: $116,245.41
1.272: $130,913.34
BTC is currently trading between the 0.236 and 0.382 Fibonacci levels.
The next major Fibonacci reference is $82,919 — 0.382 Fib.
A sustained move above the $82,070–$82,919 zone could bring $89,282 into focus, followed by $95,645.
🟢 Bullish Scenario
BTC has recovered strongly from the lower support structure and is now consolidating around $80K–$81K.
Immediate resistance:
$81,174.65
$82,070.90
$82,919.00 — 0.382 Fibonacci
$89,282.29 — 0.5 Fibonacci
$95,645.59 — 0.618 Fibonacci
A clean breakout and sustained close above $82,070–$82,919 would provide stronger confirmation of continued recovery.
🎯 Target 1: $82,070
🎯 Target 2: $82,919 — 0.382 Fibonacci
🎯 Target 3: $89,282 — 0.5 Fibonacci
🎯 Target 4: $95,645 — 0.618 Fibonacci
🎯 Target 5: $104,705 — 0.786 Fibonacci
🎯 Target 6: $116,245 — 1.0 Fibonacci
A confirmed move through the $82K–$83K zone could strengthen the medium-term recovery structure and bring the $89K–$95K region into focus.
🔴 Pullback Scenario
After the recent expansion above $80K, a retest of the breakout area would be normal.
Key supports:
$80,519.27
$79,168.48
$77,447.85
$77,298.86
$77,248.95 — 20 EMA
$77,111.13
$75,982.16
$75,045.77 — 0.236 Fibonacci
$73,962.83 — 50 EMA
$73,200.05 — 200 EMA
The $77K–$80K zone is particularly important.
If BTC continues to hold this area during a pullback, the current recovery structure remains active.
A sustained loss of $75,045 would weaken the current recovery structure and bring the lower EMA region back into focus.
🧠 Market Structure & Liquidity
BTC has formed a recovery structure after sweeping liquidity around the $73K–$76K region.
The recent move produced a strong recovery through $77K, followed by a breakout above $80K.
BTC is now moving through an important:
Recovery → Breakout → Retest → Consolidation → Continuation
structure.
The major upside liquidity is concentrated around $81K–$83K. A decisive move through this area would place $89,282 as the next major Fibonacci reference.
📊 RSI Momentum
RSI (14): 63.89
RSI has moved above the neutral 50 level and remains in positive territory after the recent expansion.
The current reading shows stronger short-term momentum, while still remaining below the traditional 70 overbought threshold.
A sustained RSI above 60 would keep momentum supportive, while a move back below 50 would indicate increasing short-term weakness.
🎯 Key Levels
🔴 Major Resistance: $81,174.65 → $82,070.90 → $82,919 → $89,282 → $95,645
🟢 Major Support: $80,519 → $79,168 → $77,447 → $77,249 → $75,982 → $75,045
📉 Dynamic EMA Support: $77,248.95 — 20 EMA | $73,962.83 — 50 EMA | $73,200.05 — 200 EMA | $71,649.09 — 100 EMA
🚀 Upside References: $82,919 → $89,282 → $95,645 → $104,705 → $116,245
📌 Final Outlook
BTC's broader structure has strengthened after the recent recovery, with price now holding around $81K and above the major $77K–$80K support structure.
The $77K–$80K area is now an important short-term support region, while $82K–$83K remains the immediate major resistance zone.
A confirmed move above $82,919 could open the path toward $89,282, followed by $95,645 and $104,705.
However, rejection from the upper resistance area followed by a sustained loss of $75,045 would weaken the current recovery structure and bring the lower support zones back into focus.
Bias: 🟢 Recovery structure intact above $75,045. A sustained move above $82,919 could open the path toward $89,282, with $95,645 as the next major Fibonacci reference.
$BTC
{future}(BTCUSDT)
BTC Technical Outlook: Bitcoin Reclaims $81K as Recovery Structure Strengthens
BTC is currently trading around $81,060, holding above the $79,000–$80,000 region after the recent recovery from the $73,000–$76,000 demand area.
The broader structure has improved, with price reclaiming the $80K area and moving back toward the major $82,070–$82,919 resistance zone. A sustained move through this area would put the higher Fibonacci levels back into focus.
📈 EMA Structure
20 EMA: $77,248.95
50 EMA: $73,962.83
100 EMA: $71,649.09
200 EMA: $73,200.05
BTC is currently trading well above the 20 EMA at $77,248.95.
The recovery above the 50 EMA at $73,962.83, 100 EMA at $71,649.09, and 200 EMA at $73,200.05 keeps the broader recovery structure constructive.
The 20 EMA has moved above the longer-term EMA levels, showing improving short-term structure.
📐 Fibonacci Levels
Key Fibonacci levels:
0.236: $75,045.77
0.382: $82,919.00
0.5: $89,282.29
0.618: $95,645.59
0.786: $104,705.19
1.0: $116,245.41
1.272: $130,913.34
BTC is currently trading between the 0.236 and 0.382 Fibonacci levels.
The next major Fibonacci reference is $82,919 — 0.382 Fib.
A sustained move above the $82,070–$82,919 zone could bring $89,282 into focus, followed by $95,645.
🟢 Bullish Scenario
BTC has recovered strongly from the lower support structure and is now consolidating around $80K–$81K.
Immediate resistance:
$81,174.65
$82,070.90
$82,919.00 — 0.382 Fibonacci
$89,282.29 — 0.5 Fibonacci
$95,645.59 — 0.618 Fibonacci
A clean breakout and sustained close above $82,070–$82,919 would provide stronger confirmation of continued recovery.
🎯 Target 1: $82,070
🎯 Target 2: $82,919 — 0.382 Fibonacci
🎯 Target 3: $89,282 — 0.5 Fibonacci
🎯 Target 4: $95,645 — 0.618 Fibonacci
🎯 Target 5: $104,705 — 0.786 Fibonacci
🎯 Target 6: $116,245 — 1.0 Fibonacci
A confirmed move through the $82K–$83K zone could strengthen the medium-term recovery structure and bring the $89K–$95K region into focus.
🔴 Pullback Scenario
After the recent expansion above $80K, a retest of the breakout area would be normal.
Key supports:
$80,519.27
$79,168.48
$77,447.85
$77,298.86
$77,248.95 — 20 EMA
$77,111.13
$75,982.16
$75,045.77 — 0.236 Fibonacci
$73,962.83 — 50 EMA
$73,200.05 — 200 EMA
The $77K–$80K zone is particularly important.
If BTC continues to hold this area during a pullback, the current recovery structure remains active.
A sustained loss of $75,045 would weaken the current recovery structure and bring the lower EMA region back into focus.
🧠 Market Structure & Liquidity
BTC has formed a recovery structure after sweeping liquidity around the $73K–$76K region.
The recent move produced a strong recovery through $77K, followed by a breakout above $80K.
BTC is now moving through an important:
Recovery → Breakout → Retest → Consolidation → Continuation
structure.
The major upside liquidity is concentrated around $81K–$83K. A decisive move through this area would place $89,282 as the next major Fibonacci reference.
📊 RSI Momentum
RSI (14): 63.89
RSI has moved above the neutral 50 level and remains in positive territory after the recent expansion.
The current reading shows stronger short-term momentum, while still remaining below the traditional 70 overbought threshold.
A sustained RSI above 60 would keep momentum supportive, while a move back below 50 would indicate increasing short-term weakness.
🎯 Key Levels
🔴 Major Resistance: $81,174.65 → $82,070.90 → $82,919 → $89,282 → $95,645
🟢 Major Support: $80,519 → $79,168 → $77,447 → $77,249 → $75,982 → $75,045
📉 Dynamic EMA Support: $77,248.95 — 20 EMA | $73,962.83 — 50 EMA | $73,200.05 — 200 EMA | $71,649.09 — 100 EMA
🚀 Upside References: $82,919 → $89,282 → $95,645 → $104,705 → $116,245
📌 Final Outlook
BTC's broader structure has strengthened after the recent recovery, with price now holding around $81K and above the major $77K–$80K support structure.
The $77K–$80K area is now an important short-term support region, while $82K–$83K remains the immediate major resistance zone.
A confirmed move above $82,919 could open the path toward $89,282, followed by $95,645 and $104,705.
However, rejection from the upper resistance area followed by a sustained loss of $75,045 would weaken the current recovery structure and bring the lower support zones back into focus.
Bias: 🟢 Recovery structure intact above $75,045. A sustained move above $82,919 could open the path toward $89,282, with $95,645 as the next major Fibonacci reference.
$BTC
The broader structure has improved, with price reclaiming the $80K area and moving back toward the major $82,070–$82,919 resistance zone. A sustained move through this area would put the higher Fibonacci levels back into focus.
📈 EMA Structure
20 EMA: $77,248.95
50 EMA: $73,962.83
100 EMA: $71,649.09
200 EMA: $73,200.05
BTC is currently trading well above the 20 EMA at $77,248.95.
The recovery above the 50 EMA at $73,962.83, 100 EMA at $71,649.09, and 200 EMA at $73,200.05 keeps the broader recovery structure constructive.
The 20 EMA has moved above the longer-term EMA levels, showing improving short-term structure.
📐 Fibonacci Levels
Key Fibonacci levels:
0.236: $75,045.77
0.382: $82,919.00
0.5: $89,282.29
0.618: $95,645.59
0.786: $104,705.19
1.0: $116,245.41
1.272: $130,913.34
BTC is currently trading between the 0.236 and 0.382 Fibonacci levels.
The next major Fibonacci reference is $82,919 — 0.382 Fib.
A sustained move above the $82,070–$82,919 zone could bring $89,282 into focus, followed by $95,645.
🟢 Bullish Scenario
BTC has recovered strongly from the lower support structure and is now consolidating around $80K–$81K.
Immediate resistance:
$81,174.65
$82,070.90
$82,919.00 — 0.382 Fibonacci
$89,282.29 — 0.5 Fibonacci
$95,645.59 — 0.618 Fibonacci
A clean breakout and sustained close above $82,070–$82,919 would provide stronger confirmation of continued recovery.
🎯 Target 1: $82,070
🎯 Target 2: $82,919 — 0.382 Fibonacci
🎯 Target 3: $89,282 — 0.5 Fibonacci
🎯 Target 4: $95,645 — 0.618 Fibonacci
🎯 Target 5: $104,705 — 0.786 Fibonacci
🎯 Target 6: $116,245 — 1.0 Fibonacci
A confirmed move through the $82K–$83K zone could strengthen the medium-term recovery structure and bring the $89K–$95K region into focus.
🔴 Pullback Scenario
After the recent expansion above $80K, a retest of the breakout area would be normal.
Key supports:
$80,519.27
$79,168.48
$77,447.85
$77,298.86
$77,248.95 — 20 EMA
$77,111.13
$75,982.16
$75,045.77 — 0.236 Fibonacci
$73,962.83 — 50 EMA
$73,200.05 — 200 EMA
The $77K–$80K zone is particularly important.
If BTC continues to hold this area during a pullback, the current recovery structure remains active.
A sustained loss of $75,045 would weaken the current recovery structure and bring the lower EMA region back into focus.
🧠 Market Structure & Liquidity
BTC has formed a recovery structure after sweeping liquidity around the $73K–$76K region.
The recent move produced a strong recovery through $77K, followed by a breakout above $80K.
BTC is now moving through an important:
Recovery → Breakout → Retest → Consolidation → Continuation
structure.
The major upside liquidity is concentrated around $81K–$83K. A decisive move through this area would place $89,282 as the next major Fibonacci reference.
📊 RSI Momentum
RSI (14): 63.89
RSI has moved above the neutral 50 level and remains in positive territory after the recent expansion.
The current reading shows stronger short-term momentum, while still remaining below the traditional 70 overbought threshold.
A sustained RSI above 60 would keep momentum supportive, while a move back below 50 would indicate increasing short-term weakness.
🎯 Key Levels
🔴 Major Resistance: $81,174.65 → $82,070.90 → $82,919 → $89,282 → $95,645
🟢 Major Support: $80,519 → $79,168 → $77,447 → $77,249 → $75,982 → $75,045
📉 Dynamic EMA Support: $77,248.95 — 20 EMA | $73,962.83 — 50 EMA | $73,200.05 — 200 EMA | $71,649.09 — 100 EMA
🚀 Upside References: $82,919 → $89,282 → $95,645 → $104,705 → $116,245
📌 Final Outlook
BTC's broader structure has strengthened after the recent recovery, with price now holding around $81K and above the major $77K–$80K support structure.
The $77K–$80K area is now an important short-term support region, while $82K–$83K remains the immediate major resistance zone.
A confirmed move above $82,919 could open the path toward $89,282, followed by $95,645 and $104,705.
However, rejection from the upper resistance area followed by a sustained loss of $75,045 would weaken the current recovery structure and bring the lower support zones back into focus.
Bias: 🟢 Recovery structure intact above $75,045. A sustained move above $82,919 could open the path toward $89,282, with $95,645 as the next major Fibonacci reference.
$BTC
12
·
--
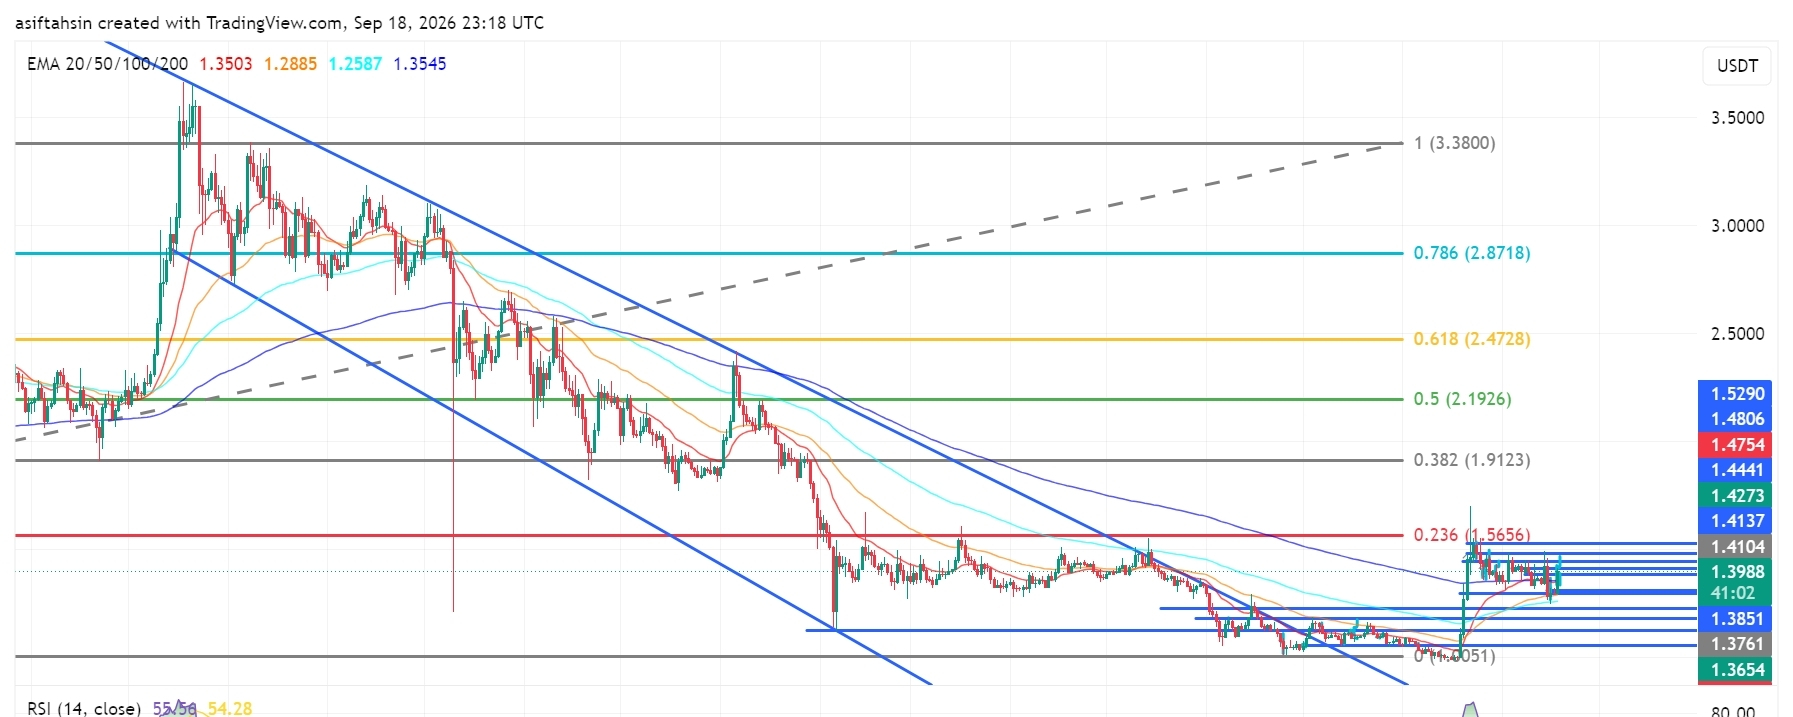
Мақала
XRP Technical Outlook: XRP Holds Near $1.40 as Bulls Defend the BreakoutXRP is currently trading around $1.40, consolidating after a strong recovery from the August lows and a sharp breakout from the previous descending structure.
The broader structure has improved significantly, with XRP trading above the 20, 50 and 100 EMAs. However, price is now facing an important resistance cluster around $1.41–$1.43. Bulls need a clean breakout above this zone to confirm another upside expansion.
📈 EMA Structure
20 EMA: $1.3503
50 EMA: $1.2885
100 EMA: $1.2586
200 EMA: $1.3545
XRP is currently trading above all four major EMAs, keeping the recovery structure constructive.
The 20 EMA at $1.3503 is the key short-term dynamic support, while the 200 EMA at $1.3545 adds another important layer of support.
As long as XRP holds above the $1.35 area, buyers maintain control of the current recovery structure.
📐 Fibonacci Levels
0.236: $1.5656
0.382: $1.9123
0.5: $2.1926
0.618: $2.4728
0.786: $2.8718
1.0: $3.3800
The $1.5656 0.236 Fibonacci level is the first major higher-timeframe resistance above the current range.
A sustained breakout above $1.5656 could open the way toward $1.9123, followed by the $2.19 region.
🟢 Bullish Scenario
XRP is consolidating just below the $1.4104–$1.4137 resistance area.
A clean breakout and sustained close above $1.4137 could trigger another bullish expansion.
🎯 Target 1: $1.4273
🎯 Target 2: $1.4441
🎯 Target 3: $1.4754
🎯 Target 4: $1.4806
🎯 Target 5: $1.5290
🎯 Target 6: $1.5656
🎯 Target 7: $1.9123
The $1.5656 level is especially important because it represents the next major Fibonacci resistance.
🔴 Pullback Scenario
If XRP fails to break the $1.41–$1.43 resistance cluster, a short-term pullback could develop.
Key supports:
$1.3984
$1.3851
$1.3761
$1.3654
$1.3575
$1.3545 — 200 EMA
$1.3503 — 20 EMA
The $1.3654–$1.3503 region is particularly important.
A successful retest of this area could provide a base for another attempt at the $1.41–$1.43 resistance zone.
A sustained break below the $1.35 area would weaken the current bullish recovery structure.
🧠 Market Structure & Liquidity
XRP's recent structure can be viewed as:
Long Downtrend → Liquidity Sweep → Accumulation → Breakout → Strong Expansion → Consolidation
The major August move produced a strong recovery from the lower liquidity zone and broke the previous descending trend structure.
XRP is now consolidating around $1.38–$1.41, with buyers defending the breakout area.
The next major structural test is $1.4137–$1.4273.
A successful reclaim of this zone would strengthen the continuation setup, while rejection could send price back toward the lower support cluster.
📊 RSI Momentum
RSI: 55.56
RSI MA: 54.28
RSI remains above 50 and is slightly above its moving average, indicating that momentum is still constructive.
However, RSI is far from overbought territory, meaning there is room for momentum to strengthen if XRP breaks above the current resistance.
A move toward 60–65 RSI alongside a breakout would provide stronger confirmation of bullish continuation.
🎯 Key Levels
Resistance:
$1.4104 → $1.4137 → $1.4273 → $1.4441 → $1.4754 → $1.4806 → $1.5290 → $1.5656
Support:
$1.3984 → $1.3851 → $1.3761 → $1.3654 → $1.3575 → $1.3545 → $1.3503
📌 Final Outlook
XRP remains in a constructive recovery structure while holding above the major EMA cluster and the $1.35 area.
The immediate battle is between $1.41 and $1.43. A decisive breakout above this zone could push XRP toward $1.4441 → $1.4754 → $1.5290 → $1.5656.
If XRP fails to break higher, the $1.3851–$1.3503 zone becomes the key downside support area.
Bias: 🟢 Bullish above $1.3503 | Stronger above $1.4137
$XRP
{future}(XRPUSDT)
XRP Technical Outlook: XRP Holds Near $1.40 as Bulls Defend the Breakout
XRP is currently trading around $1.40, consolidating after a strong recovery from the August lows and a sharp breakout from the previous descending structure.
The broader structure has improved significantly, with XRP trading above the 20, 50 and 100 EMAs. However, price is now facing an important resistance cluster around $1.41–$1.43. Bulls need a clean breakout above this zone to confirm another upside expansion.
📈 EMA Structure
20 EMA: $1.3503
50 EMA: $1.2885
100 EMA: $1.2586
200 EMA: $1.3545
XRP is currently trading above all four major EMAs, keeping the recovery structure constructive.
The 20 EMA at $1.3503 is the key short-term dynamic support, while the 200 EMA at $1.3545 adds another important layer of support.
As long as XRP holds above the $1.35 area, buyers maintain control of the current recovery structure.
📐 Fibonacci Levels
0.236: $1.5656
0.382: $1.9123
0.5: $2.1926
0.618: $2.4728
0.786: $2.8718
1.0: $3.3800
The $1.5656 0.236 Fibonacci level is the first major higher-timeframe resistance above the current range.
A sustained breakout above $1.5656 could open the way toward $1.9123, followed by the $2.19 region.
🟢 Bullish Scenario
XRP is consolidating just below the $1.4104–$1.4137 resistance area.
A clean breakout and sustained close above $1.4137 could trigger another bullish expansion.
🎯 Target 1: $1.4273
🎯 Target 2: $1.4441
🎯 Target 3: $1.4754
🎯 Target 4: $1.4806
🎯 Target 5: $1.5290
🎯 Target 6: $1.5656
🎯 Target 7: $1.9123
The $1.5656 level is especially important because it represents the next major Fibonacci resistance.
🔴 Pullback Scenario
If XRP fails to break the $1.41–$1.43 resistance cluster, a short-term pullback could develop.
Key supports:
$1.3984
$1.3851
$1.3761
$1.3654
$1.3575
$1.3545 — 200 EMA
$1.3503 — 20 EMA
The $1.3654–$1.3503 region is particularly important.
A successful retest of this area could provide a base for another attempt at the $1.41–$1.43 resistance zone.
A sustained break below the $1.35 area would weaken the current bullish recovery structure.
🧠 Market Structure & Liquidity
XRP's recent structure can be viewed as:
Long Downtrend → Liquidity Sweep → Accumulation → Breakout → Strong Expansion → Consolidation
The major August move produced a strong recovery from the lower liquidity zone and broke the previous descending trend structure.
XRP is now consolidating around $1.38–$1.41, with buyers defending the breakout area.
The next major structural test is $1.4137–$1.4273.
A successful reclaim of this zone would strengthen the continuation setup, while rejection could send price back toward the lower support cluster.
📊 RSI Momentum
RSI: 55.56
RSI MA: 54.28
RSI remains above 50 and is slightly above its moving average, indicating that momentum is still constructive.
However, RSI is far from overbought territory, meaning there is room for momentum to strengthen if XRP breaks above the current resistance.
A move toward 60–65 RSI alongside a breakout would provide stronger confirmation of bullish continuation.
🎯 Key Levels
Resistance:
$1.4104 → $1.4137 → $1.4273 → $1.4441 → $1.4754 → $1.4806 → $1.5290 → $1.5656
Support:
$1.3984 → $1.3851 → $1.3761 → $1.3654 → $1.3575 → $1.3545 → $1.3503
📌 Final Outlook
XRP remains in a constructive recovery structure while holding above the major EMA cluster and the $1.35 area.
The immediate battle is between $1.41 and $1.43. A decisive breakout above this zone could push XRP toward $1.4441 → $1.4754 → $1.5290 → $1.5656.
If XRP fails to break higher, the $1.3851–$1.3503 zone becomes the key downside support area.
Bias: 🟢 Bullish above $1.3503 | Stronger above $1.4137
$XRP
The broader structure has improved significantly, with XRP trading above the 20, 50 and 100 EMAs. However, price is now facing an important resistance cluster around $1.41–$1.43. Bulls need a clean breakout above this zone to confirm another upside expansion.
📈 EMA Structure
20 EMA: $1.3503
50 EMA: $1.2885
100 EMA: $1.2586
200 EMA: $1.3545
XRP is currently trading above all four major EMAs, keeping the recovery structure constructive.
The 20 EMA at $1.3503 is the key short-term dynamic support, while the 200 EMA at $1.3545 adds another important layer of support.
As long as XRP holds above the $1.35 area, buyers maintain control of the current recovery structure.
📐 Fibonacci Levels
0.236: $1.5656
0.382: $1.9123
0.5: $2.1926
0.618: $2.4728
0.786: $2.8718
1.0: $3.3800
The $1.5656 0.236 Fibonacci level is the first major higher-timeframe resistance above the current range.
A sustained breakout above $1.5656 could open the way toward $1.9123, followed by the $2.19 region.
🟢 Bullish Scenario
XRP is consolidating just below the $1.4104–$1.4137 resistance area.
A clean breakout and sustained close above $1.4137 could trigger another bullish expansion.
🎯 Target 1: $1.4273
🎯 Target 2: $1.4441
🎯 Target 3: $1.4754
🎯 Target 4: $1.4806
🎯 Target 5: $1.5290
🎯 Target 6: $1.5656
🎯 Target 7: $1.9123
The $1.5656 level is especially important because it represents the next major Fibonacci resistance.
🔴 Pullback Scenario
If XRP fails to break the $1.41–$1.43 resistance cluster, a short-term pullback could develop.
Key supports:
$1.3984
$1.3851
$1.3761
$1.3654
$1.3575
$1.3545 — 200 EMA
$1.3503 — 20 EMA
The $1.3654–$1.3503 region is particularly important.
A successful retest of this area could provide a base for another attempt at the $1.41–$1.43 resistance zone.
A sustained break below the $1.35 area would weaken the current bullish recovery structure.
🧠 Market Structure & Liquidity
XRP's recent structure can be viewed as:
Long Downtrend → Liquidity Sweep → Accumulation → Breakout → Strong Expansion → Consolidation
The major August move produced a strong recovery from the lower liquidity zone and broke the previous descending trend structure.
XRP is now consolidating around $1.38–$1.41, with buyers defending the breakout area.
The next major structural test is $1.4137–$1.4273.
A successful reclaim of this zone would strengthen the continuation setup, while rejection could send price back toward the lower support cluster.
📊 RSI Momentum
RSI: 55.56
RSI MA: 54.28
RSI remains above 50 and is slightly above its moving average, indicating that momentum is still constructive.
However, RSI is far from overbought territory, meaning there is room for momentum to strengthen if XRP breaks above the current resistance.
A move toward 60–65 RSI alongside a breakout would provide stronger confirmation of bullish continuation.
🎯 Key Levels
Resistance:
$1.4104 → $1.4137 → $1.4273 → $1.4441 → $1.4754 → $1.4806 → $1.5290 → $1.5656
Support:
$1.3984 → $1.3851 → $1.3761 → $1.3654 → $1.3575 → $1.3545 → $1.3503
📌 Final Outlook
XRP remains in a constructive recovery structure while holding above the major EMA cluster and the $1.35 area.
The immediate battle is between $1.41 and $1.43. A decisive breakout above this zone could push XRP toward $1.4441 → $1.4754 → $1.5290 → $1.5656.
If XRP fails to break higher, the $1.3851–$1.3503 zone becomes the key downside support area.
Bias: 🟢 Bullish above $1.3503 | Stronger above $1.4137
$XRP
276
·
--
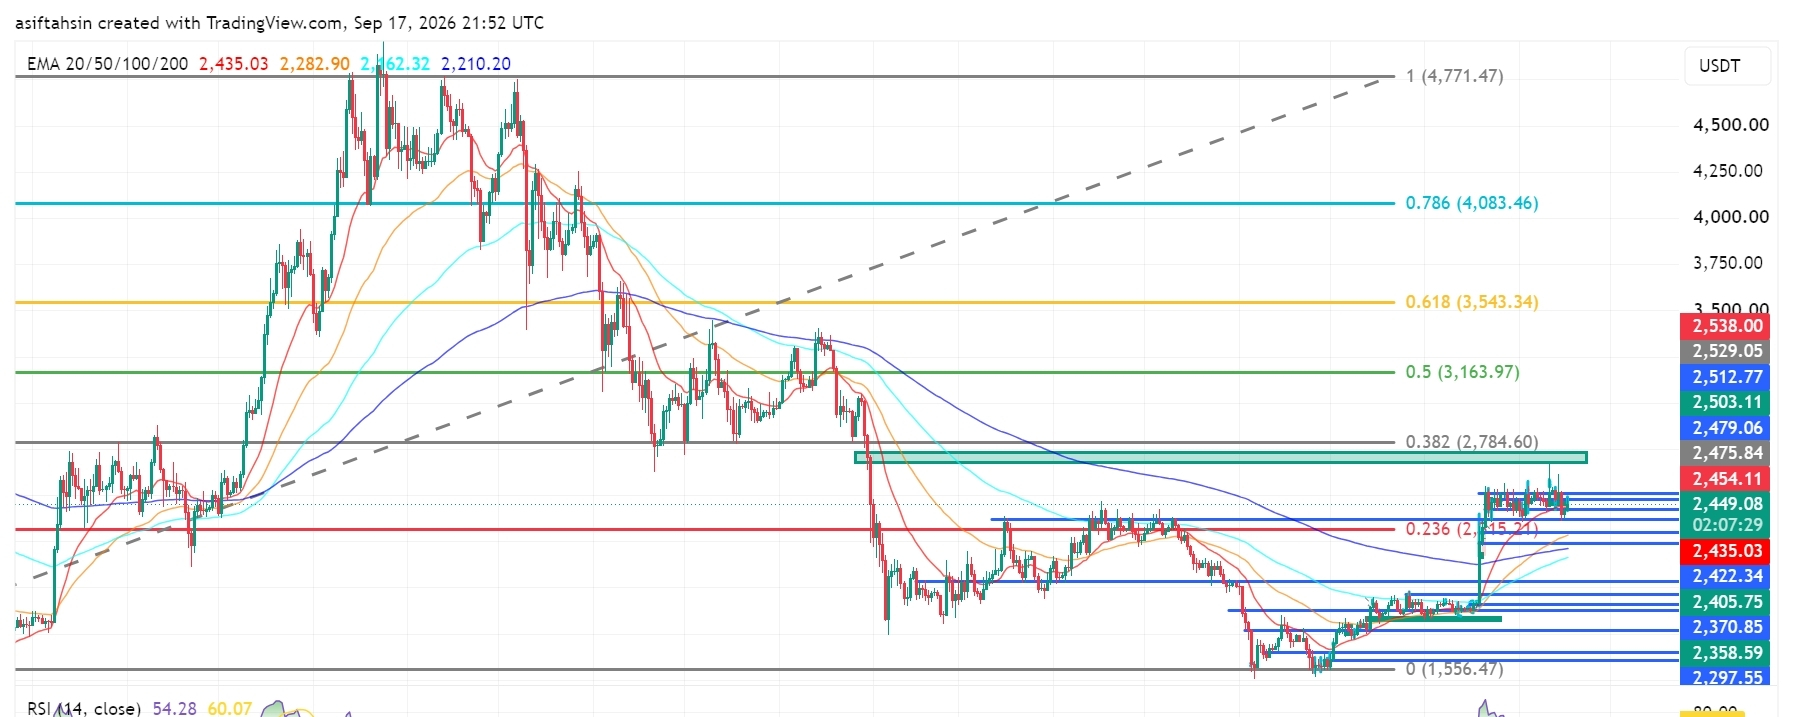
Мақала
ETH Technical Outlook: Ethereum Holds Above $2.4K as Recovery Structure BuildsETH is currently trading around $2,450, holding above the $2,405–$2,435 support area after the recent recovery from the $2,300–$2,360 demand zone.
The broader structure is improving, but ETH is now consolidating below the $2,475–$2,538 resistance cluster. The next major chart area is around $2,784.60, which aligns with the 0.382 Fibonacci level.
📈 EMA Structure
20 EMA: $2,435.06
50 EMA: $2,282.92
100 EMA: $2,162.32
200 EMA: $2,210.20
ETH is currently trading above the 20 EMA at $2,435.06.
The recovery above the 50 EMA at $2,282.92, 100 EMA at $2,162.32, and 200 EMA at $2,210.20 keeps the broader recovery structure constructive.
A sustained hold above the 20 EMA would support short-term momentum, while losing the $2,210–$2,283 area would weaken the current structure.
📐 Fibonacci Levels
Key Fibonacci levels:
0.236: $2,315.21
0.382: $2,784.60
0.5: $3,163.97
0.618: $3,543.34
0.786: $4,083.46
1.0: $4,771.47
ETH is currently holding well above the 0.236 Fibonacci level at $2,315.21.
The next major Fibonacci resistance is $2,784.60 — 0.382 Fib.
A sustained move through the $2,475–$2,538 resistance structure could place the $2,784.60 region into focus.
🟢 Bullish Scenario
ETH is consolidating after the recent recovery and is currently holding above the $2,435 area.
Immediate resistance:
$2,454.11
$2,475.84
$2,479.06
$2,503.11
$2,512.77
$2,529.05
$2,538.00
$2,784.60 — 0.382 Fibonacci
A clean breakout and sustained close above the $2,529–$2,538 zone would provide stronger confirmation of continued recovery.
🎯 Target 1: $2,475.84
🎯 Target 2: $2,503.11
🎯 Target 3: $2,529.05
🎯 Target 4: $2,538.00
🎯 Target 5: $2,784.60 — 0.382 Fibonacci
🎯 Target 6: $3,163.97 — 0.5 Fibonacci
A confirmed move above $2,538 could strengthen the medium-term recovery structure and bring the $2,784–$3,164 region into focus.
🔴 Pullback Scenario
After the recent recovery, a retest of the breakout area would be normal.
Key supports:
$2,449.37
$2,435.06 — 20 EMA
$2,422.34
$2,405.75
$2,370.85
$2,358.59
$2,297.55
$2,282.92 — 50 EMA
$2,210.20 — 200 EMA
The $2,405–$2,435 zone is particularly important.
If ETH continues to hold this area during a pullback, the current recovery structure remains active.
A sustained loss of $2,282.92 would weaken the broader structure and could expose the $2,210–$2,162 area.
🧠 Market Structure & Liquidity
ETH has formed a clear recovery structure after sweeping liquidity around the $2,280–$2,360 region.
The recent move produced a strong recovery followed by a breakout above the previous consolidation area.
ETH is now moving through an important:
Recovery → Breakout → Retest → Consolidation
structure.
The major upside liquidity is concentrated around $2,475–$2,538. A decisive move through this zone would place $2,784.60 as the next major Fibonacci reference.
📊 RSI Momentum
RSI (14): 54.28
RSI remains above the neutral 50 level after the recent recovery.
The current reading shows moderately positive momentum, while the RSI signal line is around 60.07.
A sustained RSI move above 55–60 would indicate improving momentum toward the upper resistance area.
A move back below 50 would indicate increasing short-term momentum weakness.
🎯 Key Levels
🔴 Major Resistance: $2,454.11 → $2,475.84 → $2,503.11 → $2,529.05 → $2,538.00
🟢 Major Support: $2,435.06 → $2,422.34 → $2,405.75 → $2,370.85 → $2,358.59
📉 Dynamic EMA Support: $2,435.06 — 20 EMA | $2,282.92 — 50 EMA | $2,210.20 — 200 EMA | $2,162.32 — 100 EMA
🚀 Upside References: $2,538 → $2,784.60 → $3,163.97 → $3,543.34
📌 Final Outlook
ETH's broader structure remains constructive after the recent recovery, with price holding above the $2,405–$2,435 area.
The $2,405–$2,435 zone is now an important short-term support region. As long as ETH maintains this area, the current recovery structure remains active.
The immediate battle is around $2,475–$2,538. A confirmed move above $2,538 could open the path toward $2,784.60, followed by $3,163.97.
However, rejection from resistance followed by a sustained loss of $2,282.92 would weaken the broader structure and increase the possibility of a deeper retracement toward the $2,210–$2,162 area.
Bias: 🟢 Recovery structure intact above $2,282.92. A breakout above $2,538 could open the path toward $2,784.60, with $3,163.97 as the next major Fibonacci reference.
$ETH
{future}(ETHUSDT)
ETH Technical Outlook: Ethereum Holds Above $2.4K as Recovery Structure Builds
ETH is currently trading around $2,450, holding above the $2,405–$2,435 support area after the recent recovery from the $2,300–$2,360 demand zone.
The broader structure is improving, but ETH is now consolidating below the $2,475–$2,538 resistance cluster. The next major chart area is around $2,784.60, which aligns with the 0.382 Fibonacci level.
📈 EMA Structure
20 EMA: $2,435.06
50 EMA: $2,282.92
100 EMA: $2,162.32
200 EMA: $2,210.20
ETH is currently trading above the 20 EMA at $2,435.06.
The recovery above the 50 EMA at $2,282.92, 100 EMA at $2,162.32, and 200 EMA at $2,210.20 keeps the broader recovery structure constructive.
A sustained hold above the 20 EMA would support short-term momentum, while losing the $2,210–$2,283 area would weaken the current structure.
📐 Fibonacci Levels
Key Fibonacci levels:
0.236: $2,315.21
0.382: $2,784.60
0.5: $3,163.97
0.618: $3,543.34
0.786: $4,083.46
1.0: $4,771.47
ETH is currently holding well above the 0.236 Fibonacci level at $2,315.21.
The next major Fibonacci resistance is $2,784.60 — 0.382 Fib.
A sustained move through the $2,475–$2,538 resistance structure could place the $2,784.60 region into focus.
🟢 Bullish Scenario
ETH is consolidating after the recent recovery and is currently holding above the $2,435 area.
Immediate resistance:
$2,454.11
$2,475.84
$2,479.06
$2,503.11
$2,512.77
$2,529.05
$2,538.00
$2,784.60 — 0.382 Fibonacci
A clean breakout and sustained close above the $2,529–$2,538 zone would provide stronger confirmation of continued recovery.
🎯 Target 1: $2,475.84
🎯 Target 2: $2,503.11
🎯 Target 3: $2,529.05
🎯 Target 4: $2,538.00
🎯 Target 5: $2,784.60 — 0.382 Fibonacci
🎯 Target 6: $3,163.97 — 0.5 Fibonacci
A confirmed move above $2,538 could strengthen the medium-term recovery structure and bring the $2,784–$3,164 region into focus.
🔴 Pullback Scenario
After the recent recovery, a retest of the breakout area would be normal.
Key supports:
$2,449.37
$2,435.06 — 20 EMA
$2,422.34
$2,405.75
$2,370.85
$2,358.59
$2,297.55
$2,282.92 — 50 EMA
$2,210.20 — 200 EMA
The $2,405–$2,435 zone is particularly important.
If ETH continues to hold this area during a pullback, the current recovery structure remains active.
A sustained loss of $2,282.92 would weaken the broader structure and could expose the $2,210–$2,162 area.
🧠 Market Structure & Liquidity
ETH has formed a clear recovery structure after sweeping liquidity around the $2,280–$2,360 region.
The recent move produced a strong recovery followed by a breakout above the previous consolidation area.
ETH is now moving through an important:
Recovery → Breakout → Retest → Consolidation
structure.
The major upside liquidity is concentrated around $2,475–$2,538. A decisive move through this zone would place $2,784.60 as the next major Fibonacci reference.
📊 RSI Momentum
RSI (14): 54.28
RSI remains above the neutral 50 level after the recent recovery.
The current reading shows moderately positive momentum, while the RSI signal line is around 60.07.
A sustained RSI move above 55–60 would indicate improving momentum toward the upper resistance area.
A move back below 50 would indicate increasing short-term momentum weakness.
🎯 Key Levels
🔴 Major Resistance: $2,454.11 → $2,475.84 → $2,503.11 → $2,529.05 → $2,538.00
🟢 Major Support: $2,435.06 → $2,422.34 → $2,405.75 → $2,370.85 → $2,358.59
📉 Dynamic EMA Support: $2,435.06 — 20 EMA | $2,282.92 — 50 EMA | $2,210.20 — 200 EMA | $2,162.32 — 100 EMA
🚀 Upside References: $2,538 → $2,784.60 → $3,163.97 → $3,543.34
📌 Final Outlook
ETH's broader structure remains constructive after the recent recovery, with price holding above the $2,405–$2,435 area.
The $2,405–$2,435 zone is now an important short-term support region. As long as ETH maintains this area, the current recovery structure remains active.
The immediate battle is around $2,475–$2,538. A confirmed move above $2,538 could open the path toward $2,784.60, followed by $3,163.97.
However, rejection from resistance followed by a sustained loss of $2,282.92 would weaken the broader structure and increase the possibility of a deeper retracement toward the $2,210–$2,162 area.
Bias: 🟢 Recovery structure intact above $2,282.92. A breakout above $2,538 could open the path toward $2,784.60, with $3,163.97 as the next major Fibonacci reference.
$ETH
The broader structure is improving, but ETH is now consolidating below the $2,475–$2,538 resistance cluster. The next major chart area is around $2,784.60, which aligns with the 0.382 Fibonacci level.
📈 EMA Structure
20 EMA: $2,435.06
50 EMA: $2,282.92
100 EMA: $2,162.32
200 EMA: $2,210.20
ETH is currently trading above the 20 EMA at $2,435.06.
The recovery above the 50 EMA at $2,282.92, 100 EMA at $2,162.32, and 200 EMA at $2,210.20 keeps the broader recovery structure constructive.
A sustained hold above the 20 EMA would support short-term momentum, while losing the $2,210–$2,283 area would weaken the current structure.
📐 Fibonacci Levels
Key Fibonacci levels:
0.236: $2,315.21
0.382: $2,784.60
0.5: $3,163.97
0.618: $3,543.34
0.786: $4,083.46
1.0: $4,771.47
ETH is currently holding well above the 0.236 Fibonacci level at $2,315.21.
The next major Fibonacci resistance is $2,784.60 — 0.382 Fib.
A sustained move through the $2,475–$2,538 resistance structure could place the $2,784.60 region into focus.
🟢 Bullish Scenario
ETH is consolidating after the recent recovery and is currently holding above the $2,435 area.
Immediate resistance:
$2,454.11
$2,475.84
$2,479.06
$2,503.11
$2,512.77
$2,529.05
$2,538.00
$2,784.60 — 0.382 Fibonacci
A clean breakout and sustained close above the $2,529–$2,538 zone would provide stronger confirmation of continued recovery.
🎯 Target 1: $2,475.84
🎯 Target 2: $2,503.11
🎯 Target 3: $2,529.05
🎯 Target 4: $2,538.00
🎯 Target 5: $2,784.60 — 0.382 Fibonacci
🎯 Target 6: $3,163.97 — 0.5 Fibonacci
A confirmed move above $2,538 could strengthen the medium-term recovery structure and bring the $2,784–$3,164 region into focus.
🔴 Pullback Scenario
After the recent recovery, a retest of the breakout area would be normal.
Key supports:
$2,449.37
$2,435.06 — 20 EMA
$2,422.34
$2,405.75
$2,370.85
$2,358.59
$2,297.55
$2,282.92 — 50 EMA
$2,210.20 — 200 EMA
The $2,405–$2,435 zone is particularly important.
If ETH continues to hold this area during a pullback, the current recovery structure remains active.
A sustained loss of $2,282.92 would weaken the broader structure and could expose the $2,210–$2,162 area.
🧠 Market Structure & Liquidity
ETH has formed a clear recovery structure after sweeping liquidity around the $2,280–$2,360 region.
The recent move produced a strong recovery followed by a breakout above the previous consolidation area.
ETH is now moving through an important:
Recovery → Breakout → Retest → Consolidation
structure.
The major upside liquidity is concentrated around $2,475–$2,538. A decisive move through this zone would place $2,784.60 as the next major Fibonacci reference.
📊 RSI Momentum
RSI (14): 54.28
RSI remains above the neutral 50 level after the recent recovery.
The current reading shows moderately positive momentum, while the RSI signal line is around 60.07.
A sustained RSI move above 55–60 would indicate improving momentum toward the upper resistance area.
A move back below 50 would indicate increasing short-term momentum weakness.
🎯 Key Levels
🔴 Major Resistance: $2,454.11 → $2,475.84 → $2,503.11 → $2,529.05 → $2,538.00
🟢 Major Support: $2,435.06 → $2,422.34 → $2,405.75 → $2,370.85 → $2,358.59
📉 Dynamic EMA Support: $2,435.06 — 20 EMA | $2,282.92 — 50 EMA | $2,210.20 — 200 EMA | $2,162.32 — 100 EMA
🚀 Upside References: $2,538 → $2,784.60 → $3,163.97 → $3,543.34
📌 Final Outlook
ETH's broader structure remains constructive after the recent recovery, with price holding above the $2,405–$2,435 area.
The $2,405–$2,435 zone is now an important short-term support region. As long as ETH maintains this area, the current recovery structure remains active.
The immediate battle is around $2,475–$2,538. A confirmed move above $2,538 could open the path toward $2,784.60, followed by $3,163.97.
However, rejection from resistance followed by a sustained loss of $2,282.92 would weaken the broader structure and increase the possibility of a deeper retracement toward the $2,210–$2,162 area.
Bias: 🟢 Recovery structure intact above $2,282.92. A breakout above $2,538 could open the path toward $2,784.60, with $3,163.97 as the next major Fibonacci reference.
$ETH
75
·
--
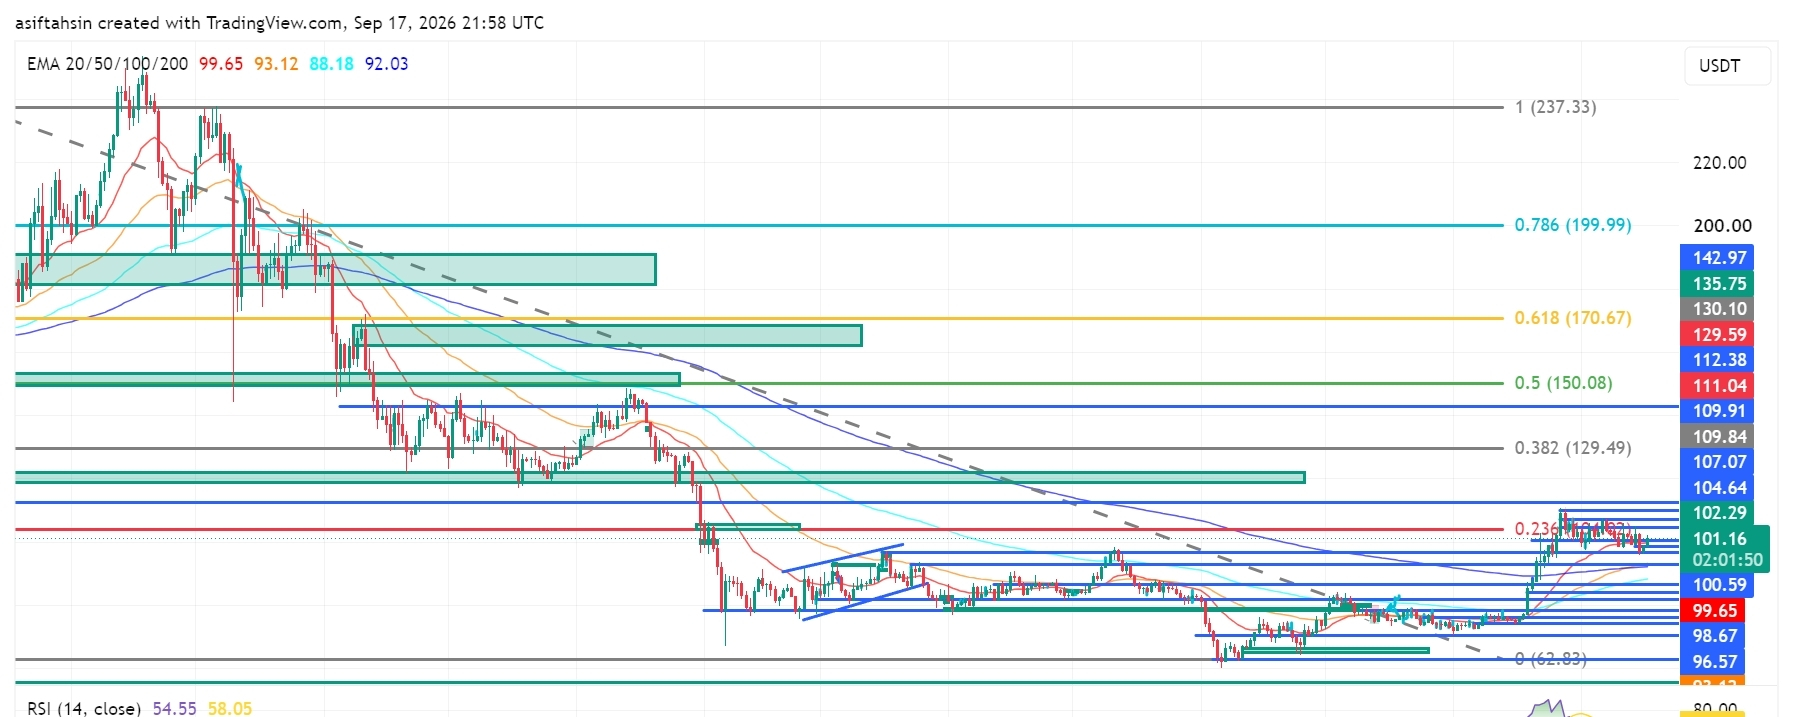
Мақала
SOL Technical Outlook: Solana Holds Above $100 as Bulls Defend the RecoverySOL is currently trading around $101.16, holding above the $99–$100 breakout zone after the recent bullish expansion from the $92–$94 demand area.
The broader recovery structure remains constructive, but SOL is now consolidating below the $102.29–$107.07 resistance cluster. Bulls need to reclaim this area and break the $109.91–$112.38 zone for the next major upside expansion.
📈 EMA Structure
- 20 EMA: $99.65
- 50 EMA: $93.12
- 100 EMA: $88.18
- 200 EMA: $92.03
SOL is currently trading above the 20 EMA at $99.65.
The recovery above the 50 EMA at $93.12 and 200 EMA at $92.03 keeps the broader recovery structure intact.
A sustained hold above the 20 EMA would support short-term momentum, while losing the $93.12–$92.03 area would weaken the current structure.
📐 Fibonacci Levels
Key Fibonacci levels:
- 0.236: $104.64
- 0.382: $129.49
- 0.5: $150.08
- 0.618: $170.67
- 0.786: $199.99
- 1.0: $237.33
SOL is currently trading below the 0.236 Fibonacci level at $104.64.
The next major Fibonacci resistance is $129.49 — 0.382 Fib.
A sustained breakout through the $104–$112 resistance structure could open the path toward the $129.49 region.
🟢 Bullish Scenario
SOL is consolidating after the recent recovery and is currently maintaining acceptance above the $100 area.
Immediate resistance:
- $102.29
- $104.64 — 0.236 Fibonacci
- $107.07
- $109.84
- $109.91
- $111.04
- $112.38
A clean breakout and sustained close above $111.04–$112.38 would provide stronger confirmation of bullish continuation.
🎯 Target 1: $104.64
🎯 Target 2: $107.07
🎯 Target 3: $109.91
🎯 Target 4: $112.38
🎯 Target 5: $129.49 — 0.382 Fibonacci
🎯 Target 6: $150.08 — 0.5 Fibonacci
A confirmed breakout above the $111–$112 zone could strengthen the medium-term recovery structure and potentially accelerate SOL toward the $129–$150 region.
🔴 Pullback Scenario
After the recent bullish expansion, a retest of the breakout area would be normal.
Key supports:
- $100.59
- $99.65 — 20 EMA
- $98.67
- $96.57
- $93.12 — 50 EMA
- $92.94
- $92.03 — 200 EMA
- $88.18 — 100 EMA
The $96–$100 zone is particularly important.
If SOL continues to hold this area during a pullback, the current recovery structure remains active.
A sustained loss of $92.03 would weaken the current structure and could expose the $88.18 support zone.
🧠 Market Structure & Liquidity
SOL has formed a clear recovery structure after sweeping liquidity around the $92–$94 demand region.
The recent move produced a market-structure shift followed by a breakout and higher-low formation.
SOL is now moving through an important:
Breakout → Retest → Consolidation → Continuation
structure.
The major upside liquidity is concentrated around $102–$112. A decisive breakout above this zone would place $129.49 as the next major Fibonacci reference.
📊 RSI Momentum
RSI (14): 54.55
RSI remains above the neutral 50 level after cooling from the recent bullish expansion.
The current reading shows moderately positive momentum without reaching an extreme zone.
A sustained RSI move above 55–60 would indicate improving momentum toward the upper resistance area.
A move back below 50 would indicate increasing short-term momentum weakness.
🎯 Key Levels
🔴 Major Resistance: $102.29 → $104.64 → $107.07 → $109.91 → $111.04 → $112.38
🟢 Major Support: $100.59 → $99.65 → $98.67 → $96.57 → $93.12 → $92.03
📉 Dynamic EMA Support: $99.65 — 20 EMA | $93.12 — 50 EMA | $92.03 — 200 EMA | $88.18 — 100 EMA
🚀 Upside Targets: $112.38 → $129.49 → $150.08 → $170.67
📌 Final Outlook
SOL's broader structure remains constructive after the recent breakout, with price holding above the $99–$100 region.
The $96–$100 area is now an important short-term support region. As long as SOL maintains this area, the current recovery structure remains active.
The immediate battle is around $102–$112. A confirmed breakout above $112.38 could open the path toward $129.49, followed by $150.08 and potentially $170.67.
However, rejection from resistance followed by a sustained loss of $92.03 would weaken the current structure and increase the possibility of a deeper retracement toward the $88.18 area.
Bias: 🟢 Recovery structure intact above $92.03. A breakout above $112.38 could open the path toward $129.49, with $150.08 as the next major Fibonacci target.
$SOL
{future}(SOLUSDT)
SOL Technical Outlook: Solana Holds Above $100 as Bulls Defend the Recovery
SOL is currently trading around $101.16, holding above the $99–$100 breakout zone after the recent bullish expansion from the $92–$94 demand area.
The broader recovery structure remains constructive, but SOL is now consolidating below the $102.29–$107.07 resistance cluster. Bulls need to reclaim this area and break the $109.91–$112.38 zone for the next major upside expansion.
📈 EMA Structure
- 20 EMA: $99.65
- 50 EMA: $93.12
- 100 EMA: $88.18
- 200 EMA: $92.03
SOL is currently trading above the 20 EMA at $99.65.
The recovery above the 50 EMA at $93.12 and 200 EMA at $92.03 keeps the broader recovery structure intact.
A sustained hold above the 20 EMA would support short-term momentum, while losing the $93.12–$92.03 area would weaken the current structure.
📐 Fibonacci Levels
Key Fibonacci levels:
- 0.236: $104.64
- 0.382: $129.49
- 0.5: $150.08
- 0.618: $170.67
- 0.786: $199.99
- 1.0: $237.33
SOL is currently trading below the 0.236 Fibonacci level at $104.64.
The next major Fibonacci resistance is $129.49 — 0.382 Fib.
A sustained breakout through the $104–$112 resistance structure could open the path toward the $129.49 region.
🟢 Bullish Scenario
SOL is consolidating after the recent recovery and is currently maintaining acceptance above the $100 area.
Immediate resistance:
- $102.29
- $104.64 — 0.236 Fibonacci
- $107.07
- $109.84
- $109.91
- $111.04
- $112.38
A clean breakout and sustained close above $111.04–$112.38 would provide stronger confirmation of bullish continuation.
🎯 Target 1: $104.64
🎯 Target 2: $107.07
🎯 Target 3: $109.91
🎯 Target 4: $112.38
🎯 Target 5: $129.49 — 0.382 Fibonacci
🎯 Target 6: $150.08 — 0.5 Fibonacci
A confirmed breakout above the $111–$112 zone could strengthen the medium-term recovery structure and potentially accelerate SOL toward the $129–$150 region.
🔴 Pullback Scenario
After the recent bullish expansion, a retest of the breakout area would be normal.
Key supports:
- $100.59
- $99.65 — 20 EMA
- $98.67
- $96.57
- $93.12 — 50 EMA
- $92.94
- $92.03 — 200 EMA
- $88.18 — 100 EMA
The $96–$100 zone is particularly important.
If SOL continues to hold this area during a pullback, the current recovery structure remains active.
A sustained loss of $92.03 would weaken the current structure and could expose the $88.18 support zone.
🧠 Market Structure & Liquidity
SOL has formed a clear recovery structure after sweeping liquidity around the $92–$94 demand region.
The recent move produced a market-structure shift followed by a breakout and higher-low formation.
SOL is now moving through an important:
Breakout → Retest → Consolidation → Continuation
structure.
The major upside liquidity is concentrated around $102–$112. A decisive breakout above this zone would place $129.49 as the next major Fibonacci reference.
📊 RSI Momentum
RSI (14): 54.55
RSI remains above the neutral 50 level after cooling from the recent bullish expansion.
The current reading shows moderately positive momentum without reaching an extreme zone.
A sustained RSI move above 55–60 would indicate improving momentum toward the upper resistance area.
A move back below 50 would indicate increasing short-term momentum weakness.
🎯 Key Levels
🔴 Major Resistance: $102.29 → $104.64 → $107.07 → $109.91 → $111.04 → $112.38
🟢 Major Support: $100.59 → $99.65 → $98.67 → $96.57 → $93.12 → $92.03
📉 Dynamic EMA Support: $99.65 — 20 EMA | $93.12 — 50 EMA | $92.03 — 200 EMA | $88.18 — 100 EMA
🚀 Upside Targets: $112.38 → $129.49 → $150.08 → $170.67
📌 Final Outlook
SOL's broader structure remains constructive after the recent breakout, with price holding above the $99–$100 region.
The $96–$100 area is now an important short-term support region. As long as SOL maintains this area, the current recovery structure remains active.
The immediate battle is around $102–$112. A confirmed breakout above $112.38 could open the path toward $129.49, followed by $150.08 and potentially $170.67.
However, rejection from resistance followed by a sustained loss of $92.03 would weaken the current structure and increase the possibility of a deeper retracement toward the $88.18 area.
Bias: 🟢 Recovery structure intact above $92.03. A breakout above $112.38 could open the path toward $129.49, with $150.08 as the next major Fibonacci target.
$SOL
The broader recovery structure remains constructive, but SOL is now consolidating below the $102.29–$107.07 resistance cluster. Bulls need to reclaim this area and break the $109.91–$112.38 zone for the next major upside expansion.
📈 EMA Structure
- 20 EMA: $99.65
- 50 EMA: $93.12
- 100 EMA: $88.18
- 200 EMA: $92.03
SOL is currently trading above the 20 EMA at $99.65.
The recovery above the 50 EMA at $93.12 and 200 EMA at $92.03 keeps the broader recovery structure intact.
A sustained hold above the 20 EMA would support short-term momentum, while losing the $93.12–$92.03 area would weaken the current structure.
📐 Fibonacci Levels
Key Fibonacci levels:
- 0.236: $104.64
- 0.382: $129.49
- 0.5: $150.08
- 0.618: $170.67
- 0.786: $199.99
- 1.0: $237.33
SOL is currently trading below the 0.236 Fibonacci level at $104.64.
The next major Fibonacci resistance is $129.49 — 0.382 Fib.
A sustained breakout through the $104–$112 resistance structure could open the path toward the $129.49 region.
🟢 Bullish Scenario
SOL is consolidating after the recent recovery and is currently maintaining acceptance above the $100 area.
Immediate resistance:
- $102.29
- $104.64 — 0.236 Fibonacci
- $107.07
- $109.84
- $109.91
- $111.04
- $112.38
A clean breakout and sustained close above $111.04–$112.38 would provide stronger confirmation of bullish continuation.
🎯 Target 1: $104.64
🎯 Target 2: $107.07
🎯 Target 3: $109.91
🎯 Target 4: $112.38
🎯 Target 5: $129.49 — 0.382 Fibonacci
🎯 Target 6: $150.08 — 0.5 Fibonacci
A confirmed breakout above the $111–$112 zone could strengthen the medium-term recovery structure and potentially accelerate SOL toward the $129–$150 region.
🔴 Pullback Scenario
After the recent bullish expansion, a retest of the breakout area would be normal.
Key supports:
- $100.59
- $99.65 — 20 EMA
- $98.67
- $96.57
- $93.12 — 50 EMA
- $92.94
- $92.03 — 200 EMA
- $88.18 — 100 EMA
The $96–$100 zone is particularly important.
If SOL continues to hold this area during a pullback, the current recovery structure remains active.
A sustained loss of $92.03 would weaken the current structure and could expose the $88.18 support zone.
🧠 Market Structure & Liquidity
SOL has formed a clear recovery structure after sweeping liquidity around the $92–$94 demand region.
The recent move produced a market-structure shift followed by a breakout and higher-low formation.
SOL is now moving through an important:
Breakout → Retest → Consolidation → Continuation
structure.
The major upside liquidity is concentrated around $102–$112. A decisive breakout above this zone would place $129.49 as the next major Fibonacci reference.
📊 RSI Momentum
RSI (14): 54.55
RSI remains above the neutral 50 level after cooling from the recent bullish expansion.
The current reading shows moderately positive momentum without reaching an extreme zone.
A sustained RSI move above 55–60 would indicate improving momentum toward the upper resistance area.
A move back below 50 would indicate increasing short-term momentum weakness.
🎯 Key Levels
🔴 Major Resistance: $102.29 → $104.64 → $107.07 → $109.91 → $111.04 → $112.38
🟢 Major Support: $100.59 → $99.65 → $98.67 → $96.57 → $93.12 → $92.03
📉 Dynamic EMA Support: $99.65 — 20 EMA | $93.12 — 50 EMA | $92.03 — 200 EMA | $88.18 — 100 EMA
🚀 Upside Targets: $112.38 → $129.49 → $150.08 → $170.67
📌 Final Outlook
SOL's broader structure remains constructive after the recent breakout, with price holding above the $99–$100 region.
The $96–$100 area is now an important short-term support region. As long as SOL maintains this area, the current recovery structure remains active.
The immediate battle is around $102–$112. A confirmed breakout above $112.38 could open the path toward $129.49, followed by $150.08 and potentially $170.67.
However, rejection from resistance followed by a sustained loss of $92.03 would weaken the current structure and increase the possibility of a deeper retracement toward the $88.18 area.
Bias: 🟢 Recovery structure intact above $92.03. A breakout above $112.38 could open the path toward $129.49, with $150.08 as the next major Fibonacci target.
$SOL
73
·
--
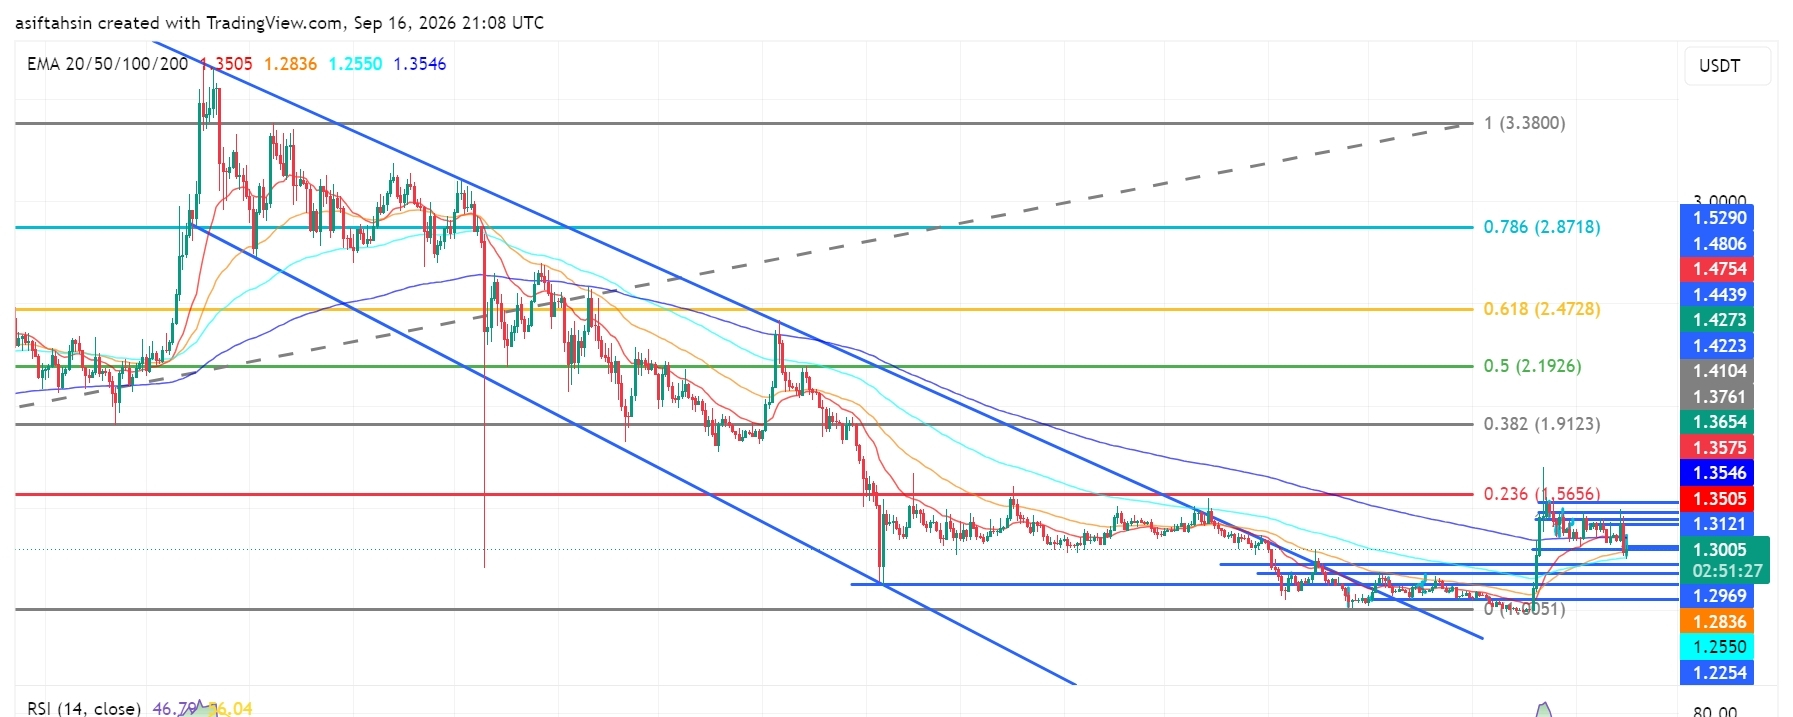
Мақала
XRP Technical Outlook: XRP Consolidates Near $1.30 After Sharp PullbackXRP is trading around $1.30 on the chart after a sharp rejection from the $1.35–$1.43 region. Price has returned toward the breakout area, while the broader chart remains in a recovery phase from the $1.20–$1.25 zone. Current momentum is neutral, with RSI below 50.
📈 EMA Structure
20 EMA: $1.3505
50 EMA: $1.2836
100 EMA: $1.2550
200 EMA: $1.3546
XRP is currently below the 20 EMA and 200 EMA, while the 50 and 100 EMAs remain underneath price. Reclaiming the $1.35 area would improve the short-term structure.
📐 Fibonacci Levels
0.236: $1.5656
0.382: $1.9123
0.5: $2.1926
0.618: $2.4728
0.786: $2.8718
1.0: $3.3800
The $1.5656 Fibonacci level is the first major reference above the current range.
🟢 Upside Scenario
A move back above $1.3121 → $1.3505 → $1.3575 → $1.3654 → $1.3761 → $1.4104 → $1.4223 would improve the short-term chart structure.
Above the $1.4439–$1.4754 region, the next major Fibonacci reference is $1.5656.
🔴 Downside Scenario
If XRP remains below the 20/200 EMA area, the main levels to monitor are:
$1.2969 → $1.2836 → $1.2550 → $1.2254 → $1.1794
The $1.2836–$1.2550 region is particularly important because it contains the 50 and 100 EMAs.
🧠 Market Structure & Liquidity
XRP previously broke out from the long descending structure and moved toward the $1.40+ region. The latest move has brought price back into the previous consolidation zone.
The chart is now showing a breakout → expansion → pullback → consolidation structure. The next clear move around $1.28–$1.35 should provide better confirmation of direction.
📊 RSI Momentum
RSI: 46.79
RSI has moved below the neutral 50 level, showing that short-term momentum has cooled. A recovery above 50 would indicate improving momentum.
🎯 Main Chart Levels
Resistance: $1.3121 → $1.3505 → $1.3575 → $1.3654 → $1.4104 → $1.4439 → $1.4754
Support: $1.2969 → $1.2836 → $1.2550 → $1.2254 → $1.1794
📌 Final Outlook
XRP is currently consolidating around $1.30 after the recent pullback. The $1.28–$1.25 region is the main lower structure, while $1.35–$1.41 remains the key overhead area.
Above $1.4439: $1.4754 → $1.5656 → $1.9123
Below $1.2550: $1.2254 → $1.1794
Current market data also shows XRP around the $1.27–$1.28 area, confirming that the chart's $1.28 support region remains closely aligned with the broader market price.
$XRP
{future}(XRPUSDT)
XRP Technical Outlook: XRP Consolidates Near $1.30 After Sharp Pullback
XRP is trading around $1.30 on the chart after a sharp rejection from the $1.35–$1.43 region. Price has returned toward the breakout area, while the broader chart remains in a recovery phase from the $1.20–$1.25 zone. Current momentum is neutral, with RSI below 50.
📈 EMA Structure
20 EMA: $1.3505
50 EMA: $1.2836
100 EMA: $1.2550
200 EMA: $1.3546
XRP is currently below the 20 EMA and 200 EMA, while the 50 and 100 EMAs remain underneath price. Reclaiming the $1.35 area would improve the short-term structure.
📐 Fibonacci Levels
0.236: $1.5656
0.382: $1.9123
0.5: $2.1926
0.618: $2.4728
0.786: $2.8718
1.0: $3.3800
The $1.5656 Fibonacci level is the first major reference above the current range.
🟢 Upside Scenario
A move back above $1.3121 → $1.3505 → $1.3575 → $1.3654 → $1.3761 → $1.4104 → $1.4223 would improve the short-term chart structure.
Above the $1.4439–$1.4754 region, the next major Fibonacci reference is $1.5656.
🔴 Downside Scenario
If XRP remains below the 20/200 EMA area, the main levels to monitor are:
$1.2969 → $1.2836 → $1.2550 → $1.2254 → $1.1794
The $1.2836–$1.2550 region is particularly important because it contains the 50 and 100 EMAs.
🧠 Market Structure & Liquidity
XRP previously broke out from the long descending structure and moved toward the $1.40+ region. The latest move has brought price back into the previous consolidation zone.
The chart is now showing a breakout → expansion → pullback → consolidation structure. The next clear move around $1.28–$1.35 should provide better confirmation of direction.
📊 RSI Momentum
RSI: 46.79
RSI has moved below the neutral 50 level, showing that short-term momentum has cooled. A recovery above 50 would indicate improving momentum.
🎯 Main Chart Levels
Resistance: $1.3121 → $1.3505 → $1.3575 → $1.3654 → $1.4104 → $1.4439 → $1.4754
Support: $1.2969 → $1.2836 → $1.2550 → $1.2254 → $1.1794
📌 Final Outlook
XRP is currently consolidating around $1.30 after the recent pullback. The $1.28–$1.25 region is the main lower structure, while $1.35–$1.41 remains the key overhead area.
Above $1.4439: $1.4754 → $1.5656 → $1.9123
Below $1.2550: $1.2254 → $1.1794
Current market data also shows XRP around the $1.27–$1.28 area, confirming that the chart's $1.28 support region remains closely aligned with the broader market price.
$XRP
📈 EMA Structure
20 EMA: $1.3505
50 EMA: $1.2836
100 EMA: $1.2550
200 EMA: $1.3546
XRP is currently below the 20 EMA and 200 EMA, while the 50 and 100 EMAs remain underneath price. Reclaiming the $1.35 area would improve the short-term structure.
📐 Fibonacci Levels
0.236: $1.5656
0.382: $1.9123
0.5: $2.1926
0.618: $2.4728
0.786: $2.8718
1.0: $3.3800
The $1.5656 Fibonacci level is the first major reference above the current range.
🟢 Upside Scenario
A move back above $1.3121 → $1.3505 → $1.3575 → $1.3654 → $1.3761 → $1.4104 → $1.4223 would improve the short-term chart structure.
Above the $1.4439–$1.4754 region, the next major Fibonacci reference is $1.5656.
🔴 Downside Scenario
If XRP remains below the 20/200 EMA area, the main levels to monitor are:
$1.2969 → $1.2836 → $1.2550 → $1.2254 → $1.1794
The $1.2836–$1.2550 region is particularly important because it contains the 50 and 100 EMAs.
🧠 Market Structure & Liquidity
XRP previously broke out from the long descending structure and moved toward the $1.40+ region. The latest move has brought price back into the previous consolidation zone.
The chart is now showing a breakout → expansion → pullback → consolidation structure. The next clear move around $1.28–$1.35 should provide better confirmation of direction.
📊 RSI Momentum
RSI: 46.79
RSI has moved below the neutral 50 level, showing that short-term momentum has cooled. A recovery above 50 would indicate improving momentum.
🎯 Main Chart Levels
Resistance: $1.3121 → $1.3505 → $1.3575 → $1.3654 → $1.4104 → $1.4439 → $1.4754
Support: $1.2969 → $1.2836 → $1.2550 → $1.2254 → $1.1794
📌 Final Outlook
XRP is currently consolidating around $1.30 after the recent pullback. The $1.28–$1.25 region is the main lower structure, while $1.35–$1.41 remains the key overhead area.
Above $1.4439: $1.4754 → $1.5656 → $1.9123
Below $1.2550: $1.2254 → $1.1794
Current market data also shows XRP around the $1.27–$1.28 area, confirming that the chart's $1.28 support region remains closely aligned with the broader market price.
$XRP
1
3
788
·
--
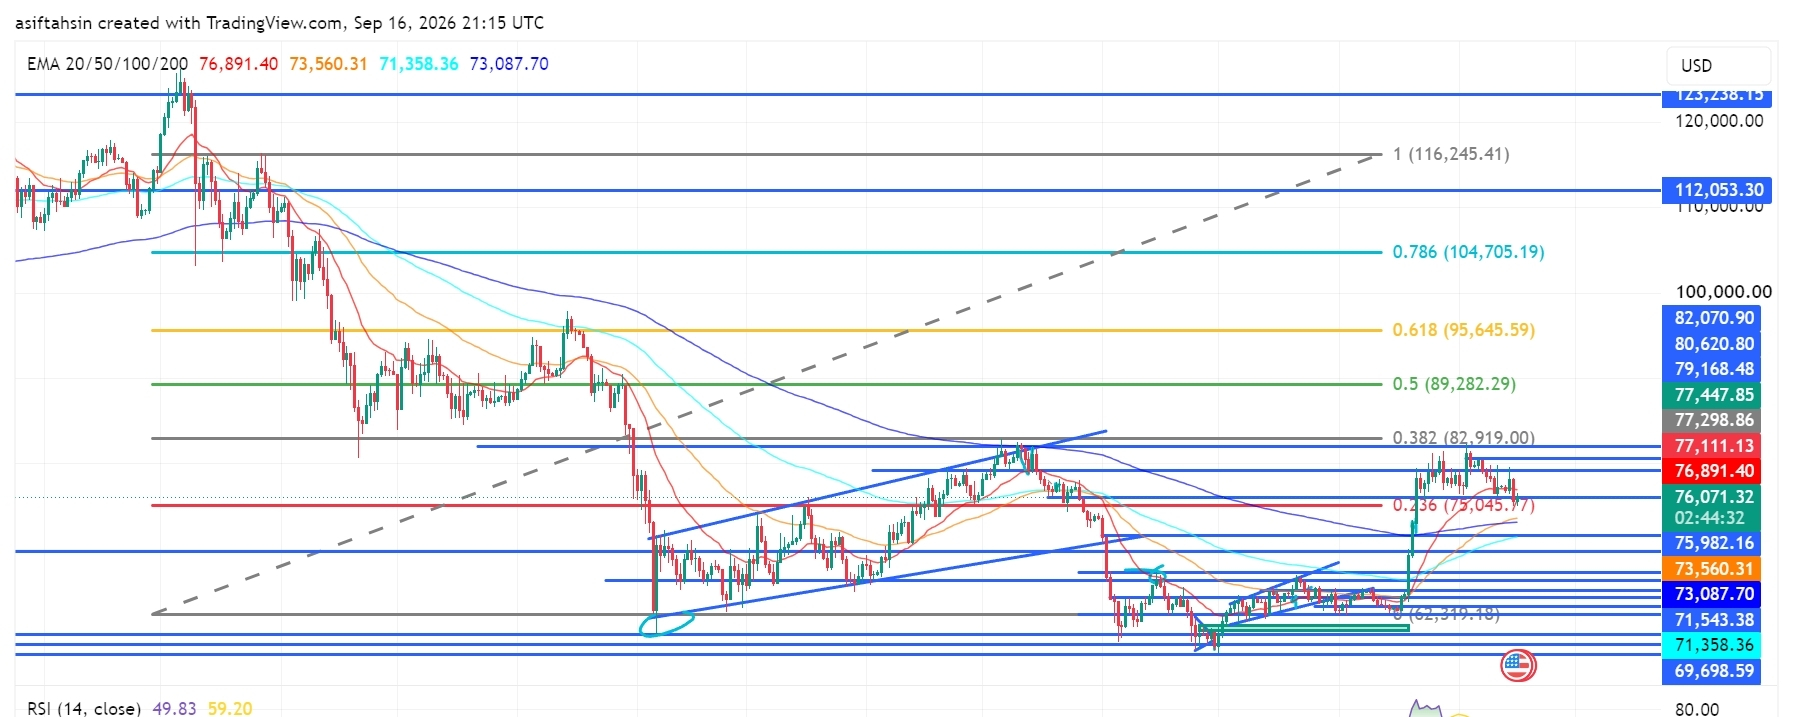
Мақала
BTC Technical Outlook: Bitcoin Consolidates Below $77K as Bulls Defend the RecoveryBitcoin is trading around $76.9K, consolidating after the recent recovery from the $69K–$71K demand area. Price remains above the major $75K support zone, but momentum has cooled as BTC struggles below the $77.1K–$82.9K resistance region. The next breakout or breakdown should determine the short-term direction.
📈 EMA Structure
20 EMA: $76,891
50 EMA: $73,560
100 EMA: $71,358
200 EMA: $73,088
BTC is currently sitting around the 20 EMA, while the 50/100/200 EMAs remain below price. Holding above $75K keeps the broader recovery structure intact, but losing the 20 EMA could bring a deeper retest.
📐 Fibonacci Levels
0.236: $75,045
0.382: $82,919
0.5: $89,282
0.618: $95,646
0.786: $104,705
1.0: $116,245
The $75,045–$76K zone is the immediate defensive area. A clean break above $82,919 would open the higher Fibonacci levels.
🟢 Bullish Scenario
BTC needs to reclaim and hold above: $77,111 → $77,299 → $77,448 → $79,168 → $80,621 → $82,071
A decisive breakout above $82,919 would strengthen the recovery structure and expose: $89,282 → $95,646 → $104,705
🔴 Pullback Scenario
If BTC fails to reclaim the $77K area, watch: $76,071 → $75,982 → $75,045
A sustained breakdown below $75,045 would weaken the recovery and could bring $73,560 → $73,088 → $71,543 → $71,358 into focus.
🧠 Market Structure & Liquidity
The chart shows a strong recovery from the $69K–$71K demand zone, followed by a breakout toward $82K and now a consolidation phase.
BTC is currently trading between major liquidity zones. The $82K–$83K area remains significant overhead liquidity, while the $75K area is the key downside defense.
📊 RSI Momentum
RSI: 49.83
Momentum has cooled back toward neutral after the previous recovery. RSI remaining near 50 means BTC currently lacks strong directional momentum.
🎯 Key Levels
Resistance: $77,111 → $77,448 → $79,168 → $80,621 → $82,071 → $82,919
Support: $76,071 → $75,982 → $75,045 → $73,560 → $73,088 → $71,543
📌 Final Outlook
BTC remains in a recovery/consolidation structure above $75K, but bulls need to reclaim $77K–$80K and eventually break $82,919 to resume the larger upside move.
Above $82,919: $89,282 → $95,646 → $104,705
Below $75,045: recovery structure weakens and deeper support becomes relevant.
Recent market data also places BTC around the mid-$75K range, consistent with the chart’s key $75K support area.
$BTC
{future}(BTCUSDT)
BTC Technical Outlook: Bitcoin Consolidates Below $77K as Bulls Defend the Recovery
Bitcoin is trading around $76.9K, consolidating after the recent recovery from the $69K–$71K demand area. Price remains above the major $75K support zone, but momentum has cooled as BTC struggles below the $77.1K–$82.9K resistance region. The next breakout or breakdown should determine the short-term direction.
📈 EMA Structure
20 EMA: $76,891
50 EMA: $73,560
100 EMA: $71,358
200 EMA: $73,088
BTC is currently sitting around the 20 EMA, while the 50/100/200 EMAs remain below price. Holding above $75K keeps the broader recovery structure intact, but losing the 20 EMA could bring a deeper retest.
📐 Fibonacci Levels
0.236: $75,045
0.382: $82,919
0.5: $89,282
0.618: $95,646
0.786: $104,705
1.0: $116,245
The $75,045–$76K zone is the immediate defensive area. A clean break above $82,919 would open the higher Fibonacci levels.
🟢 Bullish Scenario
BTC needs to reclaim and hold above: $77,111 → $77,299 → $77,448 → $79,168 → $80,621 → $82,071
A decisive breakout above $82,919 would strengthen the recovery structure and expose: $89,282 → $95,646 → $104,705
🔴 Pullback Scenario
If BTC fails to reclaim the $77K area, watch: $76,071 → $75,982 → $75,045
A sustained breakdown below $75,045 would weaken the recovery and could bring $73,560 → $73,088 → $71,543 → $71,358 into focus.
🧠 Market Structure & Liquidity
The chart shows a strong recovery from the $69K–$71K demand zone, followed by a breakout toward $82K and now a consolidation phase.
BTC is currently trading between major liquidity zones. The $82K–$83K area remains significant overhead liquidity, while the $75K area is the key downside defense.
📊 RSI Momentum
RSI: 49.83
Momentum has cooled back toward neutral after the previous recovery. RSI remaining near 50 means BTC currently lacks strong directional momentum.
🎯 Key Levels
Resistance: $77,111 → $77,448 → $79,168 → $80,621 → $82,071 → $82,919
Support: $76,071 → $75,982 → $75,045 → $73,560 → $73,088 → $71,543
📌 Final Outlook
BTC remains in a recovery/consolidation structure above $75K, but bulls need to reclaim $77K–$80K and eventually break $82,919 to resume the larger upside move.
Above $82,919: $89,282 → $95,646 → $104,705
Below $75,045: recovery structure weakens and deeper support becomes relevant.
Recent market data also places BTC around the mid-$75K range, consistent with the chart’s key $75K support area.
$BTC
📈 EMA Structure
20 EMA: $76,891
50 EMA: $73,560
100 EMA: $71,358
200 EMA: $73,088
BTC is currently sitting around the 20 EMA, while the 50/100/200 EMAs remain below price. Holding above $75K keeps the broader recovery structure intact, but losing the 20 EMA could bring a deeper retest.
📐 Fibonacci Levels
0.236: $75,045
0.382: $82,919
0.5: $89,282
0.618: $95,646
0.786: $104,705
1.0: $116,245
The $75,045–$76K zone is the immediate defensive area. A clean break above $82,919 would open the higher Fibonacci levels.
🟢 Bullish Scenario
BTC needs to reclaim and hold above: $77,111 → $77,299 → $77,448 → $79,168 → $80,621 → $82,071
A decisive breakout above $82,919 would strengthen the recovery structure and expose: $89,282 → $95,646 → $104,705
🔴 Pullback Scenario
If BTC fails to reclaim the $77K area, watch: $76,071 → $75,982 → $75,045
A sustained breakdown below $75,045 would weaken the recovery and could bring $73,560 → $73,088 → $71,543 → $71,358 into focus.
🧠 Market Structure & Liquidity
The chart shows a strong recovery from the $69K–$71K demand zone, followed by a breakout toward $82K and now a consolidation phase.
BTC is currently trading between major liquidity zones. The $82K–$83K area remains significant overhead liquidity, while the $75K area is the key downside defense.
📊 RSI Momentum
RSI: 49.83
Momentum has cooled back toward neutral after the previous recovery. RSI remaining near 50 means BTC currently lacks strong directional momentum.
🎯 Key Levels
Resistance: $77,111 → $77,448 → $79,168 → $80,621 → $82,071 → $82,919
Support: $76,071 → $75,982 → $75,045 → $73,560 → $73,088 → $71,543
📌 Final Outlook
BTC remains in a recovery/consolidation structure above $75K, but bulls need to reclaim $77K–$80K and eventually break $82,919 to resume the larger upside move.
Above $82,919: $89,282 → $95,646 → $104,705
Below $75,045: recovery structure weakens and deeper support becomes relevant.
Recent market data also places BTC around the mid-$75K range, consistent with the chart’s key $75K support area.
$BTC
61
·
--
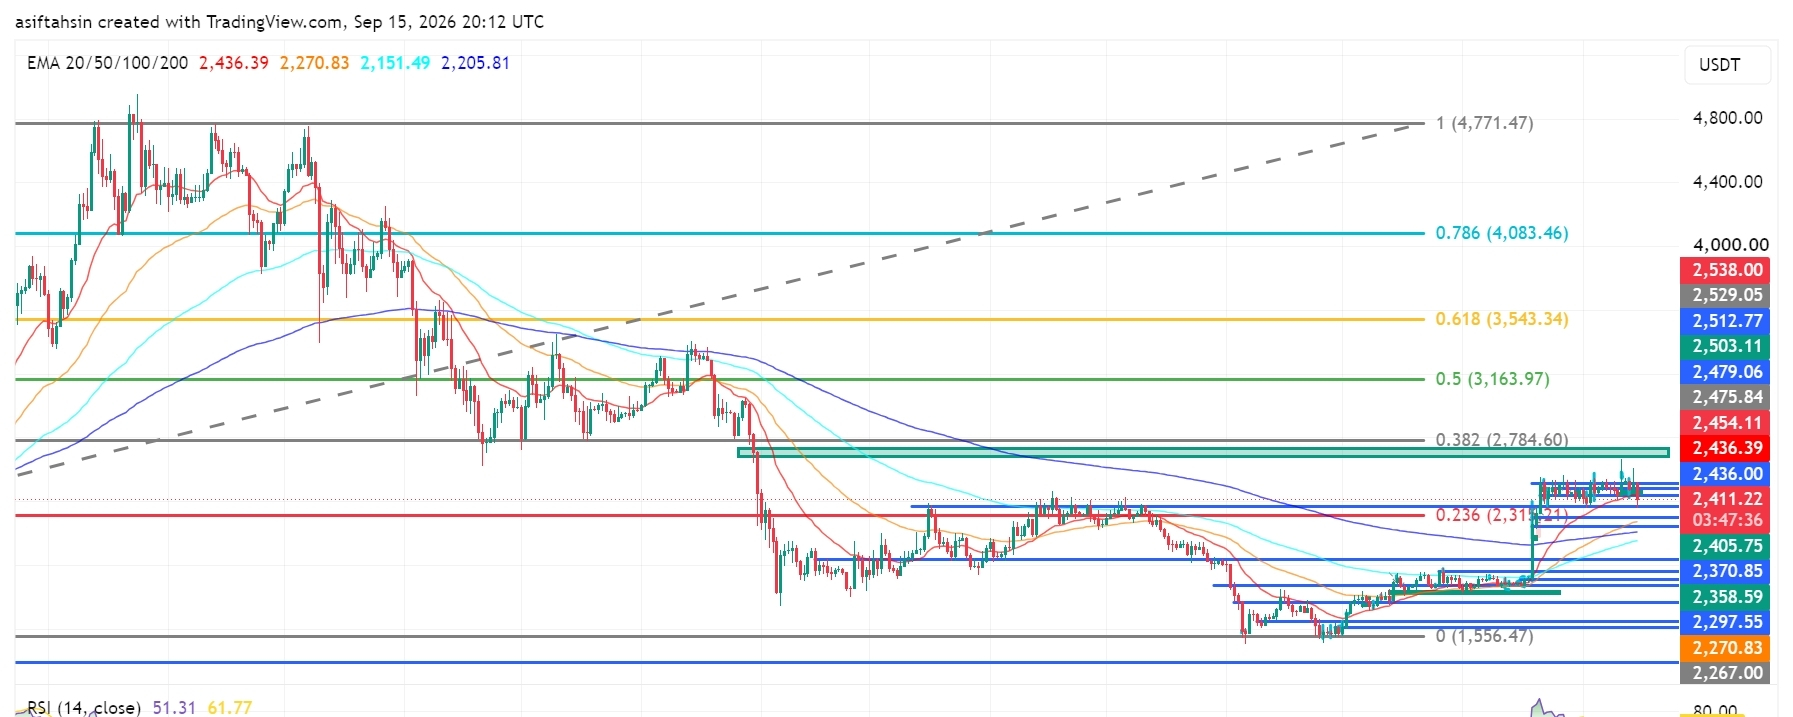
Мақала
SOL Technical Outlook: Solana Holds Near $100 as Bulls Defend the BreakoutSOL is currently trading around $99.6, holding near the $99–$100 breakout zone after the recent bullish expansion from the $92–$94 demand area.
The broader recovery structure remains constructive, but SOL is now consolidating below the $100.59–$104.64 resistance cluster. Bulls need to reclaim this area and break the $107.07–$109.91 zone for the next major upside expansion.
📈 EMA Structure
20 EMA: $99.62
50 EMA: $92.58
100 EMA: $87.71
200 EMA: $91.88
SOL is currently testing the 20 EMA at $99.62.
The recovery above the 50 EMA at $92.58 and 200 EMA at $91.88 keeps the broader recovery structure intact.
A sustained hold above the 20 EMA would strengthen short-term momentum, while losing the $92.58–$91.88 area would weaken the current structure.
📐 Fibonacci Levels
Key Fibonacci levels:
0.236: $100.02
0.382: $129.49
0.5: $150.08
0.618: $170.67
0.786: $199.99
1.0: $237.33
SOL is currently testing the 0.236 Fibonacci region around $100.02.
The next major Fibonacci resistance is $129.49 — 0.382 Fib.
A sustained breakout above the $100–$107 resistance structure could open the path toward the $129.49 region.
🟢 Bullish Scenario
SOL is consolidating after the recent recovery and is currently building acceptance around the $99–$100 area.
Immediate resistance:
$100.02 — 0.236 Fibonacci
$100.59
$102.00
$102.29
$104.64
$107.07
$109.91
$111.04
A clean breakout and sustained close above $109.91–$111.04 would provide stronger confirmation of bullish continuation.
🎯 Target 1: $100.59
🎯 Target 2: $104.64
🎯 Target 3: $107.07
🎯 Target 4: $111.04
🎯 Target 5: $129.49 — 0.382 Fibonacci
🎯 Target 6: $150.08 — 0.5 Fibonacci
A confirmed breakout above the $109.91–$111.04 zone could strengthen the medium-term recovery structure and potentially accelerate SOL toward the $129–$150 region.
🔴 Pullback Scenario
After the recent bullish expansion, a retest of the breakout area would be normal.
Key supports:
$97.42
$96.33
$92.94
$92.58 — 50 EMA
$91.88 — 200 EMA
$87.71 — 100 EMA
The $92–$97 zone is particularly important.
If SOL continues to hold this area during a pullback, the current recovery structure remains valid.
A sustained loss of $91.88 would weaken the bullish setup and could expose the $87.71 support zone.
🧠 Market Structure & Liquidity
SOL has formed a clear recovery structure after sweeping liquidity around the $92–$94 demand region.
The recent move produced a market-structure shift followed by a breakout and higher-low formation.
SOL is now moving through an important:
Breakout → Retest → Consolidation → Continuation
structure.
The major upside liquidity is concentrated around $100–$111. A decisive breakout above this zone would place $129.49 as the next major Fibonacci target.
📊 RSI Momentum
RSI (14): 49.30
RSI has cooled back toward the neutral 50 level after the recent bullish expansion.
The current reading shows that short-term momentum is balanced rather than strongly overbought.
A sustained RSI move back above 50–55 would favor another bullish attempt toward the resistance zone.
A breakdown below 50 would indicate increasing short-term momentum weakness.
🎯 Key Levels
🔴 Major Resistance: $100.02 → $100.59 → $104.64 → $107.07 → $109.91 → $111.04
🟢 Major Support: $97.42 → $96.33 → $92.94 → $92.58 → $91.88
📉 Dynamic EMA Support: $92.58 — 50 EMA | $91.88 — 200 EMA | $87.71 — 100 EMA
🚀 Upside Targets: $111.04 → $129.49 → $150.08 → $170.67
📌 Final Outlook
SOL's broader structure remains constructive after the recent breakout, but price is currently consolidating around the $100 area and below the $100.59–$111 resistance zone.
The $92–$97 area is now the key short-term support region. As long as SOL holds above this zone, the current recovery structure remains active.
The immediate battle is around $100–$111. A confirmed breakout above $111.04 could open the path toward $129.49, followed by $150.08 and potentially $170.67.
However, rejection from resistance followed by a sustained loss of $91.88 would weaken the bullish structure and increase the risk of a deeper retracement toward the $87.71 area.
Bias: 🟢 Recovery structure intact above $91.88. A breakout above $111.04 could open the path toward $129.49, with $150.08 as the next major Fibonacci target.
$SOL
{future}(SOLUSDT)
SOL Technical Outlook: Solana Holds Near $100 as Bulls Defend the Breakout
SOL is currently trading around $99.6, holding near the $99–$100 breakout zone after the recent bullish expansion from the $92–$94 demand area.
The broader recovery structure remains constructive, but SOL is now consolidating below the $100.59–$104.64 resistance cluster. Bulls need to reclaim this area and break the $107.07–$109.91 zone for the next major upside expansion.
📈 EMA Structure
20 EMA: $99.62
50 EMA: $92.58
100 EMA: $87.71
200 EMA: $91.88
SOL is currently testing the 20 EMA at $99.62.
The recovery above the 50 EMA at $92.58 and 200 EMA at $91.88 keeps the broader recovery structure intact.
A sustained hold above the 20 EMA would strengthen short-term momentum, while losing the $92.58–$91.88 area would weaken the current structure.
📐 Fibonacci Levels
Key Fibonacci levels:
0.236: $100.02
0.382: $129.49
0.5: $150.08
0.618: $170.67
0.786: $199.99
1.0: $237.33
SOL is currently testing the 0.236 Fibonacci region around $100.02.
The next major Fibonacci resistance is $129.49 — 0.382 Fib.
A sustained breakout above the $100–$107 resistance structure could open the path toward the $129.49 region.
🟢 Bullish Scenario
SOL is consolidating after the recent recovery and is currently building acceptance around the $99–$100 area.
Immediate resistance:
$100.02 — 0.236 Fibonacci
$100.59
$102.00
$102.29
$104.64
$107.07
$109.91
$111.04
A clean breakout and sustained close above $109.91–$111.04 would provide stronger confirmation of bullish continuation.
🎯 Target 1: $100.59
🎯 Target 2: $104.64
🎯 Target 3: $107.07
🎯 Target 4: $111.04
🎯 Target 5: $129.49 — 0.382 Fibonacci
🎯 Target 6: $150.08 — 0.5 Fibonacci
A confirmed breakout above the $109.91–$111.04 zone could strengthen the medium-term recovery structure and potentially accelerate SOL toward the $129–$150 region.
🔴 Pullback Scenario
After the recent bullish expansion, a retest of the breakout area would be normal.
Key supports:
$97.42
$96.33
$92.94
$92.58 — 50 EMA
$91.88 — 200 EMA
$87.71 — 100 EMA
The $92–$97 zone is particularly important.
If SOL continues to hold this area during a pullback, the current recovery structure remains valid.
A sustained loss of $91.88 would weaken the bullish setup and could expose the $87.71 support zone.
🧠 Market Structure & Liquidity
SOL has formed a clear recovery structure after sweeping liquidity around the $92–$94 demand region.
The recent move produced a market-structure shift followed by a breakout and higher-low formation.
SOL is now moving through an important:
Breakout → Retest → Consolidation → Continuation
structure.
The major upside liquidity is concentrated around $100–$111. A decisive breakout above this zone would place $129.49 as the next major Fibonacci target.
📊 RSI Momentum
RSI (14): 49.30
RSI has cooled back toward the neutral 50 level after the recent bullish expansion.
The current reading shows that short-term momentum is balanced rather than strongly overbought.
A sustained RSI move back above 50–55 would favor another bullish attempt toward the resistance zone.
A breakdown below 50 would indicate increasing short-term momentum weakness.
🎯 Key Levels
🔴 Major Resistance: $100.02 → $100.59 → $104.64 → $107.07 → $109.91 → $111.04
🟢 Major Support: $97.42 → $96.33 → $92.94 → $92.58 → $91.88
📉 Dynamic EMA Support: $92.58 — 50 EMA | $91.88 — 200 EMA | $87.71 — 100 EMA
🚀 Upside Targets: $111.04 → $129.49 → $150.08 → $170.67
📌 Final Outlook
SOL's broader structure remains constructive after the recent breakout, but price is currently consolidating around the $100 area and below the $100.59–$111 resistance zone.
The $92–$97 area is now the key short-term support region. As long as SOL holds above this zone, the current recovery structure remains active.
The immediate battle is around $100–$111. A confirmed breakout above $111.04 could open the path toward $129.49, followed by $150.08 and potentially $170.67.
However, rejection from resistance followed by a sustained loss of $91.88 would weaken the bullish structure and increase the risk of a deeper retracement toward the $87.71 area.
Bias: 🟢 Recovery structure intact above $91.88. A breakout above $111.04 could open the path toward $129.49, with $150.08 as the next major Fibonacci target.
$SOL
The broader recovery structure remains constructive, but SOL is now consolidating below the $100.59–$104.64 resistance cluster. Bulls need to reclaim this area and break the $107.07–$109.91 zone for the next major upside expansion.
📈 EMA Structure
20 EMA: $99.62
50 EMA: $92.58
100 EMA: $87.71
200 EMA: $91.88
SOL is currently testing the 20 EMA at $99.62.
The recovery above the 50 EMA at $92.58 and 200 EMA at $91.88 keeps the broader recovery structure intact.
A sustained hold above the 20 EMA would strengthen short-term momentum, while losing the $92.58–$91.88 area would weaken the current structure.
📐 Fibonacci Levels
Key Fibonacci levels:
0.236: $100.02
0.382: $129.49
0.5: $150.08
0.618: $170.67
0.786: $199.99
1.0: $237.33
SOL is currently testing the 0.236 Fibonacci region around $100.02.
The next major Fibonacci resistance is $129.49 — 0.382 Fib.
A sustained breakout above the $100–$107 resistance structure could open the path toward the $129.49 region.
🟢 Bullish Scenario
SOL is consolidating after the recent recovery and is currently building acceptance around the $99–$100 area.
Immediate resistance:
$100.02 — 0.236 Fibonacci
$100.59
$102.00
$102.29
$104.64
$107.07
$109.91
$111.04
A clean breakout and sustained close above $109.91–$111.04 would provide stronger confirmation of bullish continuation.
🎯 Target 1: $100.59
🎯 Target 2: $104.64
🎯 Target 3: $107.07
🎯 Target 4: $111.04
🎯 Target 5: $129.49 — 0.382 Fibonacci
🎯 Target 6: $150.08 — 0.5 Fibonacci
A confirmed breakout above the $109.91–$111.04 zone could strengthen the medium-term recovery structure and potentially accelerate SOL toward the $129–$150 region.
🔴 Pullback Scenario
After the recent bullish expansion, a retest of the breakout area would be normal.
Key supports:
$97.42
$96.33
$92.94
$92.58 — 50 EMA
$91.88 — 200 EMA
$87.71 — 100 EMA
The $92–$97 zone is particularly important.
If SOL continues to hold this area during a pullback, the current recovery structure remains valid.
A sustained loss of $91.88 would weaken the bullish setup and could expose the $87.71 support zone.
🧠 Market Structure & Liquidity
SOL has formed a clear recovery structure after sweeping liquidity around the $92–$94 demand region.
The recent move produced a market-structure shift followed by a breakout and higher-low formation.
SOL is now moving through an important:
Breakout → Retest → Consolidation → Continuation
structure.
The major upside liquidity is concentrated around $100–$111. A decisive breakout above this zone would place $129.49 as the next major Fibonacci target.
📊 RSI Momentum
RSI (14): 49.30
RSI has cooled back toward the neutral 50 level after the recent bullish expansion.
The current reading shows that short-term momentum is balanced rather than strongly overbought.
A sustained RSI move back above 50–55 would favor another bullish attempt toward the resistance zone.
A breakdown below 50 would indicate increasing short-term momentum weakness.
🎯 Key Levels
🔴 Major Resistance: $100.02 → $100.59 → $104.64 → $107.07 → $109.91 → $111.04
🟢 Major Support: $97.42 → $96.33 → $92.94 → $92.58 → $91.88
📉 Dynamic EMA Support: $92.58 — 50 EMA | $91.88 — 200 EMA | $87.71 — 100 EMA
🚀 Upside Targets: $111.04 → $129.49 → $150.08 → $170.67
📌 Final Outlook
SOL's broader structure remains constructive after the recent breakout, but price is currently consolidating around the $100 area and below the $100.59–$111 resistance zone.
The $92–$97 area is now the key short-term support region. As long as SOL holds above this zone, the current recovery structure remains active.
The immediate battle is around $100–$111. A confirmed breakout above $111.04 could open the path toward $129.49, followed by $150.08 and potentially $170.67.
However, rejection from resistance followed by a sustained loss of $91.88 would weaken the bullish structure and increase the risk of a deeper retracement toward the $87.71 area.
Bias: 🟢 Recovery structure intact above $91.88. A breakout above $111.04 could open the path toward $129.49, with $150.08 as the next major Fibonacci target.
$SOL
62
·
--
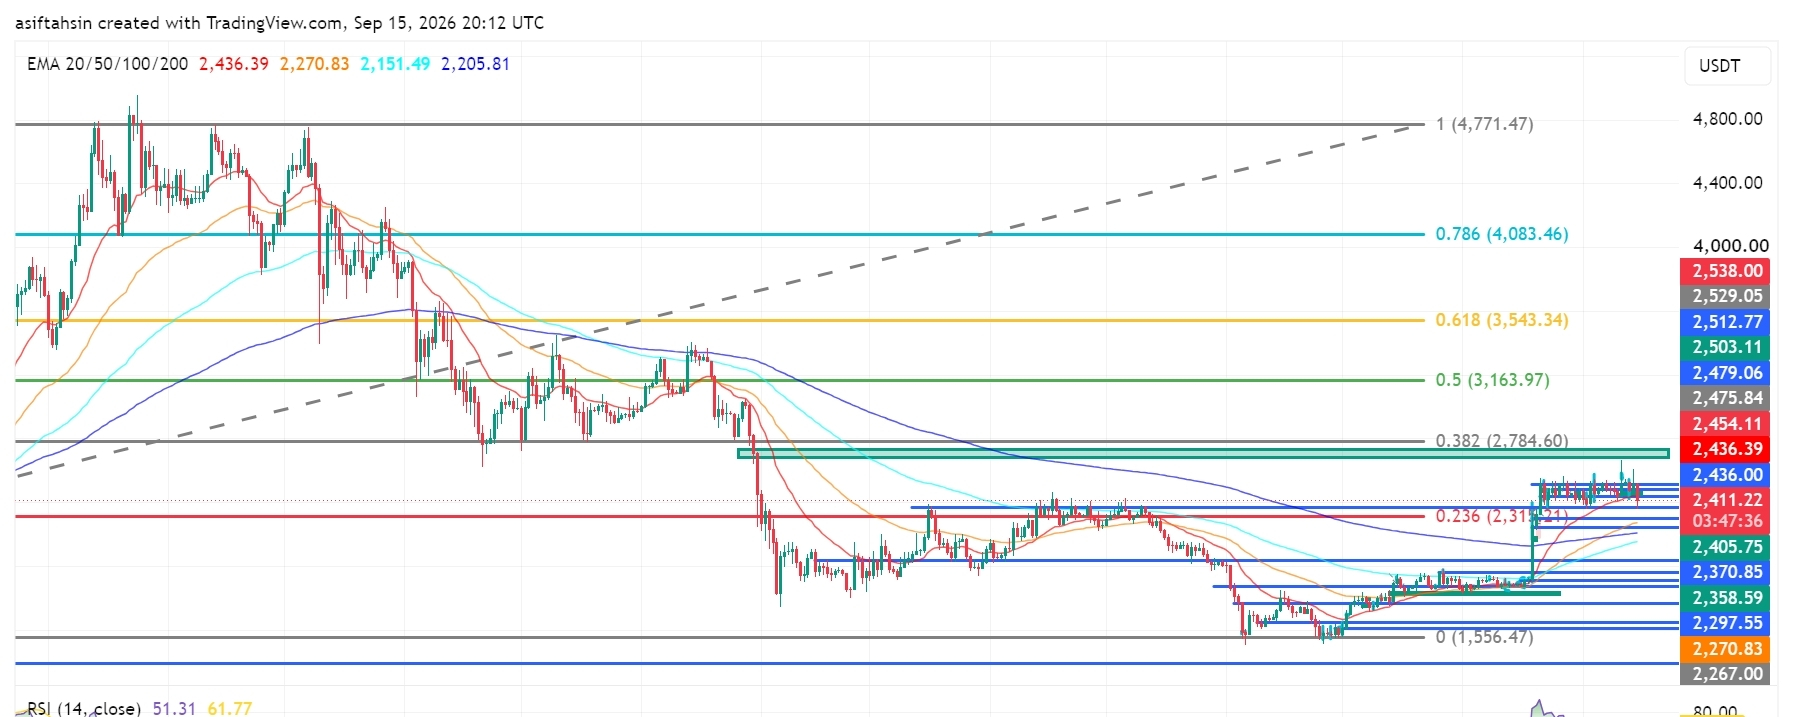
Мақала
ETH Technical Outlook: Ethereum Holds Above $2.4K as Bulls Defend the RecoveryETH is currently trading around $2.41K, holding above the $2.40K–$2.41K support area after the recent recovery from the $2.27K–$2.30K demand zone.
The broader recovery structure remains constructive, but ETH is now consolidating below the $2.436K–$2.454K resistance cluster. Bulls need to reclaim this area and break $2,538 for the next major upside expansion.
📈 EMA Structure
20 EMA: $2,436.39
50 EMA: $2,270.83
100 EMA: $2,151.49
200 EMA: $2,205.81
ETH remains above the 50, 100 and 200 EMAs.
The 20 EMA at $2,436.39 is currently the key short-term resistance. A sustained reclaim above this level would strengthen the bullish recovery structure.
The 200 EMA at $2,205.81 remains an important dynamic support.
📐 Fibonacci Levels
Key Fibonacci levels:
0.236: $2,315.21
0.382: $2,784.60
0.5: $3,163.97
0.618: $3,543.34
0.786: $4,083.46
1.0: $4,771.47
ETH has reclaimed the 0.236 Fibonacci region at $2,315.21, while the next major Fibonacci resistance is $2,784.60 — 0.382 Fib.
A sustained breakout above the current resistance structure could open the path toward the $2.78K region.
🟢 Bullish Scenario
ETH is consolidating after the recent recovery and is currently building acceptance around the $2.4K area.
Immediate resistance:
$2,436.39 — 20 EMA
$2,454.11
$2,475.84
$2,503.11
$2,512.77
$2,529.05
$2,538.00
A clean breakout and sustained close above $2,538 would provide stronger confirmation of bullish continuation.
🎯 Target 1: $2,475.84
🎯 Target 2: $2,503.11
🎯 Target 3: $2,538
🎯 Target 4: $2,784.60 — 0.382 Fibonacci
🎯 Target 5: $3,163.97 — 0.5 Fibonacci
A confirmed breakout above $2,538 could strengthen the medium-term structure and potentially accelerate ETH toward the $2.78K–$3.16K region.
🔴 Pullback Scenario
After the recent recovery, consolidation or a retest of the breakout area would be normal.
Key supports:
$2,405.75
$2,370.85
$2,358.59
$2,297.55
$2,270.83 — 50 EMA
$2,205.81 — 200 EMA
$2,151.49 — 100 EMA
The $2,358–$2,405 zone is particularly important.
If ETH continues to hold this area during a pullback, the current recovery structure remains valid.
A sustained loss of $2,315.21 would weaken the bullish setup and could expose the $2,270–$2,205 support zone.
🧠 Market Structure & Liquidity
ETH has formed a clear recovery structure after sweeping liquidity around the $2.27K–$2.30K demand region.
The recent move produced a market-structure shift followed by a breakout and higher-low formation.
ETH is now moving through an important:
Breakout → Retest → Consolidation → Continuation
structure.
The major upside liquidity remains around $2,436–$2,538. A decisive breakout above this zone would place $2,784.60 as the next major Fibonacci target.
📊 RSI Momentum
RSI (14): 51.31
RSI has cooled toward the neutral 50 level, showing that short-term momentum has weakened after the previous recovery.
A sustained RSI hold above 50–55 would favor another bullish attempt toward the resistance zone.
A breakdown below 50 would indicate increasing short-term momentum weakness.
🎯 Key Levels
🔴 Major Resistance: $2,436.39 → $2,454.11 → $2,475.84 → $2,503.11 → $2,538
🟢 Major Support: $2,405.75 → $2,370.85 → $2,358.59 → $2,297.55
📉 Dynamic EMA Support: $2,270.83 — 50 EMA | $2,205.81 — 200 EMA
🚀 Upside Targets: $2,538 → $2,784.60 → $3,163.97 → $3,543.34
📌 Final Outlook
ETH's broader structure remains constructive after the recent recovery, but price is currently consolidating below the $2.436K–$2.538K resistance zone.
The $2.358K–$2.405K area is now the key short-term support region. As long as ETH holds above this zone, the current recovery structure remains active.
The immediate battle is around $2,436–$2,538. A confirmed breakout above $2,538 could open the path toward $2,784.60, followed by $3,163.97 and potentially $3,543.34.
However, rejection from resistance followed by a sustained loss of $2,315.21 would weaken the bullish structure and increase the risk of a deeper retracement toward the $2,270–$2,205 area.
Bias: 🟢 Bullish above $2,315.21. A breakout above $2,538 could open the path toward $2,784.60, with $3,163.97 as the next major Fibonacci target.
$ETH
{future}(ETHUSDT)
ETH Technical Outlook: Ethereum Holds Above $2.4K as Bulls Defend the Recovery
ETH is currently trading around $2.41K, holding above the $2.40K–$2.41K support area after the recent recovery from the $2.27K–$2.30K demand zone.
The broader recovery structure remains constructive, but ETH is now consolidating below the $2.436K–$2.454K resistance cluster. Bulls need to reclaim this area and break $2,538 for the next major upside expansion.
📈 EMA Structure
20 EMA: $2,436.39
50 EMA: $2,270.83
100 EMA: $2,151.49
200 EMA: $2,205.81
ETH remains above the 50, 100 and 200 EMAs.
The 20 EMA at $2,436.39 is currently the key short-term resistance. A sustained reclaim above this level would strengthen the bullish recovery structure.
The 200 EMA at $2,205.81 remains an important dynamic support.
📐 Fibonacci Levels
Key Fibonacci levels:
0.236: $2,315.21
0.382: $2,784.60
0.5: $3,163.97
0.618: $3,543.34
0.786: $4,083.46
1.0: $4,771.47
ETH has reclaimed the 0.236 Fibonacci region at $2,315.21, while the next major Fibonacci resistance is $2,784.60 — 0.382 Fib.
A sustained breakout above the current resistance structure could open the path toward the $2.78K region.
🟢 Bullish Scenario
ETH is consolidating after the recent recovery and is currently building acceptance around the $2.4K area.
Immediate resistance:
$2,436.39 — 20 EMA
$2,454.11
$2,475.84
$2,503.11
$2,512.77
$2,529.05
$2,538.00
A clean breakout and sustained close above $2,538 would provide stronger confirmation of bullish continuation.
🎯 Target 1: $2,475.84
🎯 Target 2: $2,503.11
🎯 Target 3: $2,538
🎯 Target 4: $2,784.60 — 0.382 Fibonacci
🎯 Target 5: $3,163.97 — 0.5 Fibonacci
A confirmed breakout above $2,538 could strengthen the medium-term structure and potentially accelerate ETH toward the $2.78K–$3.16K region.
🔴 Pullback Scenario
After the recent recovery, consolidation or a retest of the breakout area would be normal.
Key supports:
$2,405.75
$2,370.85
$2,358.59
$2,297.55
$2,270.83 — 50 EMA
$2,205.81 — 200 EMA
$2,151.49 — 100 EMA
The $2,358–$2,405 zone is particularly important.
If ETH continues to hold this area during a pullback, the current recovery structure remains valid.
A sustained loss of $2,315.21 would weaken the bullish setup and could expose the $2,270–$2,205 support zone.
🧠 Market Structure & Liquidity
ETH has formed a clear recovery structure after sweeping liquidity around the $2.27K–$2.30K demand region.
The recent move produced a market-structure shift followed by a breakout and higher-low formation.
ETH is now moving through an important:
Breakout → Retest → Consolidation → Continuation
structure.
The major upside liquidity remains around $2,436–$2,538. A decisive breakout above this zone would place $2,784.60 as the next major Fibonacci target.
📊 RSI Momentum
RSI (14): 51.31
RSI has cooled toward the neutral 50 level, showing that short-term momentum has weakened after the previous recovery.
A sustained RSI hold above 50–55 would favor another bullish attempt toward the resistance zone.
A breakdown below 50 would indicate increasing short-term momentum weakness.
🎯 Key Levels
🔴 Major Resistance: $2,436.39 → $2,454.11 → $2,475.84 → $2,503.11 → $2,538
🟢 Major Support: $2,405.75 → $2,370.85 → $2,358.59 → $2,297.55
📉 Dynamic EMA Support: $2,270.83 — 50 EMA | $2,205.81 — 200 EMA
🚀 Upside Targets: $2,538 → $2,784.60 → $3,163.97 → $3,543.34
📌 Final Outlook
ETH's broader structure remains constructive after the recent recovery, but price is currently consolidating below the $2.436K–$2.538K resistance zone.
The $2.358K–$2.405K area is now the key short-term support region. As long as ETH holds above this zone, the current recovery structure remains active.
The immediate battle is around $2,436–$2,538. A confirmed breakout above $2,538 could open the path toward $2,784.60, followed by $3,163.97 and potentially $3,543.34.
However, rejection from resistance followed by a sustained loss of $2,315.21 would weaken the bullish structure and increase the risk of a deeper retracement toward the $2,270–$2,205 area.
Bias: 🟢 Bullish above $2,315.21. A breakout above $2,538 could open the path toward $2,784.60, with $3,163.97 as the next major Fibonacci target.
$ETH
The broader recovery structure remains constructive, but ETH is now consolidating below the $2.436K–$2.454K resistance cluster. Bulls need to reclaim this area and break $2,538 for the next major upside expansion.
📈 EMA Structure
20 EMA: $2,436.39
50 EMA: $2,270.83
100 EMA: $2,151.49
200 EMA: $2,205.81
ETH remains above the 50, 100 and 200 EMAs.
The 20 EMA at $2,436.39 is currently the key short-term resistance. A sustained reclaim above this level would strengthen the bullish recovery structure.
The 200 EMA at $2,205.81 remains an important dynamic support.
📐 Fibonacci Levels
Key Fibonacci levels:
0.236: $2,315.21
0.382: $2,784.60
0.5: $3,163.97
0.618: $3,543.34
0.786: $4,083.46
1.0: $4,771.47
ETH has reclaimed the 0.236 Fibonacci region at $2,315.21, while the next major Fibonacci resistance is $2,784.60 — 0.382 Fib.
A sustained breakout above the current resistance structure could open the path toward the $2.78K region.
🟢 Bullish Scenario
ETH is consolidating after the recent recovery and is currently building acceptance around the $2.4K area.
Immediate resistance:
$2,436.39 — 20 EMA
$2,454.11
$2,475.84
$2,503.11
$2,512.77
$2,529.05
$2,538.00
A clean breakout and sustained close above $2,538 would provide stronger confirmation of bullish continuation.
🎯 Target 1: $2,475.84
🎯 Target 2: $2,503.11
🎯 Target 3: $2,538
🎯 Target 4: $2,784.60 — 0.382 Fibonacci
🎯 Target 5: $3,163.97 — 0.5 Fibonacci
A confirmed breakout above $2,538 could strengthen the medium-term structure and potentially accelerate ETH toward the $2.78K–$3.16K region.
🔴 Pullback Scenario
After the recent recovery, consolidation or a retest of the breakout area would be normal.
Key supports:
$2,405.75
$2,370.85
$2,358.59
$2,297.55
$2,270.83 — 50 EMA
$2,205.81 — 200 EMA
$2,151.49 — 100 EMA
The $2,358–$2,405 zone is particularly important.
If ETH continues to hold this area during a pullback, the current recovery structure remains valid.
A sustained loss of $2,315.21 would weaken the bullish setup and could expose the $2,270–$2,205 support zone.
🧠 Market Structure & Liquidity
ETH has formed a clear recovery structure after sweeping liquidity around the $2.27K–$2.30K demand region.
The recent move produced a market-structure shift followed by a breakout and higher-low formation.
ETH is now moving through an important:
Breakout → Retest → Consolidation → Continuation
structure.
The major upside liquidity remains around $2,436–$2,538. A decisive breakout above this zone would place $2,784.60 as the next major Fibonacci target.
📊 RSI Momentum
RSI (14): 51.31
RSI has cooled toward the neutral 50 level, showing that short-term momentum has weakened after the previous recovery.
A sustained RSI hold above 50–55 would favor another bullish attempt toward the resistance zone.
A breakdown below 50 would indicate increasing short-term momentum weakness.
🎯 Key Levels
🔴 Major Resistance: $2,436.39 → $2,454.11 → $2,475.84 → $2,503.11 → $2,538
🟢 Major Support: $2,405.75 → $2,370.85 → $2,358.59 → $2,297.55
📉 Dynamic EMA Support: $2,270.83 — 50 EMA | $2,205.81 — 200 EMA
🚀 Upside Targets: $2,538 → $2,784.60 → $3,163.97 → $3,543.34
📌 Final Outlook
ETH's broader structure remains constructive after the recent recovery, but price is currently consolidating below the $2.436K–$2.538K resistance zone.
The $2.358K–$2.405K area is now the key short-term support region. As long as ETH holds above this zone, the current recovery structure remains active.
The immediate battle is around $2,436–$2,538. A confirmed breakout above $2,538 could open the path toward $2,784.60, followed by $3,163.97 and potentially $3,543.34.
However, rejection from resistance followed by a sustained loss of $2,315.21 would weaken the bullish structure and increase the risk of a deeper retracement toward the $2,270–$2,205 area.
Bias: 🟢 Bullish above $2,315.21. A breakout above $2,538 could open the path toward $2,784.60, with $3,163.97 as the next major Fibonacci target.
$ETH
63
·
--
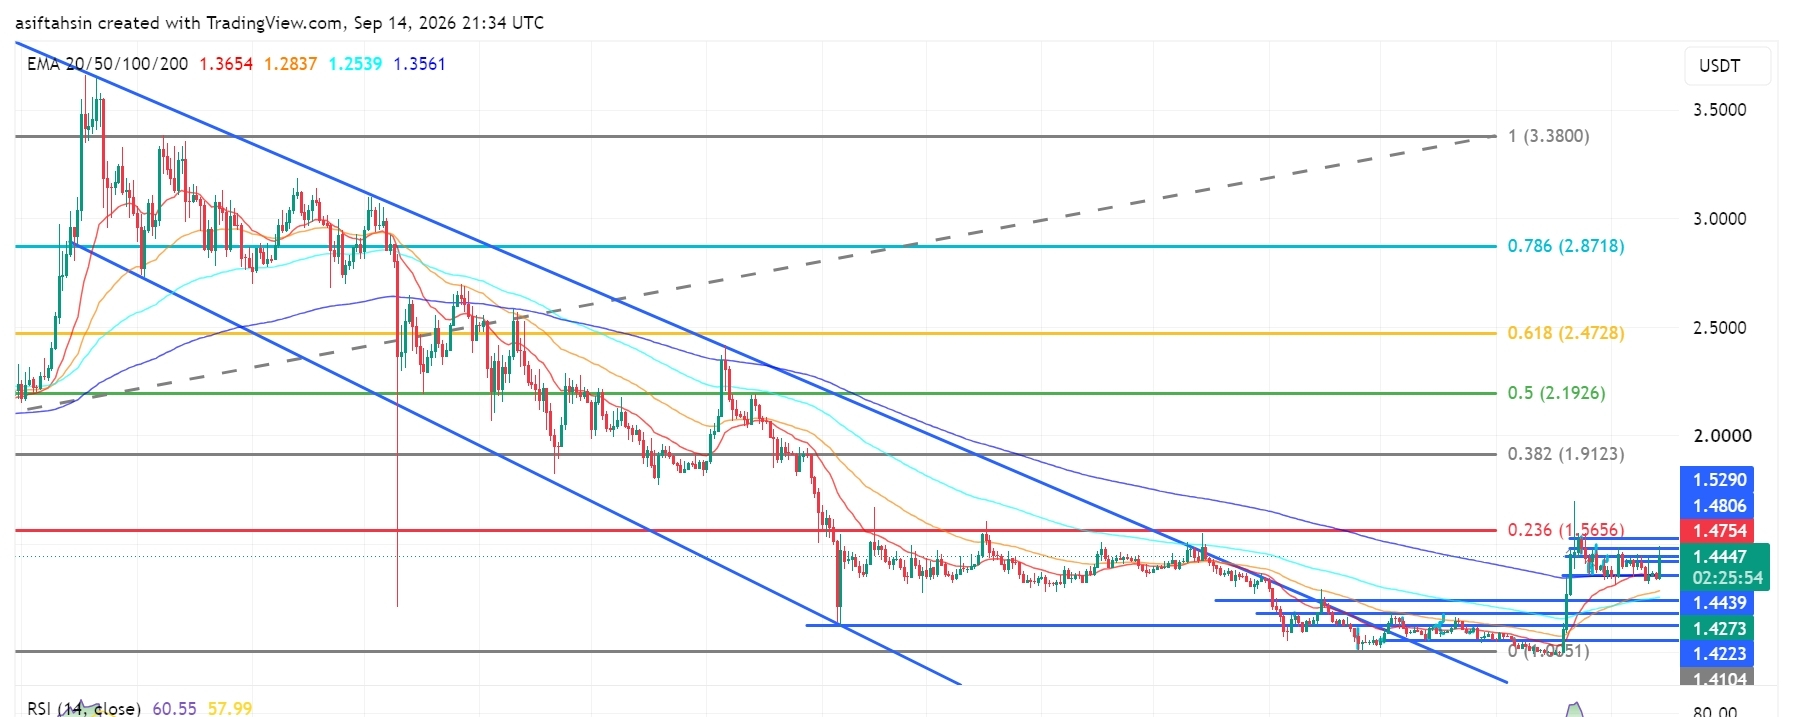
Мақала
XRP Technical Outlook: XRP Holds Above $1.40 as Bulls Target $1.56XRP is currently trading around $1.44, consolidating above the important $1.40 psychological level after a strong recovery from the June–July lows.
The broader structure has improved significantly, with XRP now trading above all four major EMAs. However, price is approaching a key resistance cluster around $1.475–$1.53. Bulls need a clean breakout above this area to open the path toward the $1.5656 Fibonacci resistance.
📈 EMA Structure
20 EMA: $1.3653
50 EMA: $1.2837
100 EMA: $1.2539
200 EMA: $1.3561
XRP is currently above all four major EMAs, keeping the short-to-medium-term recovery structure constructive.
The $1.3653 20 EMA is the key dynamic support. As long as XRP remains above this level, buyers retain control of the current recovery structure.
📐 Fibonacci Levels
0.236: $1.5656
0.382: $1.9123
0.5: $2.1926
0.618: $2.4728
0.786: $2.8718
1.0: $3.3800
The $1.5656 0.236 Fibonacci level is the next major upside objective if XRP successfully clears the current resistance zone.
🟢 Bullish Scenario
XRP is consolidating around $1.44 after reclaiming the $1.40 area.
A clean breakout and sustained close above the $1.475–$1.53 resistance zone could trigger another bullish expansion.
🎯 Target 1: $1.475
🎯 Target 2: $1.480
🎯 Target 3: $1.529
🎯 Target 4: $1.5656
🎯 Target 5: $1.9123
🎯 Target 6: $2.1926
A decisive reclaim of $1.5656 would strengthen the medium-term recovery structure and potentially shift attention toward the $1.91 region.
🔴 Pullback Scenario
If XRP fails to break the $1.475–$1.53 resistance cluster, a short-term pullback could develop.
Key supports:
$1.4439
$1.4273
$1.4223
$1.4104
$1.3653 — 20 EMA
$1.3561 — 200 EMA
The $1.41–$1.36 region is particularly important. A successful retest could provide a base for another attempt at the $1.53 resistance.
A sustained break below the 20 EMA would weaken the current bullish recovery structure.
🧠 Market Structure & Liquidity
XRP's recent structure can be viewed as:
Liquidity Sweep → Base Formation → Higher Lows → Breakout → Reclaim → Consolidation → Potential Continuation
The June–July lows created a significant liquidity sweep, followed by accumulation and a gradual recovery.
XRP has since reclaimed the $1.40 area and pushed above its major moving averages.
The next major structural test is $1.475–$1.53, followed by the $1.5656 Fibonacci resistance.
📊 RSI Momentum
RSI: 60.55
RSI MA: 57.99
RSI remains above 60, indicating that bullish momentum is still present.
The RSI is also above its moving average, supporting the current recovery structure. A sustained move toward 65–70 would provide additional confirmation of strengthening momentum.
🎯 Key Levels
Resistance:
$1.4754 → $1.4806 → $1.5290 → $1.5656 → $1.9123 → $2.1926
Support:
$1.4439 → $1.4273 → $1.4223 → $1.4104 → $1.3653 → $1.3561
📌 Final Outlook
XRP remains in a constructive recovery structure while holding above the $1.40 area and all four major EMAs.
The immediate battle is $1.475–$1.53. A decisive breakout above this zone could push XRP toward $1.5656 → $1.91 → $2.19.
On the downside, $1.3653 is the key dynamic support. As long as XRP holds above this level, the broader recovery structure remains intact.
Bias: 🟢 Bullish above $1.365 | Stronger above $1.53
$XRP
{future}(XRPUSDT)
XRP Technical Outlook: XRP Holds Above $1.40 as Bulls Target $1.56
XRP is currently trading around $1.44, consolidating above the important $1.40 psychological level after a strong recovery from the June–July lows.
The broader structure has improved significantly, with XRP now trading above all four major EMAs. However, price is approaching a key resistance cluster around $1.475–$1.53. Bulls need a clean breakout above this area to open the path toward the $1.5656 Fibonacci resistance.
📈 EMA Structure
20 EMA: $1.3653
50 EMA: $1.2837
100 EMA: $1.2539
200 EMA: $1.3561
XRP is currently above all four major EMAs, keeping the short-to-medium-term recovery structure constructive.
The $1.3653 20 EMA is the key dynamic support. As long as XRP remains above this level, buyers retain control of the current recovery structure.
📐 Fibonacci Levels
0.236: $1.5656
0.382: $1.9123
0.5: $2.1926
0.618: $2.4728
0.786: $2.8718
1.0: $3.3800
The $1.5656 0.236 Fibonacci level is the next major upside objective if XRP successfully clears the current resistance zone.
🟢 Bullish Scenario
XRP is consolidating around $1.44 after reclaiming the $1.40 area.
A clean breakout and sustained close above the $1.475–$1.53 resistance zone could trigger another bullish expansion.
🎯 Target 1: $1.475
🎯 Target 2: $1.480
🎯 Target 3: $1.529
🎯 Target 4: $1.5656
🎯 Target 5: $1.9123
🎯 Target 6: $2.1926
A decisive reclaim of $1.5656 would strengthen the medium-term recovery structure and potentially shift attention toward the $1.91 region.
🔴 Pullback Scenario
If XRP fails to break the $1.475–$1.53 resistance cluster, a short-term pullback could develop.
Key supports:
$1.4439
$1.4273
$1.4223
$1.4104
$1.3653 — 20 EMA
$1.3561 — 200 EMA
The $1.41–$1.36 region is particularly important. A successful retest could provide a base for another attempt at the $1.53 resistance.
A sustained break below the 20 EMA would weaken the current bullish recovery structure.
🧠 Market Structure & Liquidity
XRP's recent structure can be viewed as:
Liquidity Sweep → Base Formation → Higher Lows → Breakout → Reclaim → Consolidation → Potential Continuation
The June–July lows created a significant liquidity sweep, followed by accumulation and a gradual recovery.
XRP has since reclaimed the $1.40 area and pushed above its major moving averages.
The next major structural test is $1.475–$1.53, followed by the $1.5656 Fibonacci resistance.
📊 RSI Momentum
RSI: 60.55
RSI MA: 57.99
RSI remains above 60, indicating that bullish momentum is still present.
The RSI is also above its moving average, supporting the current recovery structure. A sustained move toward 65–70 would provide additional confirmation of strengthening momentum.
🎯 Key Levels
Resistance:
$1.4754 → $1.4806 → $1.5290 → $1.5656 → $1.9123 → $2.1926
Support:
$1.4439 → $1.4273 → $1.4223 → $1.4104 → $1.3653 → $1.3561
📌 Final Outlook
XRP remains in a constructive recovery structure while holding above the $1.40 area and all four major EMAs.
The immediate battle is $1.475–$1.53. A decisive breakout above this zone could push XRP toward $1.5656 → $1.91 → $2.19.
On the downside, $1.3653 is the key dynamic support. As long as XRP holds above this level, the broader recovery structure remains intact.
Bias: 🟢 Bullish above $1.365 | Stronger above $1.53
$XRP
The broader structure has improved significantly, with XRP now trading above all four major EMAs. However, price is approaching a key resistance cluster around $1.475–$1.53. Bulls need a clean breakout above this area to open the path toward the $1.5656 Fibonacci resistance.
📈 EMA Structure
20 EMA: $1.3653
50 EMA: $1.2837
100 EMA: $1.2539
200 EMA: $1.3561
XRP is currently above all four major EMAs, keeping the short-to-medium-term recovery structure constructive.
The $1.3653 20 EMA is the key dynamic support. As long as XRP remains above this level, buyers retain control of the current recovery structure.
📐 Fibonacci Levels
0.236: $1.5656
0.382: $1.9123
0.5: $2.1926
0.618: $2.4728
0.786: $2.8718
1.0: $3.3800
The $1.5656 0.236 Fibonacci level is the next major upside objective if XRP successfully clears the current resistance zone.
🟢 Bullish Scenario
XRP is consolidating around $1.44 after reclaiming the $1.40 area.
A clean breakout and sustained close above the $1.475–$1.53 resistance zone could trigger another bullish expansion.
🎯 Target 1: $1.475
🎯 Target 2: $1.480
🎯 Target 3: $1.529
🎯 Target 4: $1.5656
🎯 Target 5: $1.9123
🎯 Target 6: $2.1926
A decisive reclaim of $1.5656 would strengthen the medium-term recovery structure and potentially shift attention toward the $1.91 region.
🔴 Pullback Scenario
If XRP fails to break the $1.475–$1.53 resistance cluster, a short-term pullback could develop.
Key supports:
$1.4439
$1.4273
$1.4223
$1.4104
$1.3653 — 20 EMA
$1.3561 — 200 EMA
The $1.41–$1.36 region is particularly important. A successful retest could provide a base for another attempt at the $1.53 resistance.
A sustained break below the 20 EMA would weaken the current bullish recovery structure.
🧠 Market Structure & Liquidity
XRP's recent structure can be viewed as:
Liquidity Sweep → Base Formation → Higher Lows → Breakout → Reclaim → Consolidation → Potential Continuation
The June–July lows created a significant liquidity sweep, followed by accumulation and a gradual recovery.
XRP has since reclaimed the $1.40 area and pushed above its major moving averages.
The next major structural test is $1.475–$1.53, followed by the $1.5656 Fibonacci resistance.
📊 RSI Momentum
RSI: 60.55
RSI MA: 57.99
RSI remains above 60, indicating that bullish momentum is still present.
The RSI is also above its moving average, supporting the current recovery structure. A sustained move toward 65–70 would provide additional confirmation of strengthening momentum.
🎯 Key Levels
Resistance:
$1.4754 → $1.4806 → $1.5290 → $1.5656 → $1.9123 → $2.1926
Support:
$1.4439 → $1.4273 → $1.4223 → $1.4104 → $1.3653 → $1.3561
📌 Final Outlook
XRP remains in a constructive recovery structure while holding above the $1.40 area and all four major EMAs.
The immediate battle is $1.475–$1.53. A decisive breakout above this zone could push XRP toward $1.5656 → $1.91 → $2.19.
On the downside, $1.3653 is the key dynamic support. As long as XRP holds above this level, the broader recovery structure remains intact.
Bias: 🟢 Bullish above $1.365 | Stronger above $1.53
$XRP
2
1
1.2k
·
--
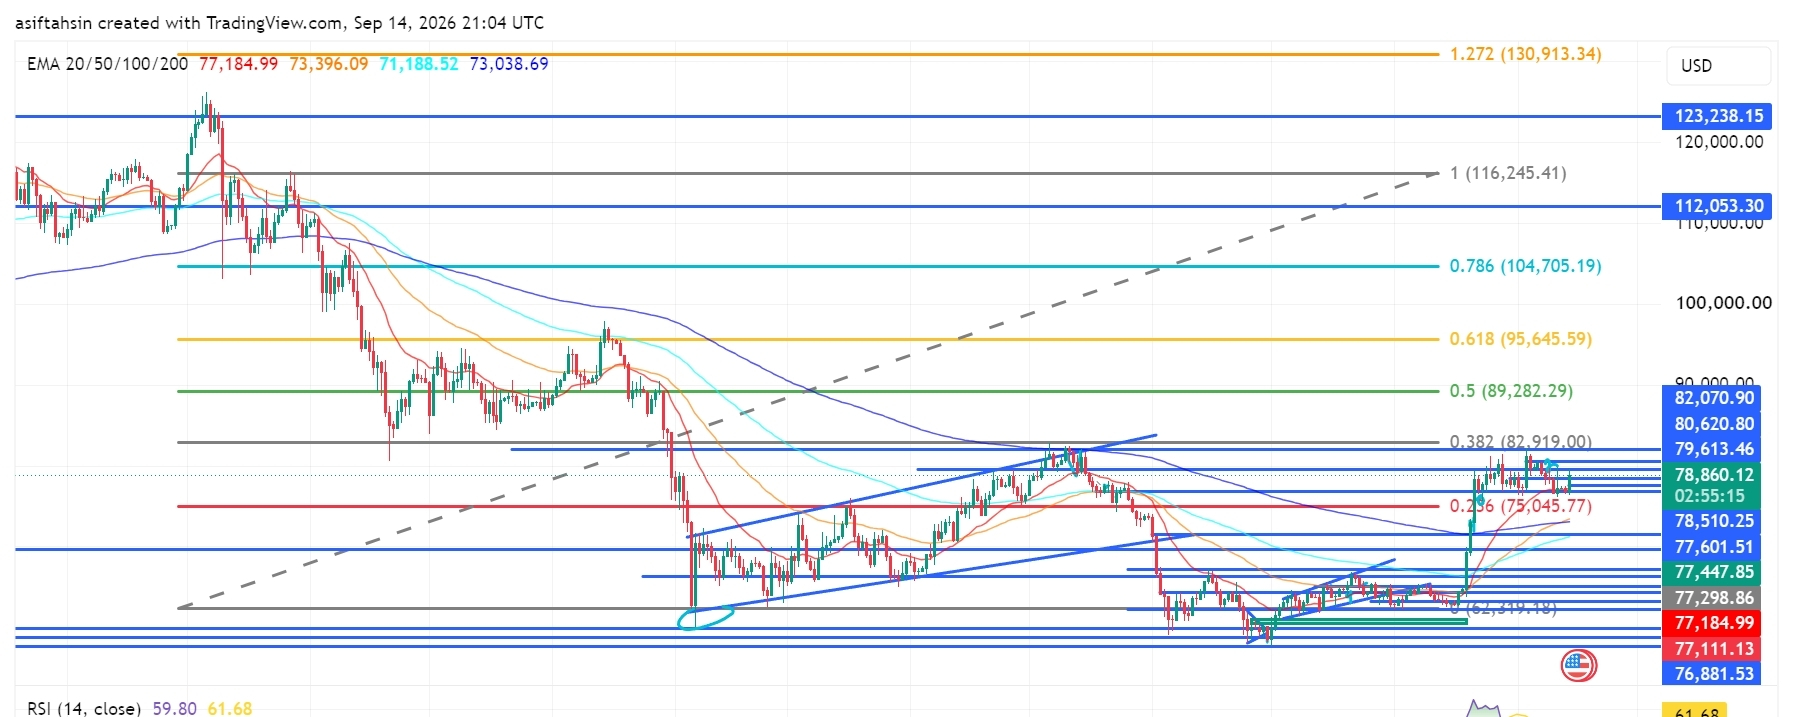
Мақала
Bitcoin (BTC) Technical Outlook: BTC Holds Above $78K as Bulls Target $80K–$83K ResistanceBTC is currently trading around $78,860, consolidating above the $78K level after a strong recovery from the June lows.
The broader structure remains constructive, with BTC trading above all four major EMAs. However, price is now approaching a significant resistance cluster around $79,613–$82,070. Bulls need a clean breakout above this zone to open the path toward the $82,919 Fibonacci resistance and potentially higher levels.
📈 EMA Structure
20 EMA: $77,182.98
50 EMA: $73,395.26
100 EMA: $71,188.10
200 EMA: $73,038.48
BTC remains above all four major EMAs, keeping the medium-term recovery structure bullish.
The $77,182.98 20 EMA is now the key dynamic support. As long as BTC remains above this level, buyers maintain control of the current recovery.
📐 Fibonacci Levels
0.236: $75,045.77
0.382: $82,919.00
0.5: $89,282.29
0.618: $95,645.59
0.786: $104,705.19
1.0: $116,245.41
1.272: $130,913.34
The $82,919 0.382 Fibonacci level is the next major upside objective after the current resistance cluster.
🟢 Bullish Scenario
BTC is consolidating just below the $79,613–$82,070 resistance area.
A clean breakout and sustained close above $82,070 could trigger another bullish expansion.
🎯 Target 1: $82,070
🎯 Target 2: $82,919
🎯 Target 3: $89,282
🎯 Target 4: $95,645
🎯 Target 5: $104,705
🎯 Target 6: $116,245
A decisive reclaim of $82,919 would be an important confirmation that BTC is transitioning into a stronger medium-term recovery phase.
🔴 Pullback Scenario
If BTC fails to break the $79,613–$82,070 resistance cluster, a short-term pullback could develop.
Key supports:
$78,510.25
$77,601.51
$77,447.85
$77,298.86
$77,182.98 — 20 EMA
$77,111.13
$76,881.53
$75,045.77 — 0.236 Fib
The $77,600–$77,180 region is particularly important. A successful retest here could provide a base for another attempt at the $80K+ resistance zone.
A sustained break below the 20 EMA at $77,182.98 would weaken the short-term bullish structure.
🧠 Market Structure & Liquidity
BTC's recent structure can be viewed as:
Liquidity Sweep → Accumulation → Higher Lows → Breakout → Reclaim → Consolidation → Potential Continuation
The June low created a major liquidity event, followed by accumulation and a gradual recovery.
BTC subsequently broke higher from the July–August consolidation structure and reclaimed the $75K area. Price is now consolidating near $79K, with the next major structural test sitting between $79,613 and $82,070.
A breakout above this region would put the $82,919 Fibonacci level into focus.
📊 RSI Momentum
RSI: 59.80
RSI MA: 61.68
RSI remains above 50, confirming that bullish momentum is still present.
However, RSI is currently slightly below its moving average, suggesting that momentum has cooled from the recent upside move. A renewed move above 62–65 would strengthen the continuation setup.
🎯 Key Levels
Resistance:
$79,613.46 → $80,620.80 → $82,070.90 → $82,919 → $89,282.29 → $95,645.59
Support:
$78,510.25 → $77,601.51 → $77,447.85 → $77,298.86 → $77,182.98 → $77,111.13 → $76,881.53 → $75,045.77
📌 Final Outlook
BTC remains in a constructive recovery structure while holding above the $77K area and all four major EMAs.
The immediate battle is $79,613–$82,070. A decisive breakout above this zone could push BTC toward $82,919 → $89,282 → $95,645, while a sustained reclaim of $82,919 could open the path toward the higher Fibonacci levels.
On the downside, $77,182.98 is the key dynamic support. As long as BTC holds above this level, the broader bullish recovery remains intact.
Bias: 🟢 Bullish above $77,183 | Stronger above $82,070
$BTC
{future}(BTCUSDT)
Bitcoin (BTC) Technical Outlook: BTC Holds Above $78K as Bulls Target $80K–$83K Resistance
BTC is currently trading around $78,860, consolidating above the $78K level after a strong recovery from the June lows.
The broader structure remains constructive, with BTC trading above all four major EMAs. However, price is now approaching a significant resistance cluster around $79,613–$82,070. Bulls need a clean breakout above this zone to open the path toward the $82,919 Fibonacci resistance and potentially higher levels.
📈 EMA Structure
20 EMA: $77,182.98
50 EMA: $73,395.26
100 EMA: $71,188.10
200 EMA: $73,038.48
BTC remains above all four major EMAs, keeping the medium-term recovery structure bullish.
The $77,182.98 20 EMA is now the key dynamic support. As long as BTC remains above this level, buyers maintain control of the current recovery.
📐 Fibonacci Levels
0.236: $75,045.77
0.382: $82,919.00
0.5: $89,282.29
0.618: $95,645.59
0.786: $104,705.19
1.0: $116,245.41
1.272: $130,913.34
The $82,919 0.382 Fibonacci level is the next major upside objective after the current resistance cluster.
🟢 Bullish Scenario
BTC is consolidating just below the $79,613–$82,070 resistance area.
A clean breakout and sustained close above $82,070 could trigger another bullish expansion.
🎯 Target 1: $82,070
🎯 Target 2: $82,919
🎯 Target 3: $89,282
🎯 Target 4: $95,645
🎯 Target 5: $104,705
🎯 Target 6: $116,245
A decisive reclaim of $82,919 would be an important confirmation that BTC is transitioning into a stronger medium-term recovery phase.
🔴 Pullback Scenario
If BTC fails to break the $79,613–$82,070 resistance cluster, a short-term pullback could develop.
Key supports:
$78,510.25
$77,601.51
$77,447.85
$77,298.86
$77,182.98 — 20 EMA
$77,111.13
$76,881.53
$75,045.77 — 0.236 Fib
The $77,600–$77,180 region is particularly important. A successful retest here could provide a base for another attempt at the $80K+ resistance zone.
A sustained break below the 20 EMA at $77,182.98 would weaken the short-term bullish structure.
🧠 Market Structure & Liquidity
BTC's recent structure can be viewed as:
Liquidity Sweep → Accumulation → Higher Lows → Breakout → Reclaim → Consolidation → Potential Continuation
The June low created a major liquidity event, followed by accumulation and a gradual recovery.
BTC subsequently broke higher from the July–August consolidation structure and reclaimed the $75K area. Price is now consolidating near $79K, with the next major structural test sitting between $79,613 and $82,070.
A breakout above this region would put the $82,919 Fibonacci level into focus.
📊 RSI Momentum
RSI: 59.80
RSI MA: 61.68
RSI remains above 50, confirming that bullish momentum is still present.
However, RSI is currently slightly below its moving average, suggesting that momentum has cooled from the recent upside move. A renewed move above 62–65 would strengthen the continuation setup.
🎯 Key Levels
Resistance:
$79,613.46 → $80,620.80 → $82,070.90 → $82,919 → $89,282.29 → $95,645.59
Support:
$78,510.25 → $77,601.51 → $77,447.85 → $77,298.86 → $77,182.98 → $77,111.13 → $76,881.53 → $75,045.77
📌 Final Outlook
BTC remains in a constructive recovery structure while holding above the $77K area and all four major EMAs.
The immediate battle is $79,613–$82,070. A decisive breakout above this zone could push BTC toward $82,919 → $89,282 → $95,645, while a sustained reclaim of $82,919 could open the path toward the higher Fibonacci levels.
On the downside, $77,182.98 is the key dynamic support. As long as BTC holds above this level, the broader bullish recovery remains intact.
Bias: 🟢 Bullish above $77,183 | Stronger above $82,070
$BTC
The broader structure remains constructive, with BTC trading above all four major EMAs. However, price is now approaching a significant resistance cluster around $79,613–$82,070. Bulls need a clean breakout above this zone to open the path toward the $82,919 Fibonacci resistance and potentially higher levels.
📈 EMA Structure
20 EMA: $77,182.98
50 EMA: $73,395.26
100 EMA: $71,188.10
200 EMA: $73,038.48
BTC remains above all four major EMAs, keeping the medium-term recovery structure bullish.
The $77,182.98 20 EMA is now the key dynamic support. As long as BTC remains above this level, buyers maintain control of the current recovery.
📐 Fibonacci Levels
0.236: $75,045.77
0.382: $82,919.00
0.5: $89,282.29
0.618: $95,645.59
0.786: $104,705.19
1.0: $116,245.41
1.272: $130,913.34
The $82,919 0.382 Fibonacci level is the next major upside objective after the current resistance cluster.
🟢 Bullish Scenario
BTC is consolidating just below the $79,613–$82,070 resistance area.
A clean breakout and sustained close above $82,070 could trigger another bullish expansion.
🎯 Target 1: $82,070
🎯 Target 2: $82,919
🎯 Target 3: $89,282
🎯 Target 4: $95,645
🎯 Target 5: $104,705
🎯 Target 6: $116,245
A decisive reclaim of $82,919 would be an important confirmation that BTC is transitioning into a stronger medium-term recovery phase.
🔴 Pullback Scenario
If BTC fails to break the $79,613–$82,070 resistance cluster, a short-term pullback could develop.
Key supports:
$78,510.25
$77,601.51
$77,447.85
$77,298.86
$77,182.98 — 20 EMA
$77,111.13
$76,881.53
$75,045.77 — 0.236 Fib
The $77,600–$77,180 region is particularly important. A successful retest here could provide a base for another attempt at the $80K+ resistance zone.
A sustained break below the 20 EMA at $77,182.98 would weaken the short-term bullish structure.
🧠 Market Structure & Liquidity
BTC's recent structure can be viewed as:
Liquidity Sweep → Accumulation → Higher Lows → Breakout → Reclaim → Consolidation → Potential Continuation
The June low created a major liquidity event, followed by accumulation and a gradual recovery.
BTC subsequently broke higher from the July–August consolidation structure and reclaimed the $75K area. Price is now consolidating near $79K, with the next major structural test sitting between $79,613 and $82,070.
A breakout above this region would put the $82,919 Fibonacci level into focus.
📊 RSI Momentum
RSI: 59.80
RSI MA: 61.68
RSI remains above 50, confirming that bullish momentum is still present.
However, RSI is currently slightly below its moving average, suggesting that momentum has cooled from the recent upside move. A renewed move above 62–65 would strengthen the continuation setup.
🎯 Key Levels
Resistance:
$79,613.46 → $80,620.80 → $82,070.90 → $82,919 → $89,282.29 → $95,645.59
Support:
$78,510.25 → $77,601.51 → $77,447.85 → $77,298.86 → $77,182.98 → $77,111.13 → $76,881.53 → $75,045.77
📌 Final Outlook
BTC remains in a constructive recovery structure while holding above the $77K area and all four major EMAs.
The immediate battle is $79,613–$82,070. A decisive breakout above this zone could push BTC toward $82,919 → $89,282 → $95,645, while a sustained reclaim of $82,919 could open the path toward the higher Fibonacci levels.
On the downside, $77,182.98 is the key dynamic support. As long as BTC holds above this level, the broader bullish recovery remains intact.
Bias: 🟢 Bullish above $77,183 | Stronger above $82,070
$BTC
69
·
--
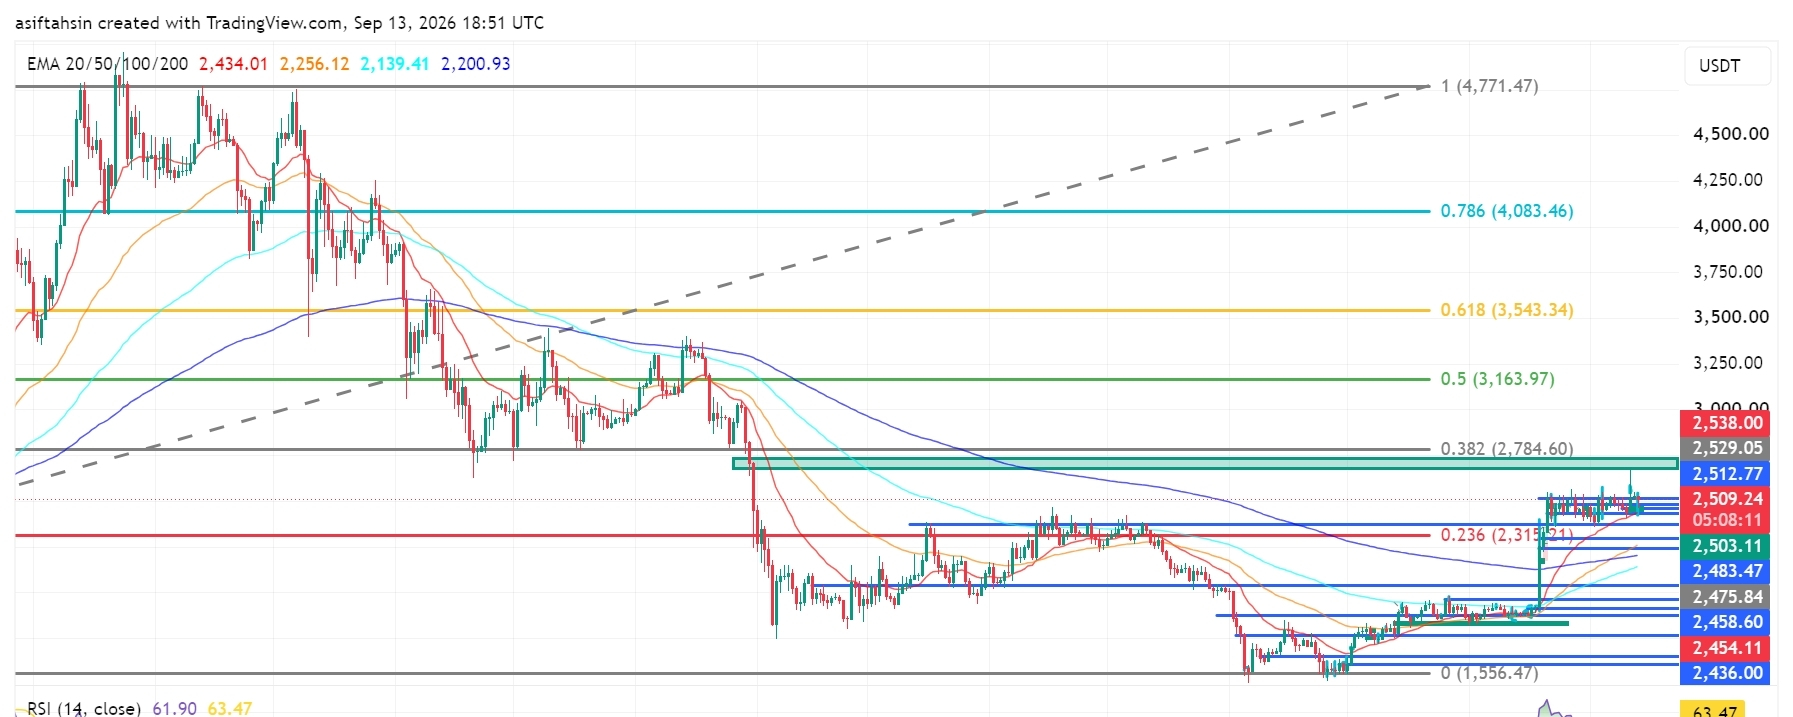
Мақала
Solana (SOL) Technical Outlook: SOL Holds Above $100 as Bulls Target Higher ResistanceSOL is currently trading around $101.25, consolidating above the psychological $100 level after a strong recovery from the June lows.
The broader structure is showing signs of improvement, with SOL now trading above all four major EMAs. However, price is facing a significant resistance cluster around $102.29–$104.64. Bulls need a clean breakout above this zone to open the path toward the $107–$109 area and the $129.49 Fibonacci resistance.
📈 EMA Structure
20 EMA: $99.76
50 EMA: $92.04
100 EMA: $87.25
200 EMA: $91.74
SOL is currently trading above all four major EMAs, supporting the ongoing recovery structure.
The $99.76 20 EMA is the key dynamic support. As long as SOL remains above this level, buyers maintain control of the current short-term structure.
📐 Fibonacci Levels
0.236: $104.00
0.382: $129.49
0.5: $150.08
0.618: $170.67
0.786: $199.99
1.0: $237.33
The $104.00 0.236 Fibonacci level is the immediate major resistance. A successful reclaim could strengthen the path toward $129.49.
🟢 Bullish Scenario
SOL is consolidating around the $100–$102 region after recovering from the recent lows.
A clean breakout and sustained close above $104.64 could trigger another bullish expansion.
🎯 Target 1: $107.07
🎯 Target 2: $109.84
🎯 Target 3: $112.00
🎯 Target 4: $129.49
🎯 Target 5: $150.08
🎯 Target 6: $170.67
A decisive reclaim of $129.49 would be an important confirmation that SOL is transitioning into a stronger medium-term recovery phase.
🔴 Pullback Scenario
If SOL fails to break the $102.29–$104.64 resistance cluster, a short-term pullback could develop.
Key supports:
$100.59
$99.76
$96.33
$92.94
$92.04
$91.74 — 200 EMA
$87.25 — 100 EMA
$86.69
The $100.59–$99.76 region is particularly important. A successful retest here could provide a base for another attempt at the $104 resistance.
A sustained break below the 20 EMA at $99.76 would weaken the short-term bullish structure.
🧠 Market Structure & Liquidity
SOL's recent structure can be viewed as:
Liquidity Sweep → Accumulation → Higher Lows → MSS/BOS → Breakout → Reclaim → Consolidation → Potential Continuation
The June low created a major liquidity event, followed by a prolonged accumulation phase and gradual recovery.
SOL has now reclaimed the $100 psychological level and is holding above the major EMA cluster.
The next major structural test is $102.29–$104.64, followed by the $107–$112 resistance area.
📊 RSI Momentum
RSI: 56.24
RSI MA: 61.94
RSI remains above 50, indicating that bullish momentum is still present.
However, RSI is currently below its moving average, suggesting that momentum has cooled from the recent upside move. A renewed push above 60–62 would strengthen the continuation setup.
🎯 Key Levels
Resistance:
$102.29 → $104.00 → $104.64 → $107.07 → $109.84 → $112.00 → $129.49
Support:
$100.59 → $99.76 → $96.33 → $92.94 → $92.04 → $91.74 → $87.25 → $86.69
📌 Final Outlook
SOL remains in a constructive recovery structure while holding above the $100 area and all major EMAs.
The immediate battle is $102.29–$104.64. A decisive breakout above this zone could push SOL toward $107 → $109.84 → $112, while a sustained move beyond these levels could open the path toward $129.49.
On the downside, $99.76 is the key dynamic support. As long as SOL holds above this level, the broader recovery structure remains intact.
Bias: 🟢 Bullish above $99.76 | Stronger above $104.64
$SOL
{future}(SOLUSDT)
Solana (SOL) Technical Outlook: SOL Holds Above $100 as Bulls Target Higher Resistance
SOL is currently trading around $101.25, consolidating above the psychological $100 level after a strong recovery from the June lows.
The broader structure is showing signs of improvement, with SOL now trading above all four major EMAs. However, price is facing a significant resistance cluster around $102.29–$104.64. Bulls need a clean breakout above this zone to open the path toward the $107–$109 area and the $129.49 Fibonacci resistance.
📈 EMA Structure
20 EMA: $99.76
50 EMA: $92.04
100 EMA: $87.25
200 EMA: $91.74
SOL is currently trading above all four major EMAs, supporting the ongoing recovery structure.
The $99.76 20 EMA is the key dynamic support. As long as SOL remains above this level, buyers maintain control of the current short-term structure.
📐 Fibonacci Levels
0.236: $104.00
0.382: $129.49
0.5: $150.08
0.618: $170.67
0.786: $199.99
1.0: $237.33
The $104.00 0.236 Fibonacci level is the immediate major resistance. A successful reclaim could strengthen the path toward $129.49.
🟢 Bullish Scenario
SOL is consolidating around the $100–$102 region after recovering from the recent lows.
A clean breakout and sustained close above $104.64 could trigger another bullish expansion.
🎯 Target 1: $107.07
🎯 Target 2: $109.84
🎯 Target 3: $112.00
🎯 Target 4: $129.49
🎯 Target 5: $150.08
🎯 Target 6: $170.67
A decisive reclaim of $129.49 would be an important confirmation that SOL is transitioning into a stronger medium-term recovery phase.
🔴 Pullback Scenario
If SOL fails to break the $102.29–$104.64 resistance cluster, a short-term pullback could develop.
Key supports:
$100.59
$99.76
$96.33
$92.94
$92.04
$91.74 — 200 EMA
$87.25 — 100 EMA
$86.69
The $100.59–$99.76 region is particularly important. A successful retest here could provide a base for another attempt at the $104 resistance.
A sustained break below the 20 EMA at $99.76 would weaken the short-term bullish structure.
🧠 Market Structure & Liquidity
SOL's recent structure can be viewed as:
Liquidity Sweep → Accumulation → Higher Lows → MSS/BOS → Breakout → Reclaim → Consolidation → Potential Continuation
The June low created a major liquidity event, followed by a prolonged accumulation phase and gradual recovery.
SOL has now reclaimed the $100 psychological level and is holding above the major EMA cluster.
The next major structural test is $102.29–$104.64, followed by the $107–$112 resistance area.
📊 RSI Momentum
RSI: 56.24
RSI MA: 61.94
RSI remains above 50, indicating that bullish momentum is still present.
However, RSI is currently below its moving average, suggesting that momentum has cooled from the recent upside move. A renewed push above 60–62 would strengthen the continuation setup.
🎯 Key Levels
Resistance:
$102.29 → $104.00 → $104.64 → $107.07 → $109.84 → $112.00 → $129.49
Support:
$100.59 → $99.76 → $96.33 → $92.94 → $92.04 → $91.74 → $87.25 → $86.69
📌 Final Outlook
SOL remains in a constructive recovery structure while holding above the $100 area and all major EMAs.
The immediate battle is $102.29–$104.64. A decisive breakout above this zone could push SOL toward $107 → $109.84 → $112, while a sustained move beyond these levels could open the path toward $129.49.
On the downside, $99.76 is the key dynamic support. As long as SOL holds above this level, the broader recovery structure remains intact.
Bias: 🟢 Bullish above $99.76 | Stronger above $104.64
$SOL
The broader structure is showing signs of improvement, with SOL now trading above all four major EMAs. However, price is facing a significant resistance cluster around $102.29–$104.64. Bulls need a clean breakout above this zone to open the path toward the $107–$109 area and the $129.49 Fibonacci resistance.
📈 EMA Structure
20 EMA: $99.76
50 EMA: $92.04
100 EMA: $87.25
200 EMA: $91.74
SOL is currently trading above all four major EMAs, supporting the ongoing recovery structure.
The $99.76 20 EMA is the key dynamic support. As long as SOL remains above this level, buyers maintain control of the current short-term structure.
📐 Fibonacci Levels
0.236: $104.00
0.382: $129.49
0.5: $150.08
0.618: $170.67
0.786: $199.99
1.0: $237.33
The $104.00 0.236 Fibonacci level is the immediate major resistance. A successful reclaim could strengthen the path toward $129.49.
🟢 Bullish Scenario
SOL is consolidating around the $100–$102 region after recovering from the recent lows.
A clean breakout and sustained close above $104.64 could trigger another bullish expansion.
🎯 Target 1: $107.07
🎯 Target 2: $109.84
🎯 Target 3: $112.00
🎯 Target 4: $129.49
🎯 Target 5: $150.08
🎯 Target 6: $170.67
A decisive reclaim of $129.49 would be an important confirmation that SOL is transitioning into a stronger medium-term recovery phase.
🔴 Pullback Scenario
If SOL fails to break the $102.29–$104.64 resistance cluster, a short-term pullback could develop.
Key supports:
$100.59
$99.76
$96.33
$92.94
$92.04
$91.74 — 200 EMA
$87.25 — 100 EMA
$86.69
The $100.59–$99.76 region is particularly important. A successful retest here could provide a base for another attempt at the $104 resistance.
A sustained break below the 20 EMA at $99.76 would weaken the short-term bullish structure.
🧠 Market Structure & Liquidity
SOL's recent structure can be viewed as:
Liquidity Sweep → Accumulation → Higher Lows → MSS/BOS → Breakout → Reclaim → Consolidation → Potential Continuation
The June low created a major liquidity event, followed by a prolonged accumulation phase and gradual recovery.
SOL has now reclaimed the $100 psychological level and is holding above the major EMA cluster.
The next major structural test is $102.29–$104.64, followed by the $107–$112 resistance area.
📊 RSI Momentum
RSI: 56.24
RSI MA: 61.94
RSI remains above 50, indicating that bullish momentum is still present.
However, RSI is currently below its moving average, suggesting that momentum has cooled from the recent upside move. A renewed push above 60–62 would strengthen the continuation setup.
🎯 Key Levels
Resistance:
$102.29 → $104.00 → $104.64 → $107.07 → $109.84 → $112.00 → $129.49
Support:
$100.59 → $99.76 → $96.33 → $92.94 → $92.04 → $91.74 → $87.25 → $86.69
📌 Final Outlook
SOL remains in a constructive recovery structure while holding above the $100 area and all major EMAs.
The immediate battle is $102.29–$104.64. A decisive breakout above this zone could push SOL toward $107 → $109.84 → $112, while a sustained move beyond these levels could open the path toward $129.49.
On the downside, $99.76 is the key dynamic support. As long as SOL holds above this level, the broader recovery structure remains intact.
Bias: 🟢 Bullish above $99.76 | Stronger above $104.64
$SOL
61
·
--
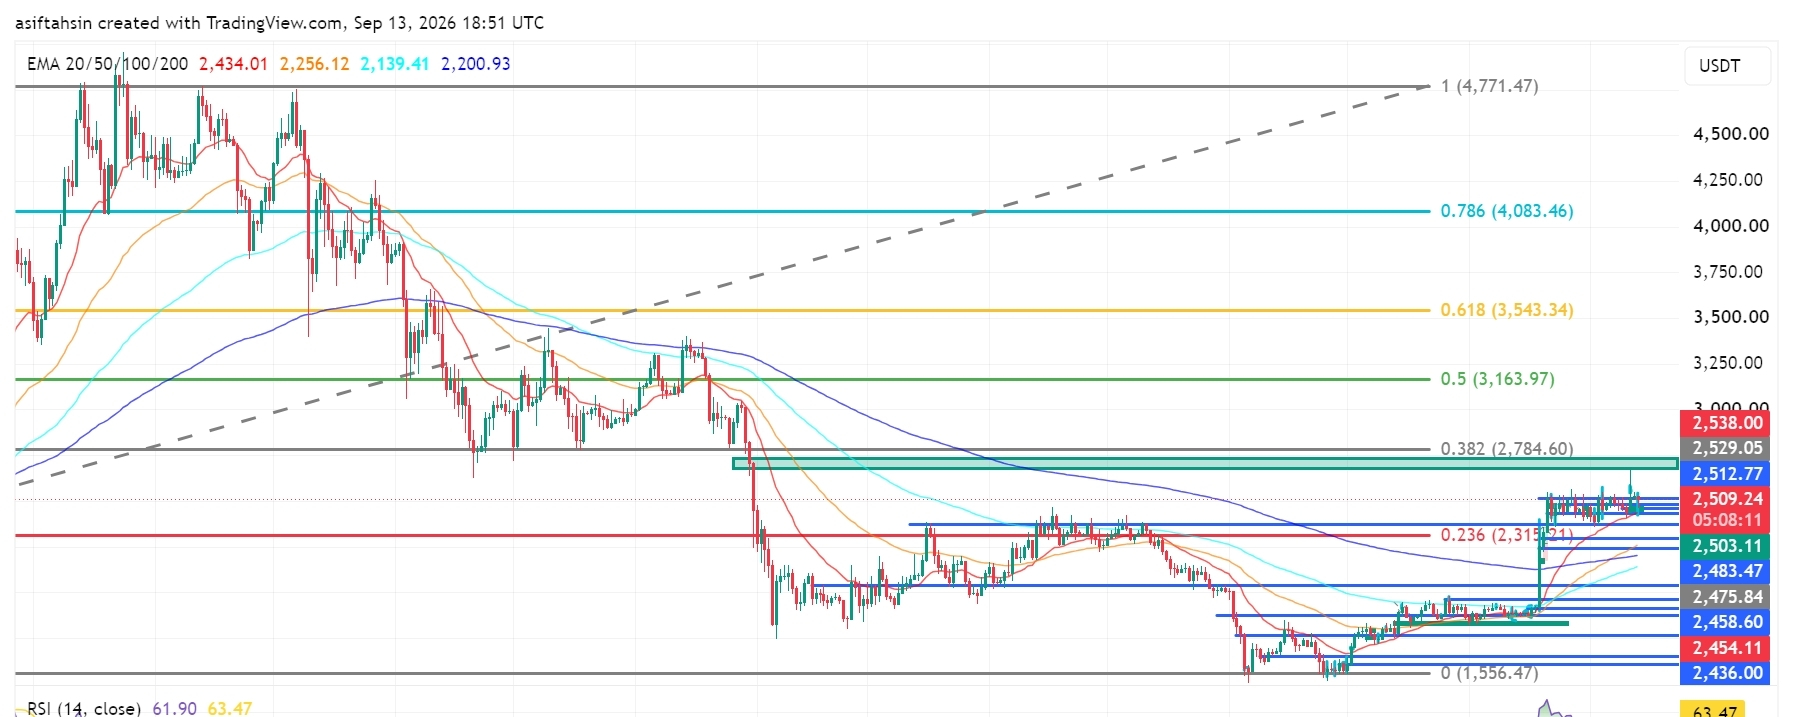
Мақала
ETH Technical Outlook: Ethereum Holds Above $2.5K as Bulls Target Higher ResistanceETH is currently trading around $2,509, consolidating above the psychological $2,500 level after a strong recovery from the June lows.
The broader structure remains constructive, with ETH trading well above all four major EMAs. However, price is now approaching a significant resistance cluster around $2,512–$2,538. Bulls need a clean breakout above this zone to open the path toward the $2,784 Fibonacci resistance.
📈 EMA Structure
20 EMA: $2,434.01
50 EMA: $2,256.12
100 EMA: $2,139.41
200 EMA: $2,200.93
ETH remains comfortably above all four major EMAs, keeping the medium-term recovery structure bullish.
The $2,434 20 EMA is now the key dynamic support. As long as ETH remains above this level, buyers maintain control of the current recovery.
📐 Fibonacci Levels
0.236: $2,315.21
0.382: $2,784.60
0.5: $3,163.97
0.618: $3,543.34
0.786: $4,083.46
1.0: $4,771.47
The $2,784.60 0.382 Fibonacci level is the next major upside objective after the current resistance cluster.
🟢 Bullish Scenario
ETH is consolidating just below the $2,512–$2,538 resistance zone.
A clean breakout and sustained close above $2,538 could trigger another bullish expansion.
🎯 Target 1: $2,550
🎯 Target 2: $2,600
🎯 Target 3: $2,700
🎯 Target 4: $2,784.60
🎯 Target 5: $3,163.97
🎯 Target 6: $3,543.34
A decisive reclaim of $2,784.60 would be an important confirmation that ETH is transitioning into a stronger medium-term recovery phase.
🔴 Pullback Scenario
If ETH fails to break the $2,512–$2,538 resistance cluster, a short-term pullback could develop.
Key supports:
$2,503.11
$2,483.47
$2,475.84
$2,458.60
$2,454.11
$2,434.01 — 20 EMA
$2,315.21 — 0.236 Fib
The $2,454–$2,434 region is particularly important. A successful retest here could provide a base for another attempt at the $2,538 resistance.
A sustained break below the 20 EMA would weaken the short-term bullish structure.
🧠 Market Structure & Liquidity
ETH's recent structure can be viewed as:
Liquidity Sweep → Accumulation → Higher Lows → Breakout → Reclaim → Consolidation → Potential Continuation
The June low around $1,556 created a major liquidity sweep, followed by a strong recovery and a series of higher lows.
ETH has now reclaimed the $2,500 psychological level and is consolidating near the recent highs.
The next major structural test is $2,538, followed by the $2,784.60 Fibonacci resistance.
📊 RSI Momentum
RSI: 61.90
RSI MA: 63.47
RSI remains above 60, confirming that bullish momentum is still present.
However, RSI is slightly below its moving average, suggesting momentum has cooled from the recent spike. A renewed move above 63–65 would strengthen the continuation setup.
🎯 Key Levels
Resistance:
$2,512.77 → $2,529.05 → $2,538 → $2,784.60 → $3,163.97 → $3,543.34
Support:
$2,503.11 → $2,483.47 → $2,475.84 → $2,458.60 → $2,454.11 → $2,434.01 → $2,315.21
📌 Final Outlook
ETH remains in a constructive recovery structure while holding above the $2,500 area and all major EMAs.
The immediate battle is $2,512–$2,538. A decisive breakout above this zone could push ETH toward $2,600 → $2,700 → $2,784.60, while a confirmed break above $2,784 could open the path toward $3,163.97.
On the downside, $2,434 is the key dynamic support. As long as ETH holds above this level, the broader bullish recovery remains intact.
Bias: 🟢 Bullish above $2,434 | Stronger above $2,538
$ETH
{future}(ETHUSDT)
ETH Technical Outlook: Ethereum Holds Above $2.5K as Bulls Target Higher Resistance
ETH is currently trading around $2,509, consolidating above the psychological $2,500 level after a strong recovery from the June lows.
The broader structure remains constructive, with ETH trading well above all four major EMAs. However, price is now approaching a significant resistance cluster around $2,512–$2,538. Bulls need a clean breakout above this zone to open the path toward the $2,784 Fibonacci resistance.
📈 EMA Structure
20 EMA: $2,434.01
50 EMA: $2,256.12
100 EMA: $2,139.41
200 EMA: $2,200.93
ETH remains comfortably above all four major EMAs, keeping the medium-term recovery structure bullish.
The $2,434 20 EMA is now the key dynamic support. As long as ETH remains above this level, buyers maintain control of the current recovery.
📐 Fibonacci Levels
0.236: $2,315.21
0.382: $2,784.60
0.5: $3,163.97
0.618: $3,543.34
0.786: $4,083.46
1.0: $4,771.47
The $2,784.60 0.382 Fibonacci level is the next major upside objective after the current resistance cluster.
🟢 Bullish Scenario
ETH is consolidating just below the $2,512–$2,538 resistance zone.
A clean breakout and sustained close above $2,538 could trigger another bullish expansion.
🎯 Target 1: $2,550
🎯 Target 2: $2,600
🎯 Target 3: $2,700
🎯 Target 4: $2,784.60
🎯 Target 5: $3,163.97
🎯 Target 6: $3,543.34
A decisive reclaim of $2,784.60 would be an important confirmation that ETH is transitioning into a stronger medium-term recovery phase.
🔴 Pullback Scenario
If ETH fails to break the $2,512–$2,538 resistance cluster, a short-term pullback could develop.
Key supports:
$2,503.11
$2,483.47
$2,475.84
$2,458.60
$2,454.11
$2,434.01 — 20 EMA
$2,315.21 — 0.236 Fib
The $2,454–$2,434 region is particularly important. A successful retest here could provide a base for another attempt at the $2,538 resistance.
A sustained break below the 20 EMA would weaken the short-term bullish structure.
🧠 Market Structure & Liquidity
ETH's recent structure can be viewed as:
Liquidity Sweep → Accumulation → Higher Lows → Breakout → Reclaim → Consolidation → Potential Continuation
The June low around $1,556 created a major liquidity sweep, followed by a strong recovery and a series of higher lows.
ETH has now reclaimed the $2,500 psychological level and is consolidating near the recent highs.
The next major structural test is $2,538, followed by the $2,784.60 Fibonacci resistance.
📊 RSI Momentum
RSI: 61.90
RSI MA: 63.47
RSI remains above 60, confirming that bullish momentum is still present.
However, RSI is slightly below its moving average, suggesting momentum has cooled from the recent spike. A renewed move above 63–65 would strengthen the continuation setup.
🎯 Key Levels
Resistance:
$2,512.77 → $2,529.05 → $2,538 → $2,784.60 → $3,163.97 → $3,543.34
Support:
$2,503.11 → $2,483.47 → $2,475.84 → $2,458.60 → $2,454.11 → $2,434.01 → $2,315.21
📌 Final Outlook
ETH remains in a constructive recovery structure while holding above the $2,500 area and all major EMAs.
The immediate battle is $2,512–$2,538. A decisive breakout above this zone could push ETH toward $2,600 → $2,700 → $2,784.60, while a confirmed break above $2,784 could open the path toward $3,163.97.
On the downside, $2,434 is the key dynamic support. As long as ETH holds above this level, the broader bullish recovery remains intact.
Bias: 🟢 Bullish above $2,434 | Stronger above $2,538
$ETH
The broader structure remains constructive, with ETH trading well above all four major EMAs. However, price is now approaching a significant resistance cluster around $2,512–$2,538. Bulls need a clean breakout above this zone to open the path toward the $2,784 Fibonacci resistance.
📈 EMA Structure
20 EMA: $2,434.01
50 EMA: $2,256.12
100 EMA: $2,139.41
200 EMA: $2,200.93
ETH remains comfortably above all four major EMAs, keeping the medium-term recovery structure bullish.
The $2,434 20 EMA is now the key dynamic support. As long as ETH remains above this level, buyers maintain control of the current recovery.
📐 Fibonacci Levels
0.236: $2,315.21
0.382: $2,784.60
0.5: $3,163.97
0.618: $3,543.34
0.786: $4,083.46
1.0: $4,771.47
The $2,784.60 0.382 Fibonacci level is the next major upside objective after the current resistance cluster.
🟢 Bullish Scenario
ETH is consolidating just below the $2,512–$2,538 resistance zone.
A clean breakout and sustained close above $2,538 could trigger another bullish expansion.
🎯 Target 1: $2,550
🎯 Target 2: $2,600
🎯 Target 3: $2,700
🎯 Target 4: $2,784.60
🎯 Target 5: $3,163.97
🎯 Target 6: $3,543.34
A decisive reclaim of $2,784.60 would be an important confirmation that ETH is transitioning into a stronger medium-term recovery phase.
🔴 Pullback Scenario
If ETH fails to break the $2,512–$2,538 resistance cluster, a short-term pullback could develop.
Key supports:
$2,503.11
$2,483.47
$2,475.84
$2,458.60
$2,454.11
$2,434.01 — 20 EMA
$2,315.21 — 0.236 Fib
The $2,454–$2,434 region is particularly important. A successful retest here could provide a base for another attempt at the $2,538 resistance.
A sustained break below the 20 EMA would weaken the short-term bullish structure.
🧠 Market Structure & Liquidity
ETH's recent structure can be viewed as:
Liquidity Sweep → Accumulation → Higher Lows → Breakout → Reclaim → Consolidation → Potential Continuation
The June low around $1,556 created a major liquidity sweep, followed by a strong recovery and a series of higher lows.
ETH has now reclaimed the $2,500 psychological level and is consolidating near the recent highs.
The next major structural test is $2,538, followed by the $2,784.60 Fibonacci resistance.
📊 RSI Momentum
RSI: 61.90
RSI MA: 63.47
RSI remains above 60, confirming that bullish momentum is still present.
However, RSI is slightly below its moving average, suggesting momentum has cooled from the recent spike. A renewed move above 63–65 would strengthen the continuation setup.
🎯 Key Levels
Resistance:
$2,512.77 → $2,529.05 → $2,538 → $2,784.60 → $3,163.97 → $3,543.34
Support:
$2,503.11 → $2,483.47 → $2,475.84 → $2,458.60 → $2,454.11 → $2,434.01 → $2,315.21
📌 Final Outlook
ETH remains in a constructive recovery structure while holding above the $2,500 area and all major EMAs.
The immediate battle is $2,512–$2,538. A decisive breakout above this zone could push ETH toward $2,600 → $2,700 → $2,784.60, while a confirmed break above $2,784 could open the path toward $3,163.97.
On the downside, $2,434 is the key dynamic support. As long as ETH holds above this level, the broader bullish recovery remains intact.
Bias: 🟢 Bullish above $2,434 | Stronger above $2,538
$ETH
83
·
--
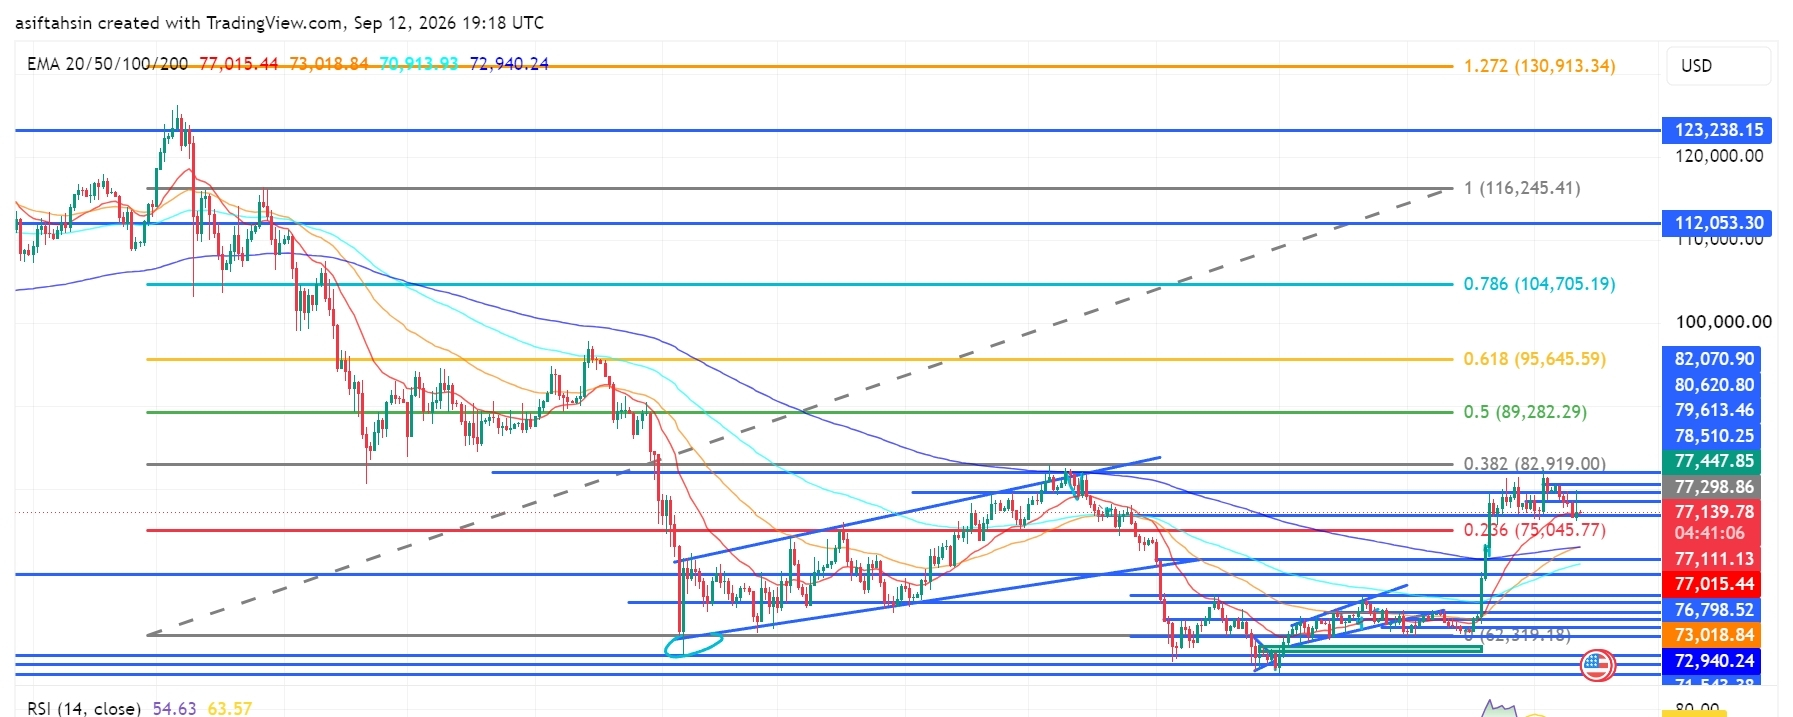
Мақала
BTC Technical Outlook: Bitcoin Holds Above $77K as Bulls Defend the BreakoutBTC is currently trading around $77.1K, consolidating above the $75K–$77K breakout zone after the recent bullish recovery.
The broader structure remains constructive, but BTC is facing strong resistance around $77.4K–$82.9K. Bulls need to reclaim this resistance cluster and break the $82,919 Fibonacci level to unlock the next major upside expansion.
📈 EMA Structure
20 EMA: $77,015.44
50 EMA: $73,018.84
100 EMA: $70,913.93
200 EMA: $72,940.24
BTC is currently holding just above the 20 EMA, while remaining above the 50, 100 and 200 EMAs.
The $77,015 20 EMA is now an important short-term pivot. Holding above it keeps the recent recovery structure intact.
📐 Fibonacci Levels
0.236: $75,045.77
0.382: $82,919.00
0.5: $89,282.29
0.618: $95,645.59
0.786: $104,705.19
1.0: $116,245.41
1.272: $130,913.34
The $82,919 0.382 Fibonacci level is the key breakout point. A sustained move above it would significantly strengthen the medium-term bullish structure.
🟢 Bullish Scenario
BTC is currently consolidating below the $77.4K–$80.6K resistance cluster.
A clean breakout above $78,510–$79,614 could bring the next resistance levels into play.
🎯 Target 1: $80,620
🎯 Target 2: $82,070
🎯 Target 3: $82,919
🎯 Target 4: $89,282
🎯 Target 5: $95,645
🎯 Target 6: $104,705
If BTC successfully reclaims $82,919, the broader recovery could accelerate toward $89K and $95.6K.
🔴 Pullback Scenario
If BTC fails to break the current resistance zone, sellers could push price back toward the EMA and Fibonacci support structure.
Key supports:
$77,015 — 20 EMA
$76,798
$75,045 — 0.236 Fib
$73,018 — 50 EMA
$72,940 — 200 EMA
$71,543
$70,913 — 100 EMA
The $75,045–$77,015 region is particularly important. A successful retest here could provide the foundation for another attempt at $80K+.
However, losing $72,940–$70,913 would significantly weaken the current recovery structure.
🧠 Market Structure & Liquidity
BTC's recent structure can be viewed as:
Liquidity Sweep → Accumulation → Higher Highs/Higher Lows → Breakout → Retest → Consolidation → Potential Continuation
The June/July lows created a major liquidity area, followed by a strong recovery and breakout through the previous consolidation range.
BTC is now attempting to establish acceptance above $77K. The next major structural test is the $82K–$82.9K region, where previous price action and the 0.382 Fibonacci level converge.
📊 RSI Momentum
RSI: 54.63
RSI MA: 63.57
RSI remains above the neutral 50 level, indicating that bullish momentum is still present.
However, RSI is below its moving average, showing that momentum has cooled from the recent spike. A move back above 60–63 would strengthen the continuation setup.
🎯 Key Levels
Resistance:
$77,447 → $78,510 → $79,614 → $80,620 → $82,070 → $82,919 → $89,282 → $95,645
Support:
$77,015 → $76,798 → $75,045 → $73,018 → $72,940 → $71,543 → $70,913
📌 Final Outlook
BTC remains in a constructive recovery structure while holding above the $75K–$77K zone and the major EMA support cluster.
The immediate battle is $77.4K–$80.6K. A decisive breakout above this region could send BTC toward $82K–$82.9K, while a confirmed break above $82,919 would open the path toward $89.2K → $95.6K → $104.7K.
On the downside, $75,045 is the key Fibonacci support, while $72.9K–$70.9K is the major structural defense.
Bias: 🟢 Bullish above $75,045 | Stronger above $82,919
$BTC
{future}(BTCUSDT)
BTC Technical Outlook: Bitcoin Holds Above $77K as Bulls Defend the Breakout
BTC is currently trading around $77.1K, consolidating above the $75K–$77K breakout zone after the recent bullish recovery.
The broader structure remains constructive, but BTC is facing strong resistance around $77.4K–$82.9K. Bulls need to reclaim this resistance cluster and break the $82,919 Fibonacci level to unlock the next major upside expansion.
📈 EMA Structure
20 EMA: $77,015.44
50 EMA: $73,018.84
100 EMA: $70,913.93
200 EMA: $72,940.24
BTC is currently holding just above the 20 EMA, while remaining above the 50, 100 and 200 EMAs.
The $77,015 20 EMA is now an important short-term pivot. Holding above it keeps the recent recovery structure intact.
📐 Fibonacci Levels
0.236: $75,045.77
0.382: $82,919.00
0.5: $89,282.29
0.618: $95,645.59
0.786: $104,705.19
1.0: $116,245.41
1.272: $130,913.34
The $82,919 0.382 Fibonacci level is the key breakout point. A sustained move above it would significantly strengthen the medium-term bullish structure.
🟢 Bullish Scenario
BTC is currently consolidating below the $77.4K–$80.6K resistance cluster.
A clean breakout above $78,510–$79,614 could bring the next resistance levels into play.
🎯 Target 1: $80,620
🎯 Target 2: $82,070
🎯 Target 3: $82,919
🎯 Target 4: $89,282
🎯 Target 5: $95,645
🎯 Target 6: $104,705
If BTC successfully reclaims $82,919, the broader recovery could accelerate toward $89K and $95.6K.
🔴 Pullback Scenario
If BTC fails to break the current resistance zone, sellers could push price back toward the EMA and Fibonacci support structure.
Key supports:
$77,015 — 20 EMA
$76,798
$75,045 — 0.236 Fib
$73,018 — 50 EMA
$72,940 — 200 EMA
$71,543
$70,913 — 100 EMA
The $75,045–$77,015 region is particularly important. A successful retest here could provide the foundation for another attempt at $80K+.
However, losing $72,940–$70,913 would significantly weaken the current recovery structure.
🧠 Market Structure & Liquidity
BTC's recent structure can be viewed as:
Liquidity Sweep → Accumulation → Higher Highs/Higher Lows → Breakout → Retest → Consolidation → Potential Continuation
The June/July lows created a major liquidity area, followed by a strong recovery and breakout through the previous consolidation range.
BTC is now attempting to establish acceptance above $77K. The next major structural test is the $82K–$82.9K region, where previous price action and the 0.382 Fibonacci level converge.
📊 RSI Momentum
RSI: 54.63
RSI MA: 63.57
RSI remains above the neutral 50 level, indicating that bullish momentum is still present.
However, RSI is below its moving average, showing that momentum has cooled from the recent spike. A move back above 60–63 would strengthen the continuation setup.
🎯 Key Levels
Resistance:
$77,447 → $78,510 → $79,614 → $80,620 → $82,070 → $82,919 → $89,282 → $95,645
Support:
$77,015 → $76,798 → $75,045 → $73,018 → $72,940 → $71,543 → $70,913
📌 Final Outlook
BTC remains in a constructive recovery structure while holding above the $75K–$77K zone and the major EMA support cluster.
The immediate battle is $77.4K–$80.6K. A decisive breakout above this region could send BTC toward $82K–$82.9K, while a confirmed break above $82,919 would open the path toward $89.2K → $95.6K → $104.7K.
On the downside, $75,045 is the key Fibonacci support, while $72.9K–$70.9K is the major structural defense.
Bias: 🟢 Bullish above $75,045 | Stronger above $82,919
$BTC
The broader structure remains constructive, but BTC is facing strong resistance around $77.4K–$82.9K. Bulls need to reclaim this resistance cluster and break the $82,919 Fibonacci level to unlock the next major upside expansion.
📈 EMA Structure
20 EMA: $77,015.44
50 EMA: $73,018.84
100 EMA: $70,913.93
200 EMA: $72,940.24
BTC is currently holding just above the 20 EMA, while remaining above the 50, 100 and 200 EMAs.
The $77,015 20 EMA is now an important short-term pivot. Holding above it keeps the recent recovery structure intact.
📐 Fibonacci Levels
0.236: $75,045.77
0.382: $82,919.00
0.5: $89,282.29
0.618: $95,645.59
0.786: $104,705.19
1.0: $116,245.41
1.272: $130,913.34
The $82,919 0.382 Fibonacci level is the key breakout point. A sustained move above it would significantly strengthen the medium-term bullish structure.
🟢 Bullish Scenario
BTC is currently consolidating below the $77.4K–$80.6K resistance cluster.
A clean breakout above $78,510–$79,614 could bring the next resistance levels into play.
🎯 Target 1: $80,620
🎯 Target 2: $82,070
🎯 Target 3: $82,919
🎯 Target 4: $89,282
🎯 Target 5: $95,645
🎯 Target 6: $104,705
If BTC successfully reclaims $82,919, the broader recovery could accelerate toward $89K and $95.6K.
🔴 Pullback Scenario
If BTC fails to break the current resistance zone, sellers could push price back toward the EMA and Fibonacci support structure.
Key supports:
$77,015 — 20 EMA
$76,798
$75,045 — 0.236 Fib
$73,018 — 50 EMA
$72,940 — 200 EMA
$71,543
$70,913 — 100 EMA
The $75,045–$77,015 region is particularly important. A successful retest here could provide the foundation for another attempt at $80K+.
However, losing $72,940–$70,913 would significantly weaken the current recovery structure.
🧠 Market Structure & Liquidity
BTC's recent structure can be viewed as:
Liquidity Sweep → Accumulation → Higher Highs/Higher Lows → Breakout → Retest → Consolidation → Potential Continuation
The June/July lows created a major liquidity area, followed by a strong recovery and breakout through the previous consolidation range.
BTC is now attempting to establish acceptance above $77K. The next major structural test is the $82K–$82.9K region, where previous price action and the 0.382 Fibonacci level converge.
📊 RSI Momentum
RSI: 54.63
RSI MA: 63.57
RSI remains above the neutral 50 level, indicating that bullish momentum is still present.
However, RSI is below its moving average, showing that momentum has cooled from the recent spike. A move back above 60–63 would strengthen the continuation setup.
🎯 Key Levels
Resistance:
$77,447 → $78,510 → $79,614 → $80,620 → $82,070 → $82,919 → $89,282 → $95,645
Support:
$77,015 → $76,798 → $75,045 → $73,018 → $72,940 → $71,543 → $70,913
📌 Final Outlook
BTC remains in a constructive recovery structure while holding above the $75K–$77K zone and the major EMA support cluster.
The immediate battle is $77.4K–$80.6K. A decisive breakout above this region could send BTC toward $82K–$82.9K, while a confirmed break above $82,919 would open the path toward $89.2K → $95.6K → $104.7K.
On the downside, $75,045 is the key Fibonacci support, while $72.9K–$70.9K is the major structural defense.
Bias: 🟢 Bullish above $75,045 | Stronger above $82,919
$BTC
37
Көбірек контент көру үшін кіріңіз
Binance Square платформасында әлемдік криптоқоғамдастыққа қосылыңыз
⚡️ Криптовалюта туралы ең соңғы және пайдалы ақпаратты алыңыз.
💬 Әлемдегі ең ірі криптобиржаның сеніміне ие.
👍 Расталған авторлардың нақты пікірлерін табыңыз.
Электрондық пошта/телефон нөмірі
Трендтегі тақырыптар
AIStocksWhatNext
296,926 рет көрілді
2,715 адам талқылап жатыр
Share & Win Traffic Reward in our Trending Hashtag Campaign
✨Topic: What Other Investment Opportunities Remain as AI Stocks Keep Rising?
👉How to Join:
Publish a short post or article with hashtag #AIStocksWhatNext
Share whether you’re bullish or bearish, and post your AI stock holdings or trade — using the trade widget may improve your eligibility.
You can also strengthen your post by sharing data or charts, and avoiding AI-generated images.
✍️Create content based on the below angles:
- Nvidia says chip sales will double next year, and top AI companies keep hitting record revenue, the compute spend behind it is just as staggering. Is AI demand really taking off? And how long can it last? AI stocks are up across the board. Is this a real breakout, or just a short-term bounce?
- Industry leaders are calling to slow down AI development, while Trump plans to build an “AI Force”, claiming AI could account for 25% of U.S. GDP in the future. Whose side are you on? Will state-level backing be a long-term win for AI stocks?
- Are you buying AI stocks? Share your AI-related trade/holdings with our trade sharing widget.
⏰Campaign Period:
- 2026-09-22 7:00 - 2026-09-24 4:00 UTC
🎁Reward:
- Qualified posts that comply with the above guidelines and contain more than 100 words will be reviewed and may receive a random traffic boost of 500 to 3,000 views. You will receive a notification from your feed secretary if your post is selected.
- Get a chance to have your article featured on Binance Square Official
Need ideas for your post? Visit the topic page #AIStocksWhatNext or the Square Guide on How to Post for Better Reach.
Binance Square Official
·340 лайк
·784.6k рет көрілді
BitcoinBreaksAboveMayHighNears$86K
10,984 рет көрілді
164 адам талқылап жатыр
DogecoinRises15%
33,111 рет көрілді
875 адам талқылап жатыр