

Amsterdam
18 Жариялаулар

Amsterdam
Хабарлау
Пайдаланушыны блоктау
Ашық сауда
Жоғары жиілікті трейдер
8.8 жыл
6 Жазылым
16 Жазылушылар
19 лайк басылған
Жазбалар
Портфолио
·
--
🚀 Binance just made trading smarter, and most people haven't noticed.
Binance unveiled Binance Intelligence, a new AI ecosystem:
🤖 Binance AI gives personalized market insights.
⚡ Binance AI Pro helps build strategies and trading workflows.
It also keeps removing friction: Binance Wallet no longer requires a native gas token, so you can pay fees with USDT.
The trend is clear: AI + easier tools = a lower barrier for everyone.
As a spot trader (no leverage), I'm most interested in how AI can help with discipline and entries, not hype.
👇 Would you trust an AI assistant for your trades? Yes or no?
#Binance #BinanceIntelligence #AI #Crypto #SpotTrading.

74
·
--
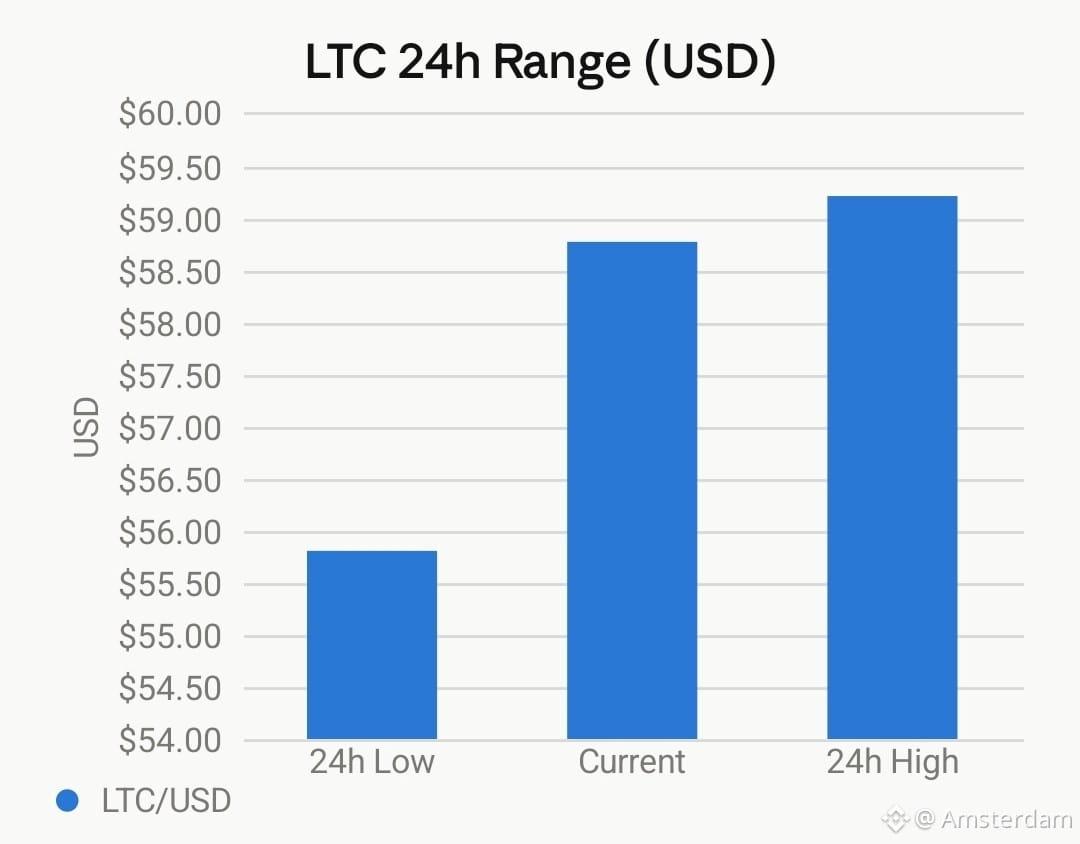
**$LTC is quietly building 🚀**
Litecoin is holding around $60 while the catalysts stack up:
✅ Spot ETF (LTCC) already live
✅ Grayscale ETF conversion pending
✅ Halving ahead, expected mid-2027
✅ FOMC on Oct 27–28 could spark a market move
Patience pays. I'm holding spot, no leverage. 💎
What's your LTC target? 👇
#Litecoin #LTC #Crypto #BinanceSquare
*Not financial advice.*
148
·
--
$SOL is sitting right on key support 👀
Solana is trading around $108, right at a decision point.
📉 Support: $107–108, then ~$105.8
📈 Resistance: $114–116
Hold $107–108 and a bounce is possible. Lose $105.8 and the next real support is far lower, near $96.
My plan as a spot trader: no leverage, small entries near support, clear take profit. Patience beats FOMO. 💪
Buying this dip or waiting lower? 👇
#SOL #Solana #Crypto #SpotTrading #Binance
Not financial advice. Always do your own research.
121
·
--
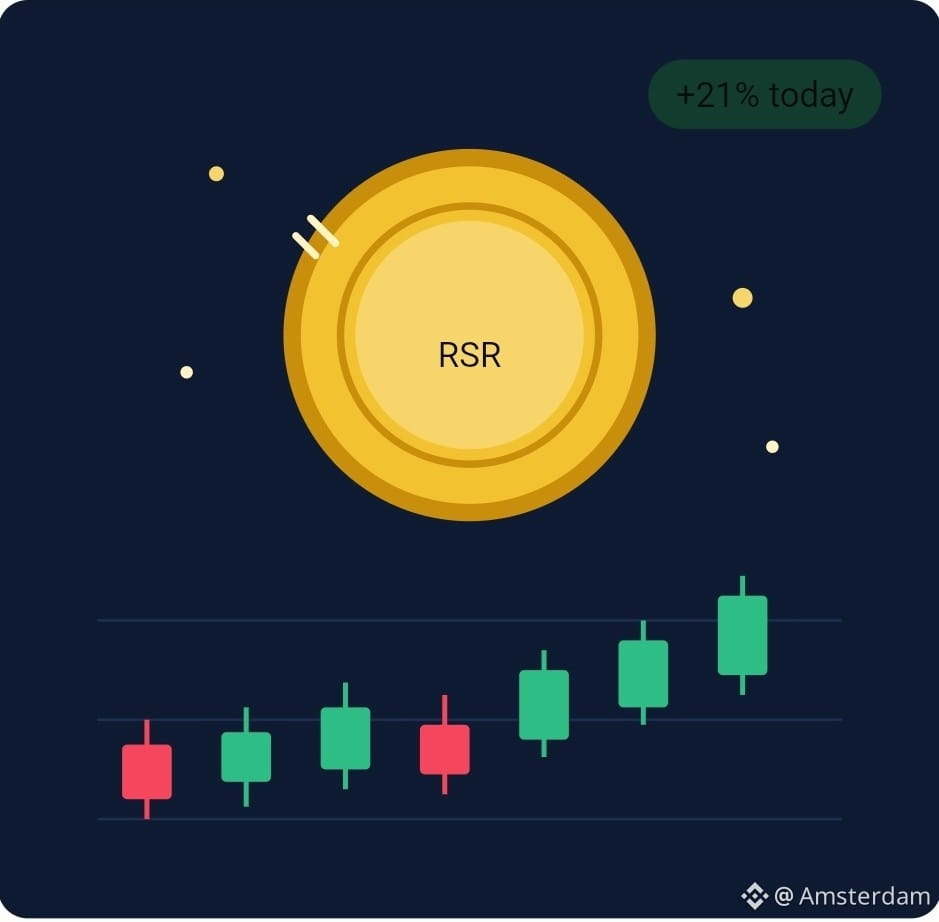
$RSR just ran +50% in hours. Here's what's behind it 👀
South Korean exchanges announced new RSR trading pairs (KRW and USDT), and the market reacted fast. RSR spiked to around $0.0026 before pulling back, and it's still closing the day up over 20%.
This is the classic "Korea listing" effect: fresh liquidity, big retail attention, and a quick pump. But these moves often fade just as fast. The intraday spike and the pullback show how quickly early buyers take profit.
My approach as a spot trader:
✅ No chasing green candles
✅ Wait for the pullback and look for a clean entry
✅ Small size, clear take profit
✅ No leverage
News pumps are opportunities, not guarantees. Patience beats FOMO. 💪
What do you think, is RSR holding this level or fading back? 👇
#RSR #Crypto #Altcoins #SpotTrading #Binance
Not financial advice. Always do your own research.
453
·
--
🚀 Litecoin is building its next chapter
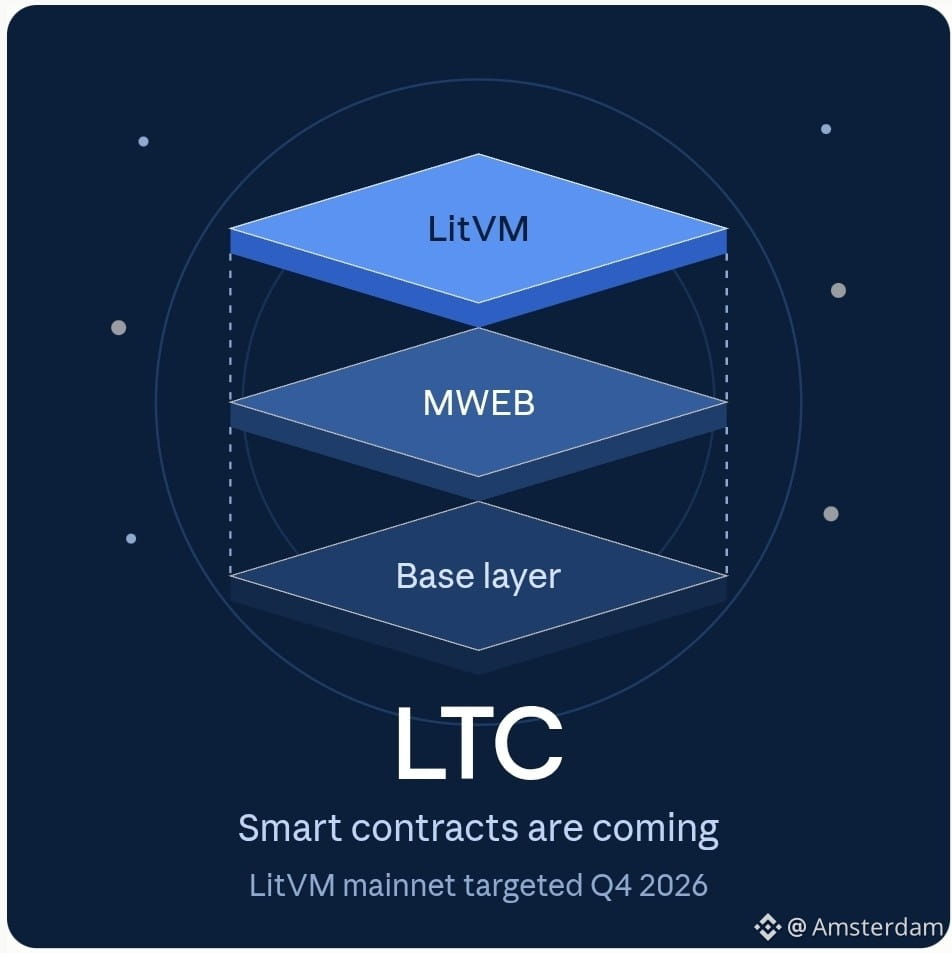
$LTC is more than fast, cheap payments. LitVM brings smart contracts to Litecoin in Q4 2026, after more than 75 million testnet transactions. It is an EVM-compatible layer-2 that adds DeFi and dApps without changing the base chain.
Privacy is growing too: 519,000 LTC is now held in MWEB, Litecoin's optional privacy layer.
The mainnet launch still depends on security audits, but the foundation keeps getting stronger. 💪
Which excites you more, smart contracts or privacy? 👇
#Litecoin #LTC #LitVM #BinanceSquare
Not financial advice. DYOR.
134
·
--
📊 Crypto Update | Oct 12, 2026
$BTC is near $83.4K after touching ~$84.25K early today. $ETH is around $2.54K. Fear & Greed Index: 69 (Greed). [CoinDesk](https://www.coindesk.com/markets/2026/10/12/bitcoin-shrugs-off-etf-outflows-to-trade-above-usd84-000-as-oil-falls) [coingabbar](https://www.coingabbar.com/en/crypto-news-today-bitcoin-top-gainers-losers-trending-coins)
🔥 Spot Bitcoin ETFs lost $681M last week, the biggest weekly outflow since June. [CoinDesk](https://www.coindesk.com/markets/2026/10/12/bitcoin-shrugs-off-etf-outflows-to-trade-above-usd84-000-as-oil-falls)
🔐 Ledger confirmed tampered hardware wallets from a reseller, with losses possibly above $86M. Buy only from official sources. [Substack](https://cryptauxmargaux.substack.com/p/morning-brief-oct-12-2026)
📅 September CPI hits Wednesday, with PPI and Fed Chair Warsh speaking Thursday. Expect volatility. [coingabbar](https://www.coingabbar.com/en/crypto-news-today-bitcoin-top-gainers-losers-trending-coins)
What's your plan going into CPI? 👇
#Bitcoin #Ethereum #CryptoNews #BinanceSquare
Not financial advice. DYOR.
542
·
--
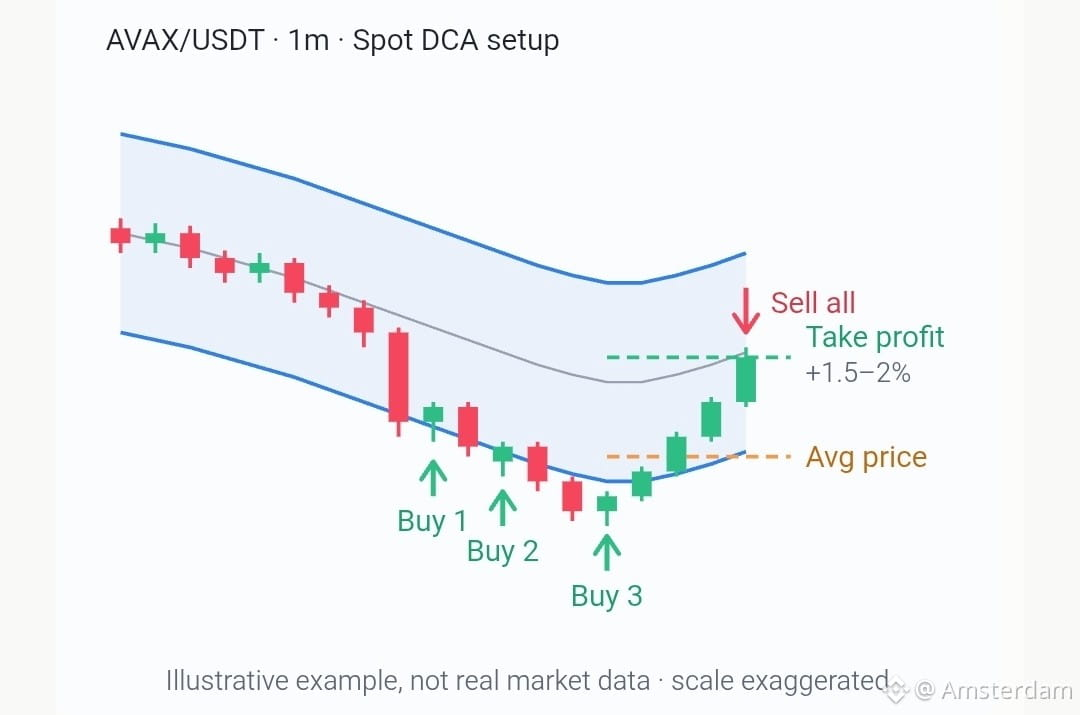
My spot scalping setup: simple rules, fast decisions ⚡
Sharing the approach I personally use. Not financial advice, just my own method. Spot only, no leverage.
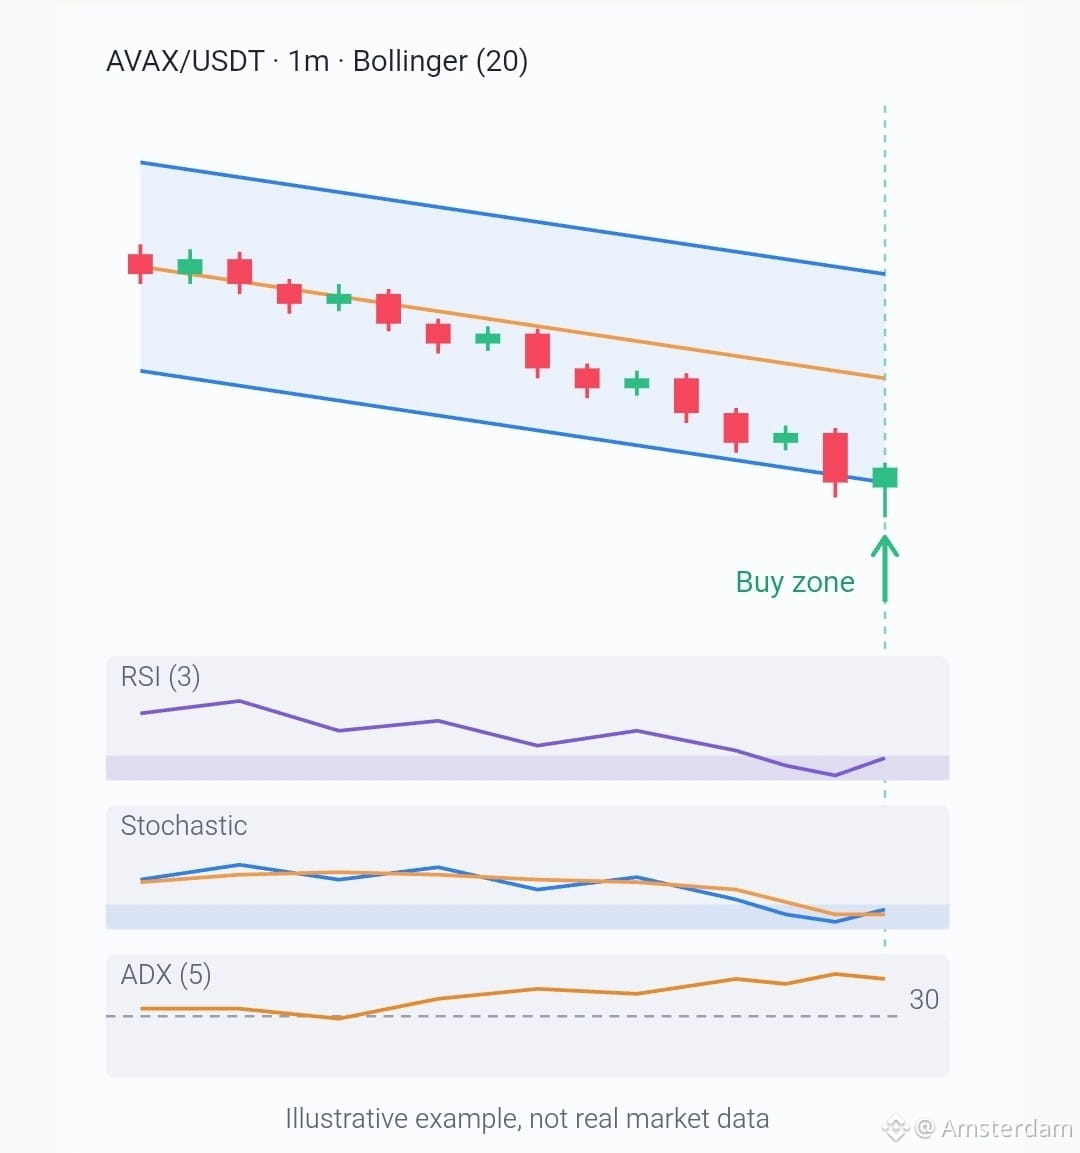
Indicators: Bollinger Bands, RSI (3), ADX (5), Stochastic (default).
Timeframes:
📈 1H: direction
🔍 5M: quick read of the market
🎯 1M: execution
Coin selection: I look for coins with high volatility and fast moves within 24 hours. $AVAX is one of my go-to's, and lately $SOL too.
Entry filters:
✅ ADX above 30. If it's below, I don't trade.
✅ Bollinger Bands at least 2% wide on the 1H chart.
My buy signal:
Candle breaks below the lower band, RSI is oversold and turning up with the Stochastic, and ADX is above 30.
If price keeps dropping:
I scale in again, up to 3 or 4 buys total. Each buy lowers my average price, which makes the exit easier.
Exit:
🎯 Take profit on the whole position at 1.5% to 2%.
Risk management:
🛡️ I cap the number of buys per coin and never go beyond my planned capital. The main risk of this method is a strong, sustained drop, so position sizing matters more than any indicator.
Every trader is different. Test it, adapt it, and always manage your risk.
What's your go-to scalping setup? 👇
#Scalping #TradingStrategy #Bollinger #RSI #AVAX #SOL #BinanceSquare
1
169
·
--
LTC: Quiet strength. Lasting faith. 💙
Since 2011, Litecoin has stood through every storm: the euphoria, the fear, the long silent years. Fast, low-fee, and capped at 84 million coins, it has never stopped doing what it promised.
But what moves me most is its community. They were here at the top, they stayed through the bottom, and they're still here. That kind of loyalty can't be bought.
Real strength doesn't shout. It endures. 💪
How long have you been with Litecoin? 👇
#Litecoin #LTC #Crypto #BinanceSquare

276
·
--
Venezuela
🎂 ¡Comienza Binance 9YA LATAM!
Para participar debes completar retos diarios, donde estaremos entre Binance Square y nuestro grupo de Telegram.
Empezamos con el primer día, el reto de hoy es:
1️⃣Seguir Grupo de Telegram LATAM - https://t.me/+vx4gn2B-IsoxMzA1
2️⃣Seguir Canal de Anuncios de Binance en Español - https://t.me/+yRY_HTkz9Zc0MmJh
3️⃣Comentar este post en Binance Square con tu país + una palabra que describa a la comunidad Binance LATAM.
4️⃣Completa el Binance Survey Día 1 con tu screenshot de participación.
🏆 Prize Pool:
- Si un usuario participa en los 9 retos, podrá compartir el Prize Pool de 1,200 USDT.
- Si un usuario participa en 5 a 8 retos, podrá compartir el Prize Pool de 800 USDT.
¿Buscas extra chances? 👀participa en el topic LATAM9YA del grupo de Telegram con comentarios reales y ayuda a dar la bienvenida a nuevos usuarios.
Cada pieza de la comunidad importa 🧩
Completa la encuesta acá:
[https://app.binance.com/uni-qr/survey/18f032f9326341f4bc35e4170fd6f5e2](https://app.binance.com/uni-qr/survey/18f032f9326341f4bc35e4170fd6f5e2)
Venezuela
🎂 ¡Comienza Binance 9YA LATAM!
Para participar debes completar retos diarios, donde estaremos entre Binance Square y nuestro grupo de Telegram.
Empezamos con el primer día, el reto de hoy es:
1️⃣Seguir Grupo de Telegram LATAM - https://t.me/+vx4gn2B-IsoxMzA1
2️⃣Seguir Canal de Anuncios de Binance en Español - https://t.me/+yRY_HTkz9Zc0MmJh
3️⃣Comentar este post en Binance Square con tu país + una palabra que describa a la comunidad Binance LATAM.
4️⃣Completa el Binance Survey Día 1 con tu screenshot de participación.
🏆 Prize Pool:
- Si un usuario participa en los 9 retos, podrá compartir el Prize Pool de 1,200 USDT.
- Si un usuario participa en 5 a 8 retos, podrá compartir el Prize Pool de 800 USDT.
¿Buscas extra chances? 👀participa en el topic LATAM9YA del grupo de Telegram con comentarios reales y ayuda a dar la bienvenida a nuevos usuarios.
Cada pieza de la comunidad importa 🧩
Completa la encuesta acá:
https://app.binance.com/uni-qr/survey/18f032f9326341f4bc35e4170fd6f5e2
1
76
·
--
#2025withBinance Start your crypto story with the @Binance Year in Review and share your highlights! #2025withBinance.
👉 Sign up with my link and get 100 USD rewards! https://www.binance.com/year-in-review/2025-with-binance?ref=25060916
#2025withBinance Start your crypto story with the @Binance Year in Review and share your highlights! #2025withBinance.
👉 Sign up with my link and get 100 USD rewards! https://www.binance.com/year-in-review/2025-with-binance?ref=25060916
👉 Sign up with my link and get 100 USD rewards! https://www.binance.com/year-in-review/2025-with-binance?ref=25060916
1
1
·
--
The Sri Indicator, also known as the Stochastic Relative Strength Index (SRSI)### Understanding the Stochastic RSI: A Powerful Tool for Traders
The Stochastic Relative Strength Index (Stochastic RSI or SRSI) is a momentum oscillator that merges the principles of the Relative Strength Index (RSI) with the Stochastic Oscillator. This combination results in a highly sensitive indicator that traders can use to spot overbought and oversold conditions, making it an essential tool in any trader’s arsenal.
#### What is the Stochastic RSI?
The Stochastic RSI is designed to offer a more responsive alternative to the traditional RSI by applying the Stochastic Oscillator formula to RSI values. The result is an oscillator that ranges between 0 and 1, offering quicker and potentially more reliable signals.
#### Using the Stochastic RSI in Real Life
Let's look at an example to see how the Stochastic RSI can be used in a trading scenario.
1. Identify Overbought/Oversold Conditions:
- When the SRSI is above 0.8, it indicates an overbought condition, suggesting that a price correction may be imminent.
- When the SRSI is below 0.2, it signals an oversold condition, hinting that a price increase might be on the horizon.
2. Generate Trading Signals:
- Buy Signal: When the SRSI crosses above 0.2, it might be a good time to enter a long position.
- Sell Signal: When the SRSI crosses below 0.8, it could be an opportunity to enter a short position or exit a long position.
3. Confirm Trends:
- The SRSI can also be used to confirm existing trends. A series of high SRSI readings can confirm an upward trend, while a series of low SRSI readings can confirm a downward trend.
4. Divergence:
- Watch for divergence between the SRSI and the price. For example, if the price is making new highs but the SRSI is not, it may indicate a potential reversal.
#### Real-Life Example
Imagine you are analyzing the stock price of XYZ Corp. You calculate the RSI for the past 14 days and then apply the Stochastic formula to get the SRSI. Over the last few days, you observe the following:
- The SRSI drops below 0.2 and starts to rise.
- You decide to enter a long position as the SRSI crosses above 0.2.
- The stock price rises, and you monitor the SRSI for a potential sell signal.
- Once the SRSI crosses above 0.8 and starts to decline, you decide to exit your position, securing your profits.
By using the Stochastic RSI, you were able to identify optimal entry and exit points, improving the timing of your trades and potentially increasing your profitability.
In conclusion, the Stochastic RSI is a powerful and versatile indicator that can enhance your trading strategy. Whether you're a short-term trader looking for quick signals or a long-term investor seeking confirmation of trends, the SRSI offers valuable insights into market dynamics.
The Sri Indicator, also known as the Stochastic Relative Strength Index (SRSI)
### Understanding the Stochastic RSI: A Powerful Tool for Traders
The Stochastic Relative Strength Index (Stochastic RSI or SRSI) is a momentum oscillator that merges the principles of the Relative Strength Index (RSI) with the Stochastic Oscillator. This combination results in a highly sensitive indicator that traders can use to spot overbought and oversold conditions, making it an essential tool in any trader’s arsenal.
#### What is the Stochastic RSI?
The Stochastic RSI is designed to offer a more responsive alternative to the traditional RSI by applying the Stochastic Oscillator formula to RSI values. The result is an oscillator that ranges between 0 and 1, offering quicker and potentially more reliable signals.
#### Using the Stochastic RSI in Real Life
Let's look at an example to see how the Stochastic RSI can be used in a trading scenario.
1. Identify Overbought/Oversold Conditions:
- When the SRSI is above 0.8, it indicates an overbought condition, suggesting that a price correction may be imminent.
- When the SRSI is below 0.2, it signals an oversold condition, hinting that a price increase might be on the horizon.
2. Generate Trading Signals:
- Buy Signal: When the SRSI crosses above 0.2, it might be a good time to enter a long position.
- Sell Signal: When the SRSI crosses below 0.8, it could be an opportunity to enter a short position or exit a long position.
3. Confirm Trends:
- The SRSI can also be used to confirm existing trends. A series of high SRSI readings can confirm an upward trend, while a series of low SRSI readings can confirm a downward trend.
4. Divergence:
- Watch for divergence between the SRSI and the price. For example, if the price is making new highs but the SRSI is not, it may indicate a potential reversal.
#### Real-Life Example
Imagine you are analyzing the stock price of XYZ Corp. You calculate the RSI for the past 14 days and then apply the Stochastic formula to get the SRSI. Over the last few days, you observe the following:
- The SRSI drops below 0.2 and starts to rise.
- You decide to enter a long position as the SRSI crosses above 0.2.
- The stock price rises, and you monitor the SRSI for a potential sell signal.
- Once the SRSI crosses above 0.8 and starts to decline, you decide to exit your position, securing your profits.
By using the Stochastic RSI, you were able to identify optimal entry and exit points, improving the timing of your trades and potentially increasing your profitability.
In conclusion, the Stochastic RSI is a powerful and versatile indicator that can enhance your trading strategy. Whether you're a short-term trader looking for quick signals or a long-term investor seeking confirmation of trends, the SRSI offers valuable insights into market dynamics.
5
132
·
--
** Looking into the Fibonacci and Moving Averages in Trading**
In trading, technical analysis tools like the Fibonacci sequence and moving averages help predict market movements and identify trends. Here’s a quick overview of how they work and their applications.
### Fibonacci Sequence
The Fibonacci sequence is a series of numbers where each number is the sum of the two preceding ones, with key ratios such as 23.6%, 38.2%, 50%, and 61.8%.
**Applications in Trading:**
1. **Retracement Levels:** Identify potential support and resistance levels.
2. **Extensions:** Predict target areas after retracement.
### Moving Averages
A moving average smooths out price data to reveal trends. Common types are Simple Moving Average (SMA) and Exponential Moving Average (EMA).
**Applications in Trading:**
1. **Trend Identification:** Determine market direction.
2. **Support and Resistance:** Act as dynamic levels.
3. **Crossovers:** Signal potential buy (Golden Cross) or sell (Death Cross) opportunities.
### Combining Fibonacci and Moving Averages
Combining these tools can create powerful trading strategies:
- **Confluence Zones:** Strong trade setups when Fibonacci levels align with moving averages.
- **Entry and Exit Points:** Use Fibonacci for entries and moving averages to confirm trends.
### Conclusion
Fibonacci tools and moving averages enhance technical analysis. Combining them provides deeper market insights, helping traders make informed decisions. Use them alongside other analysis techniques and risk management practices for best results.
6
114
Көбірек контент көру үшін кіріңіз
Binance Square платформасында әлемдік криптоқоғамдастыққа қосылыңыз
⚡️ Криптовалюта туралы ең соңғы және пайдалы ақпаратты алыңыз.
💬 Әлемдегі ең ірі криптобиржаның сеніміне ие.
👍 Расталған авторлардың нақты пікірлерін табыңыз.
Электрондық пошта/телефон нөмірі
Трендтегі тақырыптар
FedWatch
16.2M рет көрілді
38,984 адам талқылап жатыр
🚨 BREAKING: THE US ECONOMY JUST BEAT ON EVERYTHING. THAT IS THE WORST NEWS FOR YOUR PORTFOLIO.
GDP Q3: 3.4% vs 3.2% expected. Previous: 2.2%
Jobless claims: 194K vs 199K expected. Previous: 194K
PCE inflation: 3.6%, as expected. Previous: 3.4%
Strong growth. Almost no layoffs. Inflation going UP, not down. The Fed has zero reason to stop, and a December hike is priced near 80%.
In this market, good news for the economy is bad news for stocks and crypto. PCE in line is not a relief, it is 0.2 points higher than last month.
Rate cut hopes are dead. Stay alert.
12 years in these markets. This is what I do.
Follow me and turn notifications on.
#FedWatch
#EarningsSeason
#Nasdaq100FuturesFall0.9%
$BTC
$SOL
$SUI
MARKET STRUCTURE GUIDE
·4 лайк
·1.3k рет көрілді
EarningsSeason
6.3M рет көрілді
31,703 адам талқылап жатыр
USMidtermElections
16,544 рет көрілді
429 адам талқылап жатыр