
CryptoMaven 1
1.1k Жариялаулар

CryptoMaven 1
Хабарлау
Пайдаланушыны блоктау
Passionate about crypto and blockchain
0 Жазылым
107 Жазылушылар
246 лайк басылған
Жазбалар
60 votes could save the CLARITY Act from stalling, but can they save Bitcoin? This is only a procedural vote, not final passage. Republicans have 53 seats, so they need at least 7 Democrats. After Friday's failed attempt and weekend negotiations, the last-minute 635-page rewrite shows just how uncertain the path has become. The bigger issue is timing. With passage odds reportedly falling from 31% to around 18%, CLARITY is no longer a guaranteed bullish catalyst. Even a successful vote could produce only a short-term $BTC bounce. Tomorrow's Fed decision matters more for liquidity. With markets pricing a high probability of a hike, oil above $100 and the 10-year above 5%, macro could easily overwhelm regulatory optimism. We have seen this before, Bitcoin can rally on CLARITY headlines, but if spot demand is weak and the Fed stays hawkish, the move may not last. 60 votes can keep the bill alive. Bitcoin still needs the macro backdrop to cooperate. #BTC Price Analysis#
60 votes could save the CLARITY Act from stalling, but can they save Bitcoin? This is only a procedural vote, not final passage. Republicans have 53 seats, so they need at least 7 Democrats. After Friday's failed attempt and weekend negotiations, the last-minute 635-page rewrite shows just how uncertain the path has become. The bigger issue is timing. With passage odds reportedly falling from 31% to around 18%, CLARITY is no longer a guaranteed bullish catalyst. Even a successful vote could produce only a short-term $BTC bounce. Tomorrow's Fed decision matters more for liquidity. With markets pricing a high probability of a hike, oil above $100 and the 10-year above 5%, macro could easily overwhelm regulatory optimism. We have seen this before, Bitcoin can rally on CLARITY headlines, but if spot demand is weak and the Fed stays hawkish, the move may not last. 60 votes can keep the bill alive. Bitcoin still needs the macro backdrop to cooperate. #BTC Price Analysis#
23
32% odds make this a really interesting setup for #Bitcoin Bernstein says the CLARITY Act is further along than markets expected, meaning a successful vote could be a meaningful upside surprise. Trump’s deal appears to have improved the path forward, potentially giving crypto another strong regulatory catalyst. But can CLARITY beat a Fed hike? That’s is the real question. CLARITY could strengthen the long-term case for $BTC through greater regulatory clarity and institutional confidence, but a hawkish Fed directly hits liquidity and risk appetite. As Bernstein warned, if Tuesday’s CLARITY vote fails and the Fed turns hawkish on Wednesday, Bitcoin could face a major drawdown from both sides. On the flip side, progress on CLARITY could provide the positive catalyst crypto needs. This week could come down to regulation vs. liquidity and Bitcoin may react sharply to whichever side wins.
32% odds make this a really interesting setup for #Bitcoin Bernstein says the CLARITY Act is further along than markets expected, meaning a successful vote could be a meaningful upside surprise. Trump’s deal appears to have improved the path forward, potentially giving crypto another strong regulatory catalyst. But can CLARITY beat a Fed hike? That’s is the real question. CLARITY could strengthen the long-term case for $BTC through greater regulatory clarity and institutional confidence, but a hawkish Fed directly hits liquidity and risk appetite. As Bernstein warned, if Tuesday’s CLARITY vote fails and the Fed turns hawkish on Wednesday, Bitcoin could face a major drawdown from both sides. On the flip side, progress on CLARITY could provide the positive catalyst crypto needs. This week could come down to regulation vs. liquidity and Bitcoin may react sharply to whichever side wins.
61
I think the Wall Street is choosing $ETH over BTC narrative is a little too early, but there is definitely a shift worth paying attention to. BlackRock has been adding exposure to both $BTC and ETH, with nearly $1B in combined purchases highlighted in the latest report. That matters because it shows institutional demand isn’t limited to #Bitcoin anymore. ETH is increasingly being treated as an asset worth building a position in, rather than simply the second choice after BTC. ETH is now trading above $2,600, and that puts the $3,000 level firmly in focus. From here, ETH needs roughly another 15% move to reach it. If institutional accumulation continues and $ETH can maintain momentum above the $2.6K area, breaking $3K becomes a realistic possibility rather than just a headline target. But there is an important distinction, strong ETH buying doesn’t automatically mean institutions are rotating out of BTC. Bitcoin still has the stronger institutional track record and a much larger pool of capital behind it. What I find more interesting is the possibility that the institutional crypto trade is expanding. $BTC can continue to serve as the primary store of value exposure, while ETH offers a different thesis around the Ethereum network, applications and on-chain activity. So I am watching the $3K level closely. If ETH gets there while institutional demand remains strong, that could tell us much more about whether this is simply diversification or the beginning of a bigger re-rating for ETH. #BTC Price Analysis# #Altcoin Season#
I think the Wall Street is choosing $ETH over BTC narrative is a little too early, but there is definitely a shift worth paying attention to. BlackRock has been adding exposure to both $BTC and ETH, with nearly $1B in combined purchases highlighted in the latest report. That matters because it shows institutional demand isn’t limited to #Bitcoin anymore. ETH is increasingly being treated as an asset worth building a position in, rather than simply the second choice after BTC. ETH is now trading above $2,600, and that puts the $3,000 level firmly in focus. From here, ETH needs roughly another 15% move to reach it. If institutional accumulation continues and $ETH can maintain momentum above the $2.6K area, breaking $3K becomes a realistic possibility rather than just a headline target. But there is an important distinction, strong ETH buying doesn’t automatically mean institutions are rotating out of BTC. Bitcoin still has the stronger institutional track record and a much larger pool of capital behind it. What I find more interesting is the possibility that the institutional crypto trade is expanding. $BTC can continue to serve as the primary store of value exposure, while ETH offers a different thesis around the Ethereum network, applications and on-chain activity. So I am watching the $3K level closely. If ETH gets there while institutional demand remains strong, that could tell us much more about whether this is simply diversification or the beginning of a bigger re-rating for ETH. #BTC Price Analysis# #Altcoin Season#
55
A $1T stimulus would definitely get #Bitcoin attention, but I think the bigger question is where that money actually goes. The 2020 comparison is interesting, but Bitcoin’s huge run wasn’t simply caused by people receiving stimulus checks. The broader setup included massive fiscal support, loose monetary policy, abundant liquidity and investors becoming much more willing to take risk. The Cleveland Fed found that the 2020 checks did increase $BTC buying, but the direct effect was surprisingly small relative to the size of the stimulus program. This time, there is another issue which is inflation and government debt. A $1T payout could boost consumer spending and risk assets, but if markets see it as adding too much pressure to inflation or forcing rates to stay higher, that could actually work against Bitcoin in the short term. Bond yields have already moved higher on the new proposal, showing that markets are thinking about the fiscal and inflation risks too. So I wouldn’t say $1T = another 2020. I would say it creates the potential for another liquidity driven $BTC move if the money reaches consumers, spending increases and the broader monetary environment stays supportive. The real catalyst isn’t the headline number. It’s how much liquidity actually reaches markets and whether investors choose to put it into risk assets like BTC. #BTC Price Analysis#
A $1T stimulus would definitely get #Bitcoin attention, but I think the bigger question is where that money actually goes. The 2020 comparison is interesting, but Bitcoin’s huge run wasn’t simply caused by people receiving stimulus checks. The broader setup included massive fiscal support, loose monetary policy, abundant liquidity and investors becoming much more willing to take risk. The Cleveland Fed found that the 2020 checks did increase $BTC buying, but the direct effect was surprisingly small relative to the size of the stimulus program. This time, there is another issue which is inflation and government debt. A $1T payout could boost consumer spending and risk assets, but if markets see it as adding too much pressure to inflation or forcing rates to stay higher, that could actually work against Bitcoin in the short term. Bond yields have already moved higher on the new proposal, showing that markets are thinking about the fiscal and inflation risks too. So I wouldn’t say $1T = another 2020. I would say it creates the potential for another liquidity driven $BTC move if the money reaches consumers, spending increases and the broader monetary environment stays supportive. The real catalyst isn’t the headline number. It’s how much liquidity actually reaches markets and whether investors choose to put it into risk assets like BTC. #BTC Price Analysis#
76
The degen vote probably goes to whoever actually gives bag holders a second chance 😂. But honestly, the political angle is just the hook. The real question is whether the airdrop can create genuine demand beyond the initial hype. If $LAPTOP is rewarding $TRUMP holders, it could bring a lot of attention and liquidity into the new token, especially with degens always looking for the next narrative. But I would still watch the claim rules, token distribution, initial liquidity and what happens once the hype settles. Airdrops can generate crazy attention in the short term, but the market eventually decides whether there’s real value behind the narrative. For me, that is where the interesting part begins. #Altcoin Season#
The degen vote probably goes to whoever actually gives bag holders a second chance 😂. But honestly, the political angle is just the hook. The real question is whether the airdrop can create genuine demand beyond the initial hype. If $LAPTOP is rewarding $TRUMP holders, it could bring a lot of attention and liquidity into the new token, especially with degens always looking for the next narrative. But I would still watch the claim rules, token distribution, initial liquidity and what happens once the hype settles. Airdrops can generate crazy attention in the short term, but the market eventually decides whether there’s real value behind the narrative. For me, that is where the interesting part begins. #Altcoin Season#
51
I think it’s still too early to call this either a white-hat rescue or hackers holding $BTC hostage. Around 4,000 BTC, worth roughly $320M, was withdrawn from Liquid’s federation wallet. Reports suggest the federation keys weren’t directly compromised. Instead, the attackers may have exploited a vulnerability in the underlying Elements software to create unbacked L-BTC and redeem it for real BTC. The “white hat” claim is interesting because the actors reportedly left an onchain message identifying themselves as white hats and have indicated they intend to return most of the BTC after the vulnerability is fixed. That said, taking control of $320M is a very aggressive way to expose a vulnerability. A legitimate white-hat operation would normally minimize the amount taken and coordinate with the affected team. So I would reserve judgment for now. If they return the funds after the patch, the white hat argument becomes much stronger. If they start moving, laundering or cashing out the $BTC , then the white hat story becomes very difficult to defend. The bigger point is that Bitcoin itself wasn’t hacked. The apparent vulnerability was at the Liquid/Elements layer built around Bitcoin. This could end up being less about Bitcoin’s security and more about the risks of trusting infrastructure built on top of it. For now, the blockchain movements and what happens to those 4,000 BTC will tell us far more than the label white hat.
I think it’s still too early to call this either a white-hat rescue or hackers holding $BTC hostage. Around 4,000 BTC, worth roughly $320M, was withdrawn from Liquid’s federation wallet. Reports suggest the federation keys weren’t directly compromised. Instead, the attackers may have exploited a vulnerability in the underlying Elements software to create unbacked L-BTC and redeem it for real BTC. The “white hat” claim is interesting because the actors reportedly left an onchain message identifying themselves as white hats and have indicated they intend to return most of the BTC after the vulnerability is fixed. That said, taking control of $320M is a very aggressive way to expose a vulnerability. A legitimate white-hat operation would normally minimize the amount taken and coordinate with the affected team. So I would reserve judgment for now. If they return the funds after the patch, the white hat argument becomes much stronger. If they start moving, laundering or cashing out the $BTC , then the white hat story becomes very difficult to defend. The bigger point is that Bitcoin itself wasn’t hacked. The apparent vulnerability was at the Liquid/Elements layer built around Bitcoin. This could end up being less about Bitcoin’s security and more about the risks of trusting infrastructure built on top of it. For now, the blockchain movements and what happens to those 4,000 BTC will tell us far more than the label white hat.

53
$ZEC and XRP breaking out is definitely interesting, but I still wouldn’t call this a confirmed altseason. There is also an important macro factor behind today’s BTC pullback. The U.S. August jobs report came in much stronger than expected, with 162K jobs added versus roughly 56K expected. That pushed Treasury yields higher and revived expectations of a possible Fed rate hike in September. $BTC reacted almost immediately, dropping back below $80K after briefly pushing above $82K. That matters because crypto is still highly sensitive to liquidity and interest rate expectations. The interesting part, though, is that while BTC is pulling back on the macro shock, some alts like ZEC and XRP are showing relative strength. That could mean one of two things: 1. It’s simply isolated strength in a few narratives. 2. Capital is starting to rotate into alts while $BTC consolidates. For me, the second scenario becomes much more convincing if we see BTC hold its higher range while BTC dominance starts falling and strength broadens across #ETH , large caps and mid caps. I would be watching: • BTC holding key support after today’s jobs-driven volatility • BTC dominance trending lower • ETH gaining against BTC • TOTAL2/TOTAL3 continuing to expand • Increasing volume across multiple altcoin sectors • More alts outperforming BTC, rather than just ZEC/XRP So I wouldn’t chase the “ALTSEASON IS HERE” narrative yet. But I also wouldn’t ignore what is happening. If BTC can absorb today’s macro shock and capital continues rotating into alts, $ZEC and XRP could end up being early signals of a broader move. For now: early rotation, not confirmed altseason. The next major macro test is inflation data, which could have a big influence on the Fed’s September decision #BTC Price Analysis# #Altcoin Season#
$ZEC and XRP breaking out is definitely interesting, but I still wouldn’t call this a confirmed altseason. There is also an important macro factor behind today’s BTC pullback. The U.S. August jobs report came in much stronger than expected, with 162K jobs added versus roughly 56K expected. That pushed Treasury yields higher and revived expectations of a possible Fed rate hike in September. $BTC reacted almost immediately, dropping back below $80K after briefly pushing above $82K. That matters because crypto is still highly sensitive to liquidity and interest rate expectations. The interesting part, though, is that while BTC is pulling back on the macro shock, some alts like ZEC and XRP are showing relative strength. That could mean one of two things: 1. It’s simply isolated strength in a few narratives. 2. Capital is starting to rotate into alts while $BTC consolidates. For me, the second scenario becomes much more convincing if we see BTC hold its higher range while BTC dominance starts falling and strength broadens across #ETH , large caps and mid caps. I would be watching: • BTC holding key support after today’s jobs-driven volatility • BTC dominance trending lower • ETH gaining against BTC • TOTAL2/TOTAL3 continuing to expand • Increasing volume across multiple altcoin sectors • More alts outperforming BTC, rather than just ZEC/XRP So I wouldn’t chase the “ALTSEASON IS HERE” narrative yet. But I also wouldn’t ignore what is happening. If BTC can absorb today’s macro shock and capital continues rotating into alts, $ZEC and XRP could end up being early signals of a broader move. For now: early rotation, not confirmed altseason. The next major macro test is inflation data, which could have a big influence on the Fed’s September decision #BTC Price Analysis# #Altcoin Season#

73
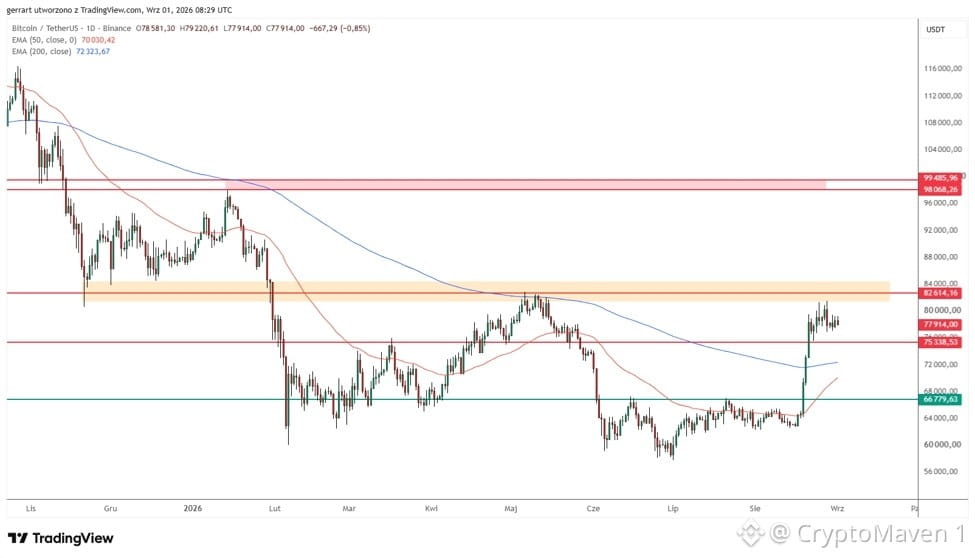
$100K $BTC is definitely back on the table, but the golden cross alone isn’t enough to make that call. The bullish case is pretty straightforward, #BTC is currently around $78K after a roughly 30% rebound, and it has reclaimed the 21-, 55-, 100- and 200-day moving averages. Bitcoin is also approaching a 50-day/200-day golden cross, which historically has sometimes appeared near the beginning of major long-term rallies. And yes, the historical numbers are impressive. Two notable golden crosses were followed by roughly +306% and +312% gains over the following year. But that is where we need to be careful. Bitcoin has produced 12 golden crosses since 2012 and only three remained intact for a full year. Across nine crosses with measurable three month returns, the average was about +24.9% bullish, but nowhere near a guaranteed 300% move. So the more logical way to look at it is this: Golden cross = confirmation of improving momentum, not a prediction of a 300% rally. For the $100K thesis to become much stronger, $BTC still needs to deal with the important resistance around $82.8K. A convincing breakout there could open the door toward $90K, followed by the ~$97.9K 2026 high. Clearing that previous high would make a move to $100K much more technically credible. On the other hand, if BTC fails at those resistance levels and loses the recent support zones around $75.7K and $71.8K, the bullish setup becomes considerably weaker. So, is $100K back on the table? Absolutely. Is the golden cross proof that we are going there? No. The real signal to watch now is whether Bitcoin can turn this recent recovery into a sustained uptrend and break through $82.8K and eventually its 2026 high. If it does, the $100K target starts looking less like a headline and more like a realistic technical objective. This version also avoids the misleading idea that “+300% twice” means another +300% move is likely. #BTC Price Analysis#
$100K $BTC is definitely back on the table, but the golden cross alone isn’t enough to make that call. The bullish case is pretty straightforward, #BTC is currently around $78K after a roughly 30% rebound, and it has reclaimed the 21-, 55-, 100- and 200-day moving averages. Bitcoin is also approaching a 50-day/200-day golden cross, which historically has sometimes appeared near the beginning of major long-term rallies. And yes, the historical numbers are impressive. Two notable golden crosses were followed by roughly +306% and +312% gains over the following year. But that is where we need to be careful. Bitcoin has produced 12 golden crosses since 2012 and only three remained intact for a full year. Across nine crosses with measurable three month returns, the average was about +24.9% bullish, but nowhere near a guaranteed 300% move. So the more logical way to look at it is this: Golden cross = confirmation of improving momentum, not a prediction of a 300% rally. For the $100K thesis to become much stronger, $BTC still needs to deal with the important resistance around $82.8K. A convincing breakout there could open the door toward $90K, followed by the ~$97.9K 2026 high. Clearing that previous high would make a move to $100K much more technically credible. On the other hand, if BTC fails at those resistance levels and loses the recent support zones around $75.7K and $71.8K, the bullish setup becomes considerably weaker. So, is $100K back on the table? Absolutely. Is the golden cross proof that we are going there? No. The real signal to watch now is whether Bitcoin can turn this recent recovery into a sustained uptrend and break through $82.8K and eventually its 2026 high. If it does, the $100K target starts looking less like a headline and more like a realistic technical objective. This version also avoids the misleading idea that “+300% twice” means another +300% move is likely. #BTC Price Analysis#
82
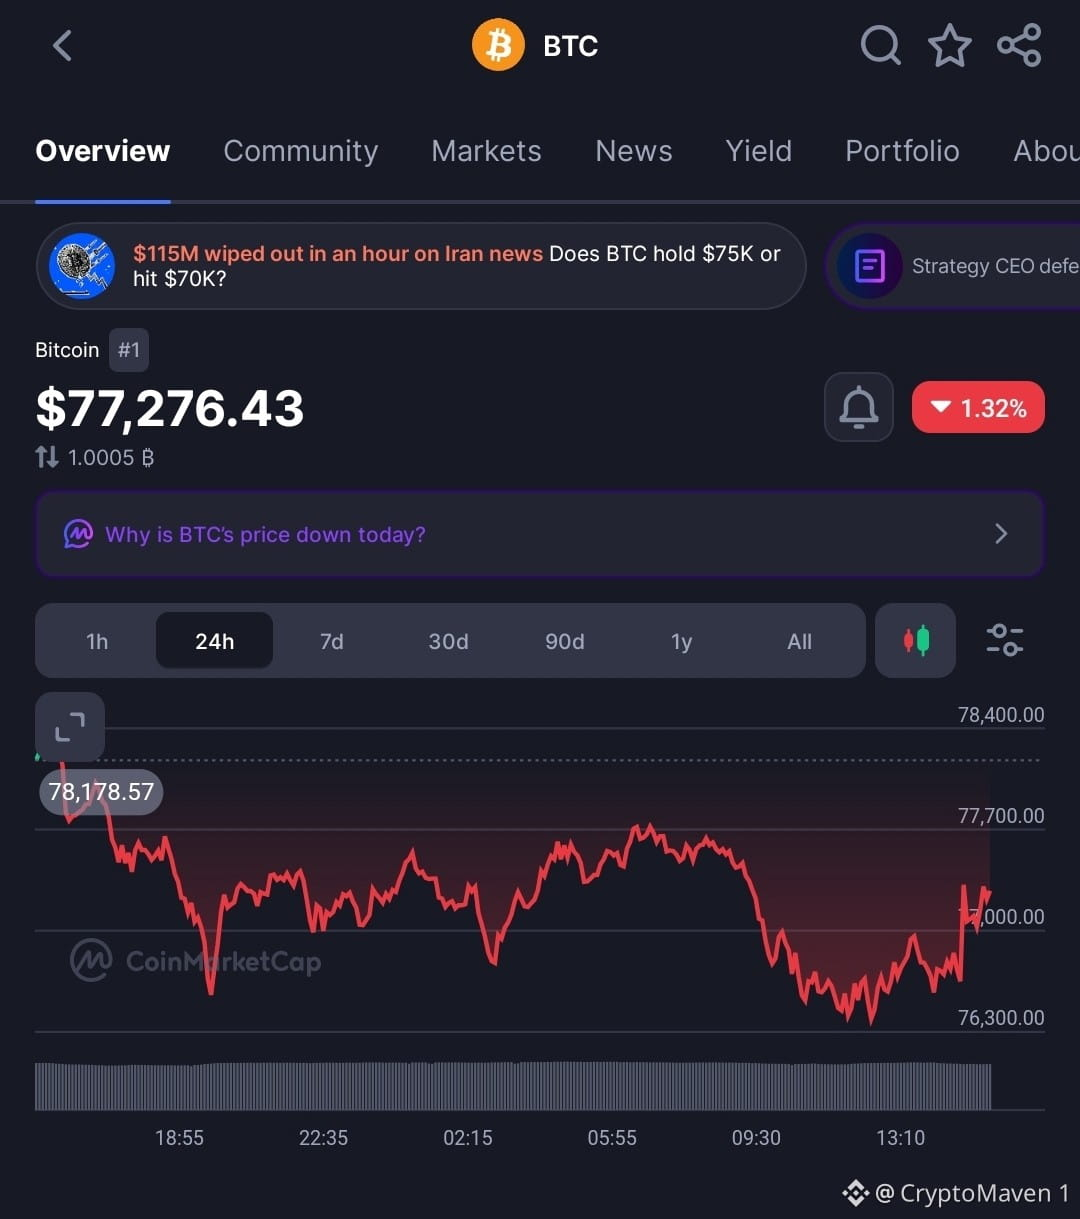
The $115M liquidation figure is real, but there is an important distinction which is the $115M was largely leveraged long positions across crypto, with $ETH taking a major hit, rather than $115M of Bitcoin positions alone. The move came as fresh U.S.-Iran strikes reignited geopolitical risk and pushed oil sharply higher. #Bitcoin has now slipped from the ~$80K area to around $76.5K–$77K, while Brent crude pushed above $93 and Treasury yields moved toward 4.8%. That combination matters because higher oil can increase inflation pressure and make markets worry about tighter monetary policy, generally a tough environment for risk assets like crypto. The key question is whether $75K actually holds. If buyers defend that area, the recent pullback could remain just a correction after August's strong rally. But a decisive break below $75K would put the $70K region back on the radar and could trigger another round of forced selling. There is one encouraging detail for bulls, recent analysis suggests $BTC rally has been driven more by spot buying than excessive leverage, meaning there may be less leveraged positioning to unwind than during previous crashes. So for me, $75K is the line to watch. Hold it and $BTC has a chance to stabilize, lose it with geopolitical pressure still escalating, and $70K becomes a much more realistic downside test. The bigger catalyst now isn't just Iran it's Iran + oil + Treasury yields + the Fed. If those four continue moving against risk assets, $75K gets much harder to defend. #BTC Price Analysis# #Altcoin Season#
The $115M liquidation figure is real, but there is an important distinction which is the $115M was largely leveraged long positions across crypto, with $ETH taking a major hit, rather than $115M of Bitcoin positions alone. The move came as fresh U.S.-Iran strikes reignited geopolitical risk and pushed oil sharply higher. #Bitcoin has now slipped from the ~$80K area to around $76.5K–$77K, while Brent crude pushed above $93 and Treasury yields moved toward 4.8%. That combination matters because higher oil can increase inflation pressure and make markets worry about tighter monetary policy, generally a tough environment for risk assets like crypto. The key question is whether $75K actually holds. If buyers defend that area, the recent pullback could remain just a correction after August's strong rally. But a decisive break below $75K would put the $70K region back on the radar and could trigger another round of forced selling. There is one encouraging detail for bulls, recent analysis suggests $BTC rally has been driven more by spot buying than excessive leverage, meaning there may be less leveraged positioning to unwind than during previous crashes. So for me, $75K is the line to watch. Hold it and $BTC has a chance to stabilize, lose it with geopolitical pressure still escalating, and $70K becomes a much more realistic downside test. The bigger catalyst now isn't just Iran it's Iran + oil + Treasury yields + the Fed. If those four continue moving against risk assets, $75K gets much harder to defend. #BTC Price Analysis# #Altcoin Season#
78
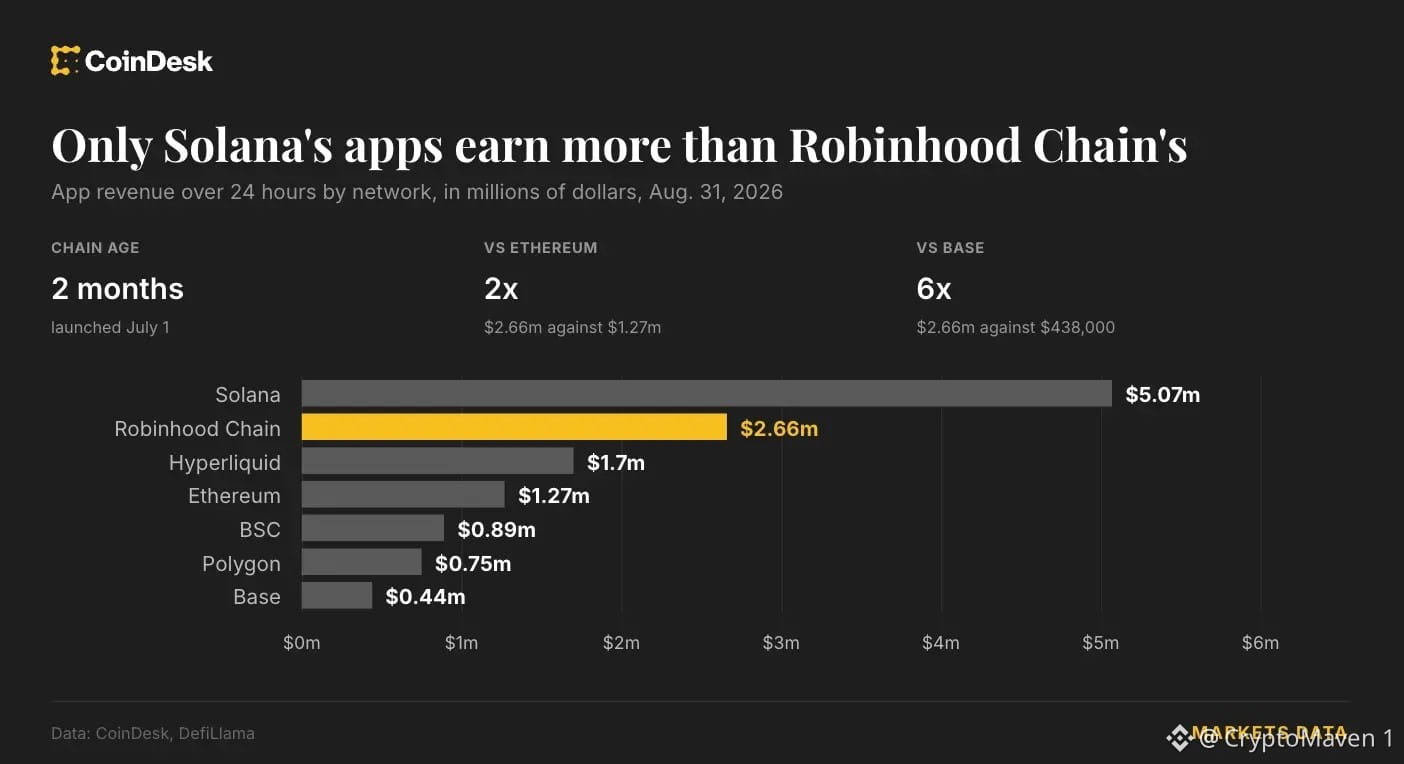
The headline makes it sound like Robinhood Chain is suddenly beating #Ethereum , but that conclusion is too broad. What actually happened is that apps running on Robinhood Chain generated about $2.66M in revenue over a 24-hour snapshot, versus about $1.28M for $ETH . That is a notable result, but it is not the same thing as Robinhood generating more revenue than Ethereum, nor does it mean Robinhood Chain is now a larger ecosystem. The more interesting question is where the $2.66M came from. About 88% came from just three applications: GMGN, Pons and Uniswap. GMGN and Pons are heavily focused on speculative token trading, while Uniswap is a DEX. Pons reportedly saw around 22,600 token launches in a single day and the chain processed 5.52M transactions with roughly $875M in DEX volume. So if you are asking What is everyone trading there?, the answer is basically far more speculative crypto tokens than tokenized stocks right now. And that is the key contradiction. Robinhood originally positioned the chain around tokenized stocks and real world assets, but the activity producing the headline numbers is currently being driven largely by speculative token trading. There is also an important timeframe issue. On a one-day basis, Robinhood Chain's apps were ahead of $ETH . But over seven days, Ethereum still had about $11.9M of app revenue versus $9.34M for Robinhood Chain and over 30 days Ethereum was ahead by an even wider margin. So I wouldn't interpret this as Robinhood has overtaken Ethereum. I would interpret it as: Robinhood has built a very efficient venue for high frequency speculative trading and that activity is generating surprisingly large short term app revenue. The real test is whether it can convert that activity into durable demand for tokenized stocks and other real-world assets. That is a much more meaningful metric to watch than one unusually strong 24 hour revenue print.
The headline makes it sound like Robinhood Chain is suddenly beating #Ethereum , but that conclusion is too broad. What actually happened is that apps running on Robinhood Chain generated about $2.66M in revenue over a 24-hour snapshot, versus about $1.28M for $ETH . That is a notable result, but it is not the same thing as Robinhood generating more revenue than Ethereum, nor does it mean Robinhood Chain is now a larger ecosystem. The more interesting question is where the $2.66M came from. About 88% came from just three applications: GMGN, Pons and Uniswap. GMGN and Pons are heavily focused on speculative token trading, while Uniswap is a DEX. Pons reportedly saw around 22,600 token launches in a single day and the chain processed 5.52M transactions with roughly $875M in DEX volume. So if you are asking What is everyone trading there?, the answer is basically far more speculative crypto tokens than tokenized stocks right now. And that is the key contradiction. Robinhood originally positioned the chain around tokenized stocks and real world assets, but the activity producing the headline numbers is currently being driven largely by speculative token trading. There is also an important timeframe issue. On a one-day basis, Robinhood Chain's apps were ahead of $ETH . But over seven days, Ethereum still had about $11.9M of app revenue versus $9.34M for Robinhood Chain and over 30 days Ethereum was ahead by an even wider margin. So I wouldn't interpret this as Robinhood has overtaken Ethereum. I would interpret it as: Robinhood has built a very efficient venue for high frequency speculative trading and that activity is generating surprisingly large short term app revenue. The real test is whether it can convert that activity into durable demand for tokenized stocks and other real-world assets. That is a much more meaningful metric to watch than one unusually strong 24 hour revenue print.
80
The $500M move makes more sense when you look at the bigger strategy. Strategy now owns over 3% of all circulating $BTC , while Tom Lee’s BitMine has maintained a multi week buying streak and is approaching a 4.9% stake in Ethereum. Both are using corporate balance sheets to systematically accumulate digital assets as long term holdings, not chase short term trades. Saylor and Tom Lee are essentially betting that BTC and $ETH will become strategic treasury assets. The bigger question now is how far can this model scale? #BTC Price Analysis# #Altcoin Season#
The $500M move makes more sense when you look at the bigger strategy. Strategy now owns over 3% of all circulating $BTC , while Tom Lee’s BitMine has maintained a multi week buying streak and is approaching a 4.9% stake in Ethereum. Both are using corporate balance sheets to systematically accumulate digital assets as long term holdings, not chase short term trades. Saylor and Tom Lee are essentially betting that BTC and $ETH will become strategic treasury assets. The bigger question now is how far can this model scale? #BTC Price Analysis# #Altcoin Season#
70
Honestly, I think the Fed chair’s speech could be a big deal for $BTC today. Bitcoin has already made a strong move toward $80K, so I wouldn’t be surprised to see some profit taking if the speech comes across as hawkish. On the other hand, if the Fed gives the market a more dovish signal, we could see BTC push higher. For me, the key thing isn’t the first spike after the speech. I woul drather see whether $BTC can actually hold $80K and break through the $81K–$83K area. If it gets above $83K and stays there, that would look pretty bullish. But if it loses around $77K, I’d be more cautious about the rally. So yeah, today could be less about predicting the speech and more about watching how BTC reacts to it.
Honestly, I think the Fed chair’s speech could be a big deal for $BTC today. Bitcoin has already made a strong move toward $80K, so I wouldn’t be surprised to see some profit taking if the speech comes across as hawkish. On the other hand, if the Fed gives the market a more dovish signal, we could see BTC push higher. For me, the key thing isn’t the first spike after the speech. I woul drather see whether $BTC can actually hold $80K and break through the $81K–$83K area. If it gets above $83K and stays there, that would look pretty bullish. But if it loses around $77K, I’d be more cautious about the rally. So yeah, today could be less about predicting the speech and more about watching how BTC reacts to it.
69
A $125K Bitcoin target by December sounds bold, but the real question is what needs to happen for $BTC to get there. Bitcoin doesn’t need to move 58% overnight. A sustained breakout, stronger liquidity, renewed institutional demand and continued spot buying could gradually push the market much higher. At the same time, there is still plenty that could go wrong. Macro conditions, profit taking and another wave of risk off sentiment could easily slow the move. So I wouldn’t focus too much on the exact number. The bigger signal is whether Bitcoin can keep making higher highs and higher lows from here. If that structure holds, $125K starts looking a lot more realistic. Bullish or too optimistic? #BTC Price Analysis#
A $125K Bitcoin target by December sounds bold, but the real question is what needs to happen for $BTC to get there. Bitcoin doesn’t need to move 58% overnight. A sustained breakout, stronger liquidity, renewed institutional demand and continued spot buying could gradually push the market much higher. At the same time, there is still plenty that could go wrong. Macro conditions, profit taking and another wave of risk off sentiment could easily slow the move. So I wouldn’t focus too much on the exact number. The bigger signal is whether Bitcoin can keep making higher highs and higher lows from here. If that structure holds, $125K starts looking a lot more realistic. Bullish or too optimistic? #BTC Price Analysis#
77
The $6.4B #Bitcoin options expiry could bring some serious volatility. With major open interest around $75K–$80K, the reaction around these levels could set the tone. Max pain is near $68K, but that doesn’t mean $BTC is destined to fall there. For me, $80K remains the key level. A clean breakout and hold could bring fresh bullish momentum, while rejection may send BTC back toward $75K. With sentiment also moving into greed territory, I would be watching price action closely rather than blindly following the max-pain narrative. $BTC breaks $80K or gets pulled lower first? #BTC Price Analysis#
The $6.4B #Bitcoin options expiry could bring some serious volatility. With major open interest around $75K–$80K, the reaction around these levels could set the tone. Max pain is near $68K, but that doesn’t mean $BTC is destined to fall there. For me, $80K remains the key level. A clean breakout and hold could bring fresh bullish momentum, while rejection may send BTC back toward $75K. With sentiment also moving into greed territory, I would be watching price action closely rather than blindly following the max-pain narrative. $BTC breaks $80K or gets pulled lower first? #BTC Price Analysis#
70
Similar to last week, we saw $BTC face strong resistance around the 81K area, with the 50-week MA acting as a major hurdle. That explains why some KOLs are still keeping the 50K target on the table, but a rejection alone doesn't mean $BTC is heading there. We need to see how price reacts around the major support zones first. If BTC manages to reclaim 81K–82K and hold above it on the weekly timeframe, the bearish 50K thesis becomes much harder to justify. But if support keeps failing and momentum continues to weaken, then a deeper correction becomes more realistic. For now, I would rather watch the levels than blindly follow either the 50K or 100K narrative. The market will tell us. #BTC Price Analysis# #Altcoin Season#
Similar to last week, we saw $BTC face strong resistance around the 81K area, with the 50-week MA acting as a major hurdle. That explains why some KOLs are still keeping the 50K target on the table, but a rejection alone doesn't mean $BTC is heading there. We need to see how price reacts around the major support zones first. If BTC manages to reclaim 81K–82K and hold above it on the weekly timeframe, the bearish 50K thesis becomes much harder to justify. But if support keeps failing and momentum continues to weaken, then a deeper correction becomes more realistic. For now, I would rather watch the levels than blindly follow either the 50K or 100K narrative. The market will tell us. #BTC Price Analysis# #Altcoin Season#
76
The $ZEC setup is definitely getting harder to ignore. The move above $800 and the ETF catalyst give it a strong narrative right now, while the Ironwood upgrade has also strengthened the privacy angle. What makes this more interesting is that Grayscale’s Zcash ETF is expected to begin trading on NYSE Arca around August 25, subject to final regulatory approval. That said, after a move this aggressive, I wouldn’t blindly chase the pump. If $ZEC can hold higher levels and attract sustained spot demand alongside the ETF launch, there could still be room for another leg higher. But if the ETF becomes a “sell the news” event, volatility could get nasty. So yes, ZEC could be one of the rockets to watch but the key question now is whether it can sustain the breakout, not just make another vertical move.
The $ZEC setup is definitely getting harder to ignore. The move above $800 and the ETF catalyst give it a strong narrative right now, while the Ironwood upgrade has also strengthened the privacy angle. What makes this more interesting is that Grayscale’s Zcash ETF is expected to begin trading on NYSE Arca around August 25, subject to final regulatory approval. That said, after a move this aggressive, I wouldn’t blindly chase the pump. If $ZEC can hold higher levels and attract sustained spot demand alongside the ETF launch, there could still be room for another leg higher. But if the ETF becomes a “sell the news” event, volatility could get nasty. So yes, ZEC could be one of the rockets to watch but the key question now is whether it can sustain the breakout, not just make another vertical move.
52
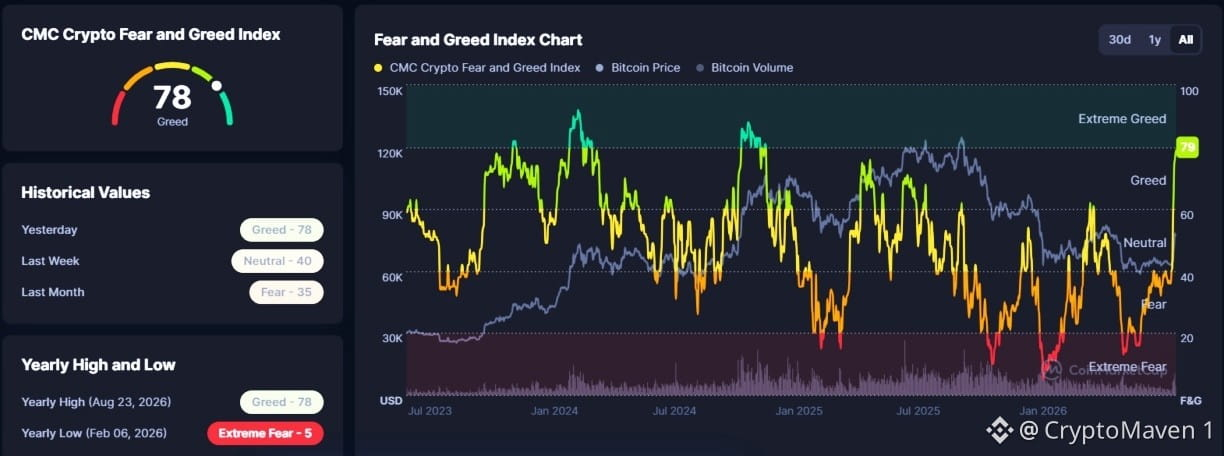
Ethereum is showing serious strength, but this is also where traders need to stay disciplined. $ETH gained around 30% over the week, while crypto sentiment pushed into extreme greed at 79. That combination tells me the momentum is real, but the risk of a short-term pullback is rising too. The interesting part is that spot Ethereum ETFs pulled in $697M last week, showing institutional demand is still supporting the move. For me, $2,500 is the level to watch. A clean break and hold could open the door toward $2,700, while rejection could bring a retest of $2,350 or lower. Bullish, but I wouldn't chase the candle here. Let the market confirm the next move.
Ethereum is showing serious strength, but this is also where traders need to stay disciplined. $ETH gained around 30% over the week, while crypto sentiment pushed into extreme greed at 79. That combination tells me the momentum is real, but the risk of a short-term pullback is rising too. The interesting part is that spot Ethereum ETFs pulled in $697M last week, showing institutional demand is still supporting the move. For me, $2,500 is the level to watch. A clean break and hold could open the door toward $2,700, while rejection could bring a retest of $2,350 or lower. Bullish, but I wouldn't chase the candle here. Let the market confirm the next move.
67
If we are talking pure upside, I would separate momentum from market size. $BTC still has the strongest liquidity and institutional base, while $ETH has a much deeper ecosystem. But $XRP could offer the more aggressive upside if its recent strength continues and institutional demand keeps building. The interesting part is that U.S. spot XRP ETFs have already attracted around $1.5 in cumulative inflows, showing there is real institutional appetite for XRP exposure. So for me: $BTC = strongest core play $ETH = strong ecosystem + upside $XRP = higher-risk, potentially higher reward momentum play 🚀 If XRP can turn this weeks outperformance into a sustained trend, that is where things could get very interesting. #BTC Price Analysis# #Altcoin Season#
If we are talking pure upside, I would separate momentum from market size. $BTC still has the strongest liquidity and institutional base, while $ETH has a much deeper ecosystem. But $XRP could offer the more aggressive upside if its recent strength continues and institutional demand keeps building. The interesting part is that U.S. spot XRP ETFs have already attracted around $1.5 in cumulative inflows, showing there is real institutional appetite for XRP exposure. So for me: $BTC = strongest core play $ETH = strong ecosystem + upside $XRP = higher-risk, potentially higher reward momentum play 🚀 If XRP can turn this weeks outperformance into a sustained trend, that is where things could get very interesting. #BTC Price Analysis# #Altcoin Season#
52
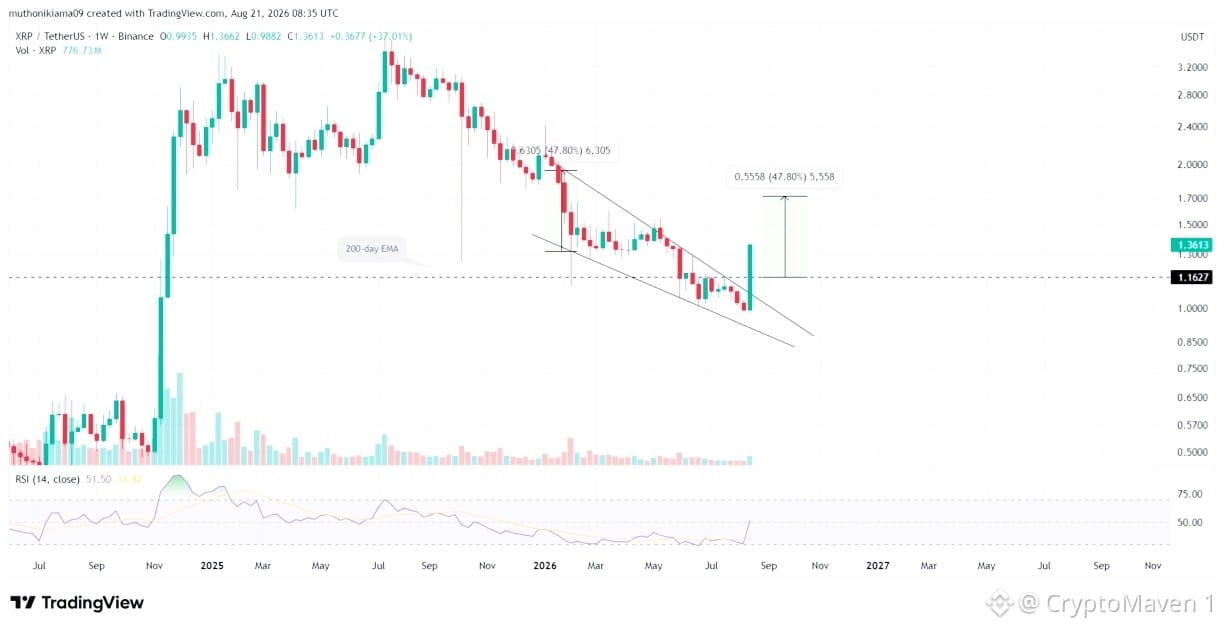
$XRP may be approaching a setup worth watching. A descending wedge is pointing toward a potential breakout, with $1.70 highlighted as a possible upside target if XRP can reclaim key resistance and confirm the move. What makes this interesting is the bigger picture. Ripple CEO Brad Garlinghouse remains optimistic about 2026, pointing to growing institutional adoption and clearer regulation as potential catalysts for the broader crypto market. Technical setup + improving fundamentals could make XRP one of the altcoins to watch closely. But the breakout needs confirmation. No chasing candles.
$XRP may be approaching a setup worth watching. A descending wedge is pointing toward a potential breakout, with $1.70 highlighted as a possible upside target if XRP can reclaim key resistance and confirm the move. What makes this interesting is the bigger picture. Ripple CEO Brad Garlinghouse remains optimistic about 2026, pointing to growing institutional adoption and clearer regulation as potential catalysts for the broader crypto market. Technical setup + improving fundamentals could make XRP one of the altcoins to watch closely. But the breakout needs confirmation. No chasing candles.
57
Bitcoin just flipped Meta. 👀 $BTC has climbed to around $78K, pushing its market cap to roughly $1.54T and making it the 13th-largest asset in the world. That’s more than just another price rally. ETF inflows, improving liquidity and institutional demand are showing that Bitcoin is increasingly competing with the biggest names in traditional finance. The ranking can change quickly, but the bigger picture is hard to ignore: Bitcoin is becoming harder for global markets to overlook.
Bitcoin just flipped Meta. 👀 $BTC has climbed to around $78K, pushing its market cap to roughly $1.54T and making it the 13th-largest asset in the world. That’s more than just another price rally. ETF inflows, improving liquidity and institutional demand are showing that Bitcoin is increasingly competing with the biggest names in traditional finance. The ranking can change quickly, but the bigger picture is hard to ignore: Bitcoin is becoming harder for global markets to overlook.
68
Көбірек контент көру үшін кіріңіз
Binance Square платформасында әлемдік криптоқоғамдастыққа қосылыңыз
⚡️ Криптовалюта туралы ең соңғы және пайдалы ақпаратты алыңыз.
💬 Әлемдегі ең ірі криптобиржаның сеніміне ие.
👍 Расталған авторлардың нақты пікірлерін табыңыз.
Электрондық пошта/телефон нөмірі
Трендтегі тақырыптар
FedRateWatch
244,303 рет көрілді
1,602 адам талқылап жатыр
Share & Win Traffic Reward in our Trending Hashtag Campaign
✨Topic: FOMC September, What's The Fed's Next Move?
👉How to Join:
Publish a short post or article with hashtag #FedRateWatch
Create content based on the below angles:
- August core CPI rose 0.3% month-over-month, and the odds of a 25bp hike this week are now close to 90%. Do you anticipate a rate hike this week? Is it a one-off, or the start of a longer hiking cycle?
- If the hike lands, how does it play out for BTC, tech stocks, and gold? Bullish or bearish?
- How are you planning to trade next? Share your BTC, stocks or gold trade/holdings with our trade sharing widget.
⏰Campaign Period:
- 2026-09-15 11:00 - 2026-09-17 3:00 UTC
🎁Reward:
- Qualified posts that comply with the above guidelines and contain more than 100 words will be reviewed and may receive a random traffic boost of 500 to 3,000 views. You will receive a notification from your feed secretary if your post is selected.
- Get a chance to have your article featured on Binance Square Official
Need ideas for your post? Visit the topic page #FedRateWatch or the Square Guide on How to Post for Better Reach.
Binance Square Official
·282 лайк
·499.2k рет көрілді
BitcoinSlidesTo$76000
2,517 рет көрілді
50 адам талқылап жатыр
BitcoinReboundsTo$79K
48,292 рет көрілді
355 адам талқылап жатыр