

HM Hanip Mahmud
Crypto Market Analyst BTC • ETH • BNB Market Structure | Liquidity | Volatility Crypto News & Market Insights Learn • Analyze • Grow DYOR | Not
Ашық сауда
Жиі сауда жасайтын трейдер
2 жыл
131 Жазылым
102 Жазылушылар
67 лайк басылған
Жазбалар
Портфолио
Барлығы
Баға ұсыныстары
Видеолар


HM Hanip Mahmud
·
--
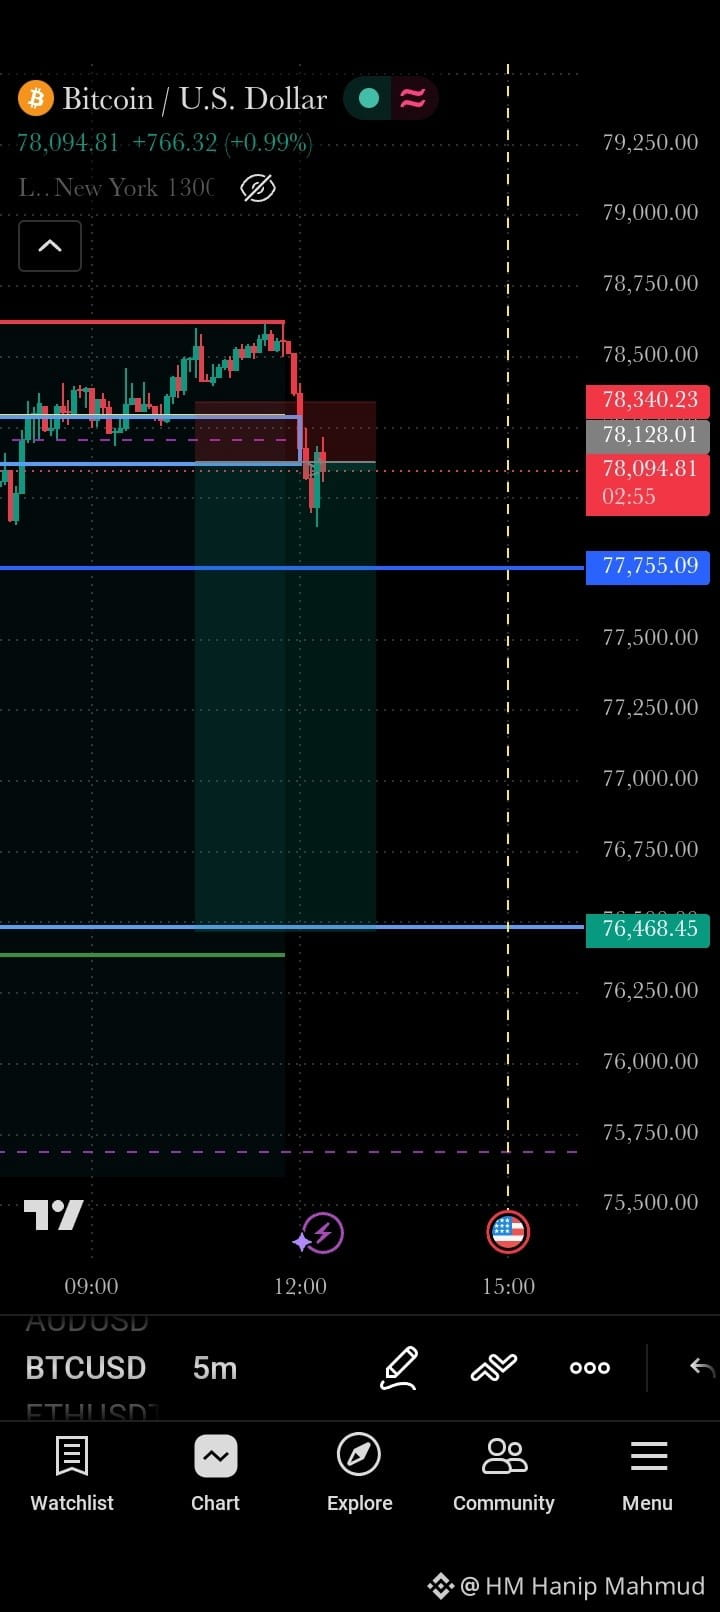
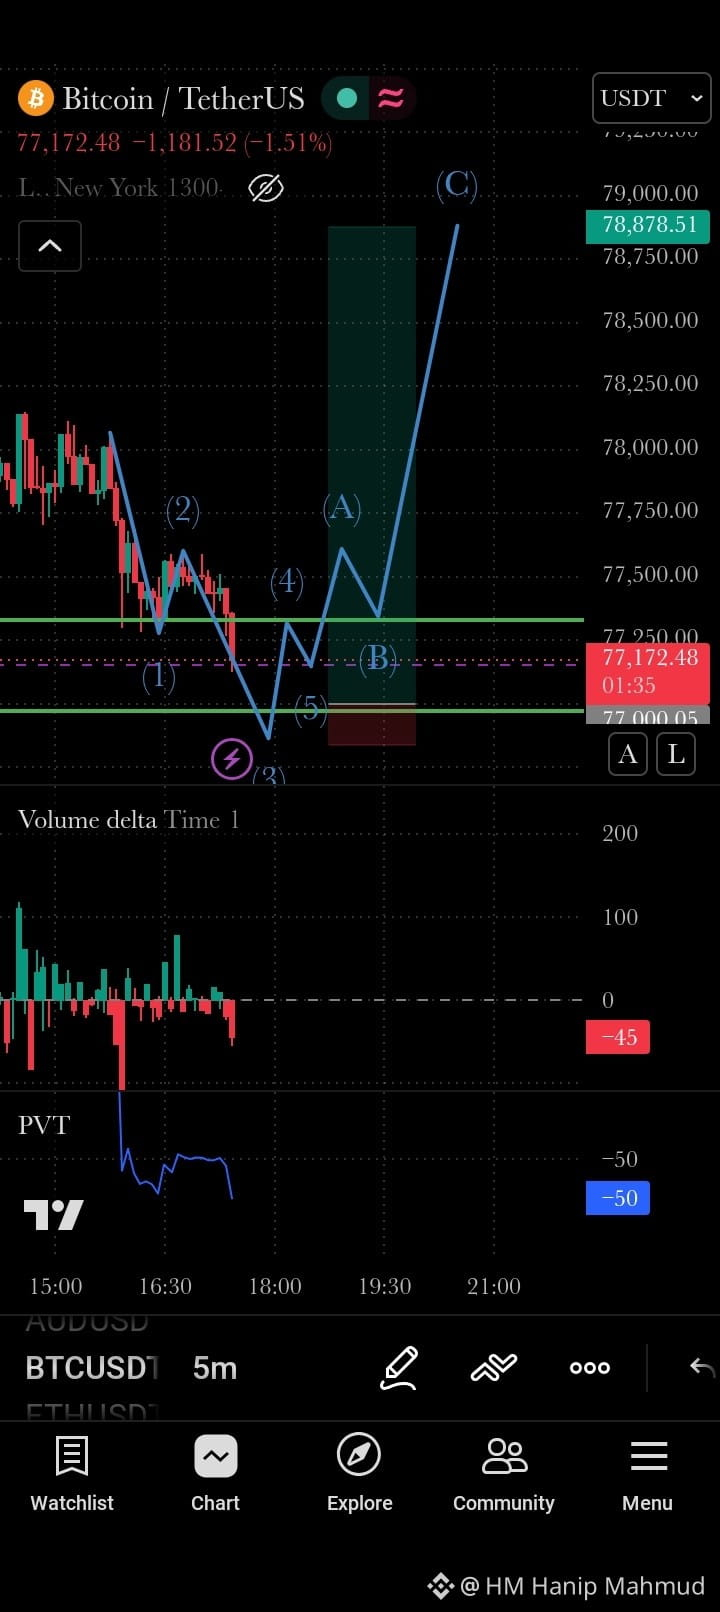
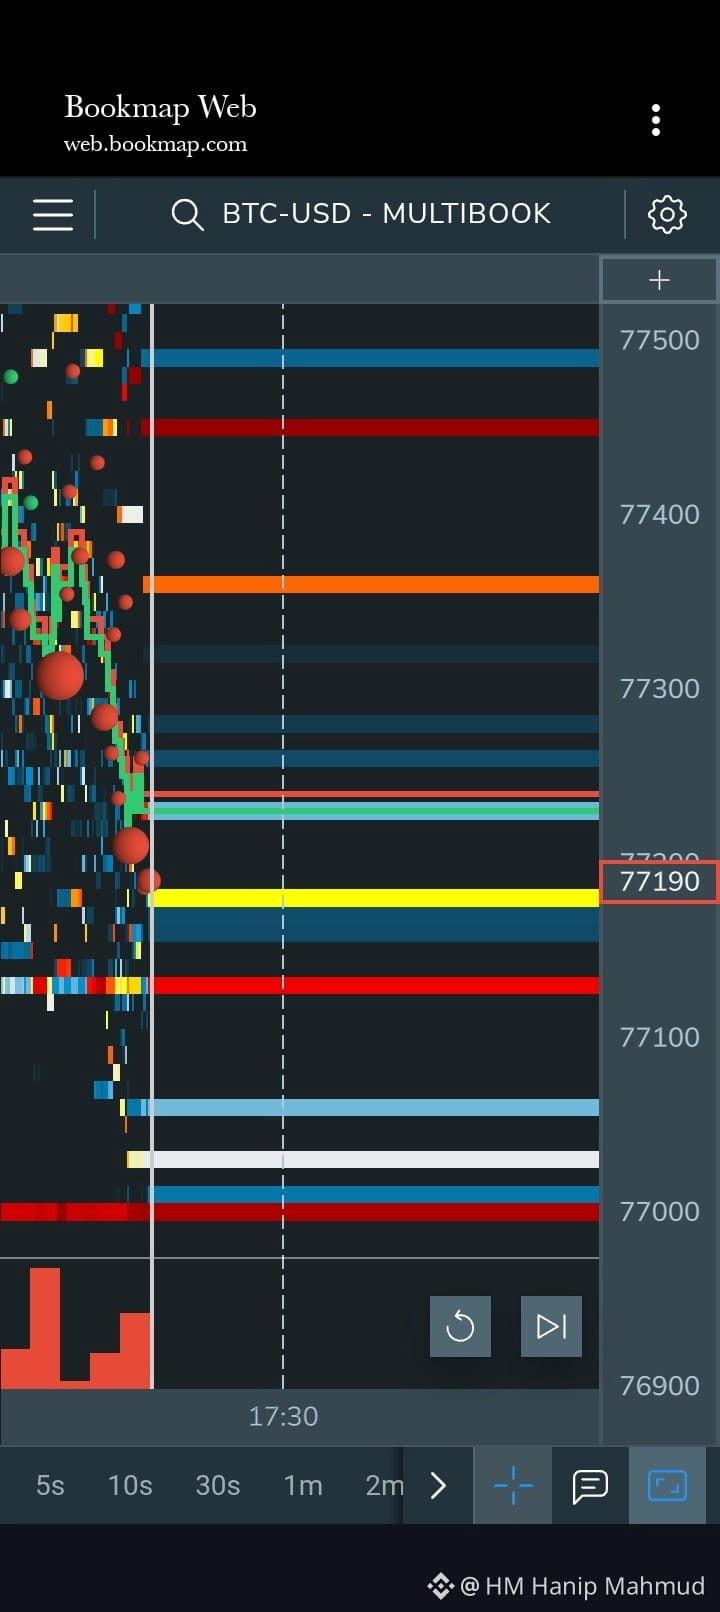
BTCUSDT – BUY Analysis 📈
$BTC
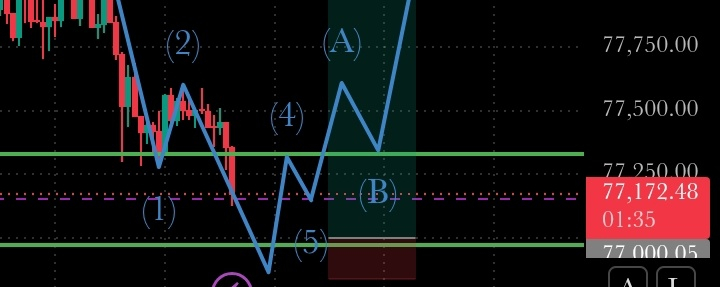
Your Elliott Wave projection suggests a possible bullish ABC recovery.
Volume Delta is negative, indicating selling pressure.
PVT is also declining, so buyers have not yet confirmed control.
A 5-minute candle close above 77,325 would strengthen the BUY setup.
4. My trading strategy
Conservative entry: Wait for a 5-minute candle to close above 77,325 and a successful retest.
Aggressive entry: Look for a bullish reversal around 77,000–76,900.
Invalidation: If price breaks below 76,850, avoid this BUY setup.
Risk management: Risk only 1% of your futures account per trade. Avoid high leverage.#USMidtermElections #USMidtermElections #BinanceProcesses$4.65BWithdrawals #BinanceRestores28FiatWithdrawals #USOctoberNFP-AreRateCutsStillPossible
Your Elliott Wave projection suggests a possible bullish ABC recovery.
Volume Delta is negative, indicating selling pressure.
PVT is also declining, so buyers have not yet confirmed control.
A 5-minute candle close above 77,325 would strengthen the BUY setup.
4. My trading strategy
Conservative entry: Wait for a 5-minute candle to close above 77,325 and a successful retest.
Aggressive entry: Look for a bullish reversal around 77,000–76,900.
Invalidation: If price breaks below 76,850, avoid this BUY setup.
Risk management: Risk only 1% of your futures account per trade. Avoid high leverage.#USMidtermElections #USMidtermElections #BinanceProcesses$4.65BWithdrawals #BinanceRestores28FiatWithdrawals #USOctoberNFP-AreRateCutsStillPossible
$BTC бойынша лонг позиция: 308.4 USDT
HM Hanip Mahmud
·
--
BTCUSDT – BUY Analysis 📈
$BTC
Your Elliott Wave projection suggests a possible bullish ABC recovery.
Volume Delta is negative, indicating selling pressure.
PVT is also declining, so buyers have not yet confirmed control.
A 5-minute candle close above 77,325 would strengthen the BUY setup.
4. My trading strategy
Conservative entry: Wait for a 5-minute candle to close above 77,325 and a successful retest.
Aggressive entry: Look for a bullish reversal around 77,000–76,900.
Invalidation: If price breaks below 76,850, avoid this BUY setup.
Risk management: Risk only 1% of your futures account per trade. Avoid high leverage.#USMidtermElections #USMidtermElections #BinanceProcesses$4.65BWithdrawals #BinanceRestores28FiatWithdrawals #USOctoberNFP-AreRateCutsStillPossible
Your Elliott Wave projection suggests a possible bullish ABC recovery.
Volume Delta is negative, indicating selling pressure.
PVT is also declining, so buyers have not yet confirmed control.
A 5-minute candle close above 77,325 would strengthen the BUY setup.
4. My trading strategy
Conservative entry: Wait for a 5-minute candle to close above 77,325 and a successful retest.
Aggressive entry: Look for a bullish reversal around 77,000–76,900.
Invalidation: If price breaks below 76,850, avoid this BUY setup.
Risk management: Risk only 1% of your futures account per trade. Avoid high leverage.#USMidtermElections #USMidtermElections #BinanceProcesses$4.65BWithdrawals #BinanceRestores28FiatWithdrawals #USOctoberNFP-AreRateCutsStillPossible
HM Hanip Mahmud
·
--
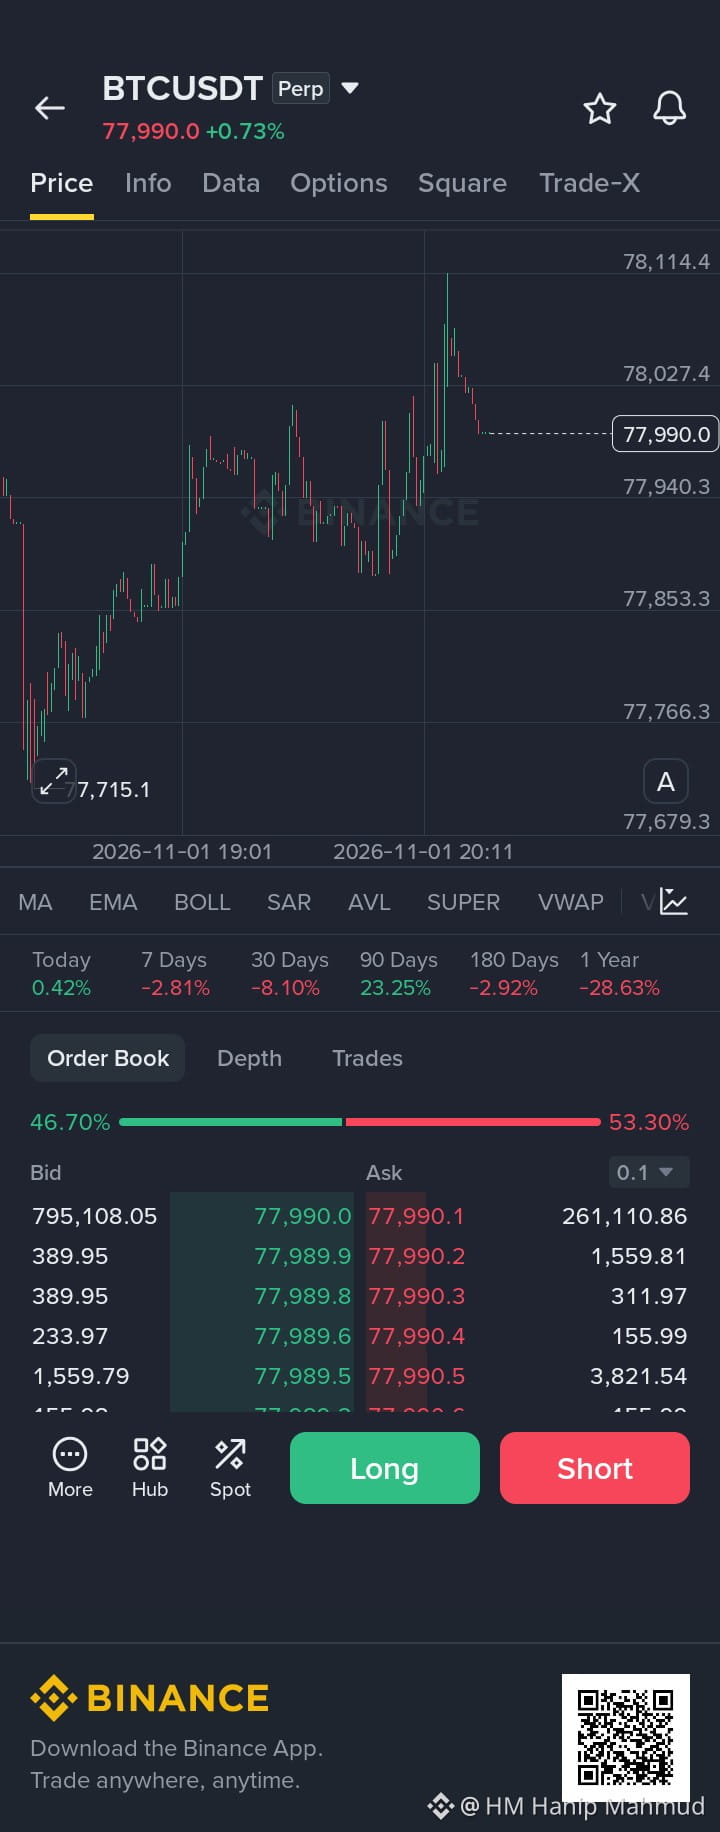
BTCUSDT – SELL Analysis 📉
$BTC
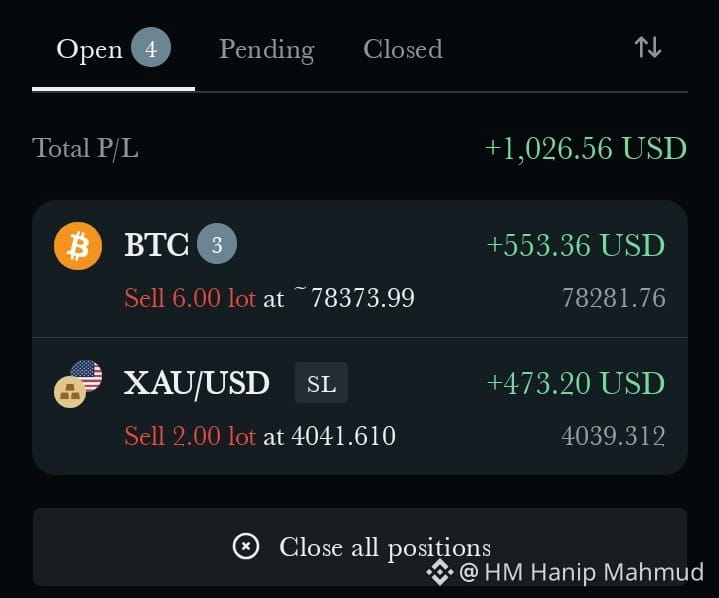
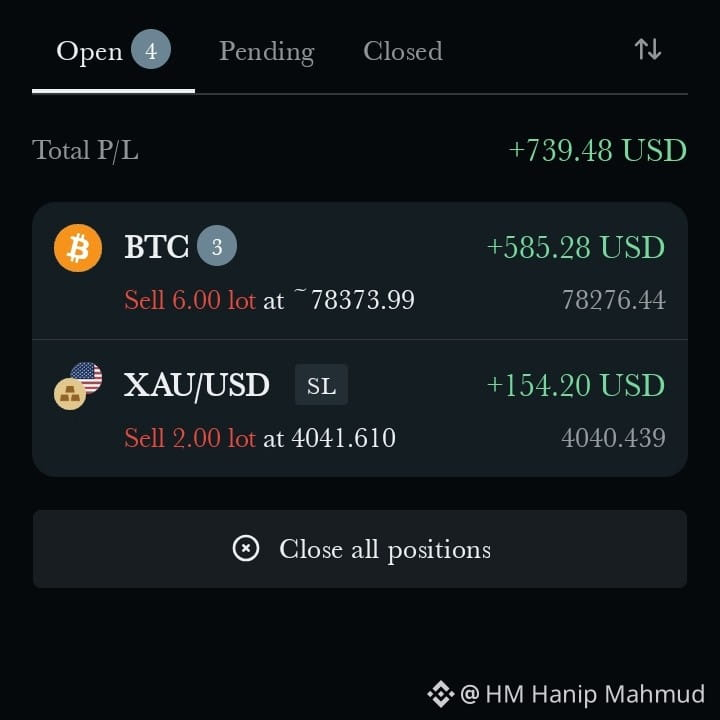
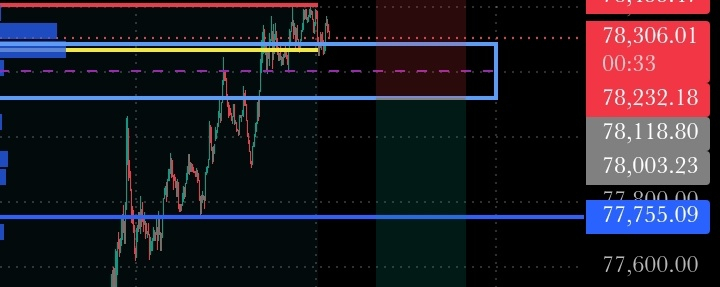
Take Profit 3 77,736
Extended Target 77,450
Technical Analysis
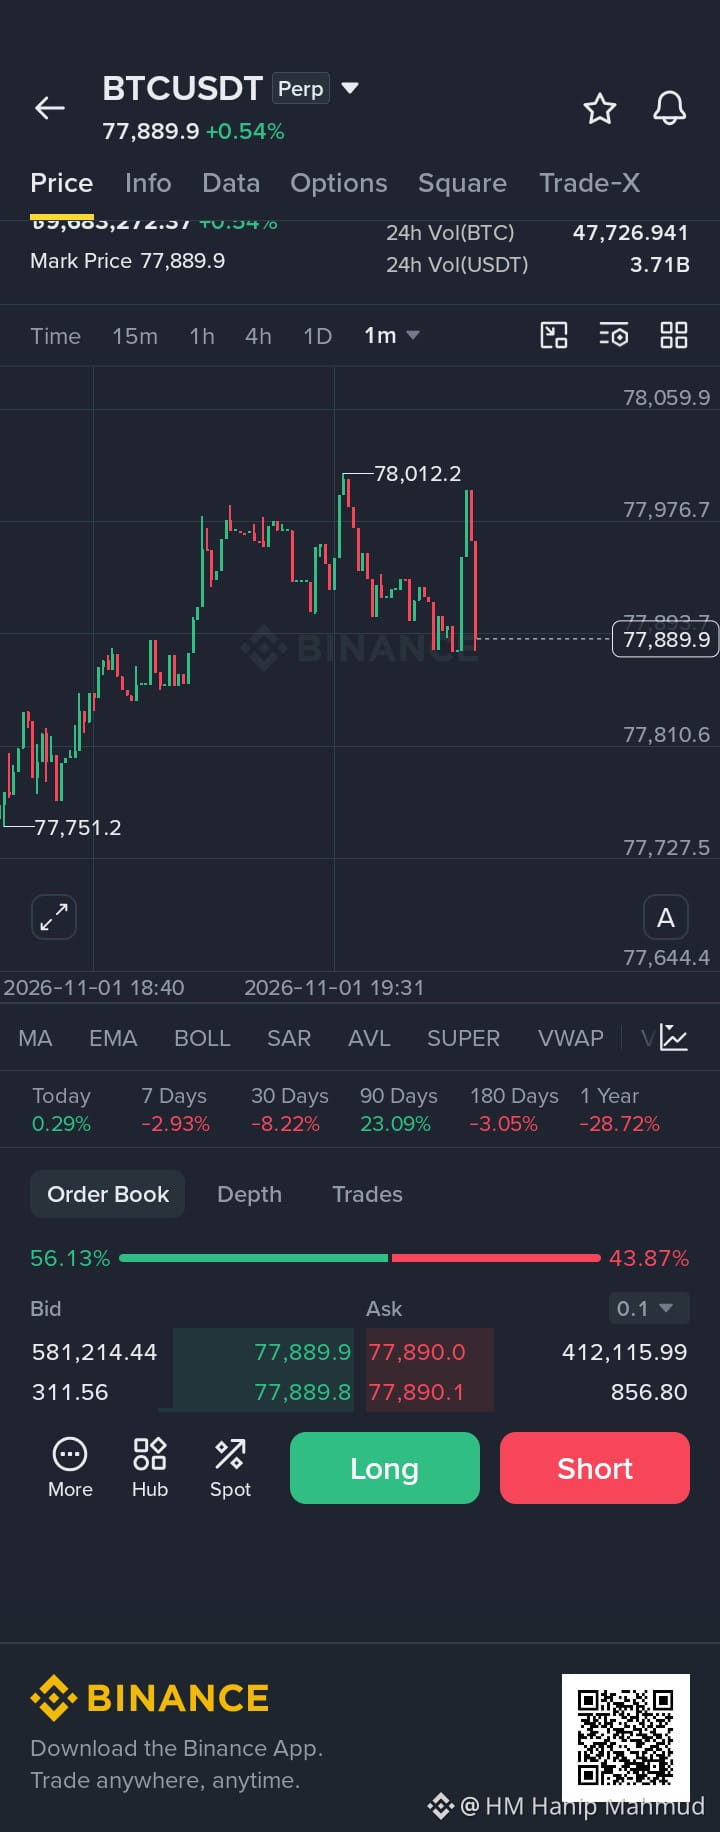
Price rejected the 78,000 resistance zone.
Sellers are showing pressure near resistance.
A breakdown below 77,950 could strengthen bearish momentum.
A strong candle close above 78,046 invalidates this short setup.
Trading Strategy
Wait for bearish candle confirmation.
Enter SELL around 77,970–77,985.
Place SL at 78,046.
Consider partial profit at each target.
This is a 1-minute scalp setup. Wait for candle confirmation; avoid entering blindly.
Take Profit 3 77,736
Extended Target 77,450
Technical Analysis
Price rejected the 78,000 resistance zone.
Sellers are showing pressure near resistance.
A breakdown below 77,950 could strengthen bearish momentum.
A strong candle close above 78,046 invalidates this short setup.
Trading Strategy
Wait for bearish candle confirmation.
Enter SELL around 77,970–77,985.
Place SL at 78,046.
Consider partial profit at each target.
This is a 1-minute scalp setup. Wait for candle confirmation; avoid entering blindly.
HM Hanip Mahmud
·
--
BTCUSDT – SELL Analysis 📉
$BTC
Take Profit 3 77,736
Extended Target 77,450
Technical Analysis
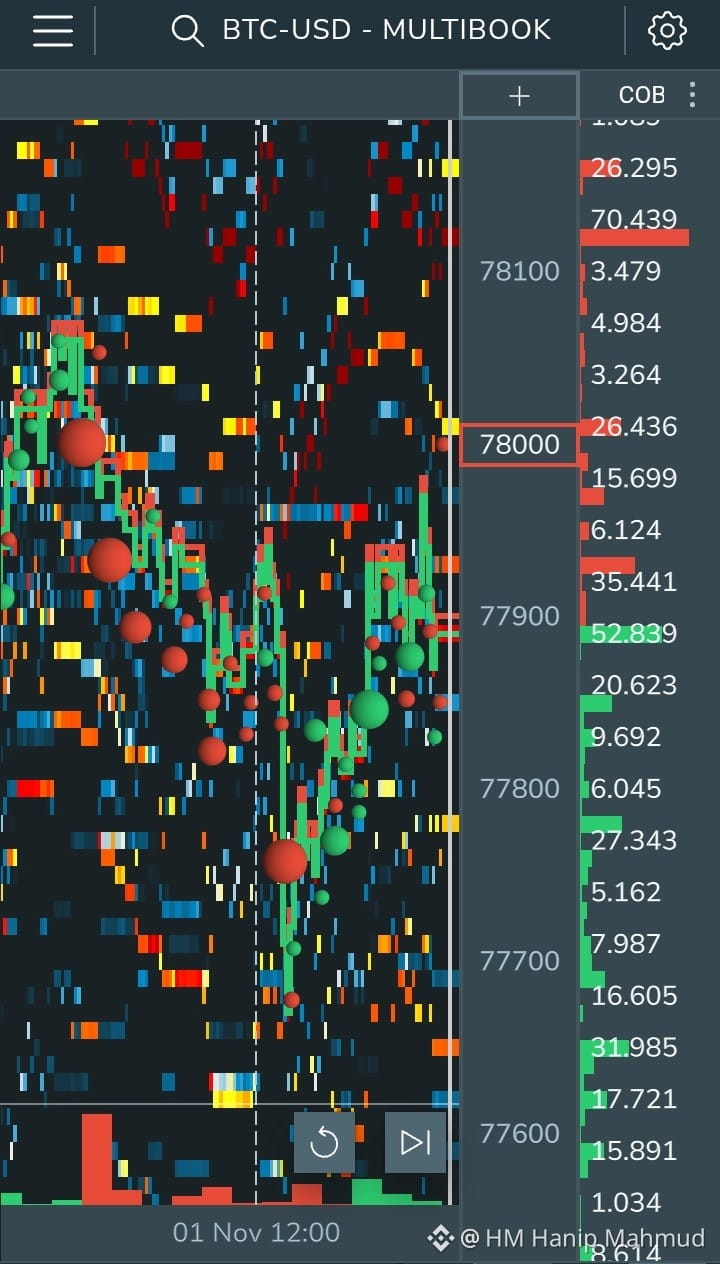
Price rejected the 78,000 resistance zone.
Sellers are showing pressure near resistance.
A breakdown below 77,950 could strengthen bearish momentum.
A strong candle close above 78,046 invalidates this short setup.
Trading Strategy
Wait for bearish candle confirmation.
Enter SELL around 77,970–77,985.
Place SL at 78,046.
Consider partial profit at each target.
This is a 1-minute scalp setup. Wait for candle confirmation; avoid entering blindly.
Take Profit 3 77,736
Extended Target 77,450
Technical Analysis
Price rejected the 78,000 resistance zone.
Sellers are showing pressure near resistance.
A breakdown below 77,950 could strengthen bearish momentum.
A strong candle close above 78,046 invalidates this short setup.
Trading Strategy
Wait for bearish candle confirmation.
Enter SELL around 77,970–77,985.
Place SL at 78,046.
Consider partial profit at each target.
This is a 1-minute scalp setup. Wait for candle confirmation; avoid entering blindly.
HM Hanip Mahmud
·
--
BTCUSDT – SELL Analysis 📉
$BTC
Take Profit 3 77,736
Extended Target 77,450
Technical Analysis
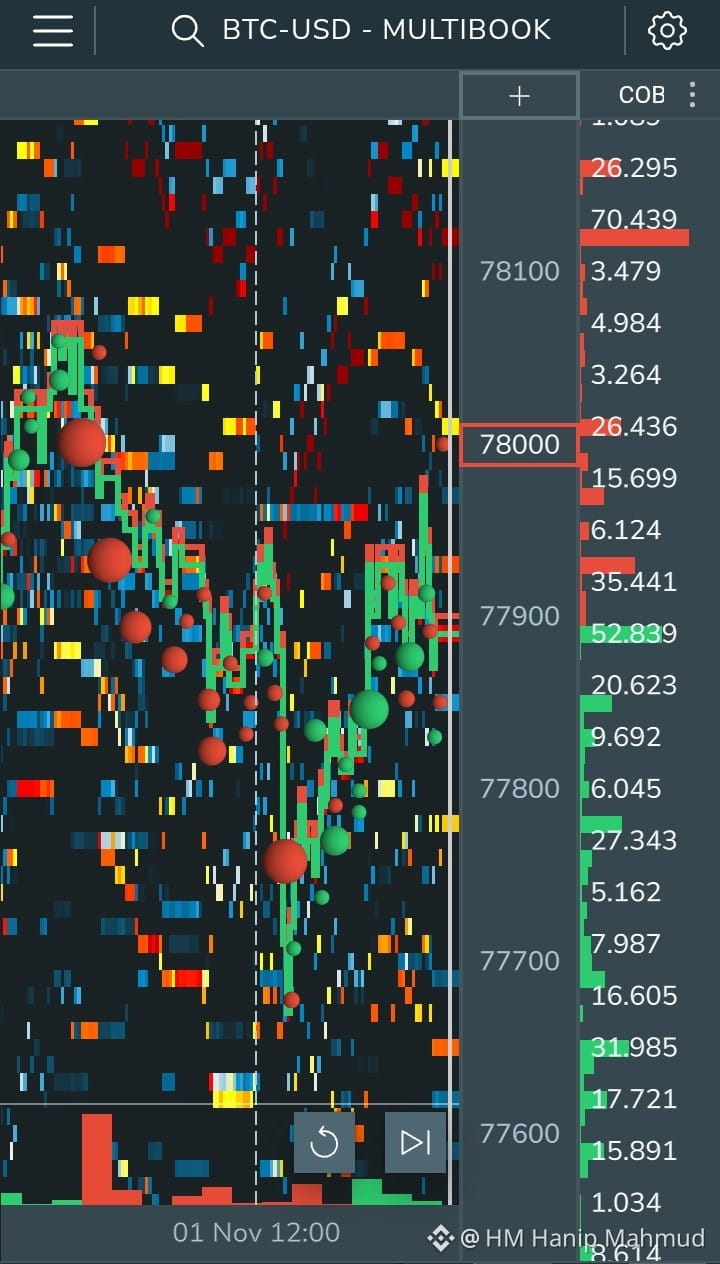
Price rejected the 78,000 resistance zone.
Sellers are showing pressure near resistance.
A breakdown below 77,950 could strengthen bearish momentum.
A strong candle close above 78,046 invalidates this short setup.
Trading Strategy
Wait for bearish candle confirmation.
Enter SELL around 77,970–77,985.
Place SL at 78,046.
Consider partial profit at each target.
This is a 1-minute scalp setup. Wait for candle confirmation; avoid entering blindly.
Take Profit 3 77,736
Extended Target 77,450
Technical Analysis
Price rejected the 78,000 resistance zone.
Sellers are showing pressure near resistance.
A breakdown below 77,950 could strengthen bearish momentum.
A strong candle close above 78,046 invalidates this short setup.
Trading Strategy
Wait for bearish candle confirmation.
Enter SELL around 77,970–77,985.
Place SL at 78,046.
Consider partial profit at each target.
This is a 1-minute scalp setup. Wait for candle confirmation; avoid entering blindly.
HM Hanip Mahmud
·
--
BTCUSDT – SELL Analysis 📉
$BTC
Take Profit 3 77,736
Extended Target 77,450
Technical Analysis
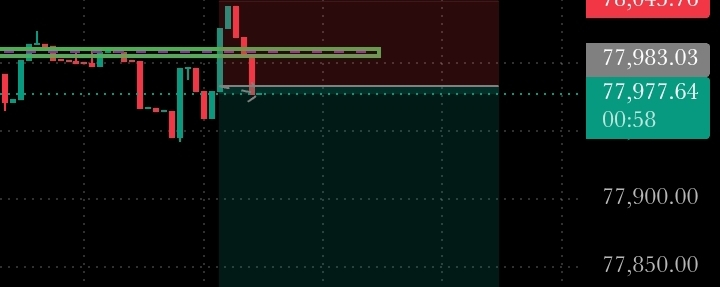
Price rejected the 78,000 resistance zone.
Sellers are showing pressure near resistance.
A breakdown below 77,950 could strengthen bearish momentum.
A strong candle close above 78,046 invalidates this short setup.
Trading Strategy
Wait for bearish candle confirmation.
Enter SELL around 77,970–77,985.
Place SL at 78,046.
Consider partial profit at each target.
This is a 1-minute scalp setup. Wait for candle confirmation; avoid entering blindly.
Take Profit 3 77,736
Extended Target 77,450
Technical Analysis
Price rejected the 78,000 resistance zone.
Sellers are showing pressure near resistance.
A breakdown below 77,950 could strengthen bearish momentum.
A strong candle close above 78,046 invalidates this short setup.
Trading Strategy
Wait for bearish candle confirmation.
Enter SELL around 77,970–77,985.
Place SL at 78,046.
Consider partial profit at each target.
This is a 1-minute scalp setup. Wait for candle confirmation; avoid entering blindly.
HM Hanip Mahmud
·
--
🔥 BTC Market Analysis: Is Bitcoin Preparing for a Rebound or Another Drop?
$BTC
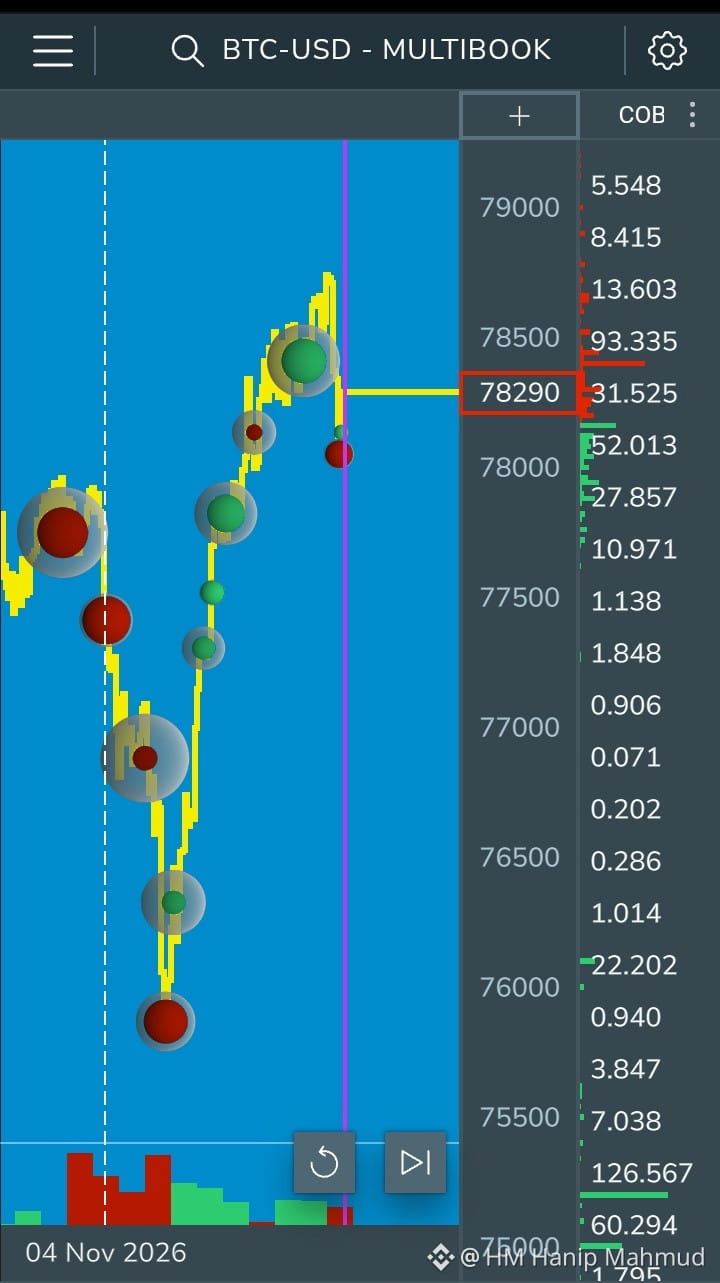
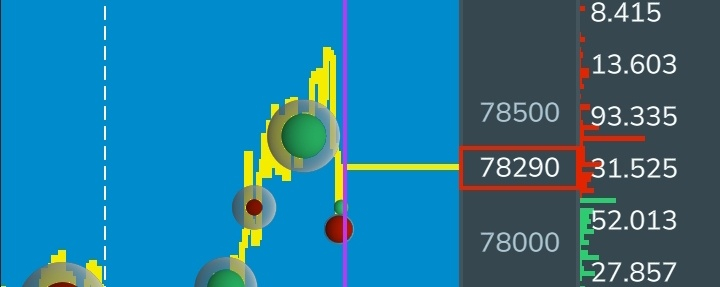
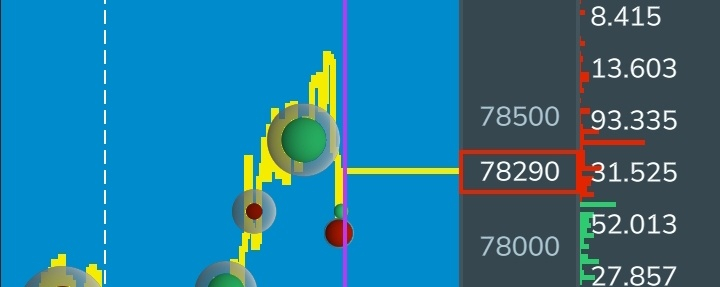
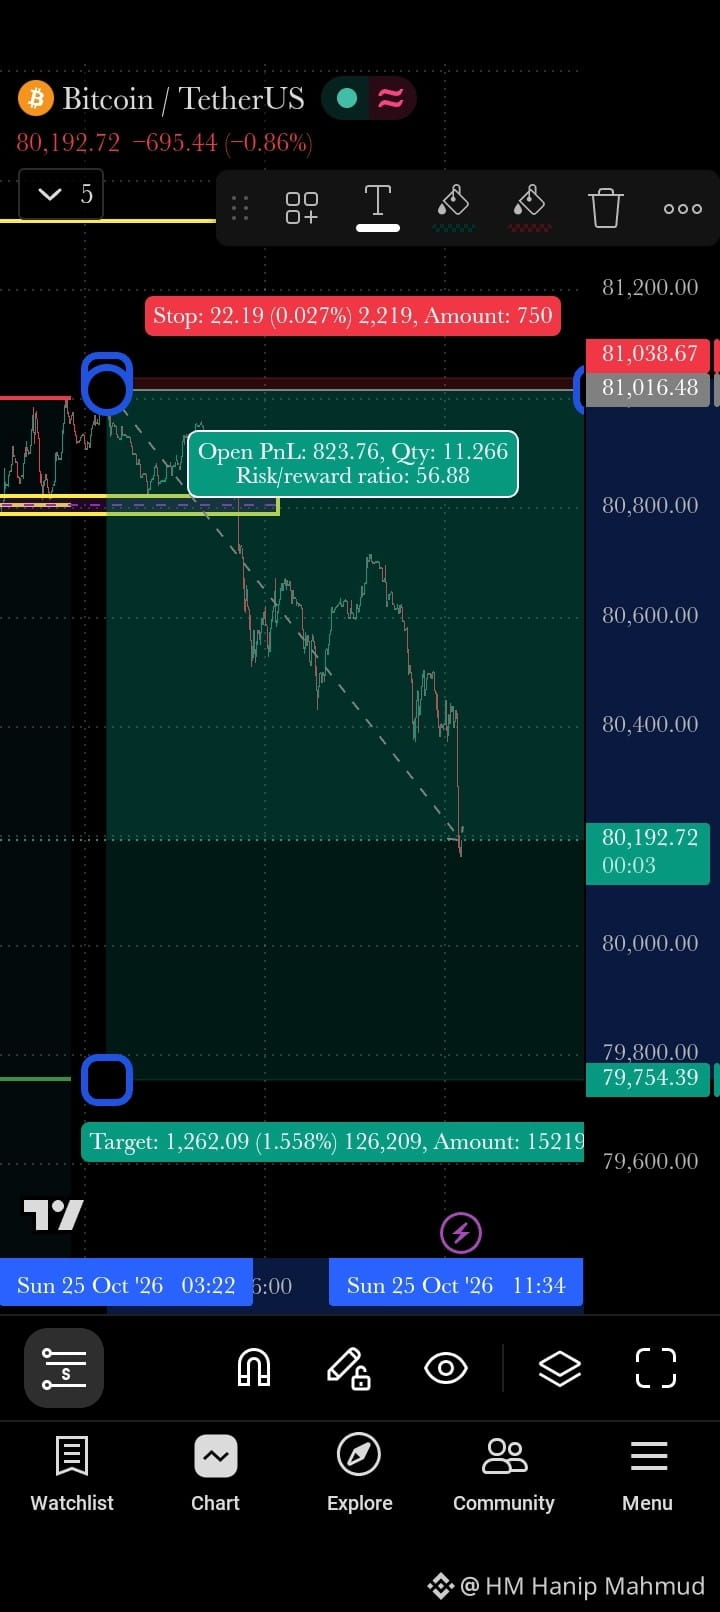
Bitcoin’s short-term price action is showing strong selling pressure, with recent movements highlighting a battle between buyers and sellers. The current order-flow chart provides useful clues about potential support and resistance zones.
📊 Key Market Observations
🔴 1. Selling Pressure
The chart shows a short-term downward move from higher price levels toward the 80,400 area. This suggests that sellers have recently maintained control, although a reversal is not confirmed.
🟢 2. Potential Support Zone
The 80,400–80,450 region is worth watching for signs of buying interest. If buyers defend this area and price forms a strong bullish reaction, BTC could attempt a short-term recovery.
🟡 3. Resistance to Watch
The 80,500–80,600 zone may act as an important resistance area. A strong move above this region, supported by buying volume, could improve the short-term bullish outlook.
📈 Bullish Scenario
If BTC holds support and breaks above nearby resistance with strong buying pressure, a recovery toward higher levels may develop.
📉 Bearish Scenario
If the price breaks below 80,400 and fails to reclaim the level, selling pressure could continue. Traders should watch for confirmation rather than entering based on a single candle.
🎯 My Trading View
For now, BTC requires confirmation before choosing a direction. I would monitor price reactions around support and resistance, along with volume and order-flow changes, before considering a trade.
⚠️ Risk Management: Always use a well-defined stop-loss, manage position size carefully, and avoid emotional trading. This analysis is based on the provided chart screenshot, not live market data.
💬 **What do you think? Will BTC bounce from support or continue moving downward? Share your analysis in the comments!
#Bitcoin #BTC #CryptoAnalysis #BinanceSquare #tradingStrategy
Bitcoin’s short-term price action is showing strong selling pressure, with recent movements highlighting a battle between buyers and sellers. The current order-flow chart provides useful clues about potential support and resistance zones.
📊 Key Market Observations
🔴 1. Selling Pressure
The chart shows a short-term downward move from higher price levels toward the 80,400 area. This suggests that sellers have recently maintained control, although a reversal is not confirmed.
🟢 2. Potential Support Zone
The 80,400–80,450 region is worth watching for signs of buying interest. If buyers defend this area and price forms a strong bullish reaction, BTC could attempt a short-term recovery.
🟡 3. Resistance to Watch
The 80,500–80,600 zone may act as an important resistance area. A strong move above this region, supported by buying volume, could improve the short-term bullish outlook.
📈 Bullish Scenario
If BTC holds support and breaks above nearby resistance with strong buying pressure, a recovery toward higher levels may develop.
📉 Bearish Scenario
If the price breaks below 80,400 and fails to reclaim the level, selling pressure could continue. Traders should watch for confirmation rather than entering based on a single candle.
🎯 My Trading View
For now, BTC requires confirmation before choosing a direction. I would monitor price reactions around support and resistance, along with volume and order-flow changes, before considering a trade.
⚠️ Risk Management: Always use a well-defined stop-loss, manage position size carefully, and avoid emotional trading. This analysis is based on the provided chart screenshot, not live market data.
💬 **What do you think? Will BTC bounce from support or continue moving downward? Share your analysis in the comments!
#Bitcoin #BTC #CryptoAnalysis #BinanceSquare #tradingStrategy
Көбірек контент көру үшін кіріңіз