

#oversold
oversold
285,736 рет көрілді
1,415 адам талқылап жатыр
Қызу саудада
Ең соңғы

·
--
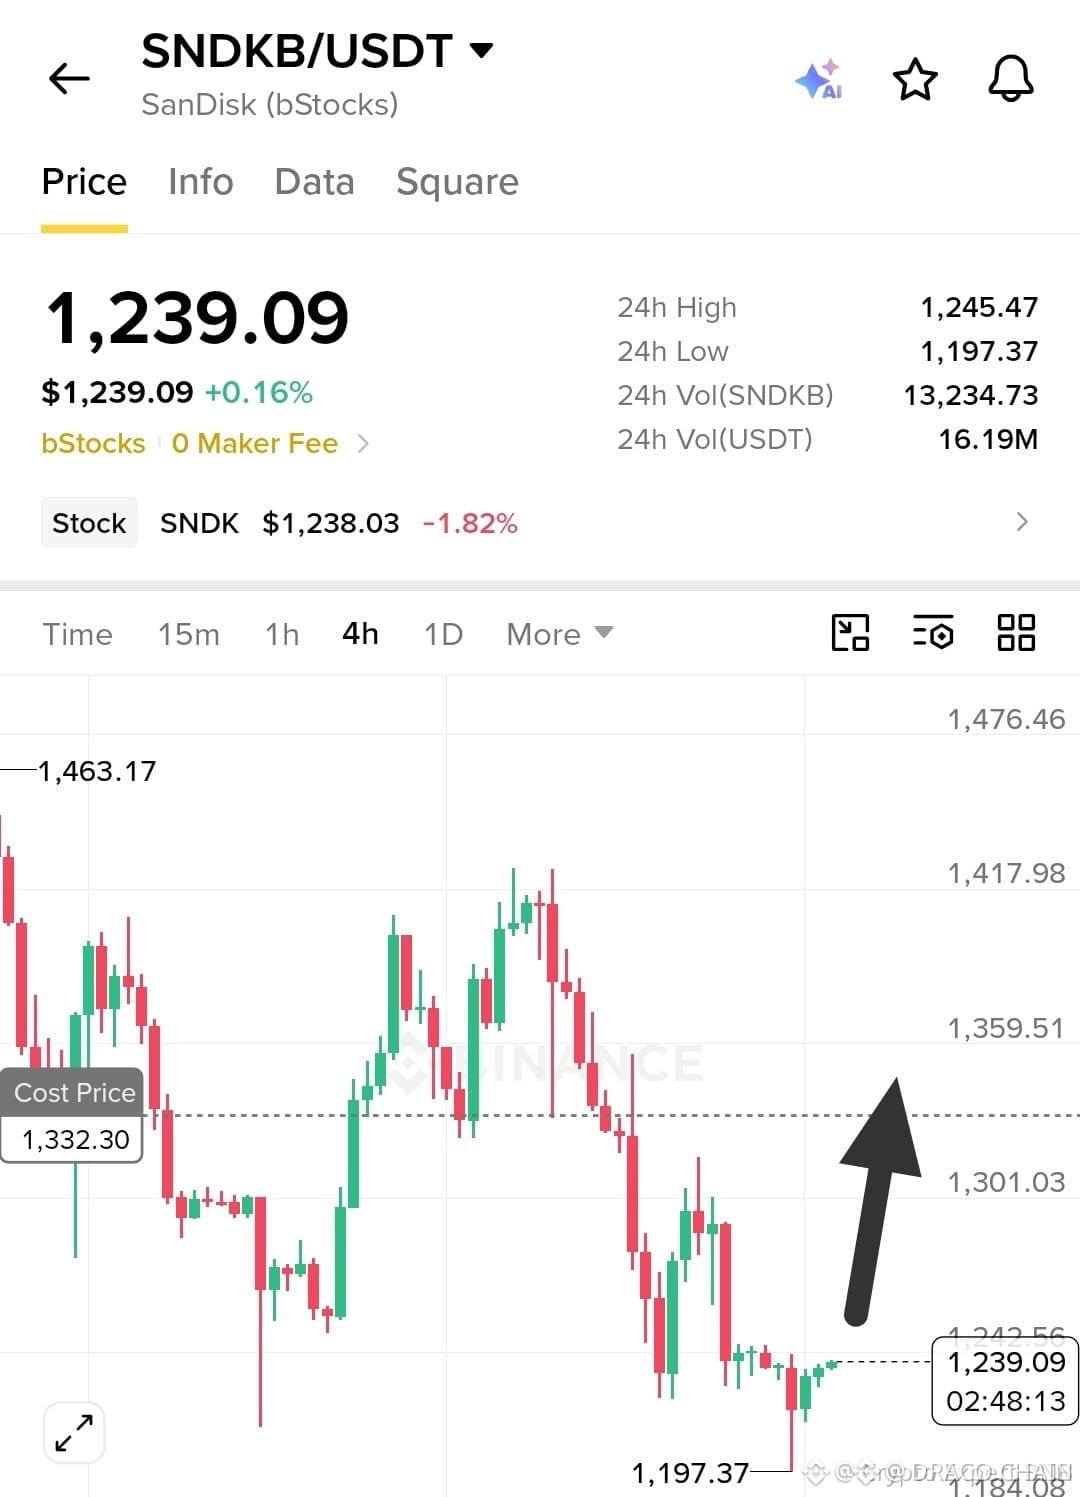
🚨 $SNDK PREPARED FOR A BULLISH REBOUND ABOVE $1,265 📈
Entry: 1239 ⚡
Target: 1265 🚀
Stop Loss: 1205 ⚠️
📊 RSI is flirting with the 30‑zone, marking a deep oversold condition while the $1,210‑$1,240 band cradles solid demand. 📌 A bounce off this pocket could flip the short‑term bias, but the prevailing bearish texture still shadows the chart. 🌊 Confirmation above $1,265 would signal smart‑money liquidity sweep completion and open the path to higher TP tiers. 💡
💬 Are you positioning for the bounce or waiting for the next liquidity trap? 👇
⚠️ Not financial advice. Always manage your risk. 🛡️
🏷️ #SNDK #LongSetup #Oversold #Crypto
🔥 💎
4

·
--
Төмен (кемімелі)
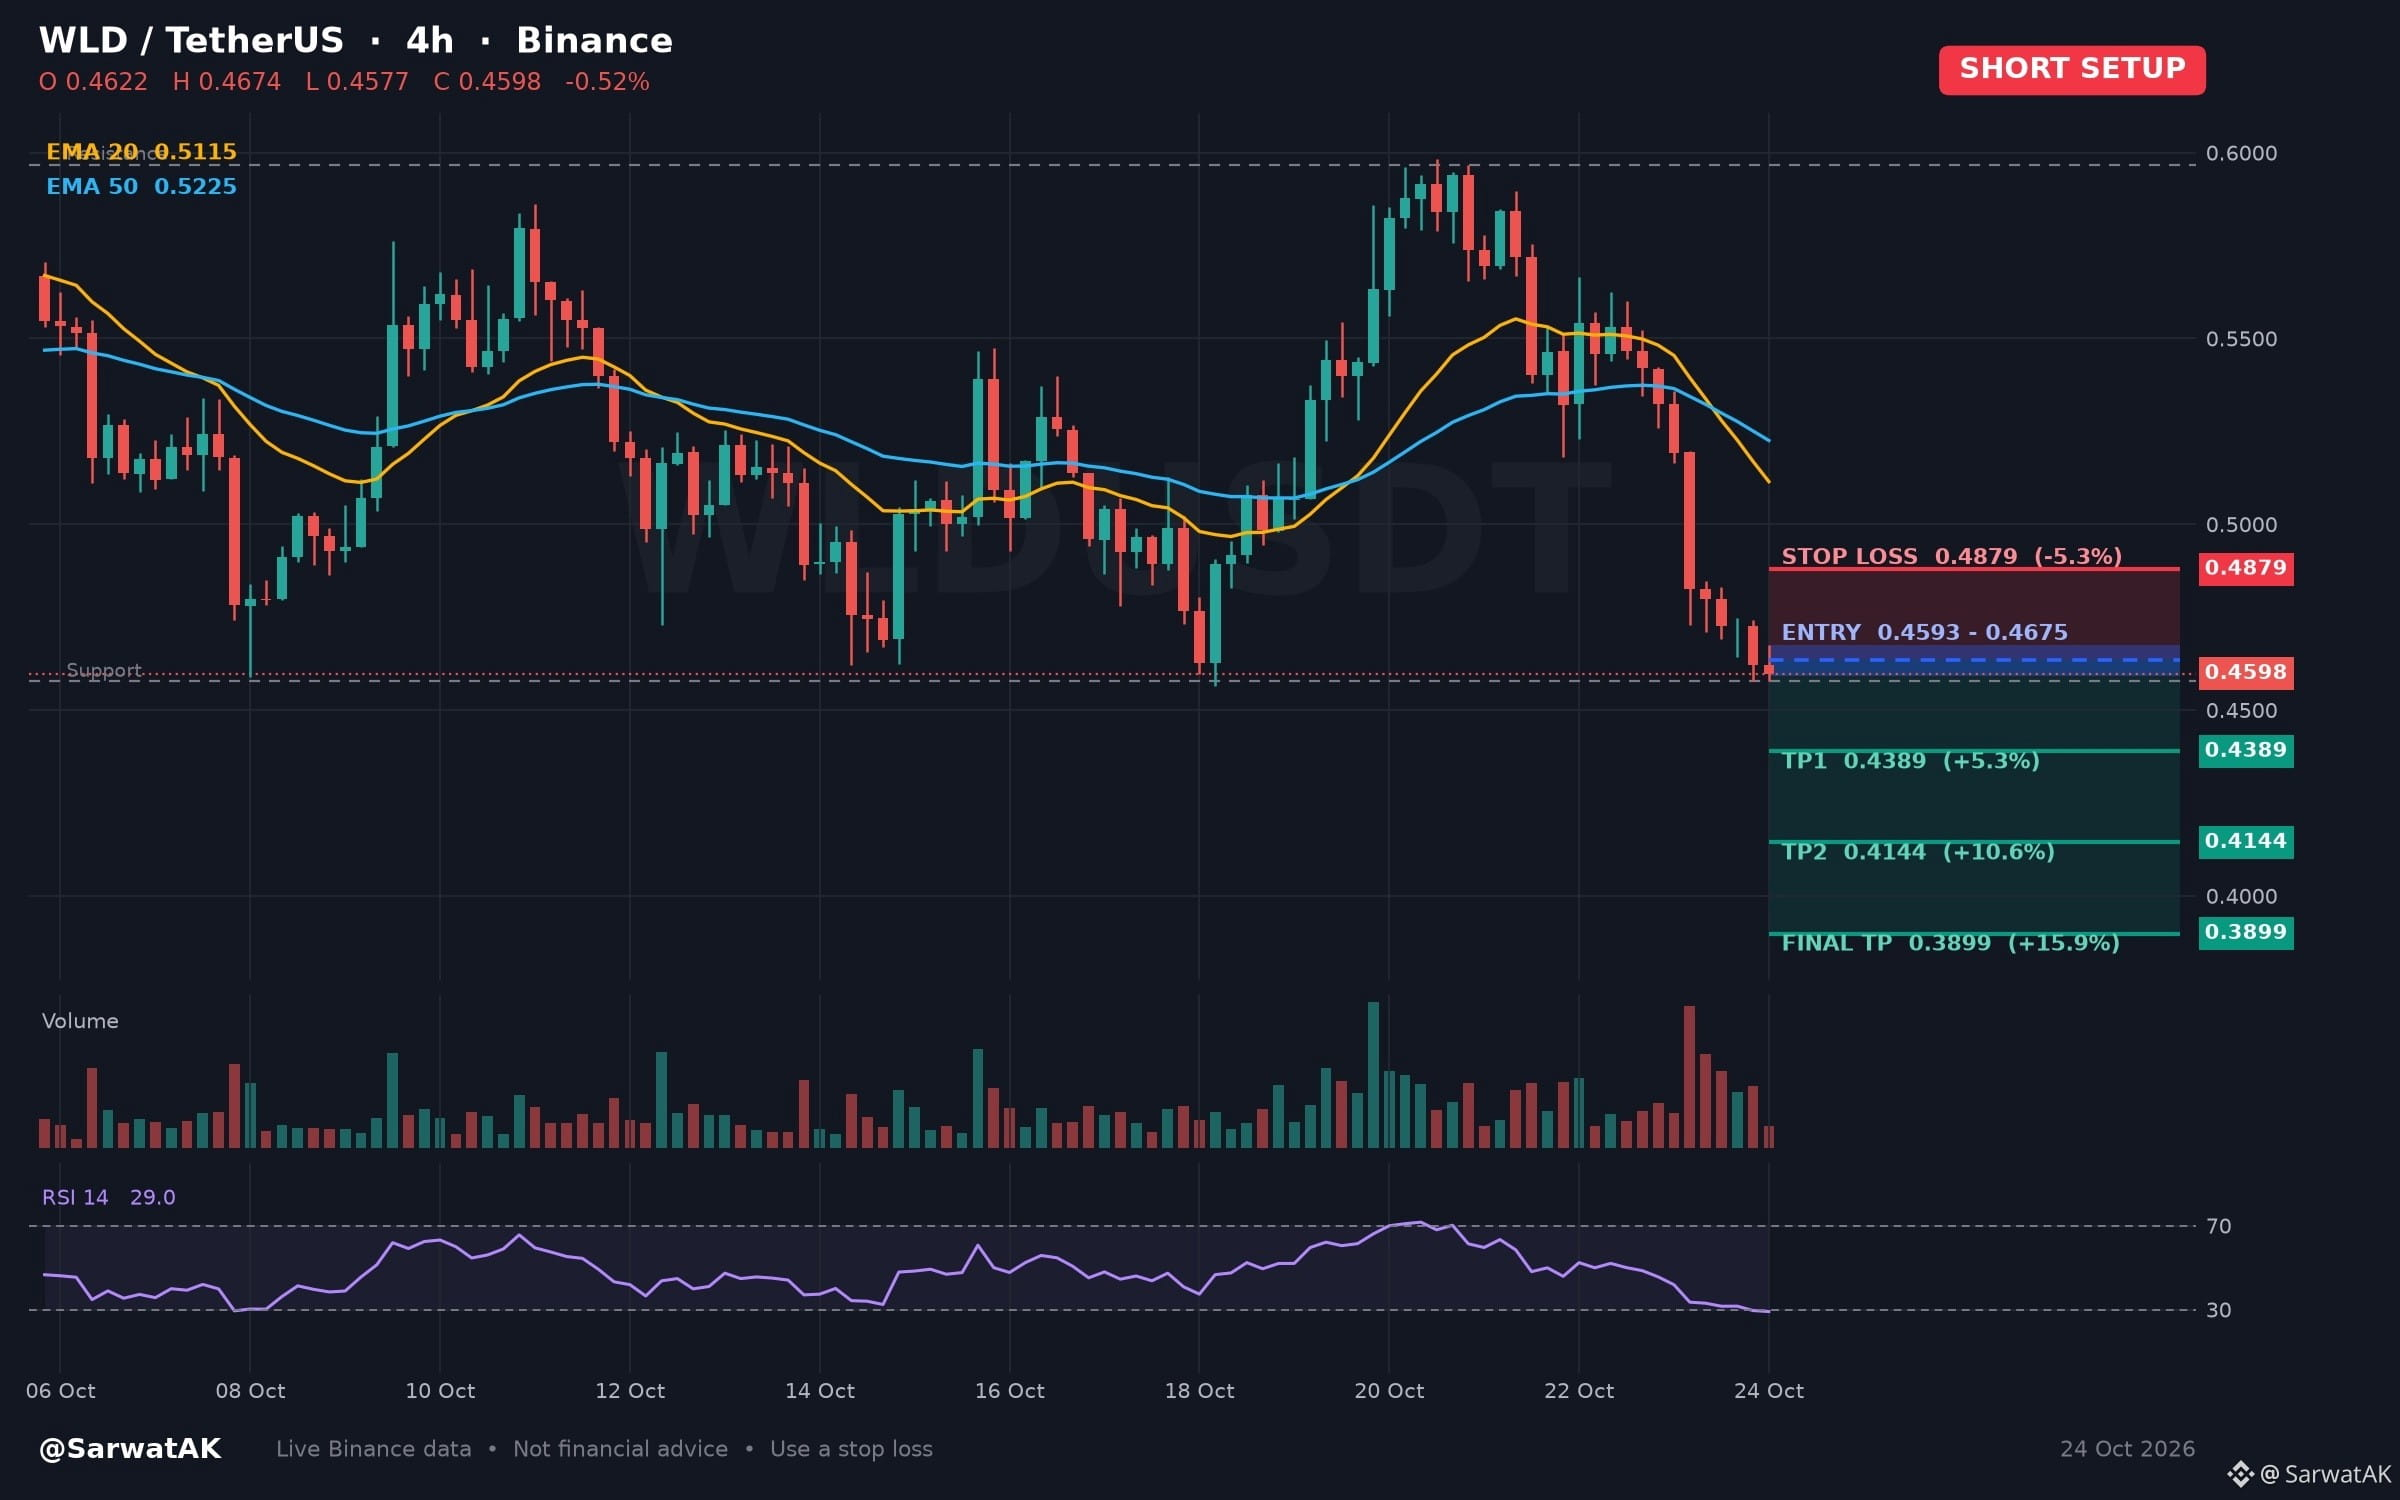
$WLD SHORT SETUP ... NEXT TARGET 0.3899
Oversold Relative Strength Follows Downward Movement on Four-Hour Chart
Entry: 0.4593 - 0.4675 (Short)
TP1: 0.4389
TP2: 0.4144
Final TP: 0.3899
SL: 0.4879
Downward price action over the past twenty-four hours has pushed the four-hour relative strength index into oversold territory. Traders assessing this setup observe whether momentum stabilizes or extended selling pressure persists.
As long as price stays below 0.4675, structure stays heavy
Must use stop loss while trading
Trade $WLD
Not financial advice. Always DYOR.
Like & Follow for Daily Trade Analytics & Insider News. @SarwatAK
#WLD #Oversold #HotTrends
{spot}(WLDUSDT)
$WLD SHORT SETUP ... NEXT TARGET 0.3899
Oversold Relative Strength Follows Downward Movement on Four-Hour Chart
Entry: 0.4593 - 0.4675 (Short)
TP1: 0.4389
TP2: 0.4144
Final TP: 0.3899
SL: 0.4879
Downward price action over the past twenty-four hours has pushed the four-hour relative strength index into oversold territory. Traders assessing this setup observe whether momentum stabilizes or extended selling pressure persists.
As long as price stays below 0.4675, structure stays heavy
Must use stop loss while trading
Trade $WLD
Not financial advice. Always DYOR.
Like & Follow for Daily Trade Analytics & Insider News. @SarwatAK
#WLD #Oversold #HotTrends
1
332

·
--
🚀 $XRP TEETERING AT SUPPORT, RSI SAYS BULLISH REBOUND? 📈
Entry: $1.28 ⚡
Target: $1.39 🚀
Stop Loss: $1.26 ⚠️
📊 The RSI has plunged to 17.35, screaming oversold territory while volume still fuels the downtrend. 📈 A bounce off the $1.26 floor could flip the script, but sellers are still pressing hard above the $1.31‑$1.32 EMA wall. 🦈 If buyers reclaim the $1.30 zone, the next hurdle is the $1.39 ceiling that’s been holding the last rally. 💡 Will the liquidity sweep finally flip, or will the bears drive XRP deeper? 🤔
⚠️ Not financial advice. Always manage your risk. 🛡️
🏷️ #XRP #LongSetup #Oversold #Crypto
🔥 💎
10

#Overbought & #oversold
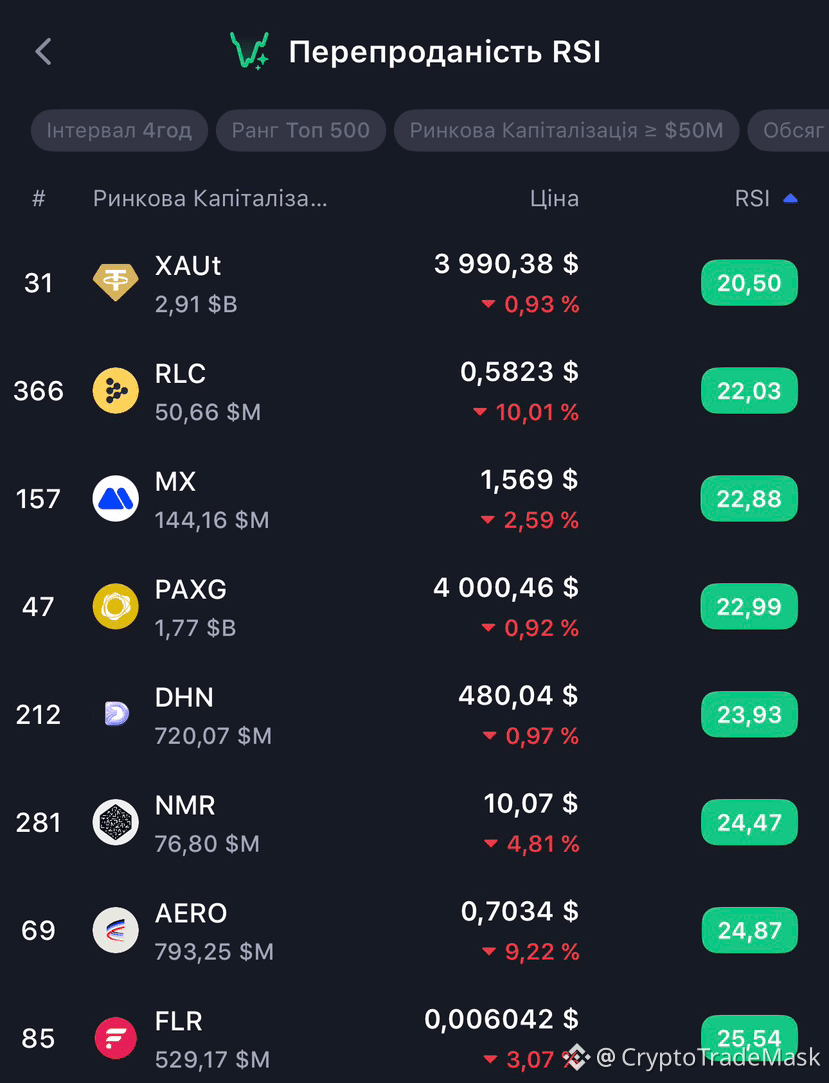
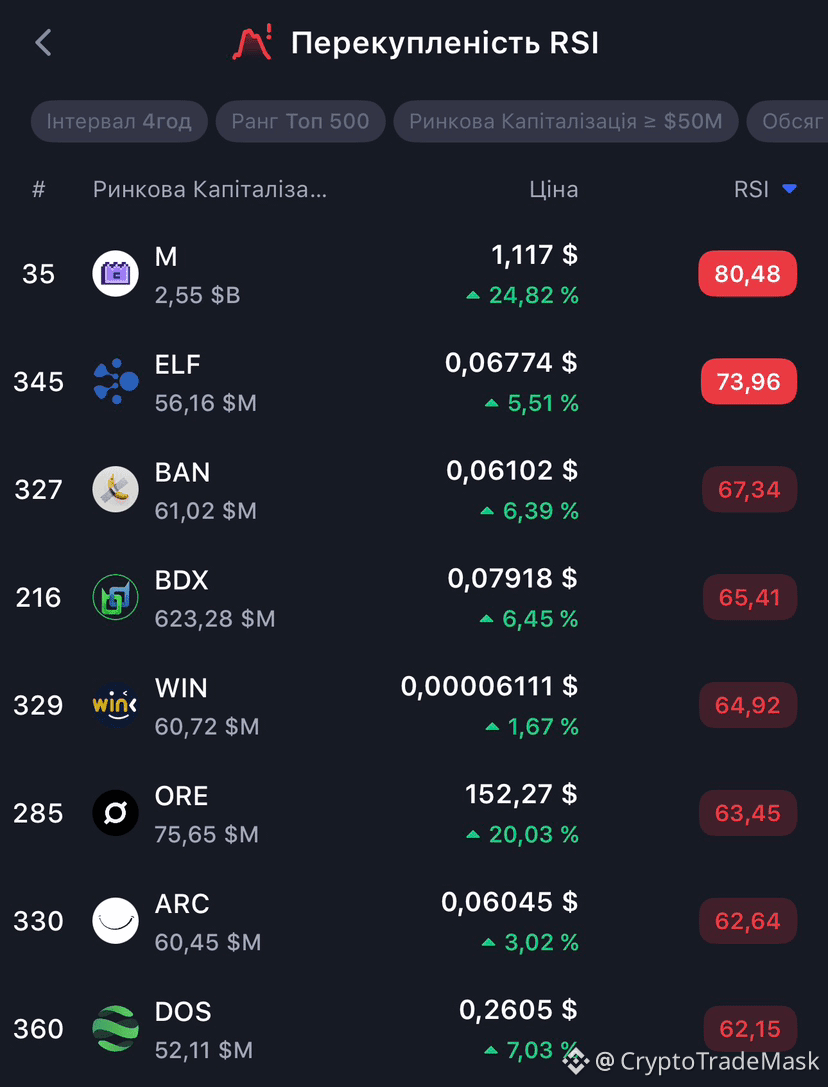
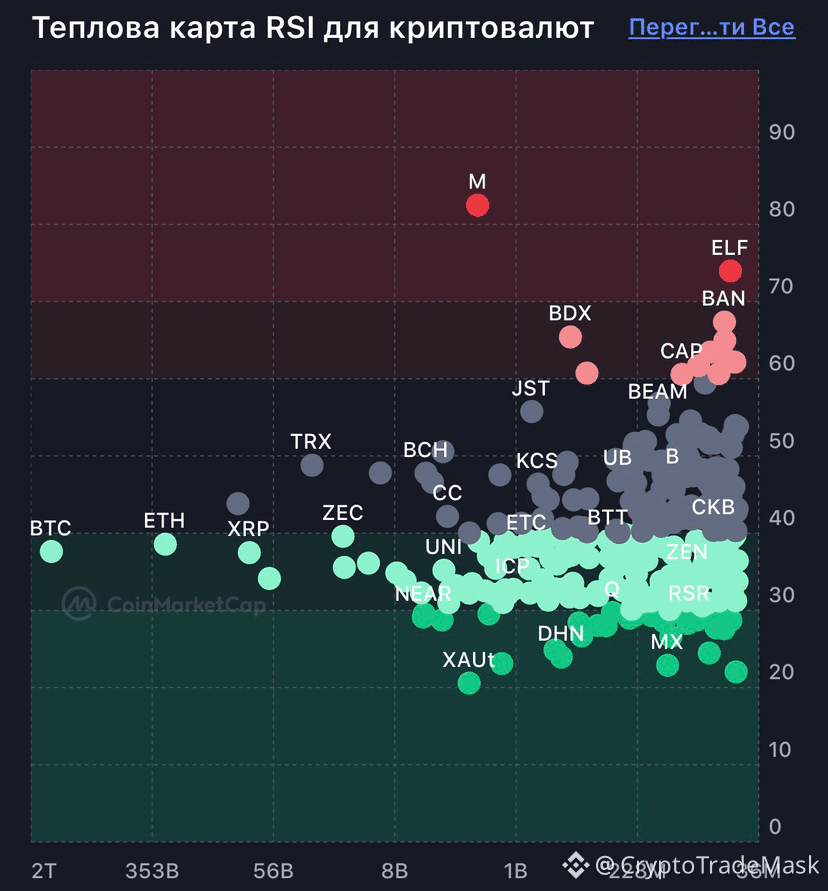
📊 Overbought & Oversold: How does it work? 📈📉
Key market zones that indicate when the price may reverse.
🟢 Oversold
• The price has fallen too low - temporarily or excessively.
• RSI < 30.
• There may be a chance of a rebound - the asset is becoming interesting to buy.
• Many coins are now in this zone: $XAUT ,$RLC
- a bottom may be forming.
🔴 Overbought
• The price has risen too much.
• RSI > 70.
• A correction or pause after growth is likely - it's time to take profits.
• In this zone now: $ELF - a cooling after a surge is possible.
⚠️ Rule of thumb: no indicator gives guarantees - they are only hints, not a verdict.
{future}(PAXGUSDT)
{future}(RLCUSDT)
{future}(XAUTUSDT)
#Overbought & #oversold
📊 Overbought & Oversold: How does it work? 📈📉
Key market zones that indicate when the price may reverse.
🟢 Oversold
• The price has fallen too low - temporarily or excessively.
• RSI < 30.
• There may be a chance of a rebound - the asset is becoming interesting to buy.
• Many coins are now in this zone: $XAUT ,$RLC
- a bottom may be forming.
🔴 Overbought
• The price has risen too much.
• RSI > 70.
• A correction or pause after growth is likely - it's time to take profits.
• In this zone now: $ELF - a cooling after a surge is possible.
⚠️ Rule of thumb: no indicator gives guarantees - they are only hints, not a verdict.
1
608

🚨 $XRP NEARS CRITICAL SUPPORT AT $1.26 – RSI SAYS OVERSOLD 💥
📊 The RSI plunges to 17.35, a textbook extreme oversold reading that often precedes a short‑term relief rally. ⚡ Yet the token remains entrenched below every EMA (12‑200), signaling that smart money has yet to flip the bias.
📌 Immediate support at $1.26 has rebounded three times since August, acting as a liquidity pool for buyers. If that zone cracks, the next cushion sits around $1.15‑$1.14, exposing XRP to a deeper correction.
💬 Will buyers seize the $1.26 defense or let XRP slip deeper?
⚠️ Not financial advice. Always manage your risk. 🛡️
🏷️ #XRP #Oversold #ShortSetup #Crypto
🦈 📊
11
·
--
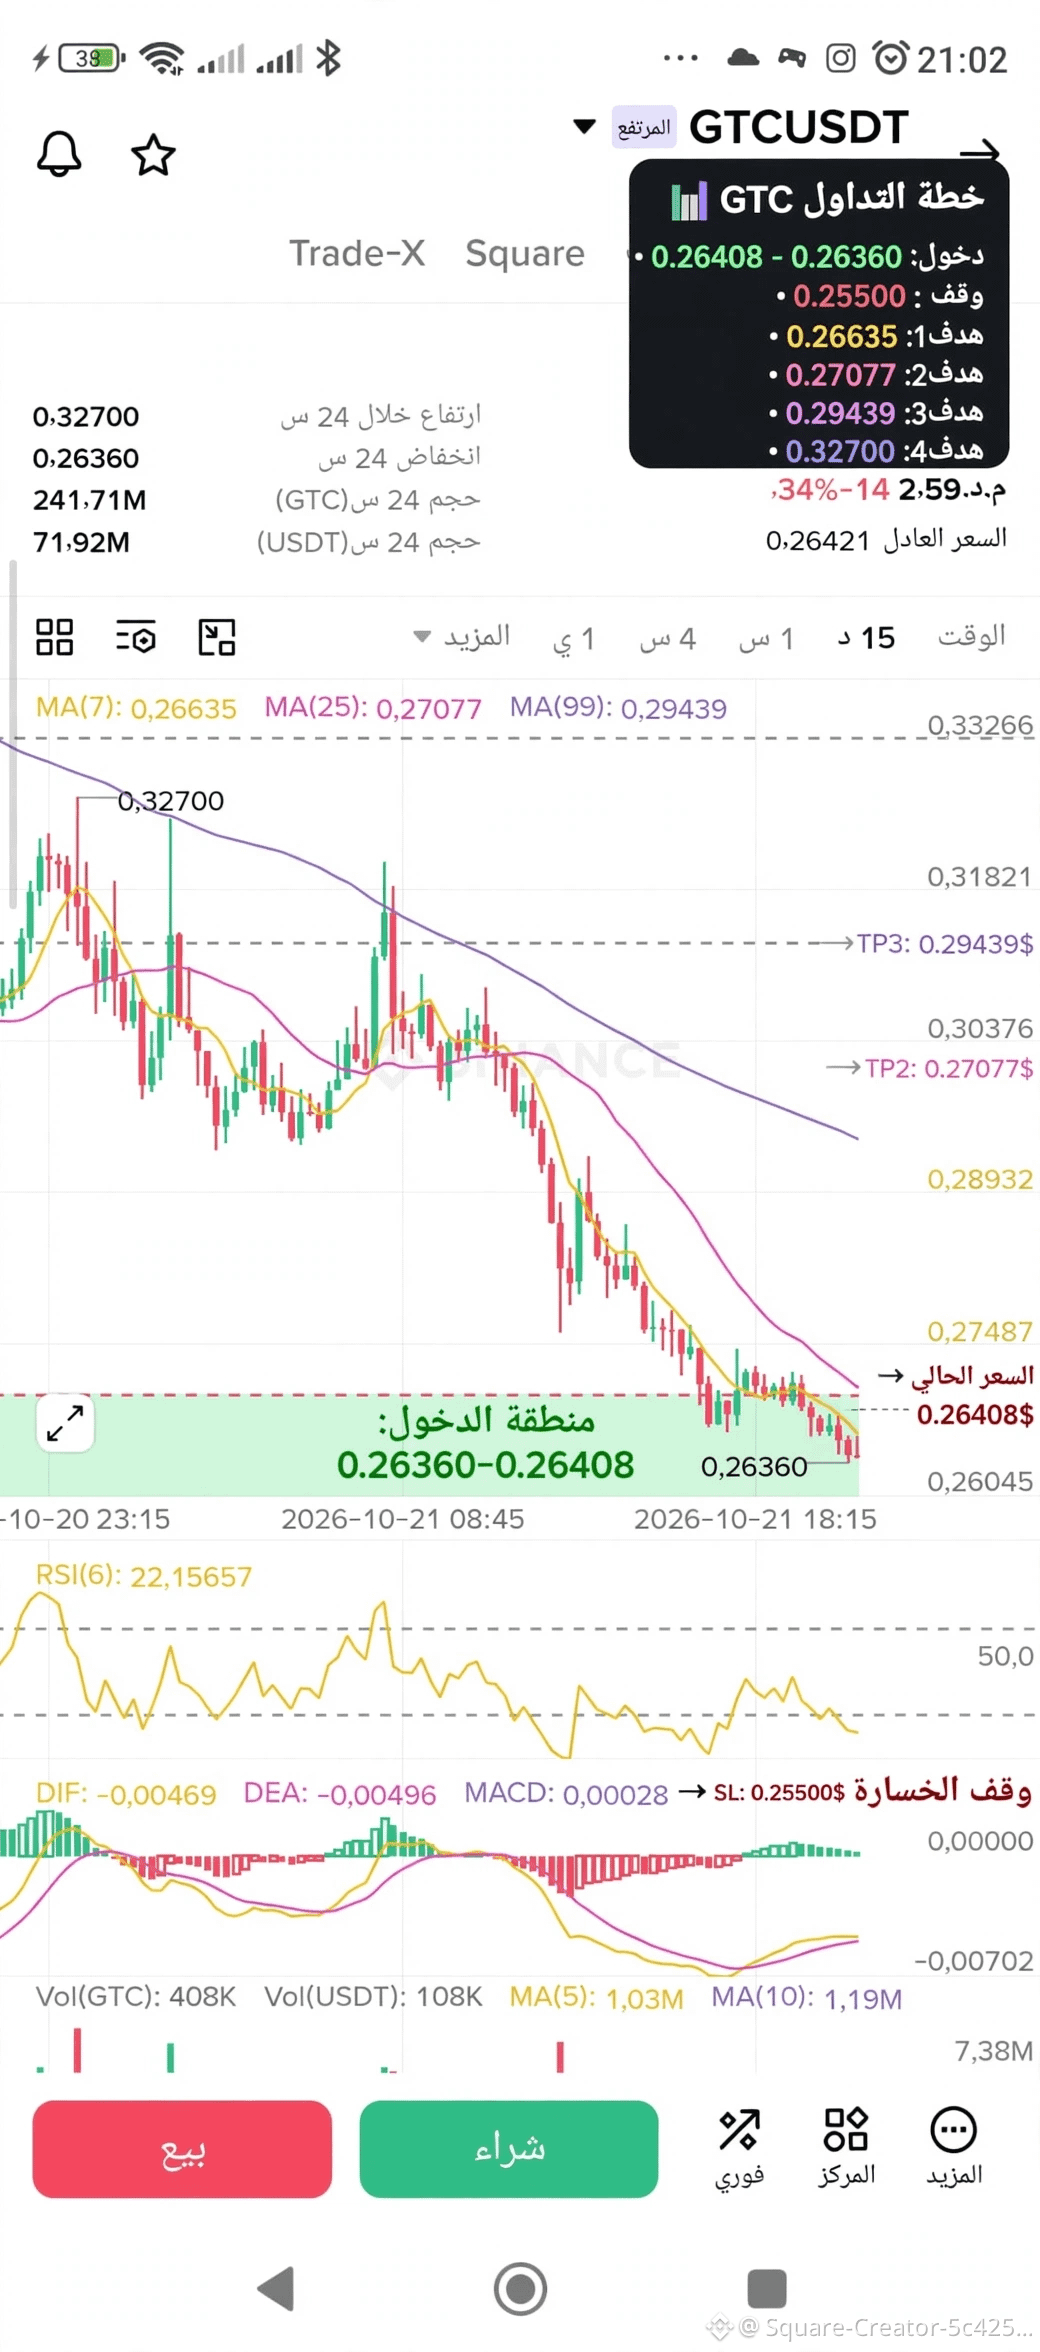
$GTC
📉 نازل من 0,32700$ ل 0,26360$ = -19% - دابا فالقاع التام
*خطة التداول:*
🟢 دخول: 0,26360$ - 0,26408$ (القاع الحالي - المنطقة الخضراء)
🔴 وقف: 0,25500$ (-3,4%)
🎯 الأهداف:
هدف 1: 0,26635$ = MA7 (+0,8%)
هدف 2: 0,27077$ = MA25 (+2,5%)
هدف 3: 0,29439$ = MA99 (+11%)
هدف 4: 0,32700$ = القمة السابقة (+23%)
📊 RSI 22,15 = Oversold قاصح بزاف - قريب جدا من ارتداد
MACD أخضر ولو صغير = بداية انعكاس
RSI 22 = تشبع بيعي تاريخي
ENTRY: 0.26360-0.26408
SL: 0.25500
TP1: 0.26635
TP2: 0.27077
TP3: 0.29439
TP4: 0.32700
Risk 3.4% / Reward 23% 🚀
#GTC #Gitcoin #Binance #Oversold
risk_best:
no it will fall soon
1
2
516

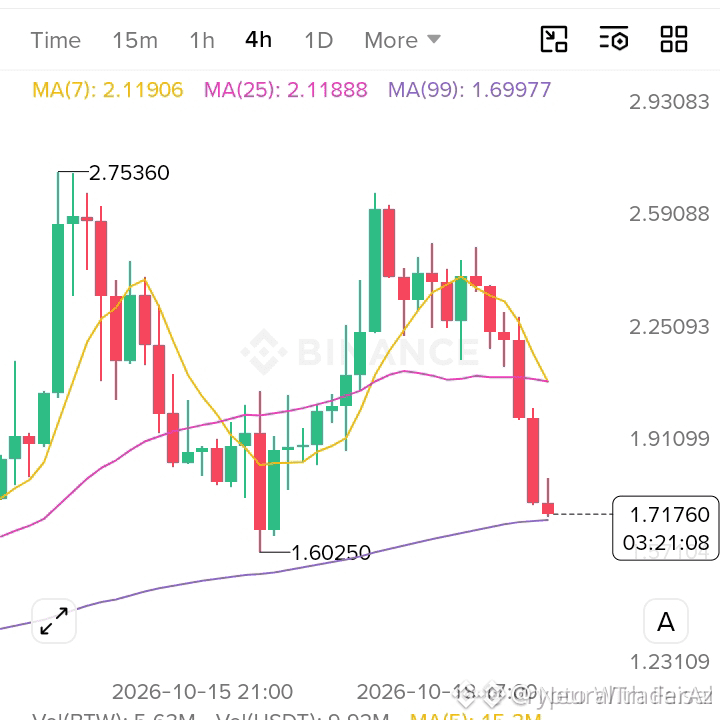
🚨 $BTW WIPES 21% INTO CRITICAL SUPPORT AS OVERCROWDED SHORTS RISK A SQUEEZE! ⚡
Entry: 1.699 🟢
📌 After a steep -21.81% flush, $BTW is testing its MA(99) dynamic baseline at $1.699, an area ripe for institutional absorption. With 61.26% of the market heavily positioned short, liquidity is aggressively stacked overhead, elevating the probability of a violent squeeze.
🌊 The 6-period RSI has collapsed into deeply oversold territory at 19.31 as price tests the $1.69 structural floor. Continuing to short at these extremes presents an asymmetric risk profile, making a technical relief rotation far more compelling.
💬 Are you positioning for a mean reversion bounce here, or do you anticipate structural breakdown? 👇
⚠️ Not financial advice. Always manage your risk. 🛡️
🏷️ #BTW #Crypto #Oversold #Altcoins
🎯 🦈
4

·
--
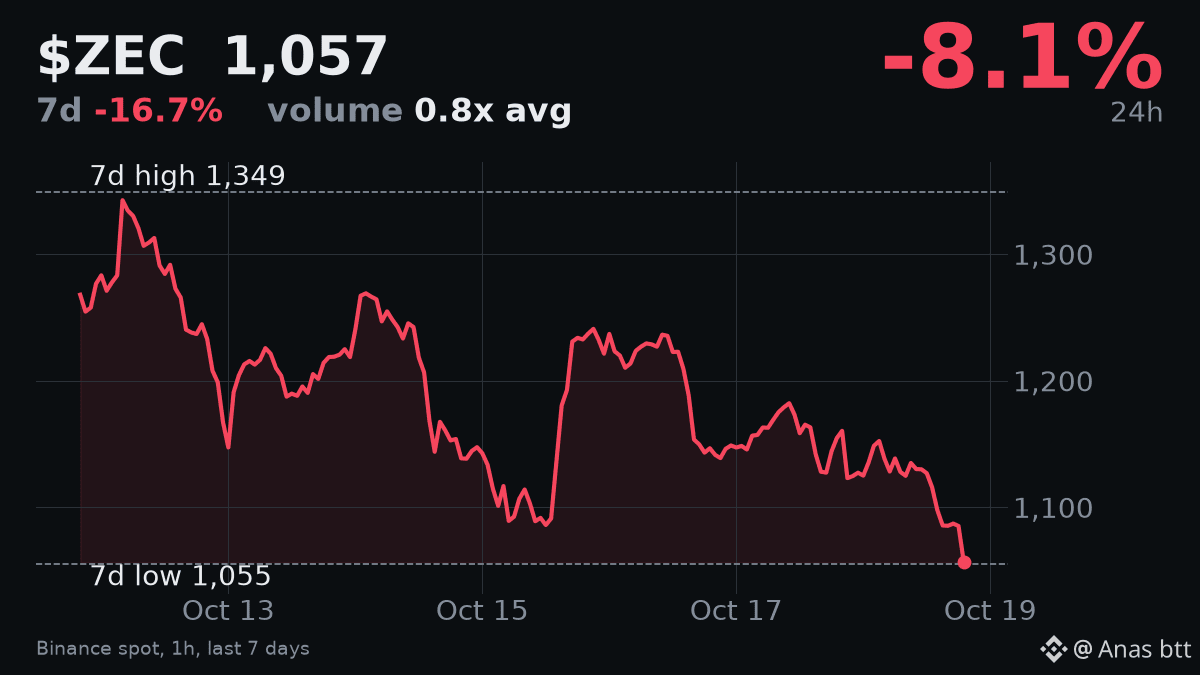
$ZEC has dropped significantly, down over 8% in the last 24 hours to $1057.44. This extends its 7-day decline to over 16%.
It now trades more than 21% below its 7-day high of $1349.3. Current 24-hour trading volume is low, at only 75% of its 7-day average. The 14-hour RSI is at a very low 23.3.
My view is neutral for now. The low RSI suggests $ZEC is oversold, but the weak volume on this downtrend does not give confidence for a reversal. I would become bullish if I saw a clear bounce from the 7-day low of $1055.03, confirmed by a significant increase in buying volume. A break below $1055.03 on heavy volume would suggest further downside.
I am watching for a clear reversal candle with strong volume above the 7-day low.
#ZEC #Oversold
1
435
#Overbought & #oversold
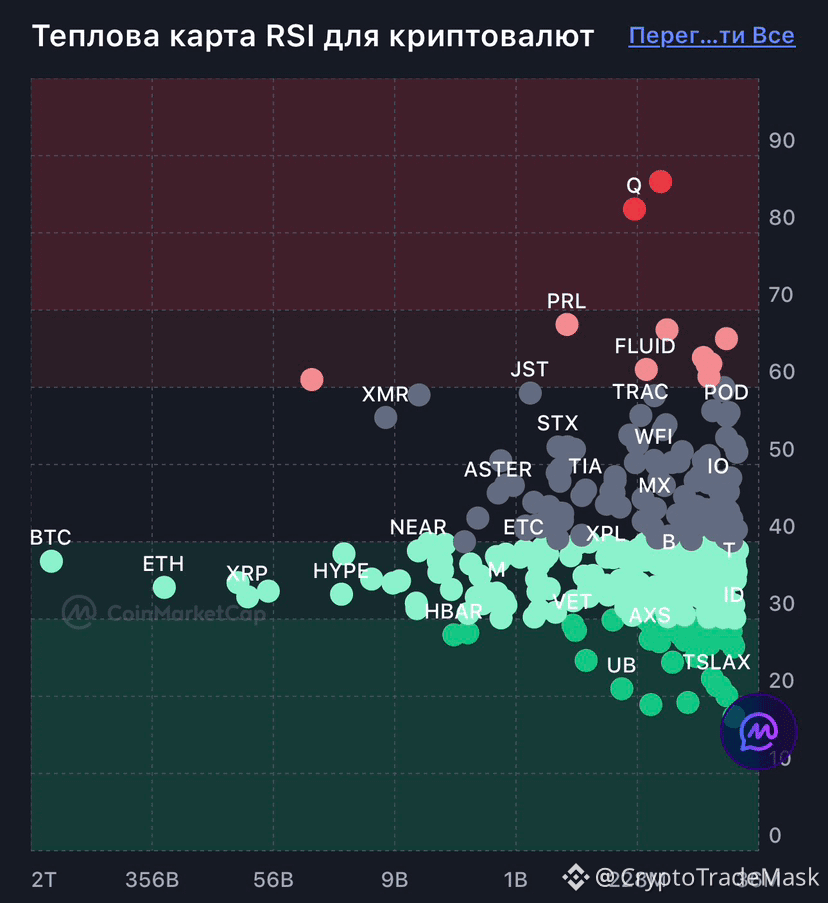
📊 Overbought & Oversold: How does it work? 📈📉
Key market zones that indicate when the price may reverse.
🟢 Oversold
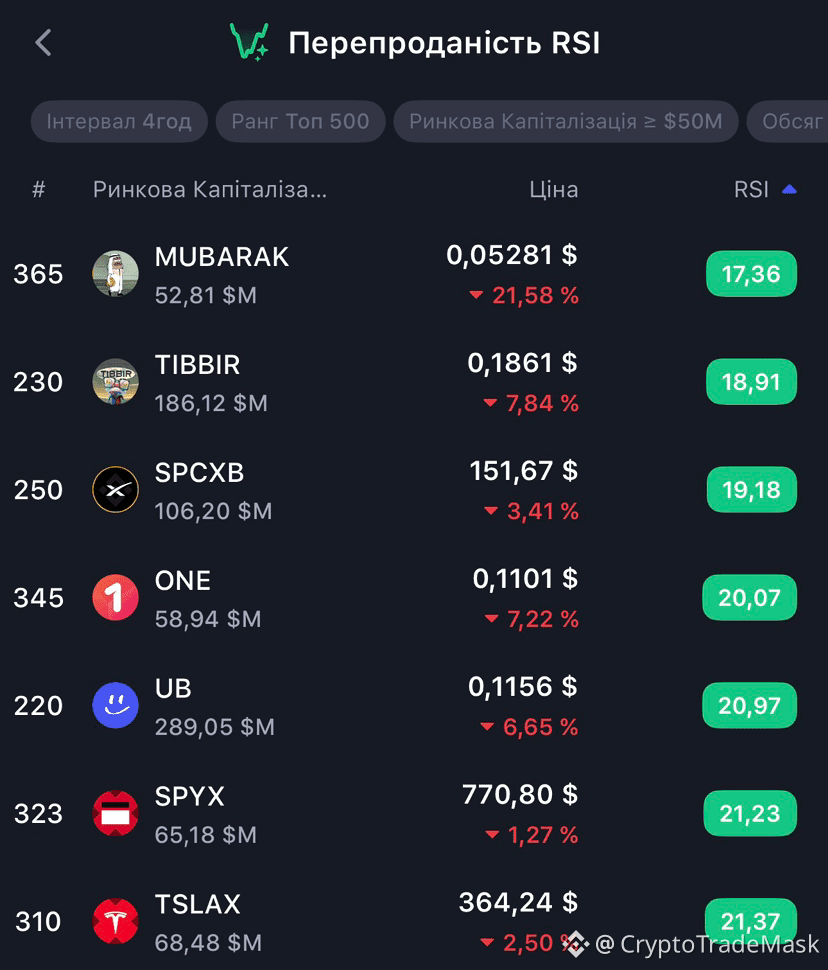
• The price has fallen too low - temporarily or excessively.
• RSI < 30.
• There may be a chance of a rebound - the asset is becoming interesting to buy.
• Many coins are now in this zone: $MUBARAK , $SPCXB - a bottom may be forming.
🔴 Overbought
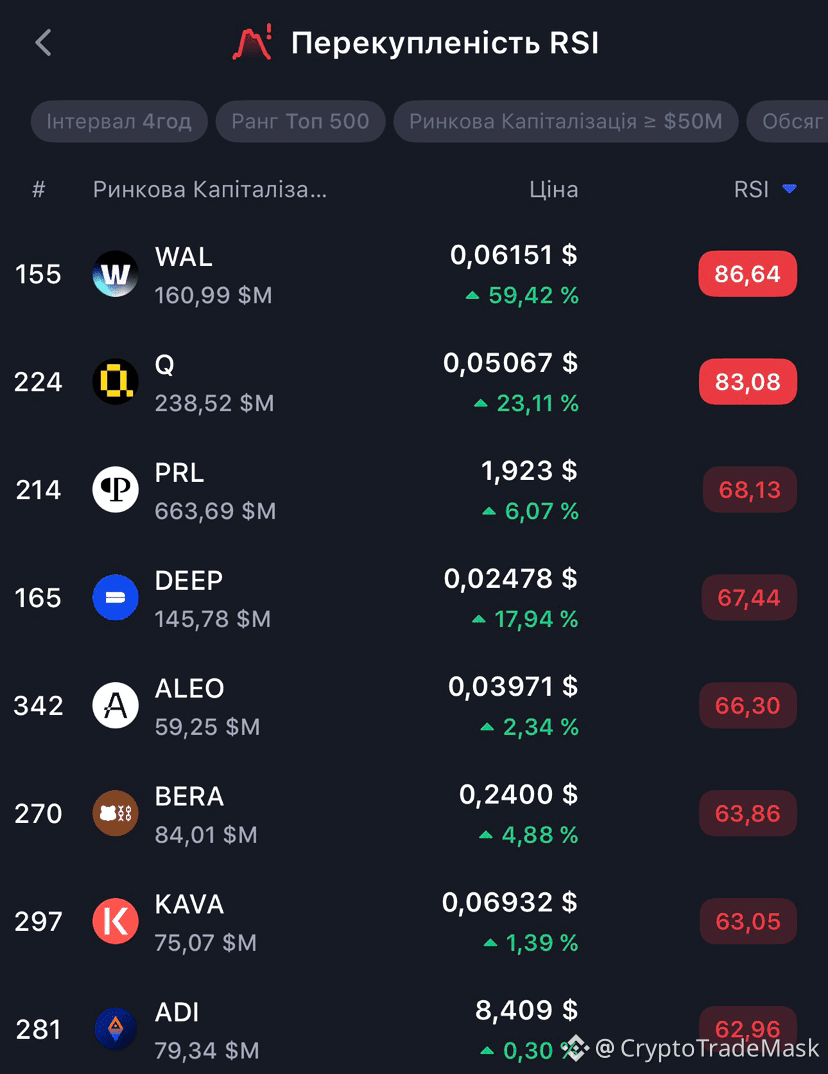
• The price has risen too much.
• RSI > 70.
• A correction or pause after growth is likely - it's time to take profits.
• In this zone now: $WAL - a cooling after a surge is possible.
⚠️ Rule of thumb: no indicator gives guarantees - they are only hints, not a verdict.
{spot}(SPCXBUSDT)
{future}(WALUSDT)
{future}(MUBARAKUSDT)
#Overbought & #oversold
📊 Overbought & Oversold: How does it work? 📈📉
Key market zones that indicate when the price may reverse.
🟢 Oversold
• The price has fallen too low - temporarily or excessively.
• RSI < 30.
• There may be a chance of a rebound - the asset is becoming interesting to buy.
• Many coins are now in this zone: $MUBARAK , $SPCXB - a bottom may be forming.
🔴 Overbought
• The price has risen too much.
• RSI > 70.
• A correction or pause after growth is likely - it's time to take profits.
• In this zone now: $WAL - a cooling after a surge is possible.
⚠️ Rule of thumb: no indicator gives guarantees - they are only hints, not a verdict.
1
61
#Overbought & #oversold
📊 Overbought & Oversold: How does it work? 📈📉
Key market zones that indicate when the price may reverse.
🟢 Oversold
• The price has fallen too low - temporarily or excessively.
• RSI < 30.
• There may be a chance of a rebound - the asset is becoming interesting to buy.
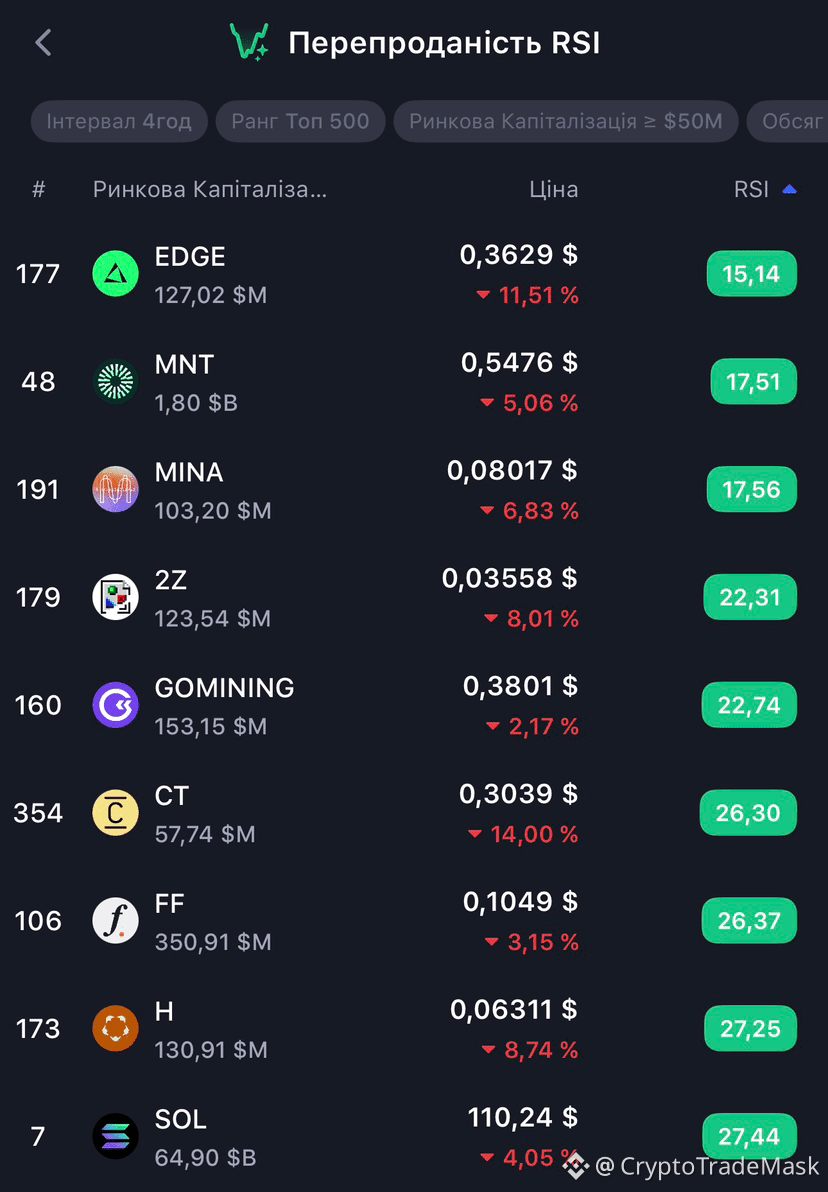
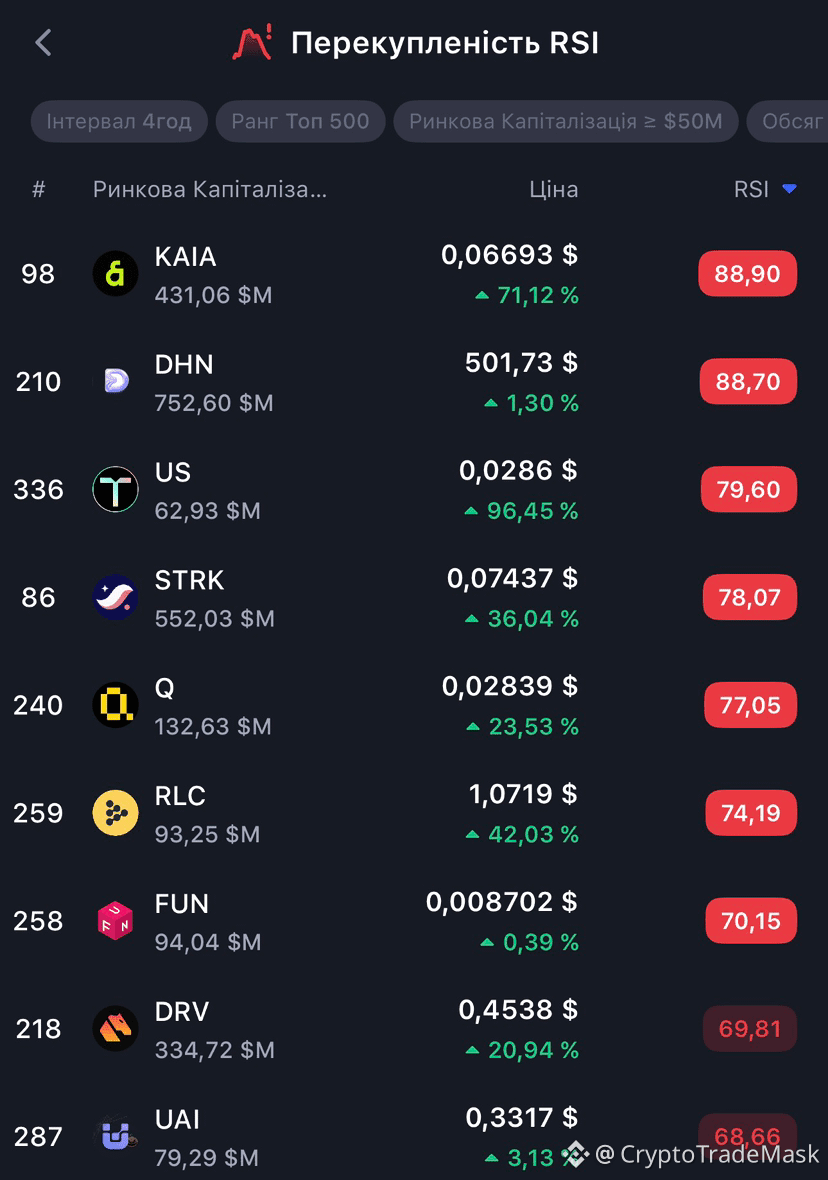
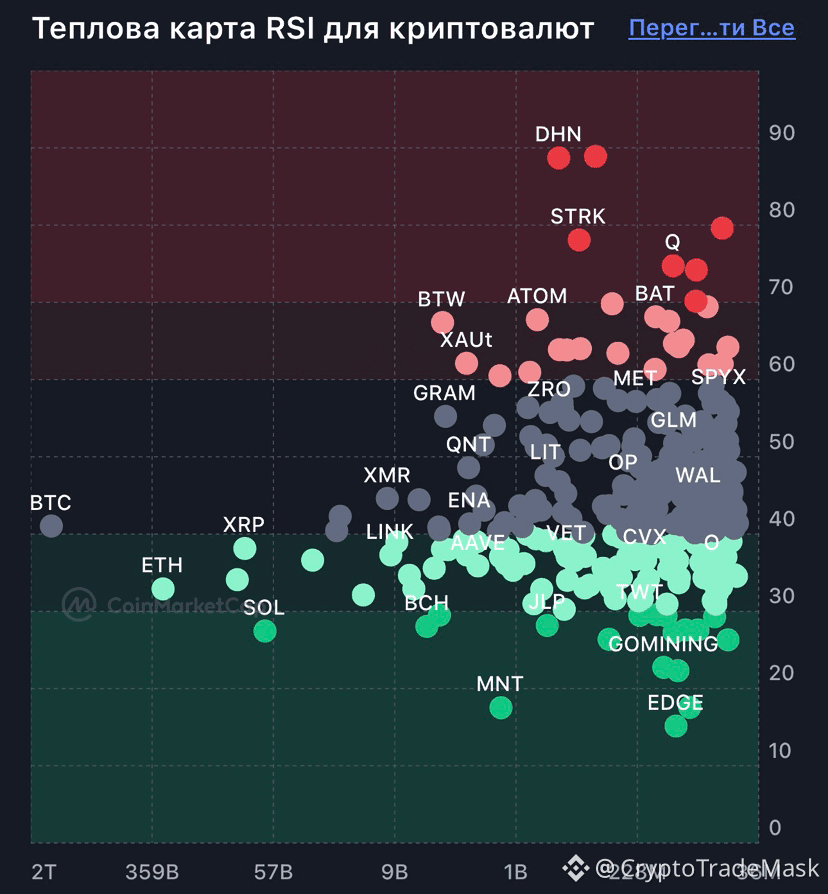
• Many coins are now in this zone: $EDGE - a bottom may be forming.
🔴 Overbought
• The price has risen too much.
• RSI > 70.
• A correction or pause after growth is likely - it's time to take profits.
• In this zone now: $KAIA , $STRK - a cooling after a surge is possible.
⚠️ Rule of thumb: no indicator gives guarantees - they are only hints, not a verdict.
{future}(STRKUSDT)
{future}(KAIAUSDT)
{future}(EDGEUSDT)
#Overbought & #oversold
📊 Overbought & Oversold: How does it work? 📈📉
Key market zones that indicate when the price may reverse.
🟢 Oversold
• The price has fallen too low - temporarily or excessively.
• RSI < 30.
• There may be a chance of a rebound - the asset is becoming interesting to buy.
• Many coins are now in this zone: $EDGE - a bottom may be forming.
🔴 Overbought
• The price has risen too much.
• RSI > 70.
• A correction or pause after growth is likely - it's time to take profits.
• In this zone now: $KAIA , $STRK - a cooling after a surge is possible.
⚠️ Rule of thumb: no indicator gives guarantees - they are only hints, not a verdict.
146

$BTC
{future}(BTCUSDT)
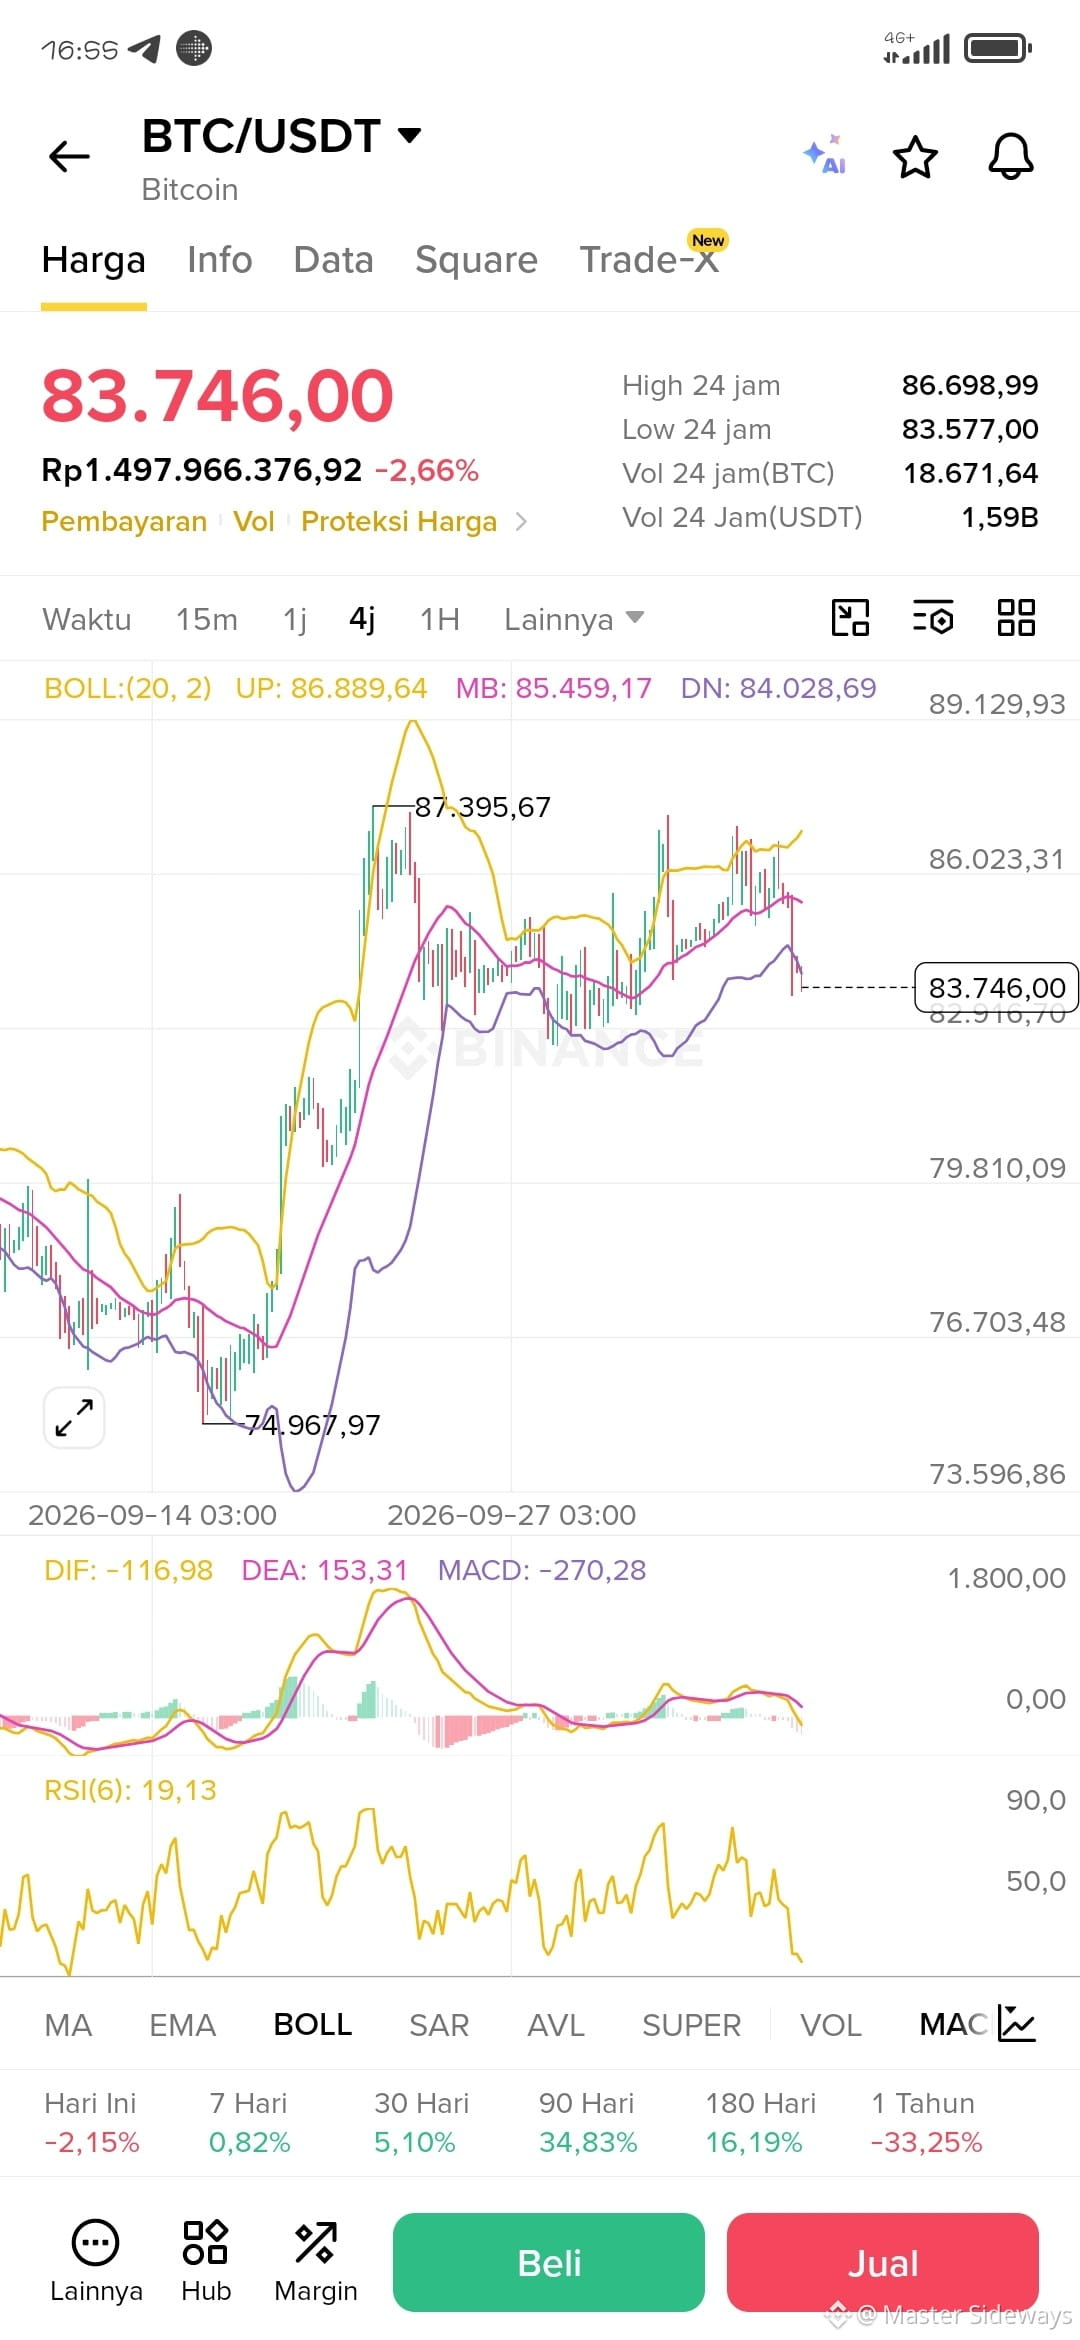
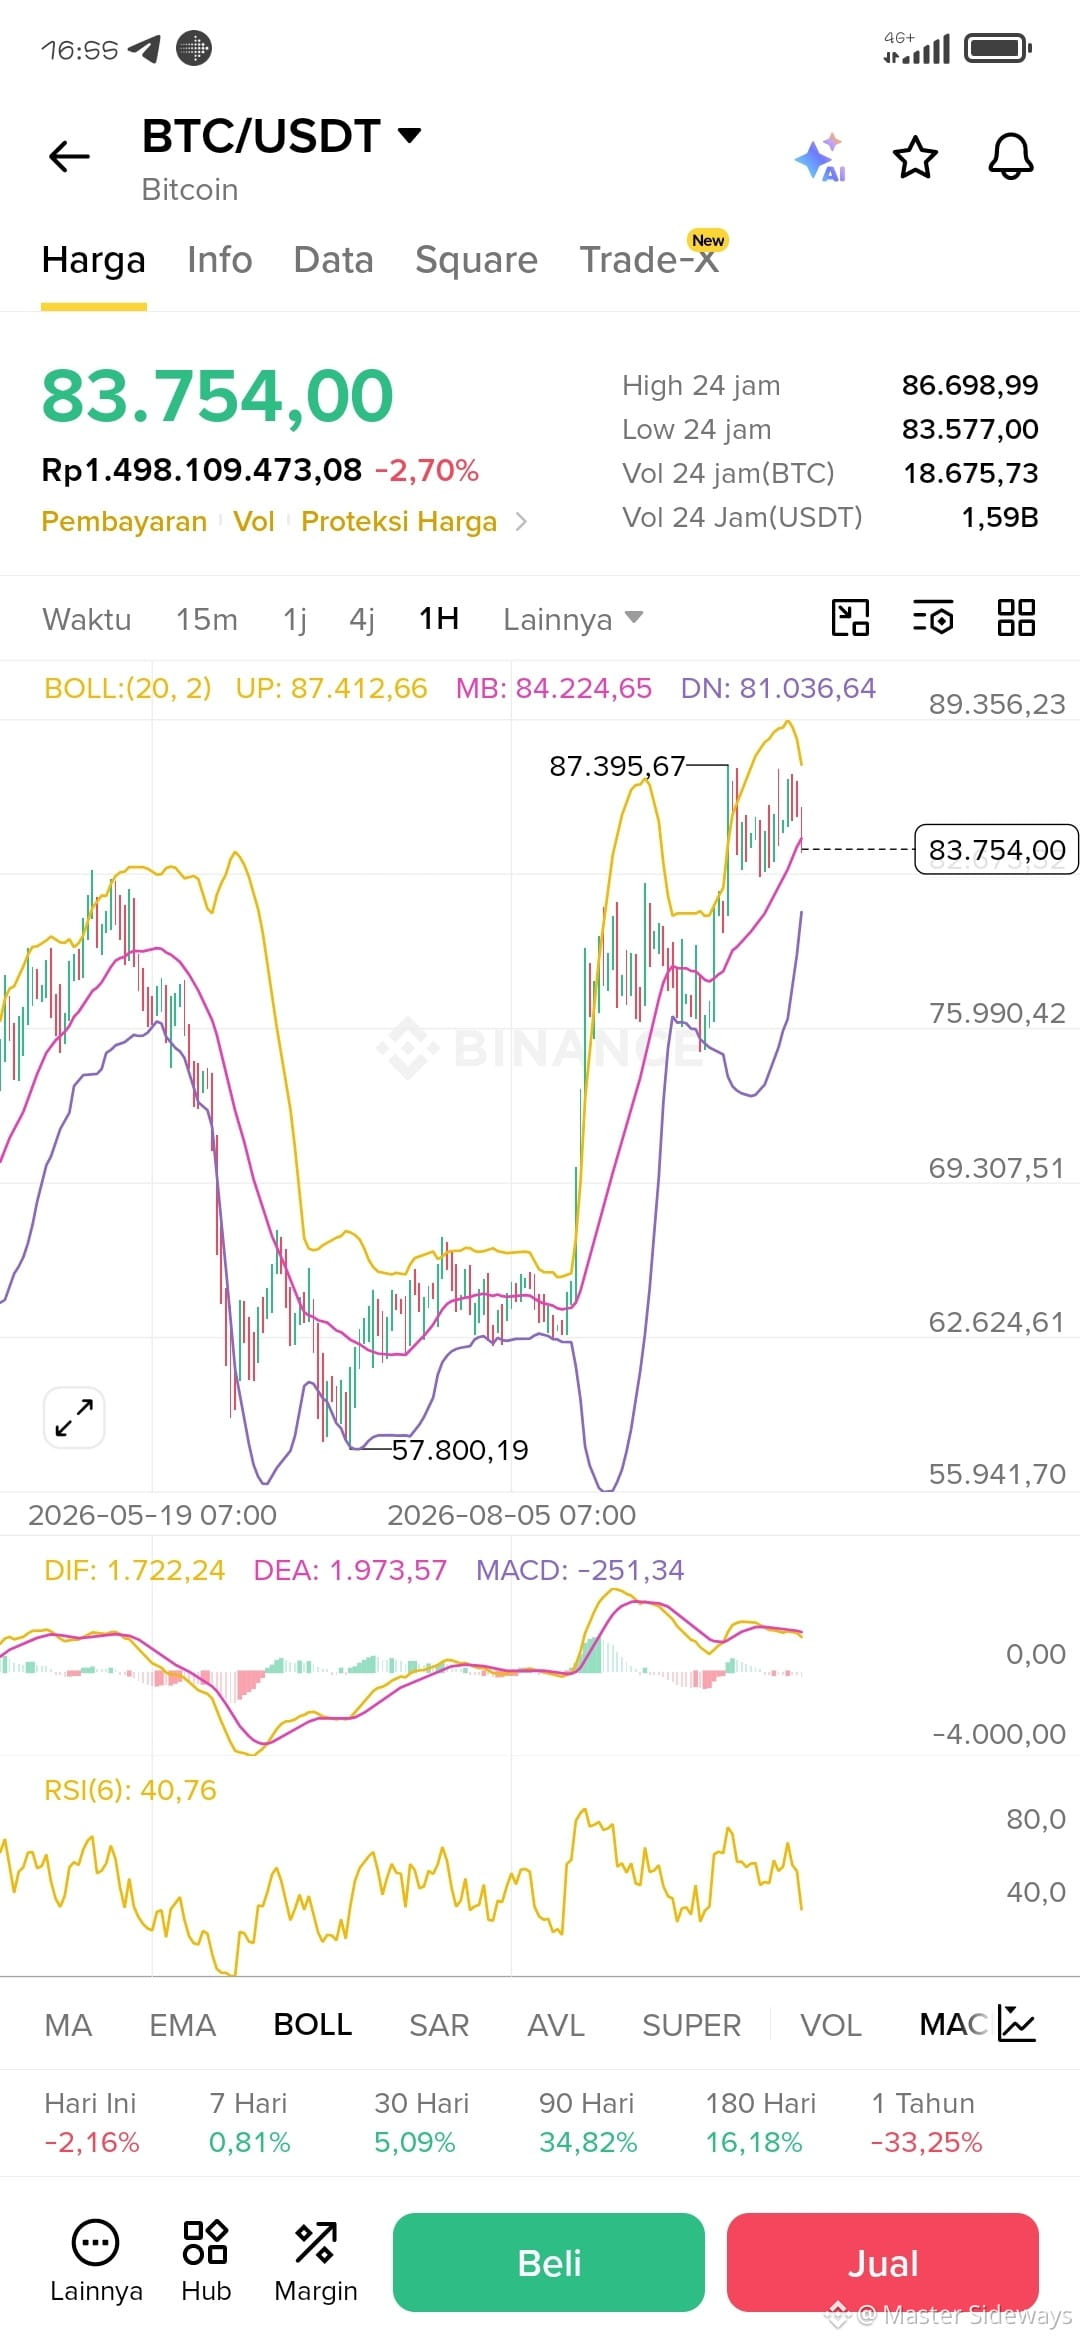
$83.746 RSI 4J 19.13 OVERSOLD! Flush Terakhir Sebelum Pantul ke $85.459?
$BTC UPDATE $83.754 (-2,70%)
JANGAN PANIK SELL!
Lihat data:
BOLL 4J UP $86.889 MB $85.459 DN $84.028 - Harga $83.746 sudah DI BAWAH DN = Oversold
RSI 4J 19,13 EXTREME OVERSOLD, terakhir di $74.967 langsung pump ke $87.395
BOLL 1H UP $87.412 MB $84.224 DN $81.036 - Support kuat di $81K
High 24j $86.698 Low $83.577 Vol 18.6K BTC ($1,59B) besar = Capitulation
Selama $83.577 Low 24j tahan, ini Bear Trap.
#BTC #Bitcoin #Oversold #BeliDiMerah
SET UP BUY / SELL:
1. SETUP BUY - SEROK OVERSOLD (Rekomendasi Utama):
Ini setup Sang Pengamat - beli saat orang lain takut.
- Entry 1 Cicil:* $83.577 - $83.800 (Low 24j) Sekarang
- Entry 2 Jika Turun Lagi: $81.036 - $81.500 (DN 1H) - Pasang jaring
- TP 1: $84.028 (DN 4J yang jebol jadi resistance pertama)
- TP 2: $84.224 (MB 1H)
- *lTP 3: $85.459 (MB 4J) = Target pantulan utama +5%
- TP 4: $86.889 (UP 4J)
- SL WAJIB: $80.500 di bawah DN 1H. Jika jebol, out dulu.
Risk:Spot 30-40% saja, jangan all in. Tunggu candle 4J close di atas $84.028 baru tambah.
2. SETUP SELL / SHORT - JANGAN DIPAKSA:
Kalau kamu sudah punya barang dari atas $86.698:
- Jangan cut loss di RSI 19. Tahan.
- Jika mau hedging short futures scalping: Short hanya jika retest $84.224 gagal
- Entry Short: $84.200
- TP Short: $83.577 dan $81.036
- SL Short: $84.800
Kamu mau jadi yang serok di $83.7 ini atau nunggu konfirmasi close di atas $84.028 dulu,?DYOR
$BTC
$83.746 RSI 4J 19.13 OVERSOLD! Flush Terakhir Sebelum Pantul ke $85.459?
$BTC UPDATE $83.754 (-2,70%)
JANGAN PANIK SELL!
Lihat data:
BOLL 4J UP $86.889 MB $85.459 DN $84.028 - Harga $83.746 sudah DI BAWAH DN = Oversold
RSI 4J 19,13 EXTREME OVERSOLD, terakhir di $74.967 langsung pump ke $87.395
BOLL 1H UP $87.412 MB $84.224 DN $81.036 - Support kuat di $81K
High 24j $86.698 Low $83.577 Vol 18.6K BTC ($1,59B) besar = Capitulation
Selama $83.577 Low 24j tahan, ini Bear Trap.
#BTC #Bitcoin #Oversold #BeliDiMerah
SET UP BUY / SELL:
1. SETUP BUY - SEROK OVERSOLD (Rekomendasi Utama):
Ini setup Sang Pengamat - beli saat orang lain takut.
- Entry 1 Cicil:* $83.577 - $83.800 (Low 24j) Sekarang
- Entry 2 Jika Turun Lagi: $81.036 - $81.500 (DN 1H) - Pasang jaring
- TP 1: $84.028 (DN 4J yang jebol jadi resistance pertama)
- TP 2: $84.224 (MB 1H)
- *lTP 3: $85.459 (MB 4J) = Target pantulan utama +5%
- TP 4: $86.889 (UP 4J)
- SL WAJIB: $80.500 di bawah DN 1H. Jika jebol, out dulu.
Risk:Spot 30-40% saja, jangan all in. Tunggu candle 4J close di atas $84.028 baru tambah.
2. SETUP SELL / SHORT - JANGAN DIPAKSA:
Kalau kamu sudah punya barang dari atas $86.698:
- Jangan cut loss di RSI 19. Tahan.
- Jika mau hedging short futures scalping: Short hanya jika retest $84.224 gagal
- Entry Short: $84.200
- TP Short: $83.577 dan $81.036
- SL Short: $84.800
Kamu mau jadi yang serok di $83.7 ini atau nunggu konfirmasi close di atas $84.028 dulu,?DYOR
124
#Overbought & #oversold
📊 Overbought & Oversold: How does it work? 📈📉
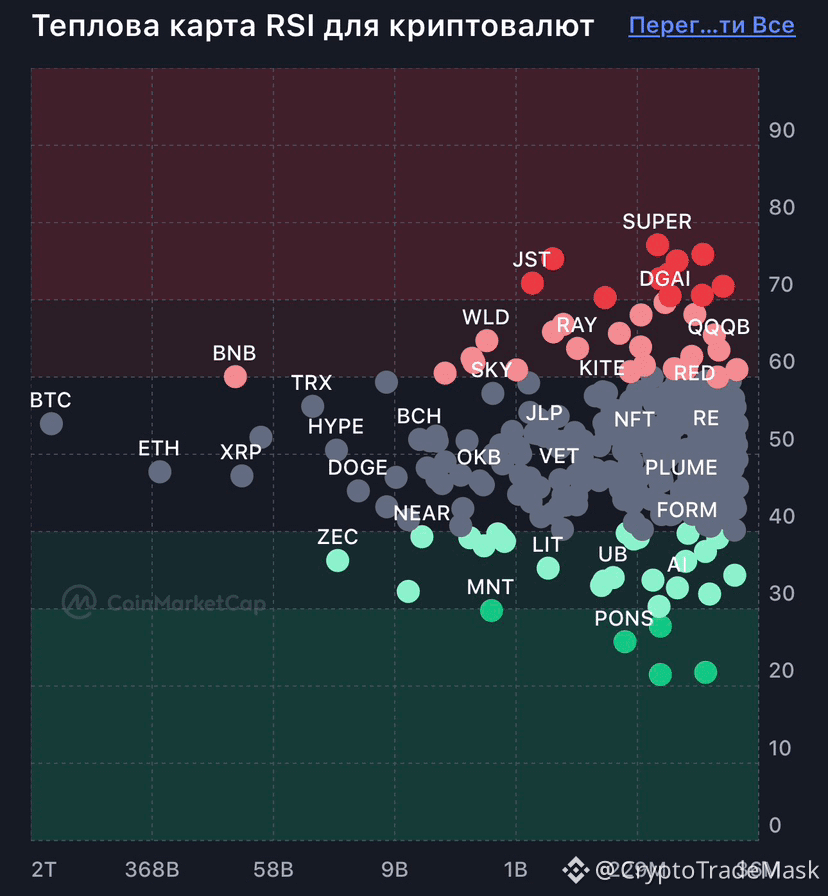
Key market zones that indicate when the price may reverse.
🟢 Oversold
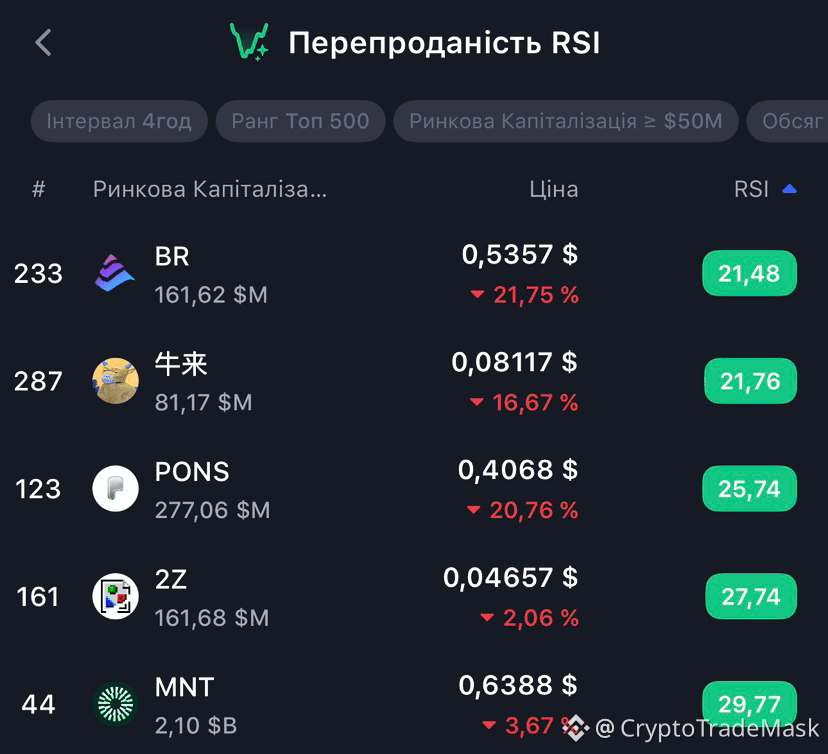
• The price has fallen too low - temporarily or excessively.
• RSI < 30.
• There may be a chance of a rebound - the asset is becoming interesting to buy.
• Many coins are now in this zone: $BR - a bottom may be forming.
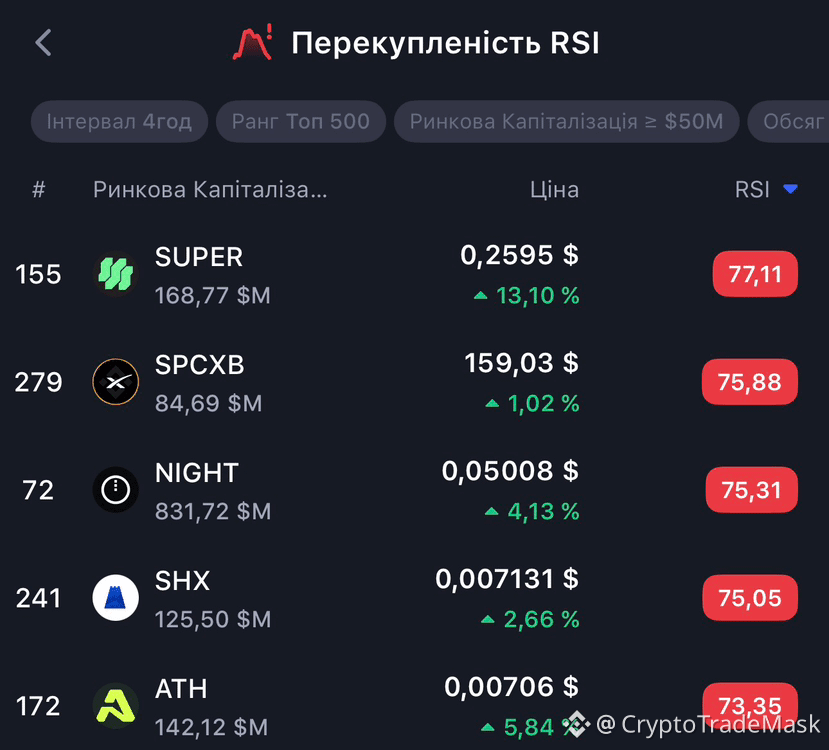
🔴 Overbought
• The price has risen too much.
• RSI > 70.
• A correction or pause after growth is likely - it's time to take profits.
• In this zone now: $SPCXB , $SUPER - a cooling after a surge is possible.
⚠️ Rule of thumb: no indicator gives guarantees - they are only hints, not a verdict.
{future}(NIGHTUSDT)
{future}(SUPERUSDT)
{future}(BRUSDT)
#Overbought & #oversold
📊 Overbought & Oversold: How does it work? 📈📉
Key market zones that indicate when the price may reverse.
🟢 Oversold
• The price has fallen too low - temporarily or excessively.
• RSI < 30.
• There may be a chance of a rebound - the asset is becoming interesting to buy.
• Many coins are now in this zone: $BR - a bottom may be forming.
🔴 Overbought
• The price has risen too much.
• RSI > 70.
• A correction or pause after growth is likely - it's time to take profits.
• In this zone now: $SPCXB , $SUPER - a cooling after a surge is possible.
⚠️ Rule of thumb: no indicator gives guarantees - they are only hints, not a verdict.
96
·
--
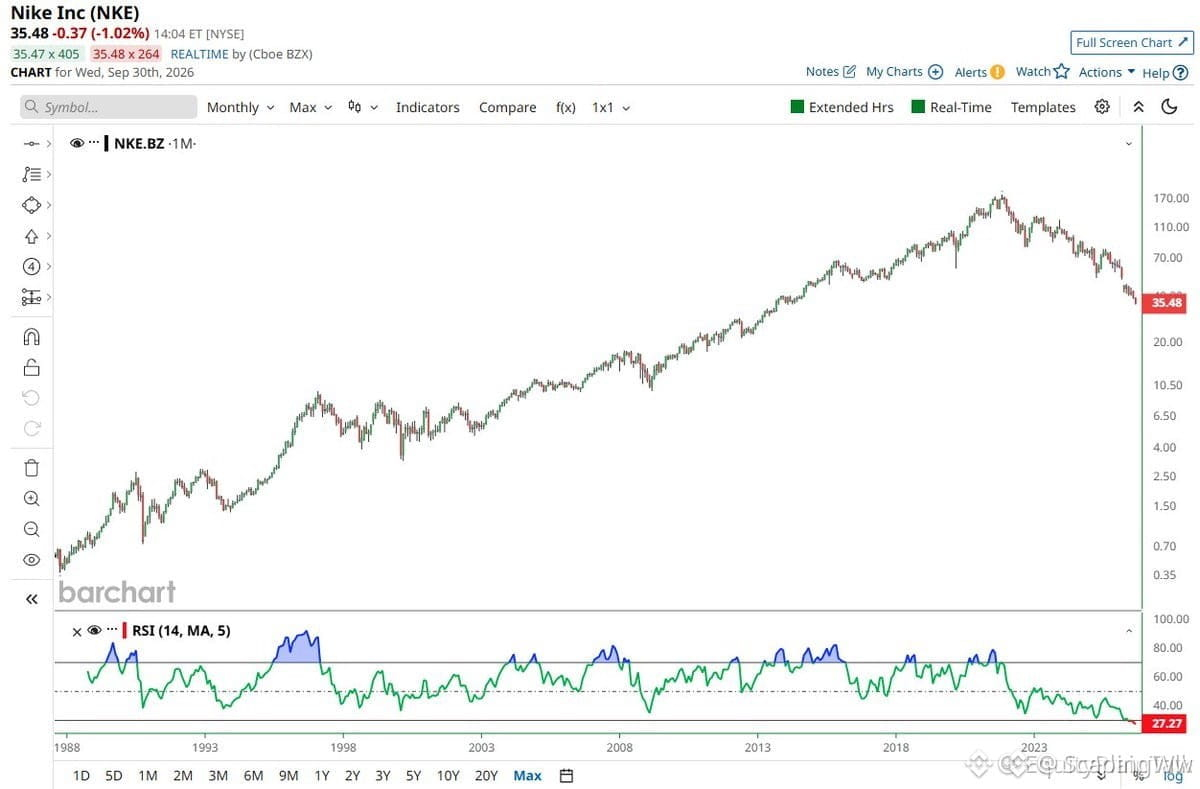
🚨 $NKE HITS HISTORIC OVERSOLD EXTREMES AFTER 50% DROP FROM ATH! 📉
The monthly RSI on $NKE has plunged into territory never seen in its trading history after a brutal 50% haircut from its 2021 peak. Relentless heavy selling driven by bloated inventories and market share drag has squeezed out every weak hand on the board. 📉
📌 Historic structural extremes like this don't guarantee an instant snap-back, but they signal seller exhaustion is rapidly approaching key long-term demand. Smart capital is watching closely for a volatility compression pattern to confirm whether this becomes a multi-year turnaround flip or a classic value trap. 🔍
💬 Is $NKE building a generational accumulation base here, or are you waiting for structural trend reversal before taking a position? 👇
⚠️ Not financial advice. Always manage your risk. 🛡️
🏷️ #NKE #MarketAnalysis #Oversold #TradingStrategy
🎯 💎
31
#Overbought & #oversold
📊 Overbought & Oversold: How does it work? 📈📉
Key market zones that indicate when the price may reverse.
🟢 Oversold
• The price has fallen too low - temporarily or excessively.
• RSI < 30.
• There may be a chance of a rebound - the asset is becoming interesting to buy.
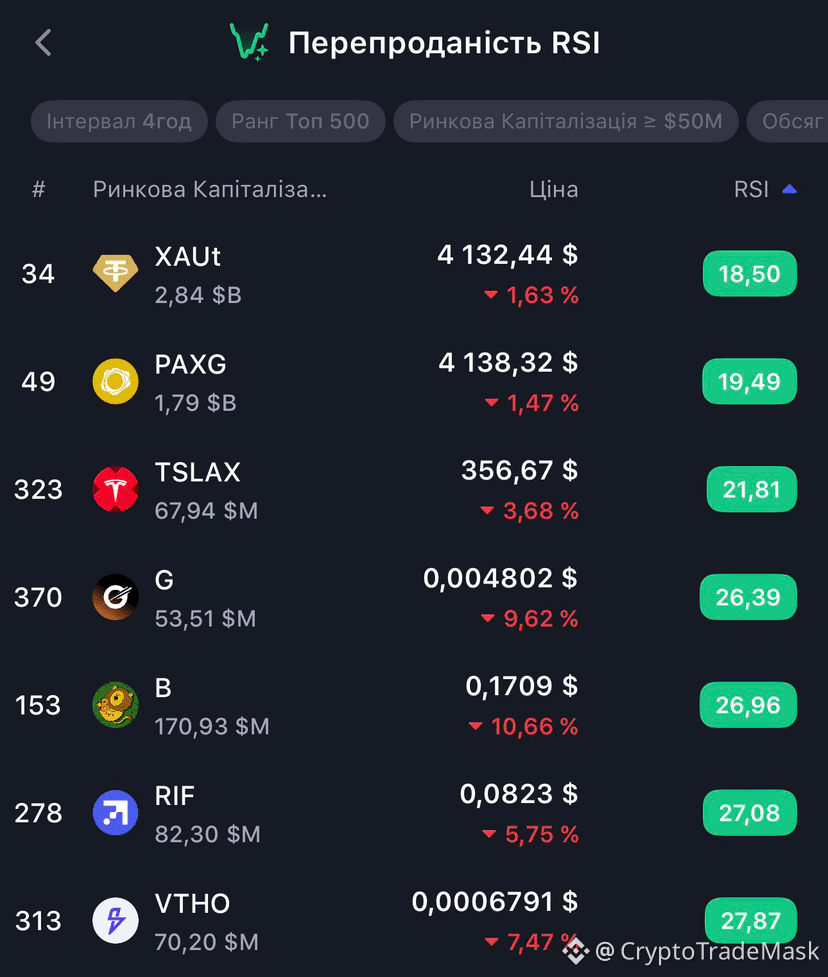
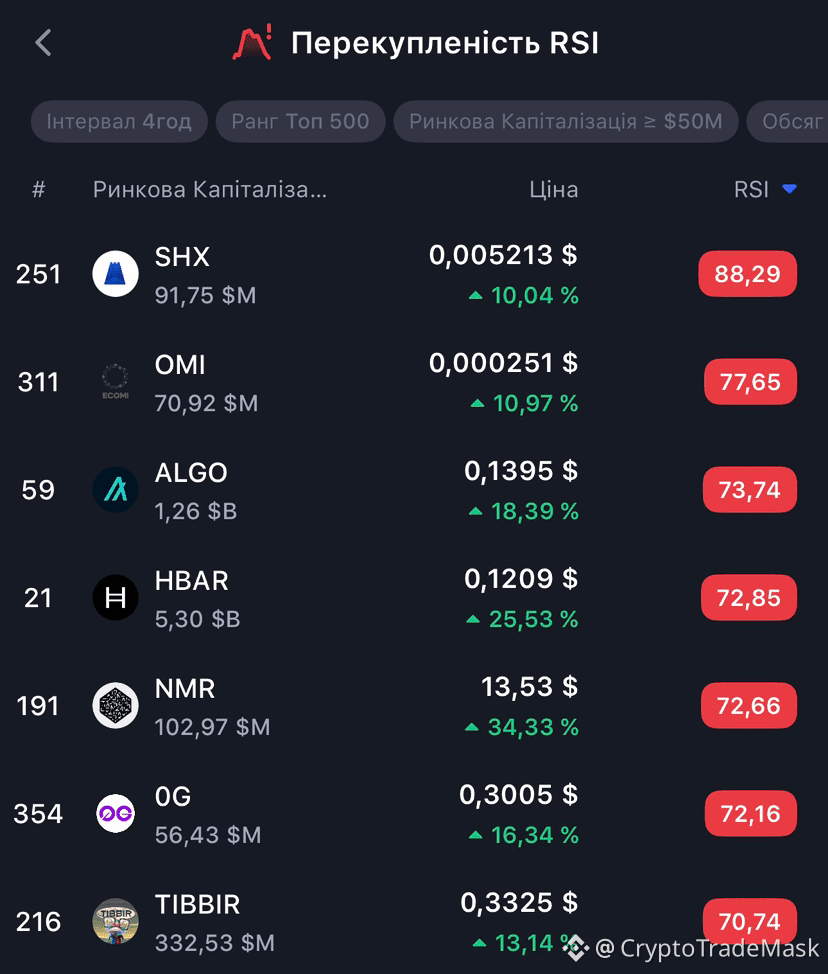
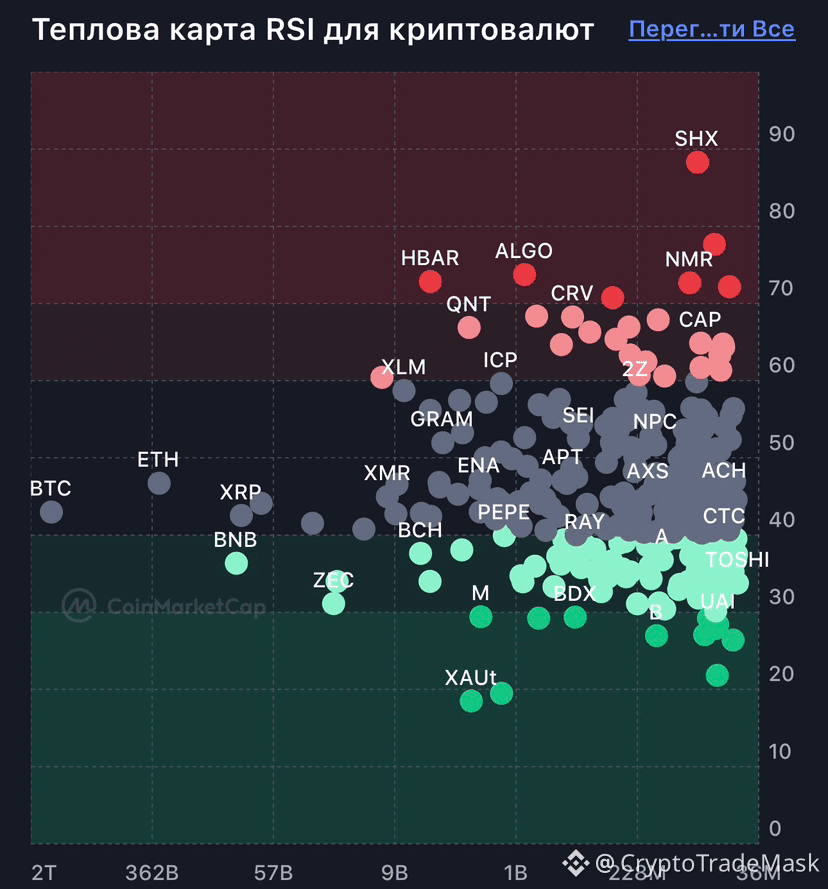
• Many coins are now in this zone: $G - a bottom may be forming.
🔴 Overbought
• The price has risen too much.
• RSI > 70.
• A correction or pause after growth is likely - it's time to take profits.
• In this zone now: $ALGO , $HBAR - a cooling after a surge is possible.
⚠️ Rule of thumb: no indicator gives guarantees - they are only hints, not a verdict.
{future}(HBARUSDT)
{future}(ALGOUSDT)
{future}(GUSDT)
#Overbought & #oversold
📊 Overbought & Oversold: How does it work? 📈📉
Key market zones that indicate when the price may reverse.
🟢 Oversold
• The price has fallen too low - temporarily or excessively.
• RSI < 30.
• There may be a chance of a rebound - the asset is becoming interesting to buy.
• Many coins are now in this zone: $G - a bottom may be forming.
🔴 Overbought
• The price has risen too much.
• RSI > 70.
• A correction or pause after growth is likely - it's time to take profits.
• In this zone now: $ALGO , $HBAR - a cooling after a surge is possible.
⚠️ Rule of thumb: no indicator gives guarantees - they are only hints, not a verdict.
1
171
#Overbought & #oversold
📊 Overbought & Oversold: How does it work? 📈📉
Key market zones that indicate when the price may reverse.
🟢 Oversold
• The price has fallen too low - temporarily or excessively.
• RSI < 30.
• There may be a chance of a rebound - the asset is becoming interesting to buy.
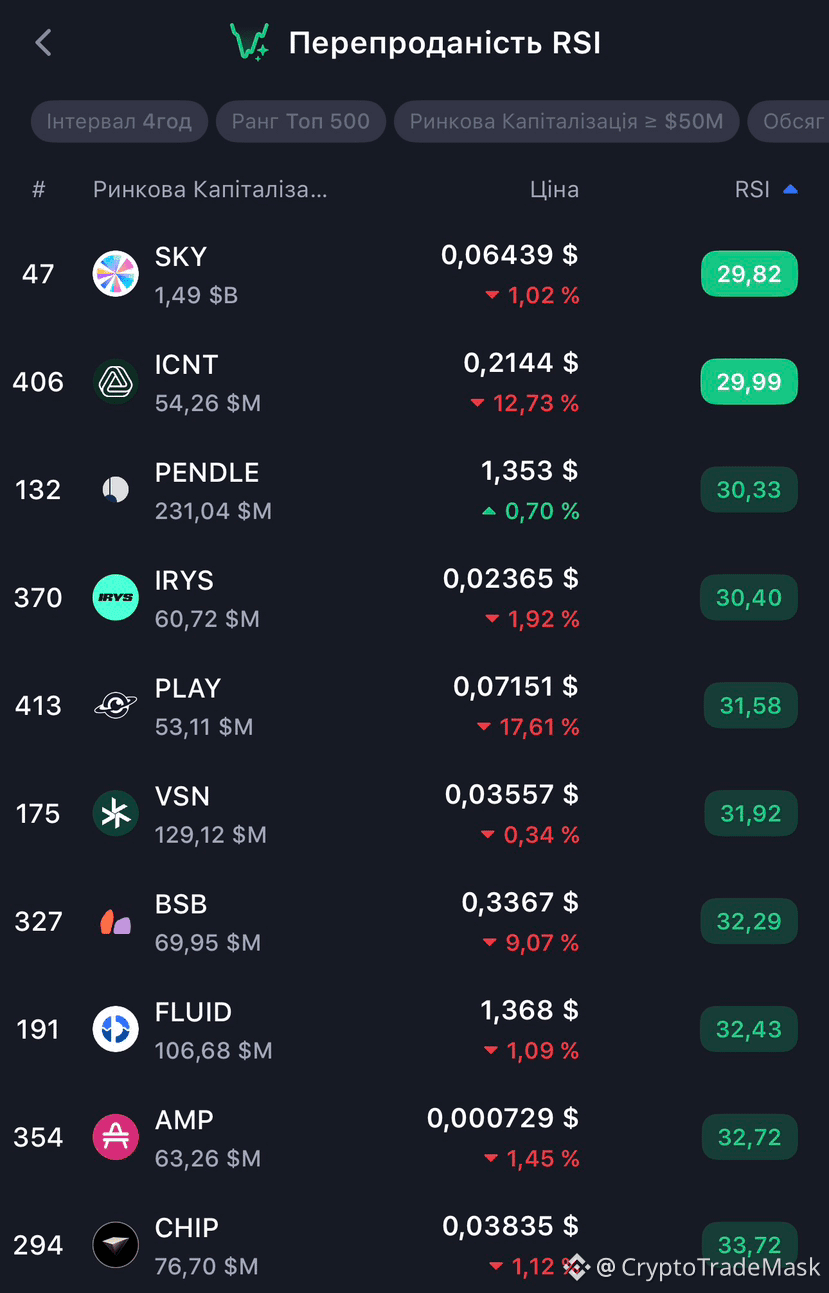
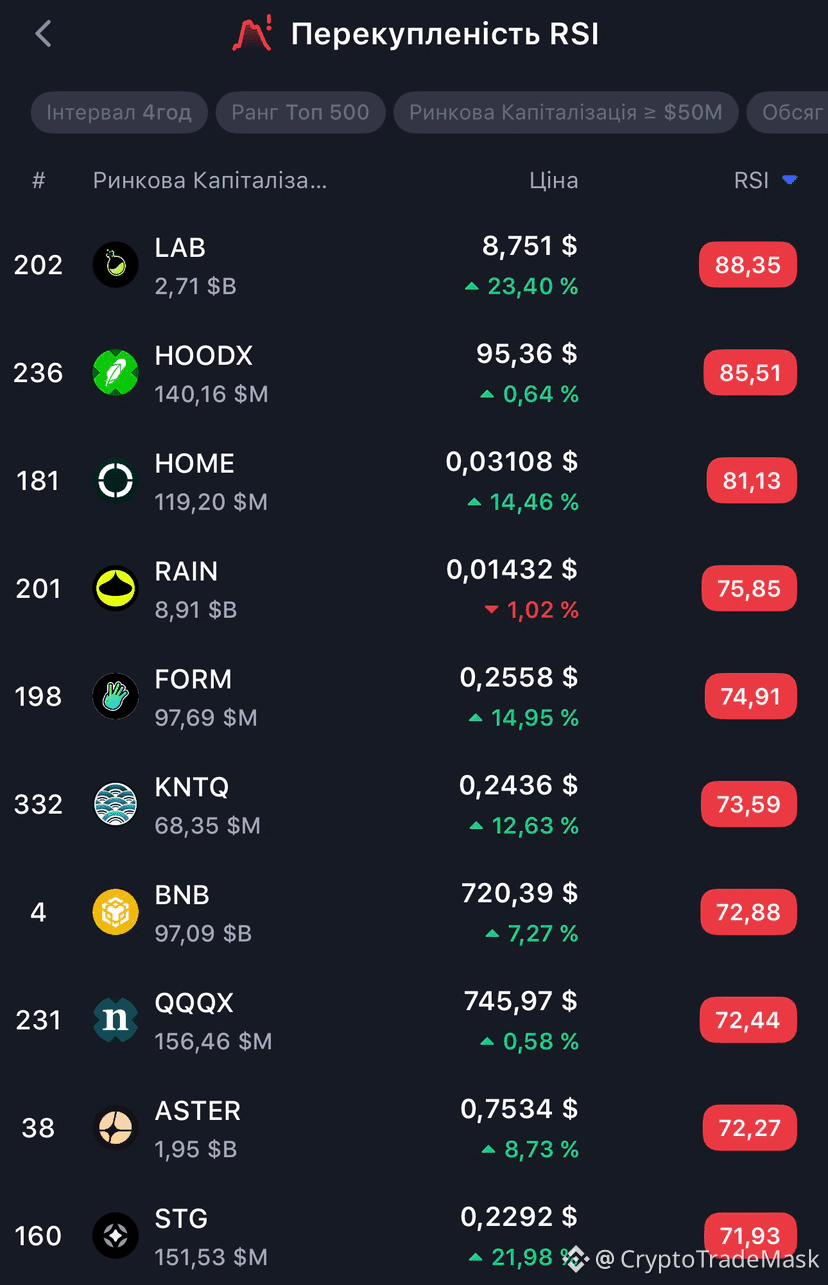
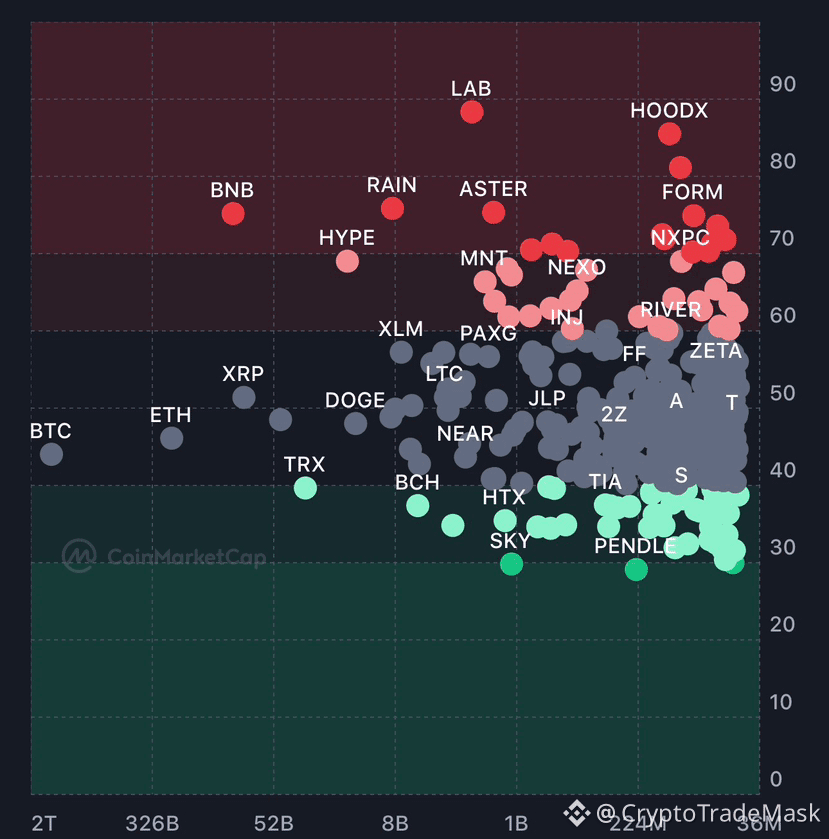
• Many coins are now in this zone: $SKY - a bottom may be forming.
🔴 Overbought
• The price has risen too much.
• RSI > 70.
• A correction or pause after growth is likely - it's time to take profits.
• In this zone now: $LAB , $HOME - a cooling after a surge is possible.
⚠️ Rule of thumb: no indicator gives guarantees - they are only hints, not a verdict.
{future}(HOMEUSDT)
{future}(LABUSDT)
{future}(SKYUSDT)
#Overbought & #oversold
📊 Overbought & Oversold: How does it work? 📈📉
Key market zones that indicate when the price may reverse.
🟢 Oversold
• The price has fallen too low - temporarily or excessively.
• RSI < 30.
• There may be a chance of a rebound - the asset is becoming interesting to buy.
• Many coins are now in this zone: $SKY - a bottom may be forming.
🔴 Overbought
• The price has risen too much.
• RSI > 70.
• A correction or pause after growth is likely - it's time to take profits.
• In this zone now: $LAB , $HOME - a cooling after a surge is possible.
⚠️ Rule of thumb: no indicator gives guarantees - they are only hints, not a verdict.
369
·
--
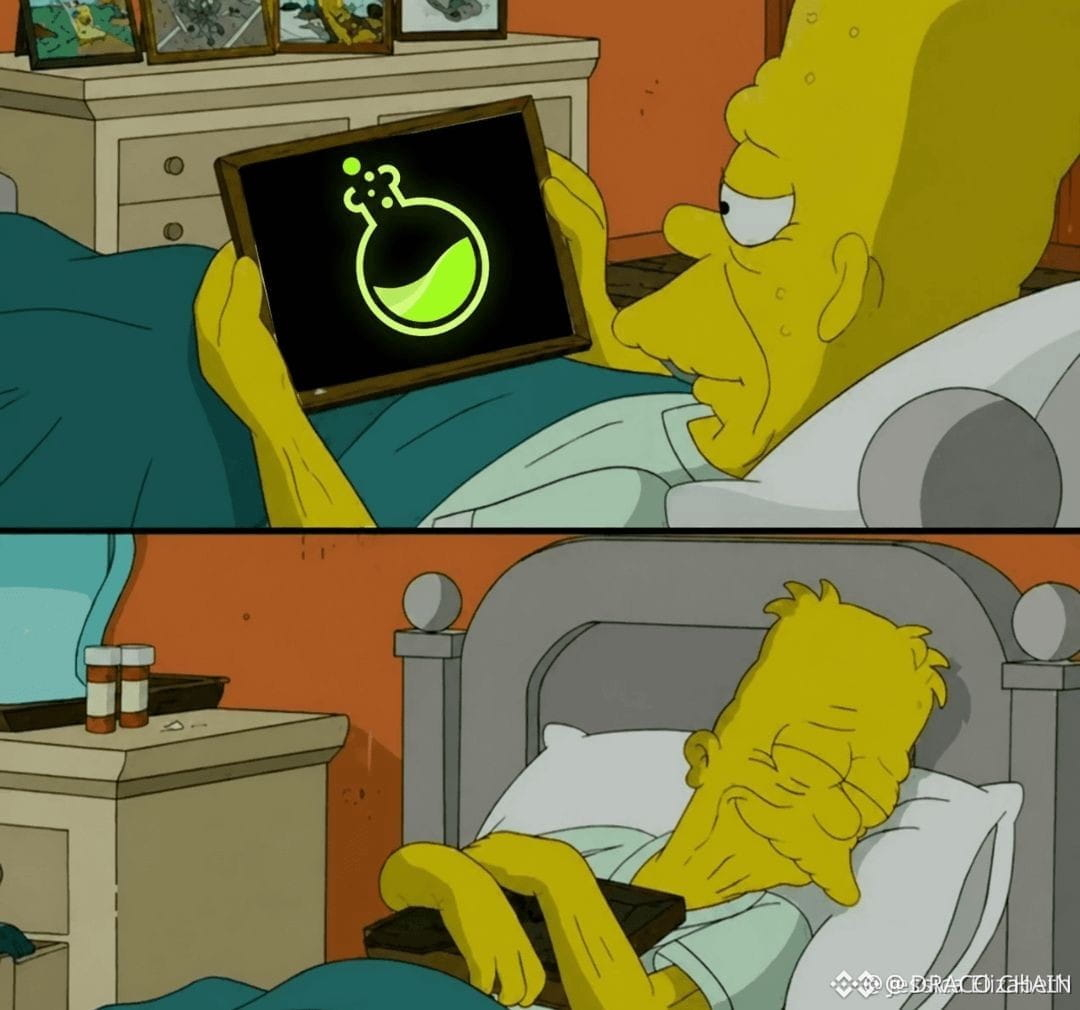
$LAB FROM $20 TO $1: STRUCTURAL LIQUIDITY ZONE FORMING 💎
The 95% decline from peak to current levels has carved a clear liquidity void on the weekly chart. Volume is thinning into the lows, and the daily RSI is sub-20 — levels that historically precede structural reversals when order flow shifts.
Patience here is a strategy, not an emotion. The market will tell you when it's ready to rotate, but the risk-reward asymmetry grows the lower we go.
Are you scaling into this zone or waiting for a breaker block to confirm?
Not financial advice. Always manage your risk.
#LAB #Altcoin #Crypto #Oversold
💎
356
·
--
$XLM REJECTED AT $0.21 – NOW TESTING CRITICAL SUPPORT 🔥
Body: That rejection at $0.2156 did structural damage. Price dropped 5.69% in a single session, slicing through the moving average cluster between $0.1948 and $0.1973. Sellers now control the tape.
RSI just hit 24.85 — oversold territory. But oversold doesn't guarantee a bounce. The real risk is a breakdown below $0.18, which could open the door to the mid-$0.16 range. Are you shorting this breakdown or waiting for a reclaim of $0.21?
Not financial advice. Always manage your risk.
#XLM #CryptoAnalysis #Oversold #SupportTest
💎
57
·
--
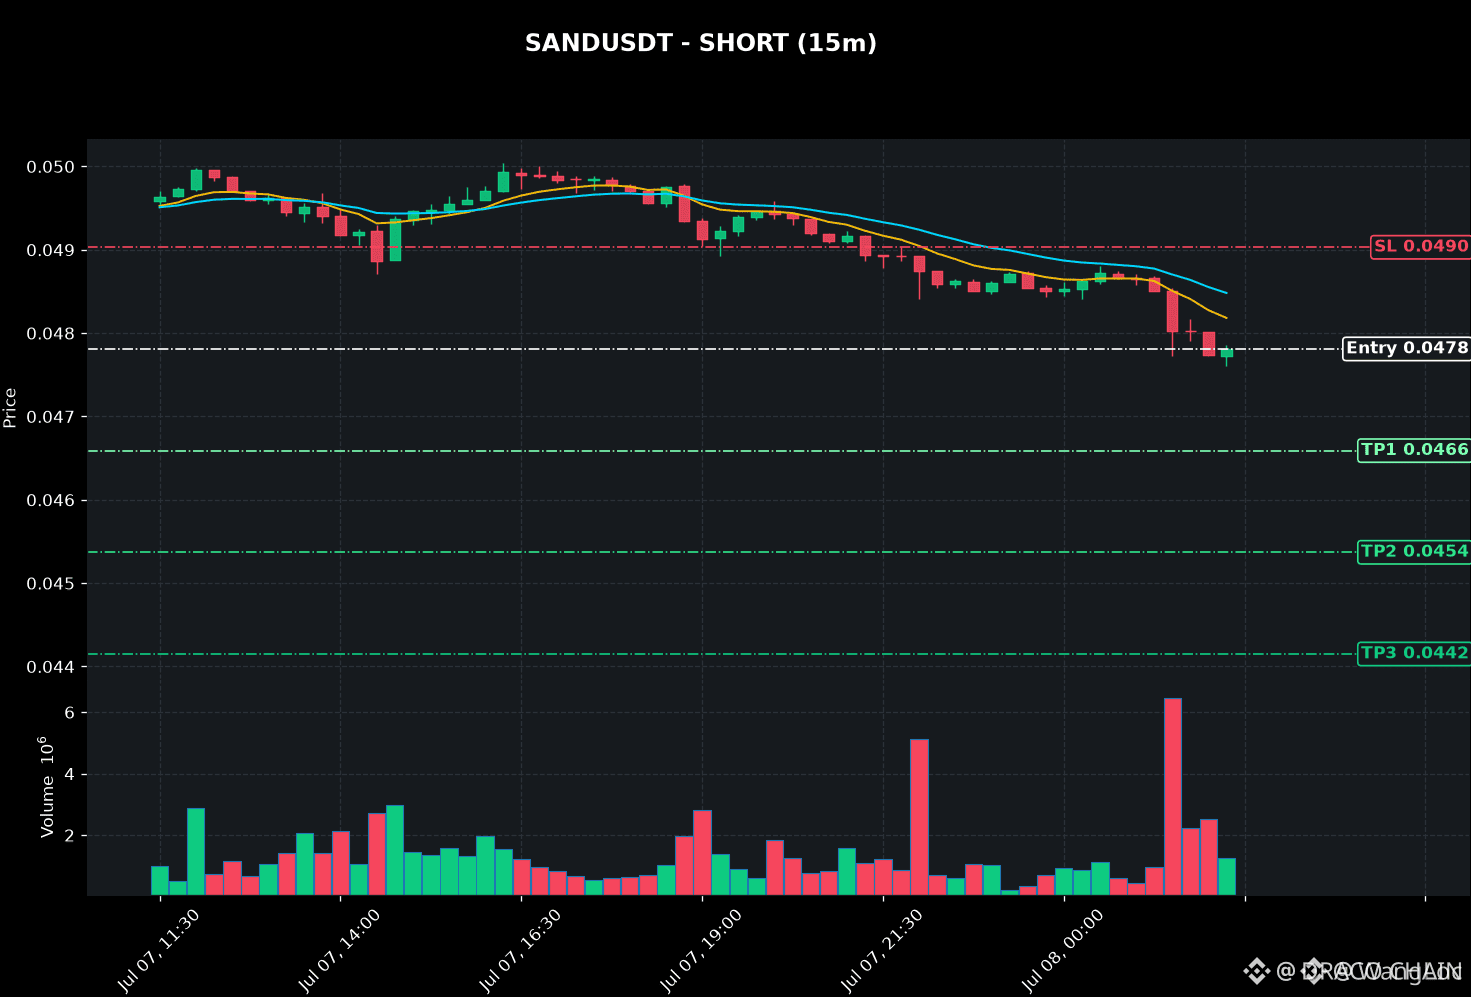
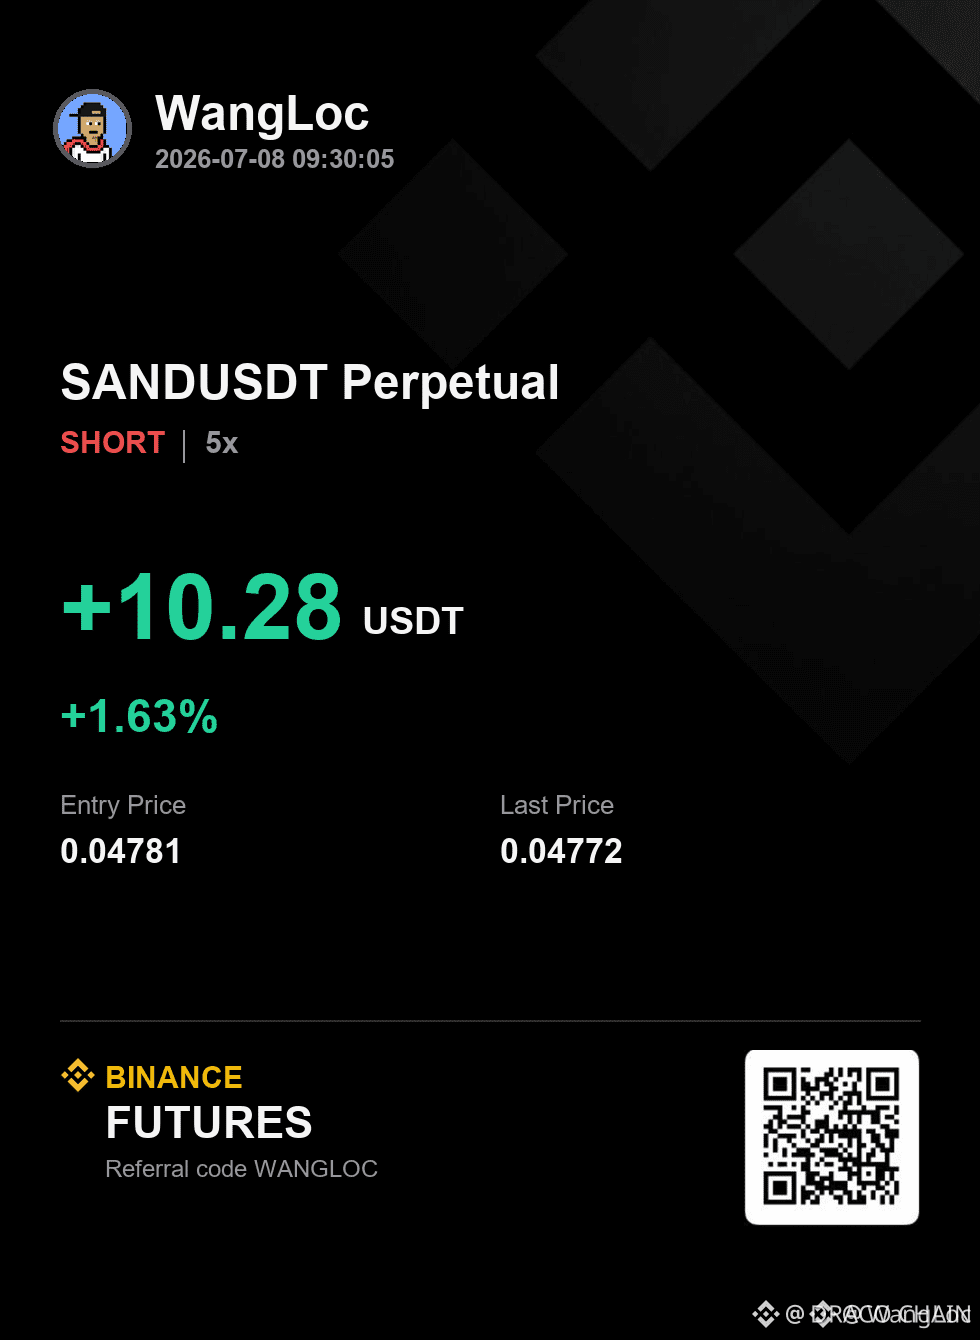
$SAND RSI AT 24.6 – SHORT PRESSURE REMAINS STRONG 🎯
Entry: 0.0478 🔥
Target: 0.0466 🚀
Stop Loss: 0.0490 ⚠️
RSI at 24.6 is historically oversold, but the higher timeframe trend still points short. The compression below the entry suggests another leg down is likely before any reversal. With targets at 0.0466, 0.0454, and 0.0442, the bias for continuation is clear.
Momentum is building on the shorter timeframes and the order flow has been aggressive into offers. Are you shorting this breakdown or waiting for a retest of resistance?
Not financial advice. Always manage your risk.
#SAND #ShortSetup #Oversold #Crypto
🎯
62
·
--
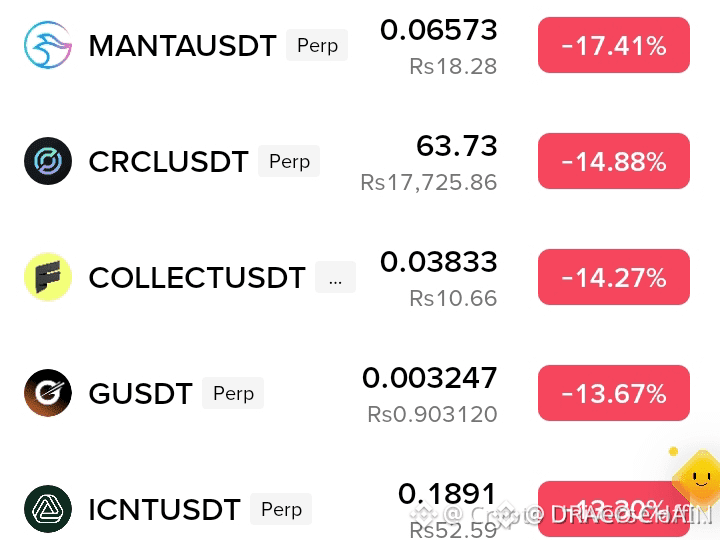
$COLLECT IS BEING DUMPED – LIQUIDITY BELOW COULD TRIGGER A REVERSAL 🔥
The recent sell-off in $COLLECT swept liquidity below the prior low. Daily RSI is oversold at 28, matching the level that preceded the last 15% bounce. Volume is accelerating on the 1H chart, suggesting sellers are losing momentum. A reclaim above the previous range low would confirm absorption.
Are you positioning for a reversal or waiting for confirmation?
Not financial advice. Always manage your risk.
#COLLECT #Reversal #Oversold #Crypto
🔥
515

·
--
Жоғары (өспелі)
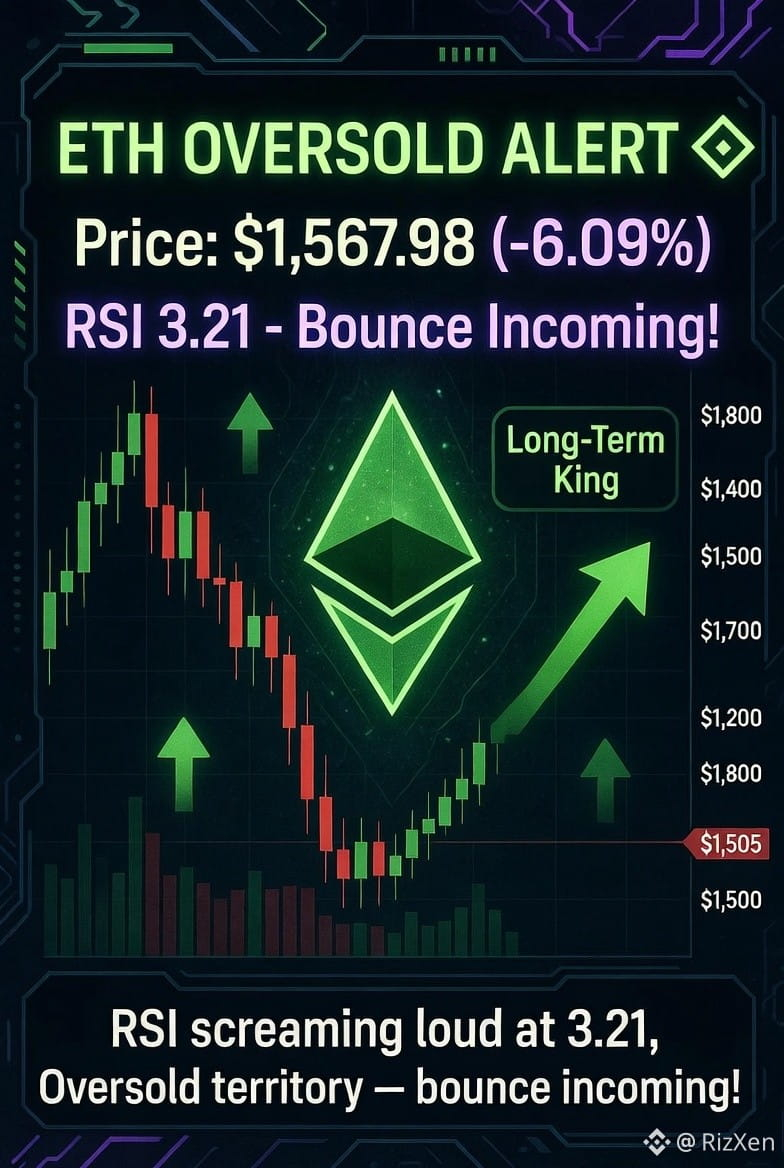
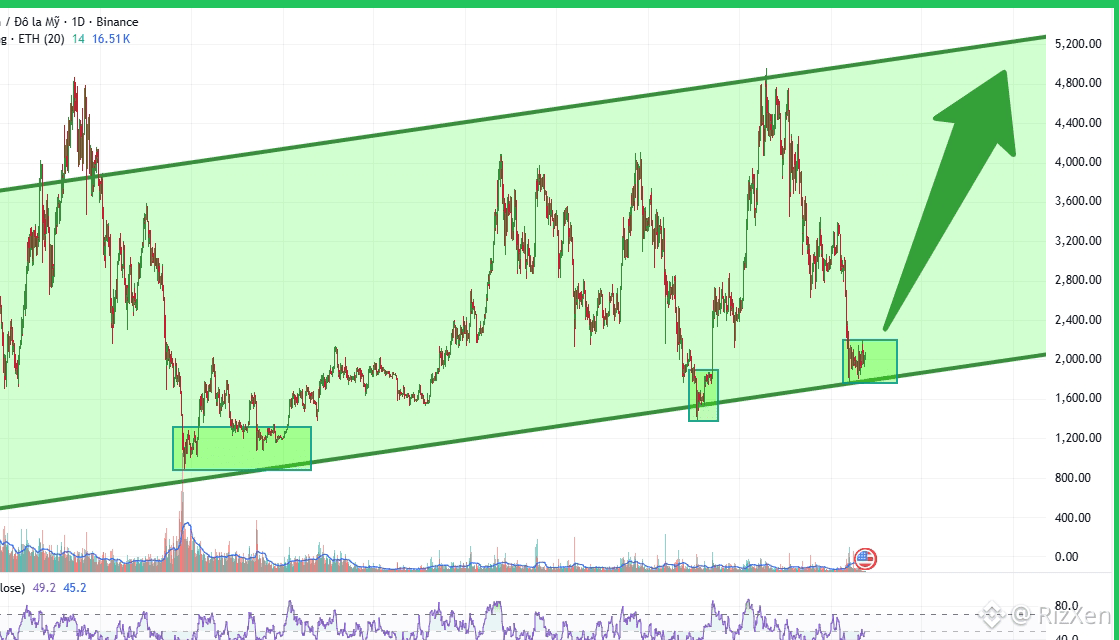
🚨 $ETH Oversold Alert – Rhyme Time for the Rebound! 🔥
�
Current Price$ETH : $1,567.98 (-6.09%)
Heavy drop, but now sitting at a critical support zone!
Touched $1,505 — now higher low, smart!
Layer 1 king still wearing the crown,
This golden dip for long-term holders in town!
Short-Term Twist:
$1,700 to $1,800 could be the next ride,
If $1,500 holds, bulls will turn the tide!
Long-Term Dream:
$ETH Ethereum’s future shines so bright,
L2 scaling, staking, and adoption light.
Institutions loading up, fees staying low,
$4,800 ATH? We’ll see it grow!
My Unique Take:
Accumulate on this dip with DCA flow,
Manage your risk — let the smart money show!
What’s Your Move? Drop a Comment Below!
Buy The Dip or Wait For More Pain?
What’s your next target for $ETH?
#ETH #Ethereum #BuyTheDip #oversold
🚨 $ETH Oversold Alert – Rhyme Time for the Rebound! 🔥
�
Current Price$ETH : $1,567.98 (-6.09%)
Heavy drop, but now sitting at a critical support zone!
Touched $1,505 — now higher low, smart!
Layer 1 king still wearing the crown,
This golden dip for long-term holders in town!
Short-Term Twist:
$1,700 to $1,800 could be the next ride,
If $1,500 holds, bulls will turn the tide!
Long-Term Dream:
$ETH Ethereum’s future shines so bright,
L2 scaling, staking, and adoption light.
Institutions loading up, fees staying low,
$4,800 ATH? We’ll see it grow!
My Unique Take:
Accumulate on this dip with DCA flow,
Manage your risk — let the smart money show!
What’s Your Move? Drop a Comment Below!
Buy The Dip or Wait For More Pain?
What’s your next target for $ETH ?
#ETH #Ethereum #BuyTheDip #oversold
71
Көбірек контент көру үшін кіріңіз
Binance Square платформасында әлемдік криптоқоғамдастыққа қосылыңыз
⚡️ Криптовалюта туралы ең соңғы және пайдалы ақпаратты алыңыз.
💬 Әлемдегі ең ірі криптобиржаның сеніміне ие.
👍 Расталған авторлардың нақты пікірлерін табыңыз.
Электрондық пошта/телефон нөмірі
Трендтегі тақырыптар
1
#BinancePick
2.6M рет көрілді
139,353 адам талқылап жатыр
2
#EarningsSeason
5M рет көрілді
24,079 адам талқылап жатыр
3
#StrategyMSTRSurpassesNasdaqInMarketCap
0 рет көрілді
3 адам талқылап жатыр
4
#CanadaProposesStablecoinRedemptionWithin3BusinessDays
0 рет көрілді
0 адам талқылап жатыр
5
#ElectrumWalletBugLetRogueServersStealFunds
4,725 рет көрілді
177 адам талқылап жатыр
6
#ArgentineCourtDismissesLIBRACaseAgainstMilei
12,648 рет көрілді
255 адам талқылап жатыр
7
#SKHynixReportedlyPlansSpecialDividendFromKioxiaStakeSale
2,536 рет көрілді
41 адам талқылап жатыр
8
#KeystoneWebsiteBreachExposesBuyersShippingAddresses
1,442 рет көрілді
33 адам талқылап жатыр
9
#USQ3GDPAndSeptemberPCEDueNextWeek
86,923 рет көрілді
1,061 адам талқылап жатыр
10
#SouthKoreaDelaysCryptoIncomeTax
159,234 рет көрілді
1,110 адам талқылап жатыр