

#etcvsbtc
etcvsbtc
18,084 рет көрілді
47 адам талқылап жатыр
Қызу саудада
Ең соңғы

·
--
Жоғары (өспелі)
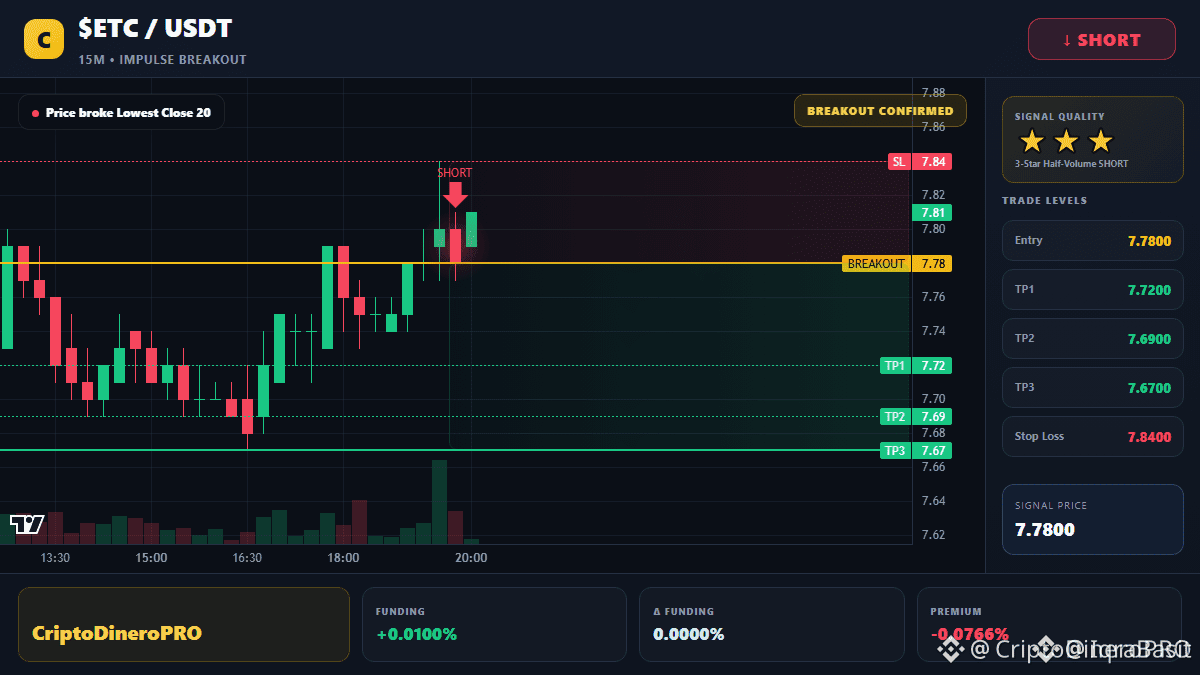
#ETCvsBTC *ETC Update — Ethereum Classic | Sep 13, 2026*
*Current Price*
- *$7.61 - $7.77* across exchanges
- *24h*: -0.5% to +4.5% depending on exchange
- *Day range*: $7.55 low to $8.04 high
- *Market Cap*: ∼$1.21B - $1.3B bfe7b4c0e35e
*Performance*
- *1 Month*: +24% to +20.6% — ETC is actually outperforming the "Dynamic Asset" category avg of 21%
- *5 Day*: -1.9%
- *1 Year*: -64.87%
- *ATH*: $150.42 — we’re still -95.7% from that bfe70fff
*What's happening*
1. *Volume spike*: 24h volume up 52.96% to €47.13M. 7D volume jumped 245%
2. *Narrative*: ETC is still "code is law" + PoW chain focused on immutability. Deflationary tokenomics with block rewards decreasing over time like BTC halving
3. *Position*: Ranked #54-#68. 158M ETC circulating of 210.7M max supply 0fff63c3e35e
*ETC vs BTC/ETH*
- ETC vs BTC: -45.89%
- ETC vs ETH: -34.04%
- Still outperforming on monthly basis though 0fff7b8b
*Key levels to watch*
- *Support*: $7.55 - $7.37
- *Resistance*: $NVDAB 7.82 - $8.04
- *Catalysts*: Same macro factors as BTC — CPI, FOMC Sept 16, and risk sentiment. ETC tends to be higher beta
Want me to make a chart comparing *ETC vs BTC* for the last month, or mark support/resistance zones on ETC like we did for BTC $GOOGL.US 69K?
#ETC/USDT #ETCUSD #etccoin #ETC/USDT
1
73
·
--
Ethereum ($ETH )
{spot}(ETHUSDT)
Technical Analysis
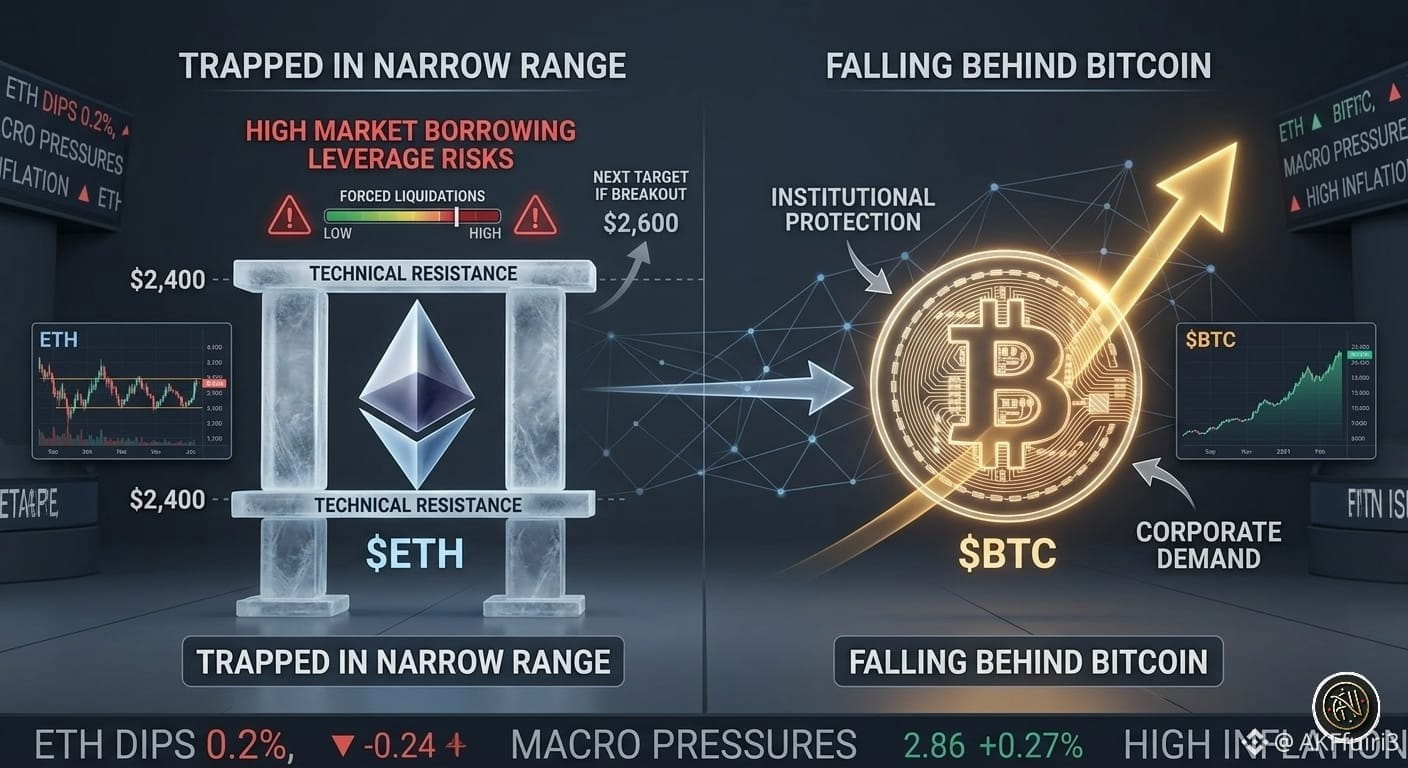
Trapped? How $ETH is Falling Behind Bitcoin
🚀 Market Update
The price of Ethereum is currently at $2,379, and it has declined by 0.2%. Over the last month, ETCis down 8.6%, while Bitcoin's losses are much smaller. The price of Bitcoin is under the protection of institutions, while Ethereum is struggling to get equal institutional support and stays trapped within a narrow range.
📉 Risks
Investors use high leverage on their positions, meaning that a large part of the trades is made with borrowed money. If the price goes down rapidly, it leads to positions' liquidations when exchanges force them to close the trade. In addition, macro markets are under pressure because of high inflation levels.
🔮 What's Next
Pay attention to the $2,400 resistance level. It needs to be broken to kick-start a recovery of $ETH. When global market pressure subsides, Ethereum may reach $2,600 quickly.
💡 Key Takeaway
High borrowing in the market makes ETC vulnerable. Trade with caution until the breakout happens.
Will ETC catch up with $BTC TC or it will keep falling?
#ETCvsBTC
Ethereum ($ETH )
Technical Analysis
Trapped? How $ETH is Falling Behind Bitcoin
🚀 Market Update
The price of Ethereum is currently at $2,379, and it has declined by 0.2%. Over the last month, ETCis down 8.6%, while Bitcoin's losses are much smaller. The price of Bitcoin is under the protection of institutions, while Ethereum is struggling to get equal institutional support and stays trapped within a narrow range.
📉 Risks
Investors use high leverage on their positions, meaning that a large part of the trades is made with borrowed money. If the price goes down rapidly, it leads to positions' liquidations when exchanges force them to close the trade. In addition, macro markets are under pressure because of high inflation levels.
🔮 What's Next
Pay attention to the $2,400 resistance level. It needs to be broken to kick-start a recovery of $ETH . When global market pressure subsides, Ethereum may reach $2,600 quickly.
💡 Key Takeaway
High borrowing in the market makes ETC vulnerable. Trade with caution until the breakout happens.
Will ETC catch up with $BTC TC or it will keep falling?
#ETCvsBTC
1
138

·
--
$ETC
{future}(ETCUSDT)
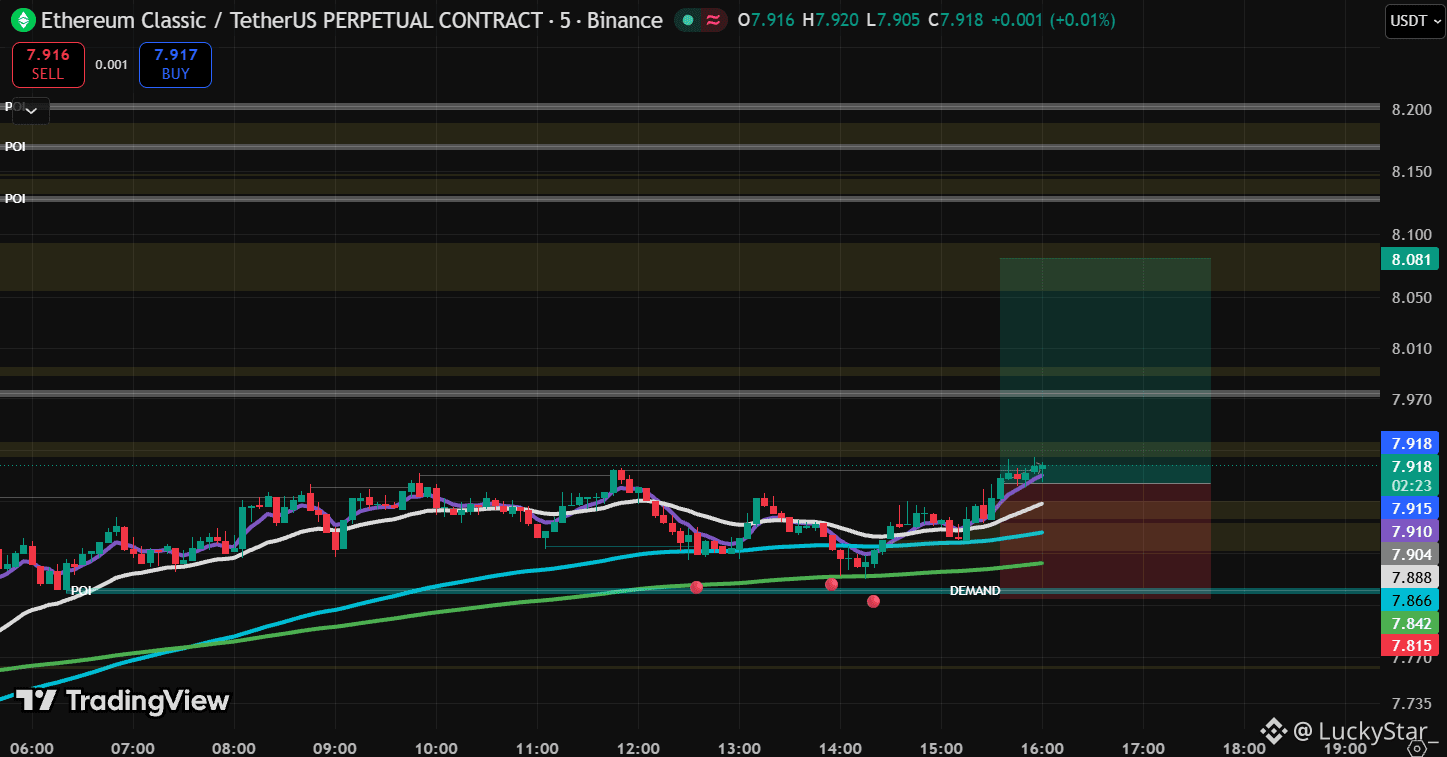
📈 The market is accumulating. The next move could be strong
After sharp movements, the crypto market often enters a consolidation phase.
It is during this period that big players form new positions.
Instead of rushing, it is better to wait for the price to break out of the range and confirm the trend.
Patience often brings better results than emotional entries.
❓ In your opinion, will the next strong move be up or down?
#ETC #ETCUSDT #ETCvsBTC
$ETC
📈 The market is accumulating. The next move could be strong
After sharp movements, the crypto market often enters a consolidation phase.
It is during this period that big players form new positions.
Instead of rushing, it is better to wait for the price to break out of the range and confirm the trend.
Patience often brings better results than emotional entries.
❓ In your opinion, will the next strong move be up or down?
#ETC #ETCUSDT #ETCvsBTC
22

·
--
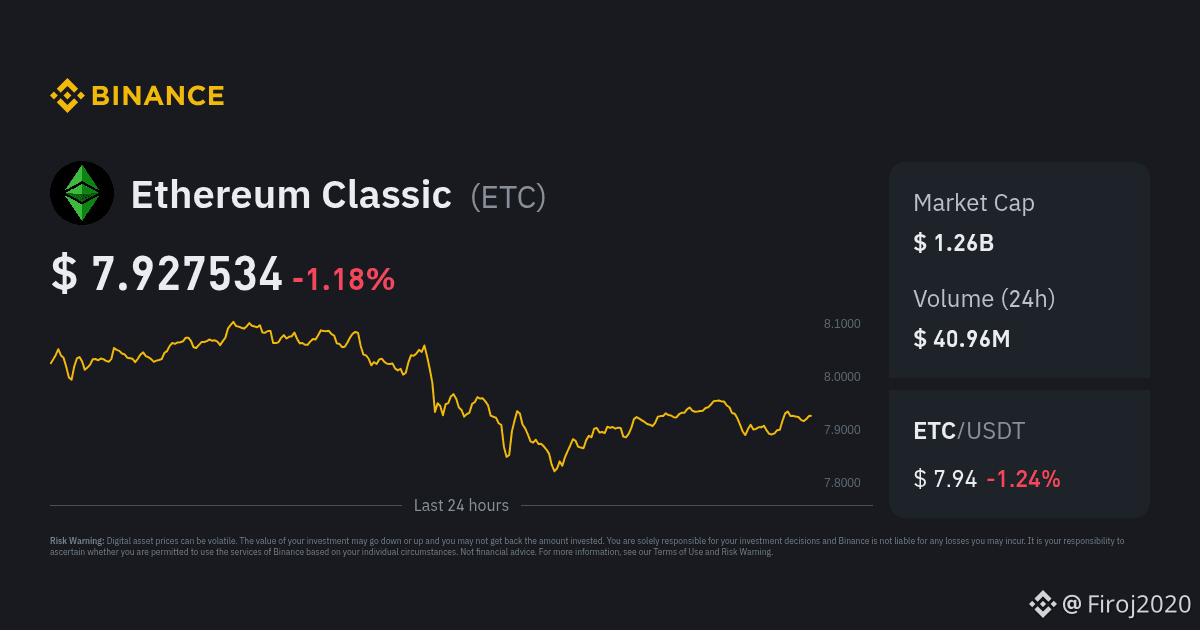
Ethereum Classic $ETC is currently trading in a tight, consolidated range between $7.80 and $8.20, capturing a neutral market sentiment amidst a broader risk-off mood across the crypto ecosystem. The token faces a slight downward momentum over the last 24 hours, down roughly 1.7%, failing to breach immediate overhead Exponential Moving Average (EMA) resistance barriers.
Immediate Resistance: $8.10 – $8.25. Slipped below the 25-day and 99-day EMAs, converting these previous support boundaries into active cell zones.
Crucial Support: $7.60 – $7.80. Buyers have consistently defended this local bottom to mitigate deeper losses. A break beneath this floor could trigger a deeper test toward the monthly imbalance zone near $4.50 – $6.00.
#ETC #recentupdates #ETCvsBTC
{spot}(ETCUSDT)
Ethereum Classic $ETC is currently trading in a tight, consolidated range between $7.80 and $8.20, capturing a neutral market sentiment amidst a broader risk-off mood across the crypto ecosystem. The token faces a slight downward momentum over the last 24 hours, down roughly 1.7%, failing to breach immediate overhead Exponential Moving Average (EMA) resistance barriers.
Immediate Resistance: $8.10 – $8.25. Slipped below the 25-day and 99-day EMAs, converting these previous support boundaries into active cell zones.
Crucial Support: $7.60 – $7.80. Buyers have consistently defended this local bottom to mitigate deeper losses. A break beneath this floor could trigger a deeper test toward the monthly imbalance zone near $4.50 – $6.00.
#ETC #recentupdates #ETCvsBTC
1
67

d
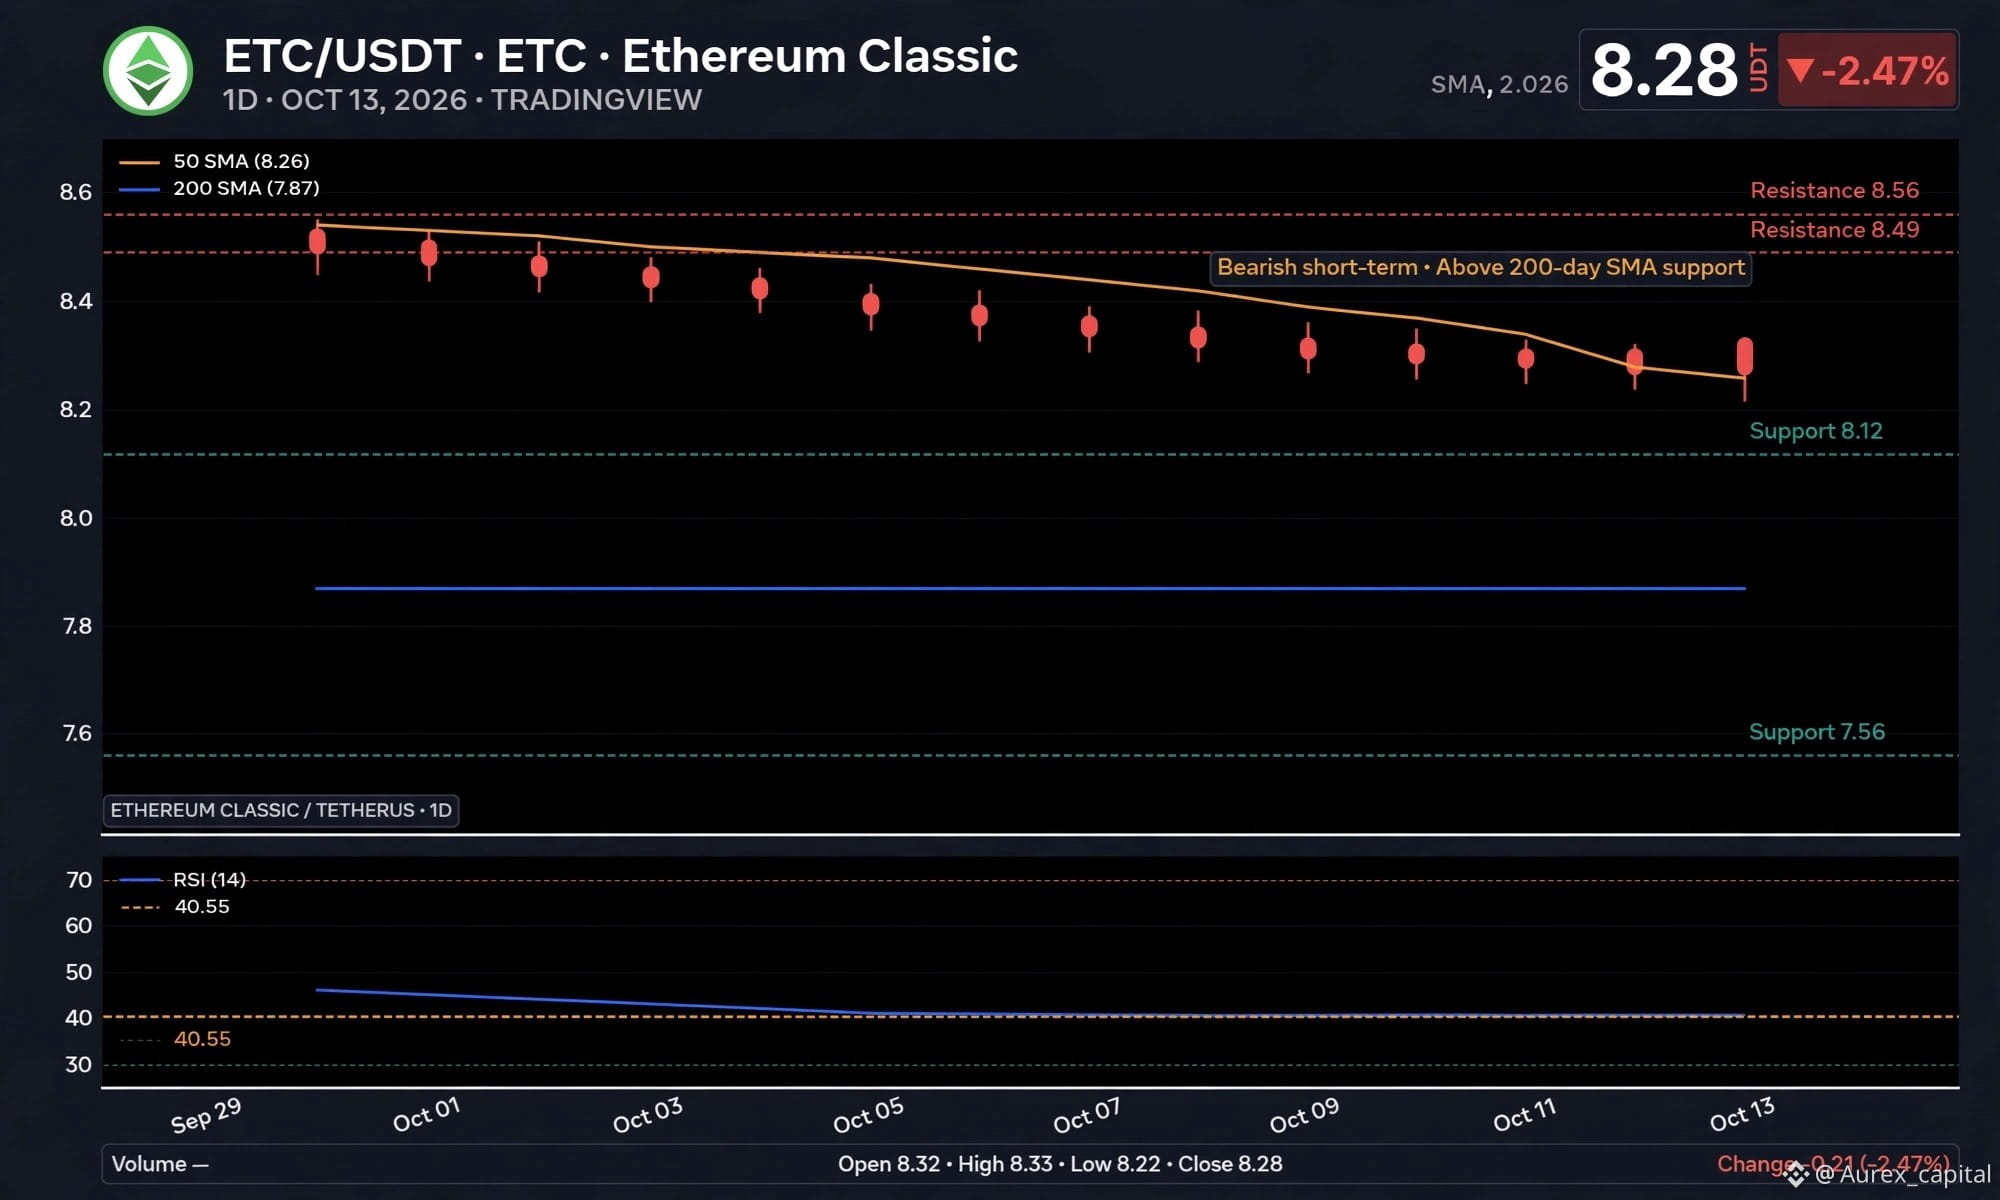
$ETC Analysis - Oct 13, 2026*
Ethereum Classic trading at *$8.28 (-2.47%)*
Short-term looks bearish but long-term structure still above 200 SMA support.
📊 Technicals:
50 SMA $8.26 acting as resistance
200 SMA $7.87 is major support
RSI 40.55 - Neutral to bearish, not oversold yet
🎯 Key Levels:
Resistance: $8.49 / $8.56
Support: $8.12 / $7.87 / $7.56
If $8.12 holds, bounce expected. Break below could drag to $7.87.
What's your take on ETC? Bullish or Bearish? 👇
#ETC #SolanaETFsEnd14WeekInflowStreak #ETCvsBTC
{spot}(ETCUSDT)
d
$ETC Analysis - Oct 13, 2026*
Ethereum Classic trading at *$8.28 (-2.47%)*
Short-term looks bearish but long-term structure still above 200 SMA support.
📊 Technicals:
50 SMA $8.26 acting as resistance
200 SMA $7.87 is major support
RSI 40.55 - Neutral to bearish, not oversold yet
🎯 Key Levels:
Resistance: $8.49 / $8.56
Support: $8.12 / $7.87 / $7.56
If $8.12 holds, bounce expected. Break below could drag to $7.87.
What's your take on ETC? Bullish or Bearish? 👇
#ETC #SolanaETFsEnd14WeekInflowStreak #ETCvsBTC
90

·
--
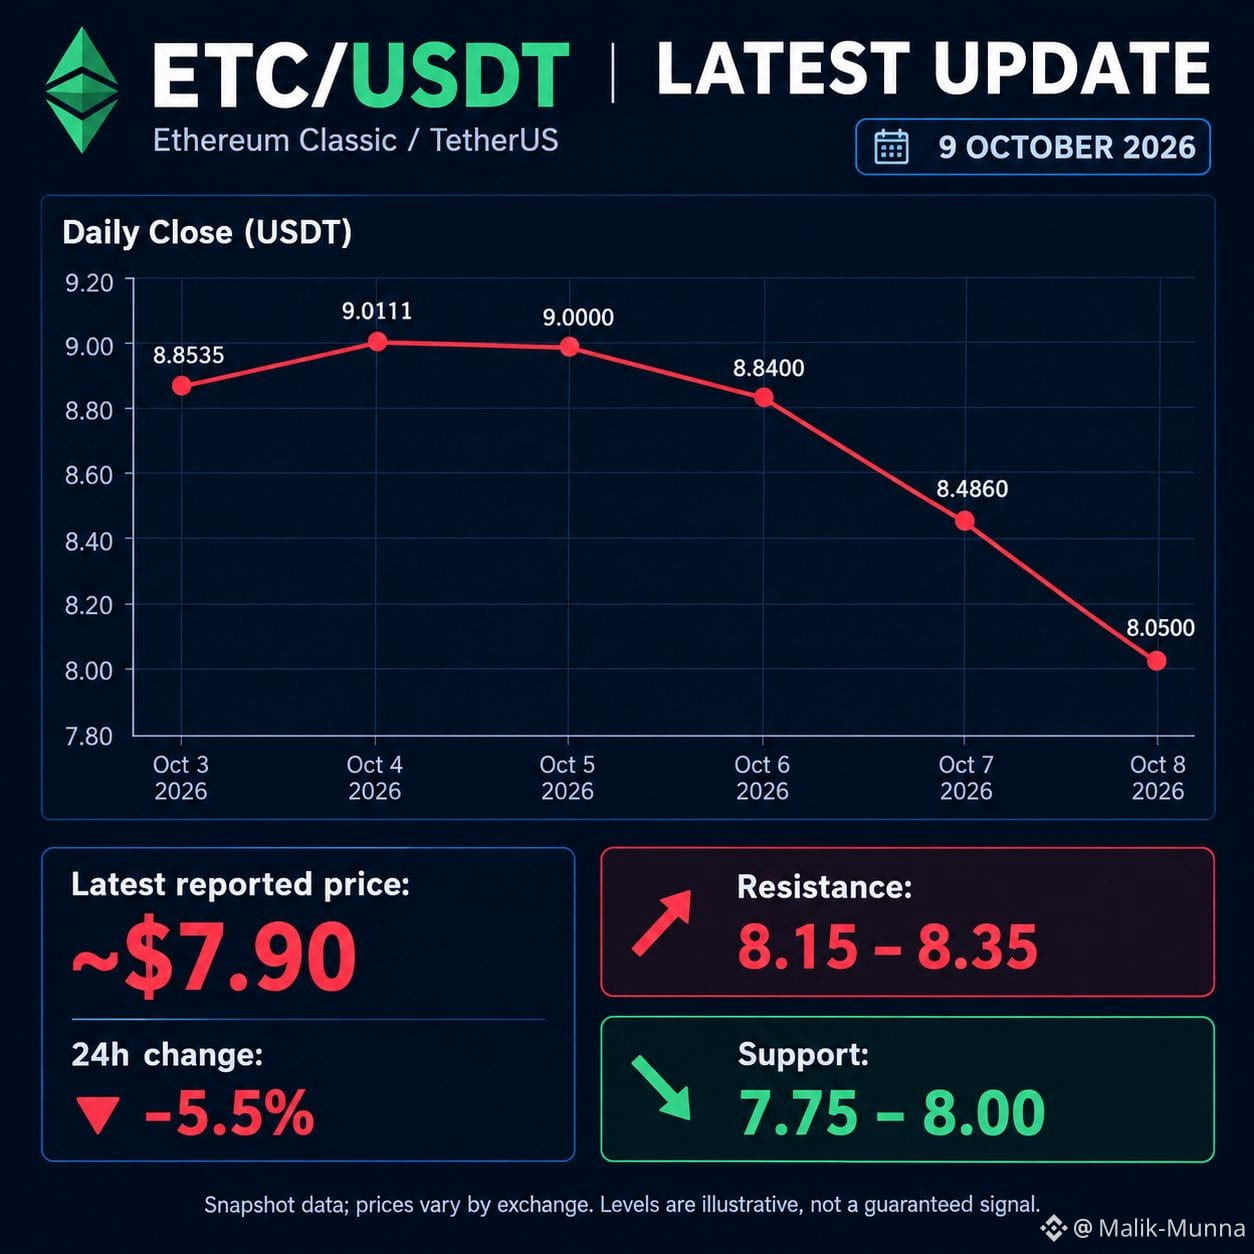
📉$ETC /USDT — Latest Short Update
📅 Date: October 9, 2026
🔴 Market Trend: Bearish if resistance holds
📍 Resistance: $8.16 – $8.36
🎯 Short Targets: $8.00 → $7.80
🛑 Stop-Loss: Above resistance after confirmation
📊 Trading Strategy:
Wait for a pullback to resistance and bearish confirmation before entering a SHORT trade. A confirmed breakdown below support may indicate further downside.
⚠️ Note: Verify the live price and chart before trading. These levels are illustrative, not verified live-market data. Always use risk management. DYOR.
#ETH🔥🔥🔥🔥🔥🔥 #ETCBearish #ETCvsBTC
{future}(ETCUSDT)
📉$ETC /USDT — Latest Short Update
📅 Date: October 9, 2026
🔴 Market Trend: Bearish if resistance holds
📍 Resistance: $8.16 – $8.36
🎯 Short Targets: $8.00 → $7.80
🛑 Stop-Loss: Above resistance after confirmation
📊 Trading Strategy:
Wait for a pullback to resistance and bearish confirmation before entering a SHORT trade. A confirmed breakdown below support may indicate further downside.
⚠️ Note: Verify the live price and chart before trading. These levels are illustrative, not verified live-market data. Always use risk management. DYOR.
#ETH🔥🔥🔥🔥🔥🔥 #ETCBearish #ETCvsBTC
87

·
--
$ETC
{spot}(ETCUSDT)
ETC is showing cautious momentum near the $7.50–$7.60 zone.
Key support is around $7.45–$7.50.
A breakout above $7.75–$7.80 could trigger stronger upside momentum.
Holding above support keeps the short-term outlook neutral-to-bullish.
A break below $7.45 could open the door to further downside.#ETC #ETCvsBTC #ETCUSD #USBankCompletesCrossBorderPaymentPilotOnStellar
$ETC
ETC is showing cautious momentum near the $7.50–$7.60 zone.
Key support is around $7.45–$7.50.
A breakout above $7.75–$7.80 could trigger stronger upside momentum.
Holding above support keeps the short-term outlook neutral-to-bullish.
A break below $7.45 could open the door to further downside.#ETC #ETCvsBTC #ETCUSD #USBankCompletesCrossBorderPaymentPilotOnStellar

2
38

🎉back to 50 usd soon 🚀$ETC #ETCvsBTC
🎉back to 50 usd soon 🚀$ETC #ETCvsBTC
7
·
--
Төмен (кемімелі)


·
--
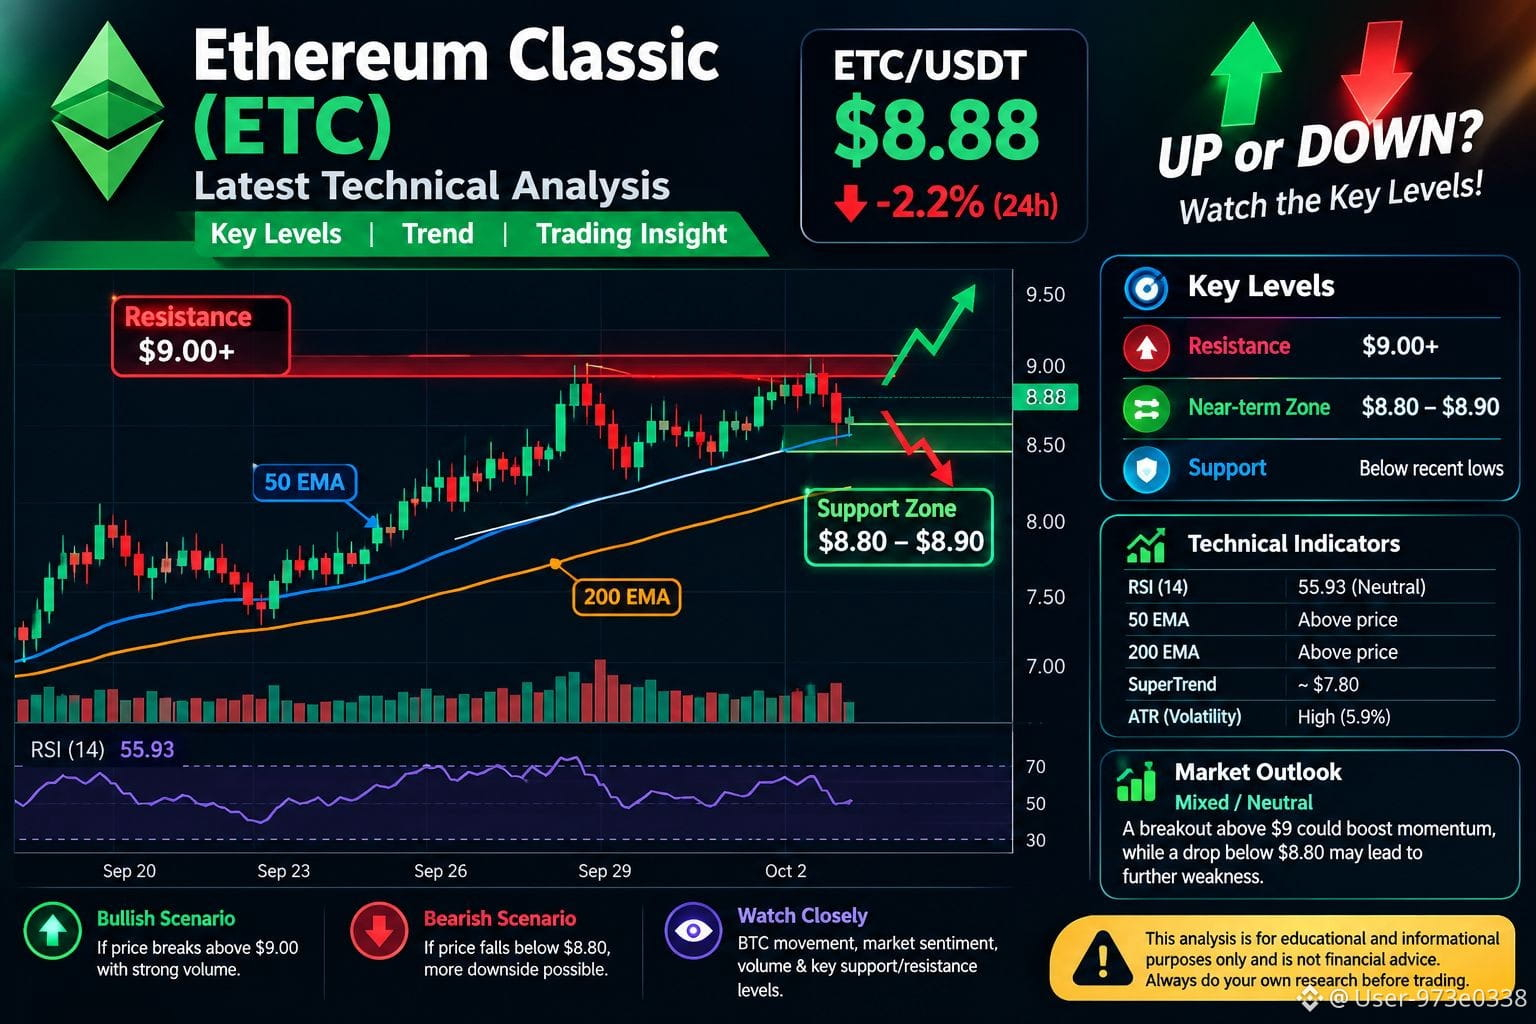
📊 Ethereum Classic ($ETC )
Latest Market Analysis
Ethereum Classic (ETC) continues to attract attention as traders monitor its recent price movement and overall market momentum. ETC has shown increased volatility, with both buyers and sellers remaining active around important price levels.
The $9.00 area is an important resistance zone to watch. If ETC manages to move above this level with strong trading volume, it could signal improving short-term momentum. On the downside, the $8.80–$8.90 area is an important near-term zone, while a deeper decline could bring lower support levels into focus.
Technical indicators are currently showing a mixed-to-neutral picture. Momentum has improved compared with recent weakness, but the market still needs confirmation through price action and volume before a stronger trend can be established.
Traders should also keep an eye on Bitcoin’s movement, overall crypto-market sentiment, trading volume, and major support/resistance levels, as these factors can significantly affect $ETC ##ETCvsBTC ##.
📈 Key Levels to Watch:
• Resistance: $9.00+
• Near-term zone: $8.80–$8.90
• Support: Watch for confirmation below recent lows
• Momentum: Mixed / Neutral
• Volatility: High
Overall, ETC remains a coin to watch closely as it approaches key technical levels. A confirmed breakout or breakdown could provide a clearer indication of the next major price direction.
⚠️ Disclaimer: This analysis is for educational and informational purposes only and is not financial advice. Always do your own research before making any investment decision.#MetaMaskExitsLidoValidatorsAfterSecurityIncident #MicronBeatsEarningsLiftsGuidance #CFTCSubmitsTwoEventContractRulesToWhiteHouse #AltcoinSeasonIndexHoldsAbove60For5Days
{spot}(ETCUSDT)
📊 Ethereum Classic ($ETC )
Latest Market Analysis
Ethereum Classic (ETC) continues to attract attention as traders monitor its recent price movement and overall market momentum. ETC has shown increased volatility, with both buyers and sellers remaining active around important price levels.
The $9.00 area is an important resistance zone to watch. If ETC manages to move above this level with strong trading volume, it could signal improving short-term momentum. On the downside, the $8.80–$8.90 area is an important near-term zone, while a deeper decline could bring lower support levels into focus.
Technical indicators are currently showing a mixed-to-neutral picture. Momentum has improved compared with recent weakness, but the market still needs confirmation through price action and volume before a stronger trend can be established.
Traders should also keep an eye on Bitcoin’s movement, overall crypto-market sentiment, trading volume, and major support/resistance levels, as these factors can significantly affect $ETC ##ETCvsBTC ##.
📈 Key Levels to Watch:
• Resistance: $9.00+
• Near-term zone: $8.80–$8.90
• Support: Watch for confirmation below recent lows
• Momentum: Mixed / Neutral
• Volatility: High
Overall, ETC remains a coin to watch closely as it approaches key technical levels. A confirmed breakout or breakdown could provide a clearer indication of the next major price direction.
⚠️ Disclaimer: This analysis is for educational and informational purposes only and is not financial advice. Always do your own research before making any investment decision.#MetaMaskExitsLidoValidatorsAfterSecurityIncident #MicronBeatsEarningsLiftsGuidance #CFTCSubmitsTwoEventContractRulesToWhiteHouse #AltcoinSeasonIndexHoldsAbove60For5Days
1
302


·
--
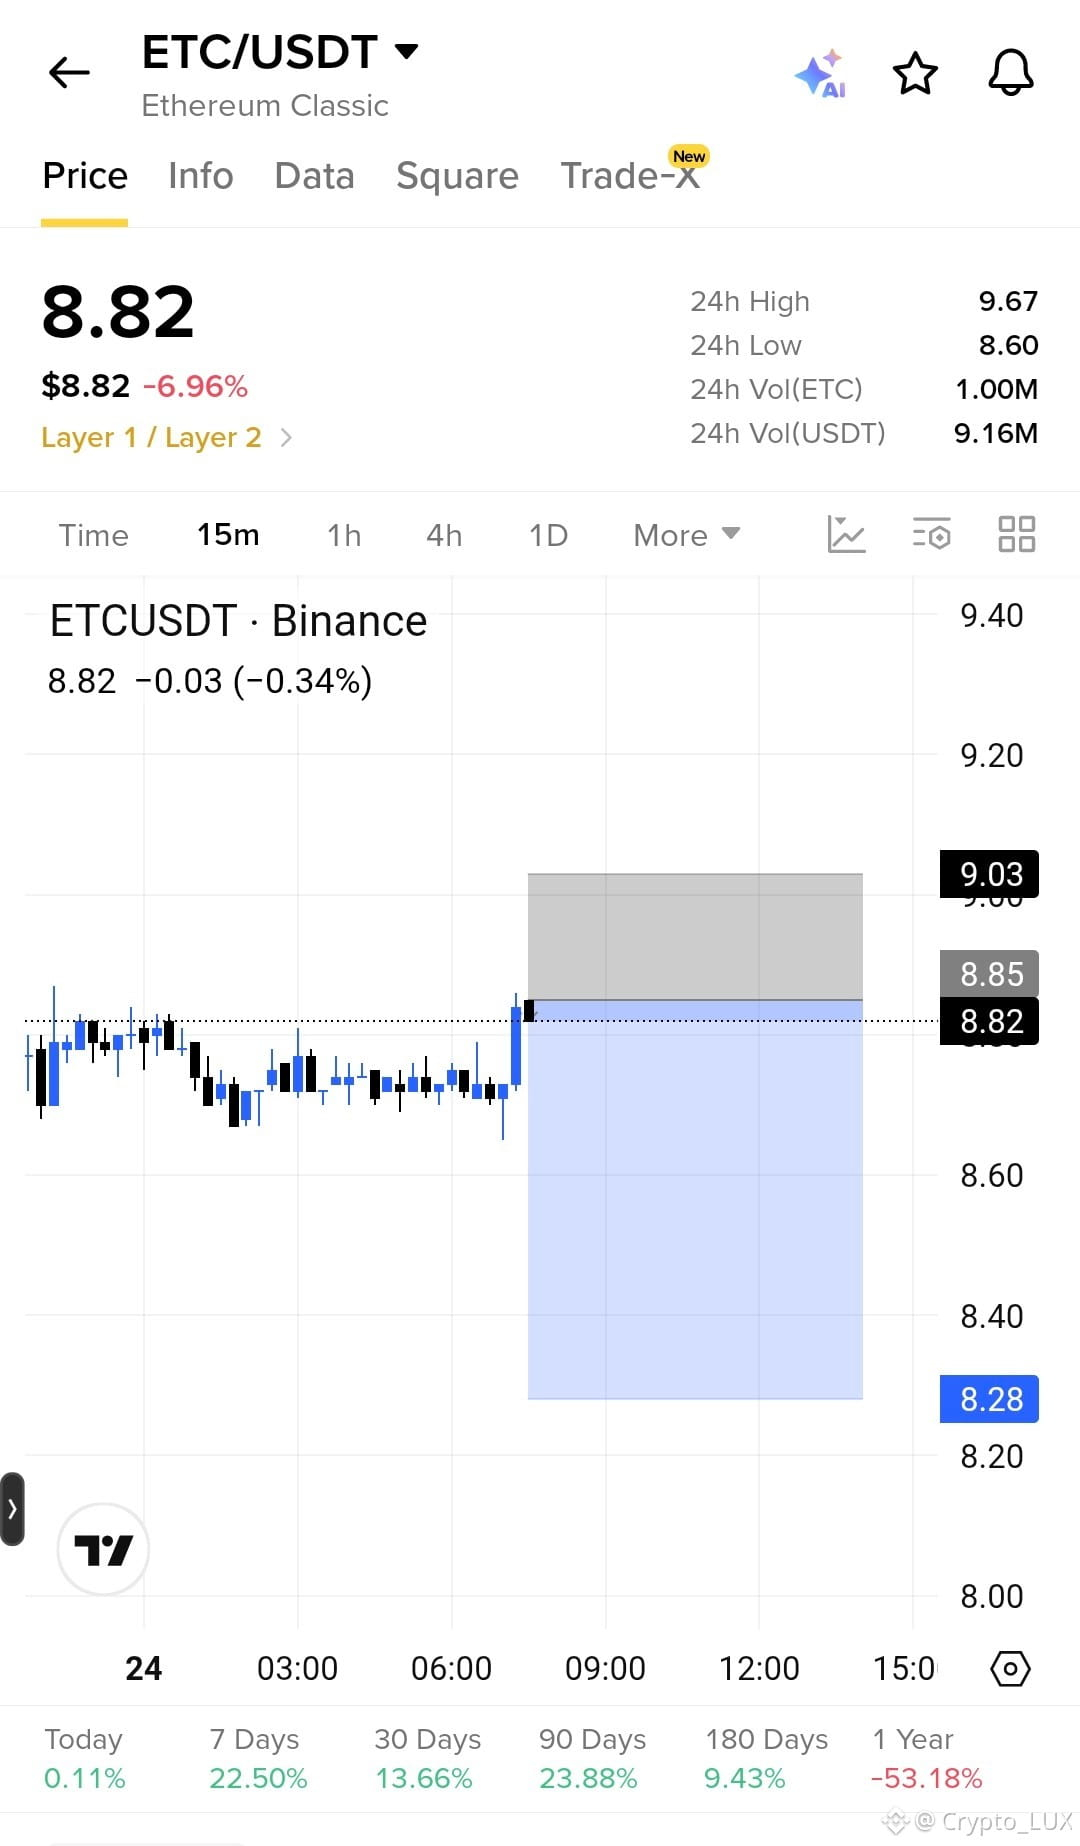
$ETC is going to form right shoulder to complete it's head and shoulder pattern (Potentially )
Entry: 8.18$
Take profit : 8.28$
SL: 9.1$
Do proper Risk management and avoid high leverages .
#ETCvsBTC #AIStocksWhatNext
{future}(ETCUSDT)
$ETC is going to form right shoulder to complete it's head and shoulder pattern (Potentially )
Entry: 8.18$
Take profit : 8.28$
SL: 9.1$
Do proper Risk management and avoid high leverages .
#ETCvsBTC #AIStocksWhatNext
Entry: 8.18$
Take profit : 8.28$
SL: 9.1$
Do proper Risk management and avoid high leverages .
#ETCvsBTC #AIStocksWhatNext
5
4
1.2k

ETC is showing strong stability and fresh bullish signals this week.
On Binance, traders are watching ETC closely because:
✨ A trusted and time-tested blockchain
✨ Strong community support
✨ High liquidity and consistent trading volume
✨ Real long-term potential
ETC may not make noise every day, but when it moves — it moves big.
Stay focused, stay patient, and let the market reward smart decisions. 📈🔥#ETCvsBTC

1
90

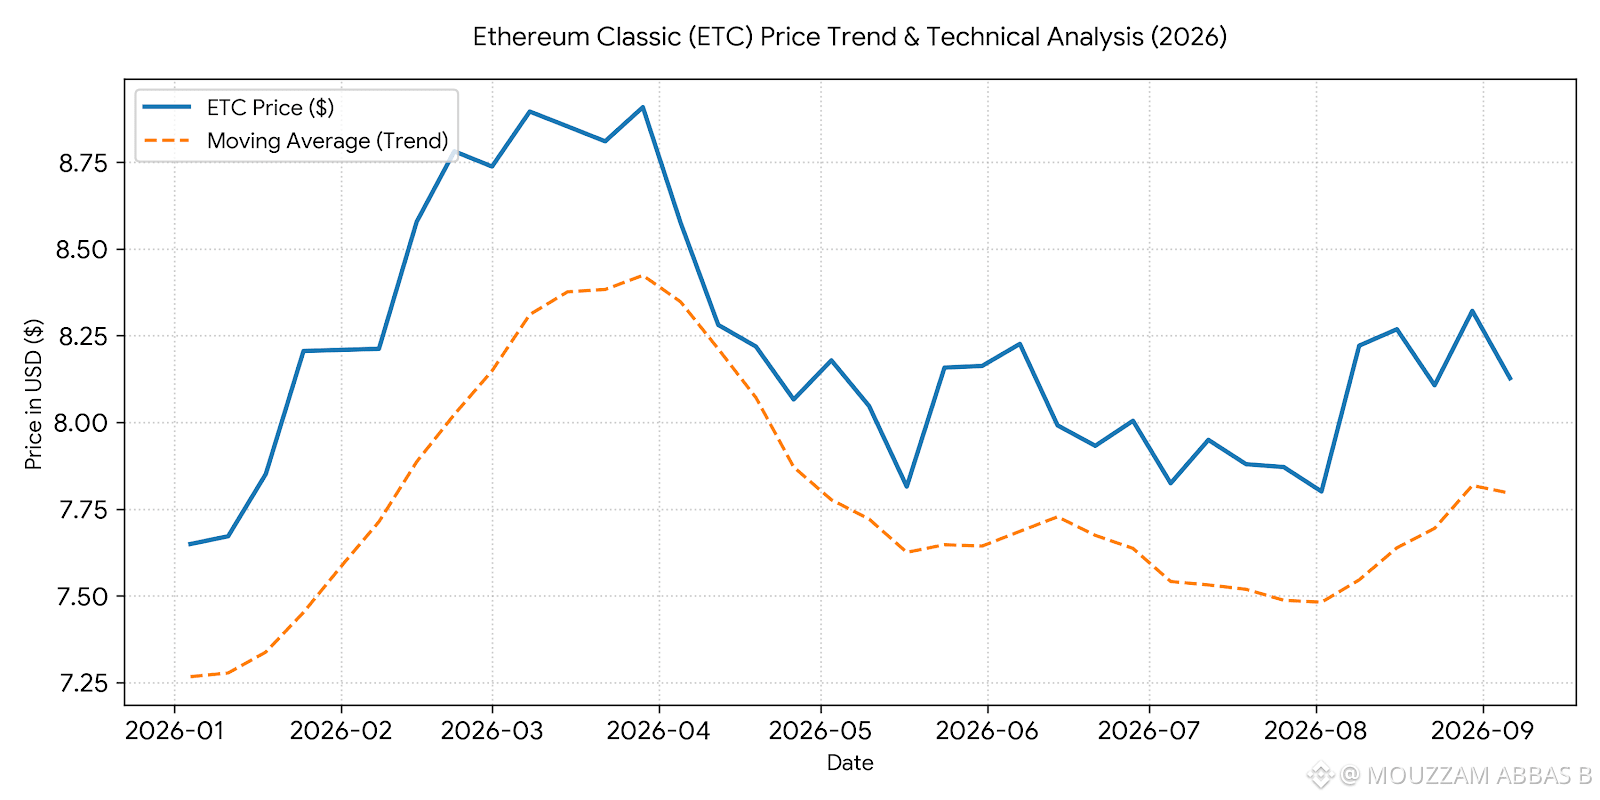
$ETC Ethereum Classic (ETC) trading reflects a nuanced market dynamic shaped by its proof-of-work (PoW) consensus model, dedicated miner backing, and ongoing correlation with broader macroeconomic and cryptocurrency trends.
Market Fundamentals & Performance
Consensus & Security: Operating as an immutable PoW network, ETC appeals to participants valuing protocol permanence following Ethereum's transition to proof-of-stake.
Current Price Range: Trading generally hovers in the $7.50 to $8.50 range, exhibiting short-term volatility alongside broader crypto market fluctuations.
Technical Indicators: Moving averages indicate a consolidation phase, with key support levels established around $7.50 and resistance encountered near $8.40.
Key Trading Considerations
Liquidity & Volatility: ETC typically experiences higher relative volatility compared to larger-cap assets, necessitating strict risk management and predefined stop-loss levels.
Network Catalysts: Ongoing network adjustments, miner hash rate distribution, and broader market sentiment remain primary drivers influencing near-term price momentum.
{spot}(ETCUSDT)
#ETCUSDT #AEROSurges17%In24Hours #IranSaysItCapturedUSUnmannedSubmarine #USIranTradeTankerStrikesEscalate #ETCvsBTC
$ETC Ethereum Classic (ETC) trading reflects a nuanced market dynamic shaped by its proof-of-work (PoW) consensus model, dedicated miner backing, and ongoing correlation with broader macroeconomic and cryptocurrency trends.
Market Fundamentals & Performance
Consensus & Security: Operating as an immutable PoW network, ETC appeals to participants valuing protocol permanence following Ethereum's transition to proof-of-stake.
Current Price Range: Trading generally hovers in the $7.50 to $8.50 range, exhibiting short-term volatility alongside broader crypto market fluctuations.
Technical Indicators: Moving averages indicate a consolidation phase, with key support levels established around $7.50 and resistance encountered near $8.40.
Key Trading Considerations
Liquidity & Volatility: ETC typically experiences higher relative volatility compared to larger-cap assets, necessitating strict risk management and predefined stop-loss levels.
Network Catalysts: Ongoing network adjustments, miner hash rate distribution, and broader market sentiment remain primary drivers influencing near-term price momentum.
#ETCUSDT #AEROSurges17%In24Hours #IranSaysItCapturedUSUnmannedSubmarine #USIranTradeTankerStrikesEscalate #ETCvsBTC
1
1
114
·
--
Жоғары (өспелі)
$ETC
ETC Update
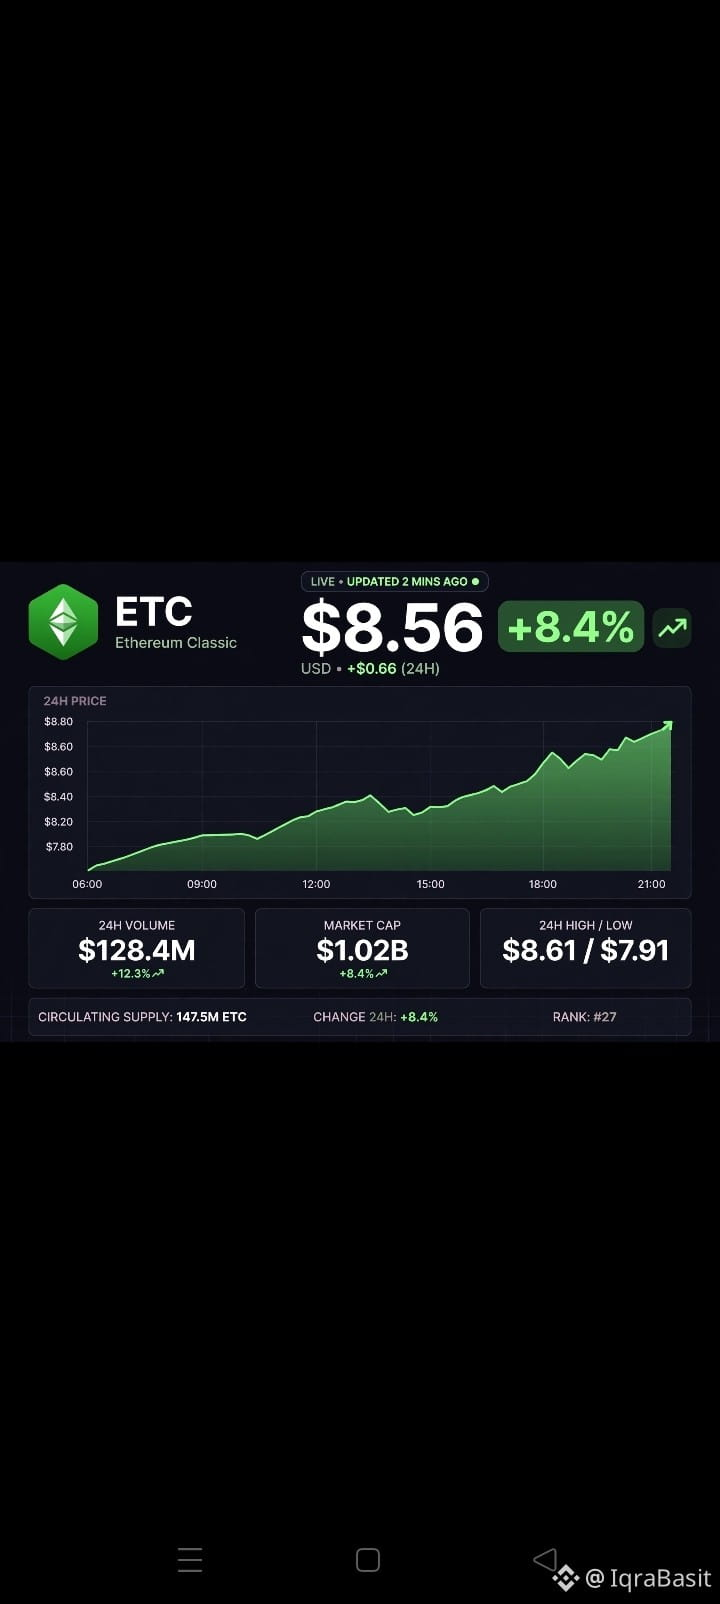
$ETC Ethereum Classic *$8.47 - $8.56*, up *+6.8% to +8.4%* today. Range *$7.86 - $8.61*. Market cap *$1.29B - $1.35B*, rank *#66-71*, volume *$79M* (+52%). Up *+17.6%* month, *+8%* week, but *-59%* YoY from $167 ATH. Beta-driven $BTC rally, TVL +9.6%, support $7.77.
#ETCUSDT #crypto #ETCvsBTC #ETCBearish #etccoin
{future}(ETCUSDT)
$ETC
ETC Update
$ETC Ethereum Classic *$8.47 - $8.56*, up *+6.8% to +8.4%* today. Range *$7.86 - $8.61*. Market cap *$1.29B - $1.35B*, rank *#66-71*, volume *$79M* (+52%). Up *+17.6%* month, *+8%* week, but *-59%* YoY from $167 ATH. Beta-driven $BTC rally, TVL +9.6%, support $7.77.
#ETCUSDT #crypto #ETCvsBTC #ETCBearish #etccoin
49


·
--
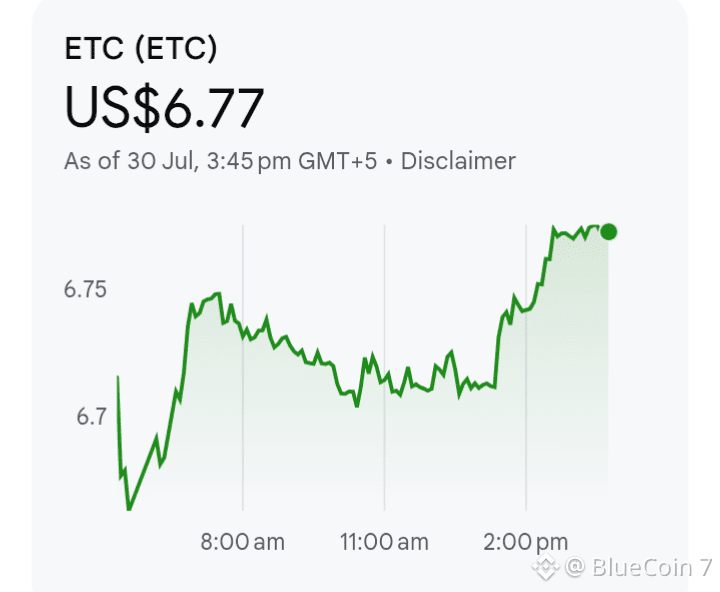
$ETC (Ethereum Classic) is trading at approximately $6.77 following a minor intraday recovery.
ETC (ETC)US$6.77As of 30 Jul, GMT+5 • Disclaimer🚨
Technical & Market Analysis :
1.Price Stability: The asset has found immediate horizontal support around the $6.70 mark after showing a +0.85% recovery from its daily lows.
2.Trading Momentum: Consistent buying pressure over the last several hours points to a short-term consolidation phase, though it remains highly dependent on broader market structures.
3.Resistance Level: A clean breakout above $6.80 is required to trigger a sustained upward rally toward major psych zones.
Crucial Strategic Risk Factors
1.Ecosystem Growth: ETC continues to struggle with decentralized application (dApp) deployment compared to competitive Proof-of-Work (PoW) and Proof-of-Stake (PoS) blockchains.
2.Network Security: Its fixed supply model appeals to long-term store-of-value investors, but lower relative hash rates expose the network to ongoing security premium considerations
#ETC #ETCUSDT #ETCvsBTC #ETC/USDT #CryptocurrencyWealth
113
·
--
Жоғары (өспелі)
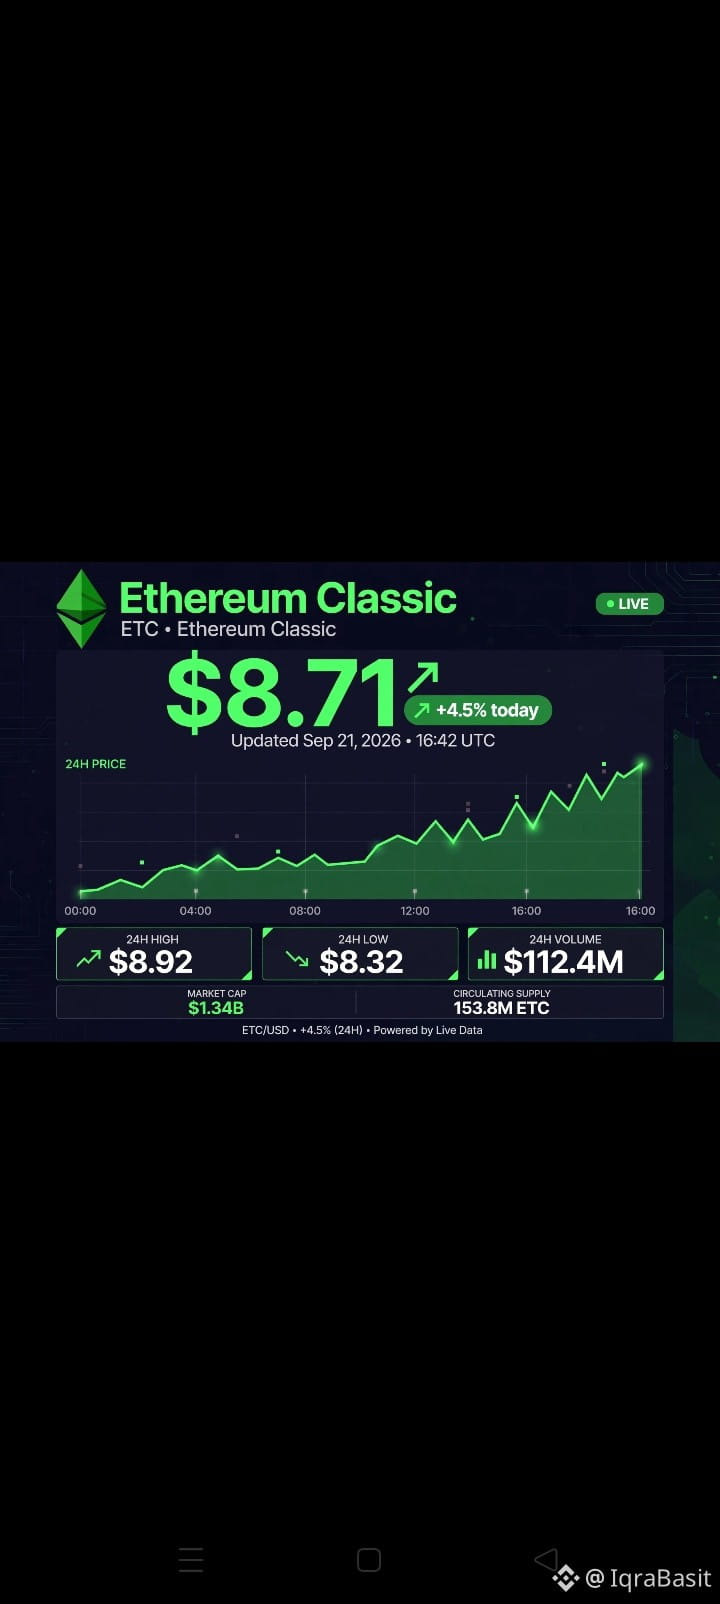
$ETC Update
$ETC Classic *$8.71 (+4.5%)*, range *$8.22-$8.76*. Market cap *$1.29B*, volume ∼$79M.
Up *+15.4%* 5-day, *-31%* YTD, *-58%* YoY from $179 ATH.
PoW beta rally with $ETC , TVL up. Holding above $8.32 support, eyeing $8.92-$9.04 resistance. Next hurdle $10.
#ETCUSDT #ETCUpdate #ETCvsBTC #ETC #etcpow
{future}(ETCUSDT)
$ETC Update
$ETC Classic *$8.71 (+4.5%)*, range *$8.22-$8.76*. Market cap *$1.29B*, volume ∼$79M.
Up *+15.4%* 5-day, *-31%* YTD, *-58%* YoY from $179 ATH.
PoW beta rally with $ETC , TVL up. Holding above $8.32 support, eyeing $8.92-$9.04 resistance. Next hurdle $10.
#ETCUSDT #ETCUpdate #ETCvsBTC #ETC #etcpow
$ETC Classic *$8.71 (+4.5%)*, range *$8.22-$8.76*. Market cap *$1.29B*, volume ∼$79M.
Up *+15.4%* 5-day, *-31%* YTD, *-58%* YoY from $179 ATH.
PoW beta rally with $ETC , TVL up. Holding above $8.32 support, eyeing $8.92-$9.04 resistance. Next hurdle $10.
#ETCUSDT #ETCUpdate #ETCvsBTC #ETC #etcpow
76
Көбірек контент көру үшін кіріңіз
Binance Square платформасында әлемдік криптоқоғамдастыққа қосылыңыз
⚡️ Криптовалюта туралы ең соңғы және пайдалы ақпаратты алыңыз.
💬 Әлемдегі ең ірі криптобиржаның сеніміне ие.
👍 Расталған авторлардың нақты пікірлерін табыңыз.
Электрондық пошта/телефон нөмірі
Трендтегі тақырыптар
1
#BinanceReports80%Recoveryof$6.3BillioninLossesfromHackIncident
7,918 рет көрілді
86 адам талқылап жатыр
2
#HeYiSaysWithdrawalsExpectedtoResumeWithin42Hours
14,264 рет көрілді
292 адам талқылап жатыр
3
#CZSaysCompensationIsinPlaceUsersAreProtected
13,445 рет көрілді
222 адам талқылап жатыр
4
#RichardTengSaysBinanceWillCoverAllHackedLosseswithCompanyFunds
580 рет көрілді
13 адам талқылап жатыр
5
#IntelHasItsWorstDaySince1974
0 рет көрілді
8 адам талқылап жатыр
6
#TRMCambodianCasinosReceived$1.07BInCrypto
856 рет көрілді
32 адам талқылап жатыр
7
#USDCCirculationFallsAbout800MInSevenDays
10,121 рет көрілді
201 адам талқылап жатыр
8
#SuspectedNorthKoreaAttacksAccountForNearly89%OfCryptoHackLosses
6,935 рет көрілді
69 адам талқылап жатыр
9
#OpenAICutsFundraisingTargetBy$10B
1,232 рет көрілді
53 адам талқылап жатыр
10
#ASICHasReceivedNoPredictionMarketApplications
24,476 рет көрілді
610 адам талқылап жатыр