

#chartstructure
chartstructure
2,099 рет көрілді
32 адам талқылап жатыр
Қызу саудада
Ең соңғы

·
--
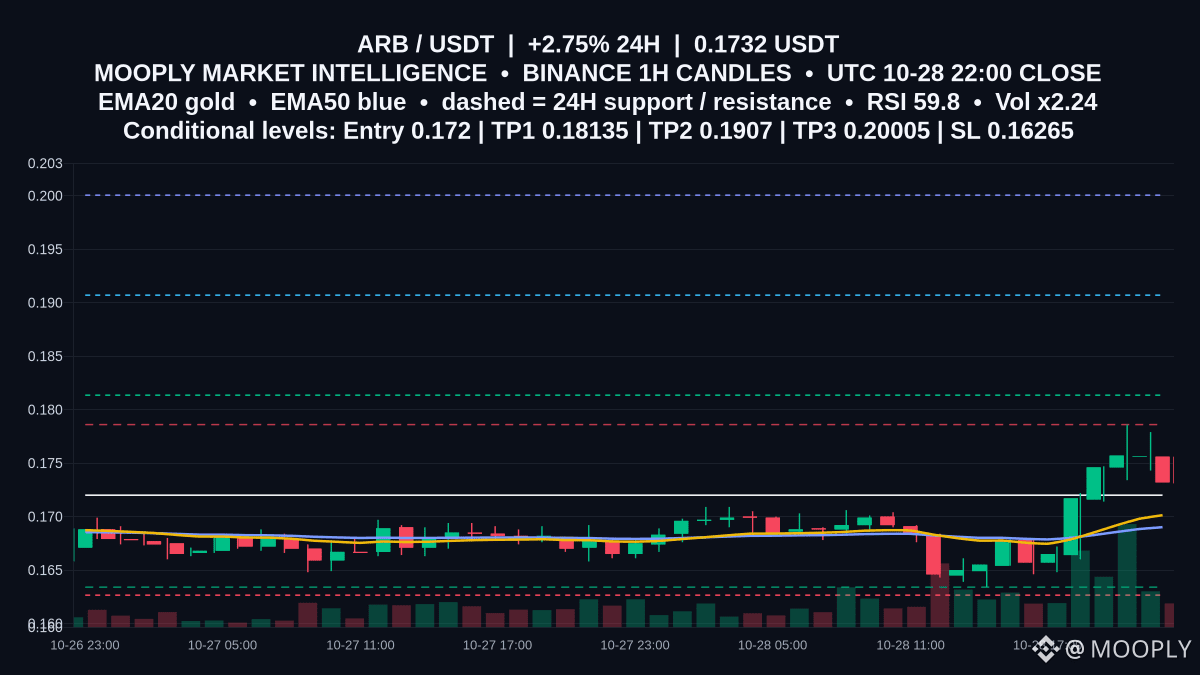
$ARB is trading at 0.1732 after a 2.75% 24h move — a modest breakout attempt inside a volatile, higher-volume session.
EMA20 (0.17013) above EMA50 (0.16901), RSI 59.82 and a positive MACD point to short-term bullish tilt; ATR14 of 0.00299 defines typical hourly noise and helps size stop placement. Key horizontal lines: support 0.1634 and resistance 0.1786.
📍 Potential entry: 0.172
🎯 Target 1: 0.18135
🎯 Target 2: 0.1907
🛑 Stop / invalidation: 0.16265
This is a conditional bullish scenario: confirmation would come from holding above the 0.172 entry and attacking resistance at 0.1786; the setup is invalidated if price breaches support around 0.1634 and hits the listed stop. Would you like this turned into an hourly alert or annotated on the chart?
Not financial advice.
#ARB #ChartStructure #UpsideScenario
85
·
--
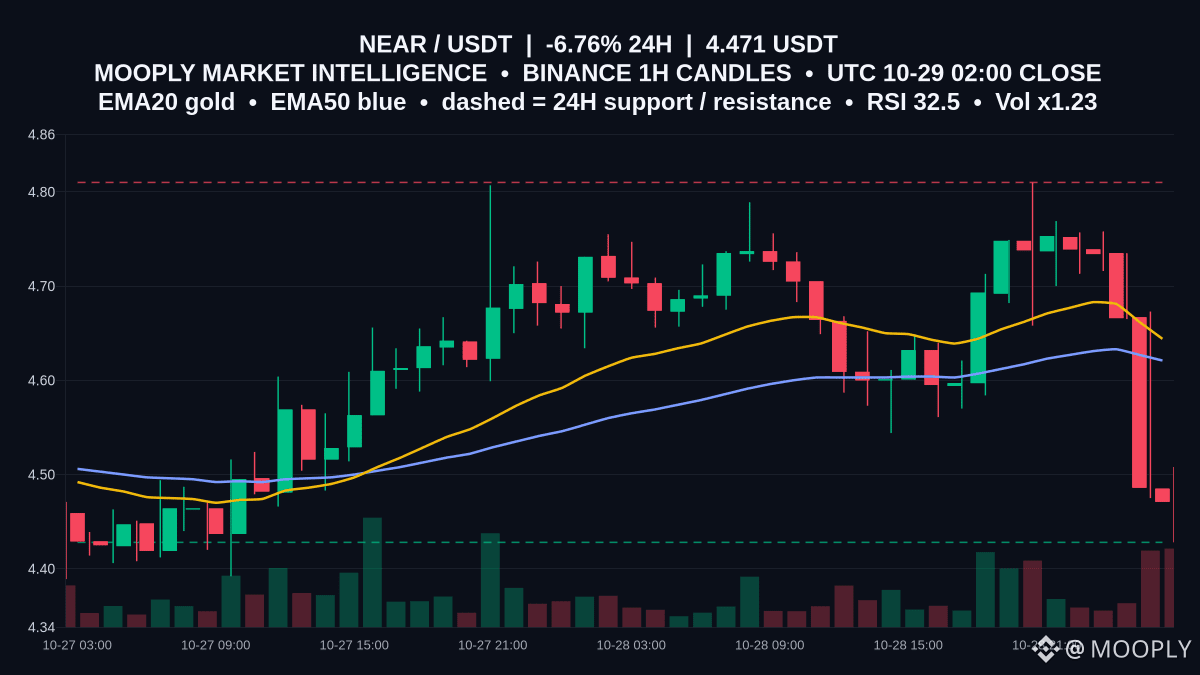
Pullback deepens for $NEAR, printing 4.471 with a -6.762% 24h slide.
RSI at 32.52 signals near-oversold, but price sits beneath EMA20 4.644 and EMA50 4.621, showing sellers in control on the 1h. With ATR 0.084 and volume around 1.23x recent, expect choppy but contained moves.
Range in play: support is 4.428 and resistance is 4.81. A 1h close below 4.428 would tip the range lower; a firm reclaim and hold above the 4.621–4.644 EMA band would ease pressure and refocus price toward 4.81 while that cap holds.
Which comes first on your radar: a defense of 4.428 or a reclaim of the EMA band near 4.62–4.64?
Not financial advice.
#NEAR #ChartStructure #RangeWatch
Pullback deepens for $NEAR , printing 4.471 with a -6.762% 24h slide.
RSI at 32.52 signals near-oversold, but price sits beneath EMA20 4.644 and EMA50 4.621, showing sellers in control on the 1h. With ATR 0.084 and volume around 1.23x recent, expect choppy but contained moves.
Range in play: support is 4.428 and resistance is 4.81. A 1h close below 4.428 would tip the range lower; a firm reclaim and hold above the 4.621–4.644 EMA band would ease pressure and refocus price toward 4.81 while that cap holds.
Which comes first on your radar: a defense of 4.428 or a reclaim of the EMA band near 4.62–4.64?
Not financial advice.
#NEAR #ChartStructure #RangeWatch
60
·
--
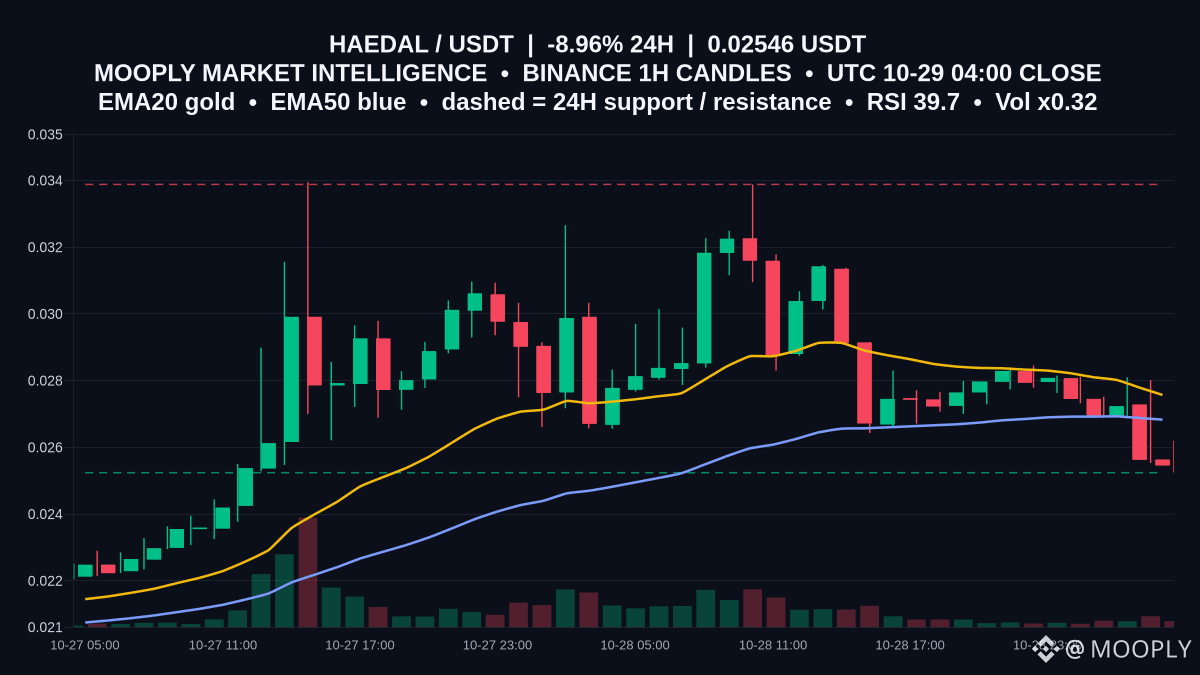
$HAEDAL slipped to 0.02546 (-8.96% 24H) as the last 1h candle closed near a make-or-break zone.
Why it matters: 0.02524 is defined support on this 1h view; with ATR14 at 0.00112 and volume running at 0.32x, whipsaws around this floor are plausible. RSI 39.7 and a negative MACD align with price trading below EMA50 0.02683 and EMA20 0.02757, keeping bias cautious.
Range outlook: support 0.02524, resistance 0.03388. Holding hourly closes above 0.02524 keeps the range intact; a rebound reclaiming 0.02683 would hint at stabilization toward 0.02757. Rejections under 0.02683 keep pressure on 0.02524, while a firm close above 0.03388 would mark a range break.
Would you like an alert on the next 1h close versus 0.02524 and 0.02683?
Not financial advice.
#HAEDAL #ChartStructure #RangeWatch
22
·
--
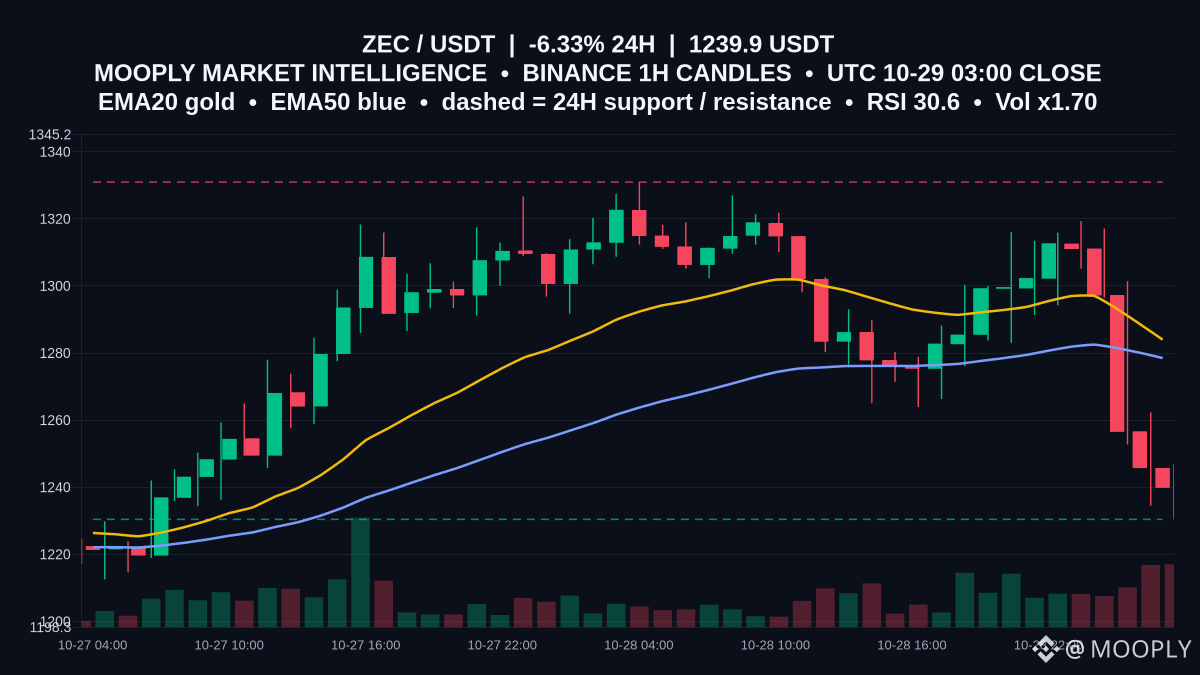
$ZEC slips to 1239.9, down -6.332% over 24h with Vol x1.70, as momentum cools.
Price is hovering just above 1230.4 support while RSI 30.6 hints at pressure without full capitulation. Both EMA20 1283.99 and EMA50 1278.5 are rolling over above price, reinforcing a cautious tone. With resistance at 1330.95, the working view is a 1230.4–1330.95 range until either the EMAs are reclaimed or the floor gives way.
For now, watch 1230.4 as the near-term line in the sand; an hourly close back above 1283.99 would refocus price toward 1330.95. Which level are you watching first: a reclaim of 1283.99 or a test of 1230.4?
Not financial advice.
#ZEC #ChartStructure #RangeWatch
1
104
·
--
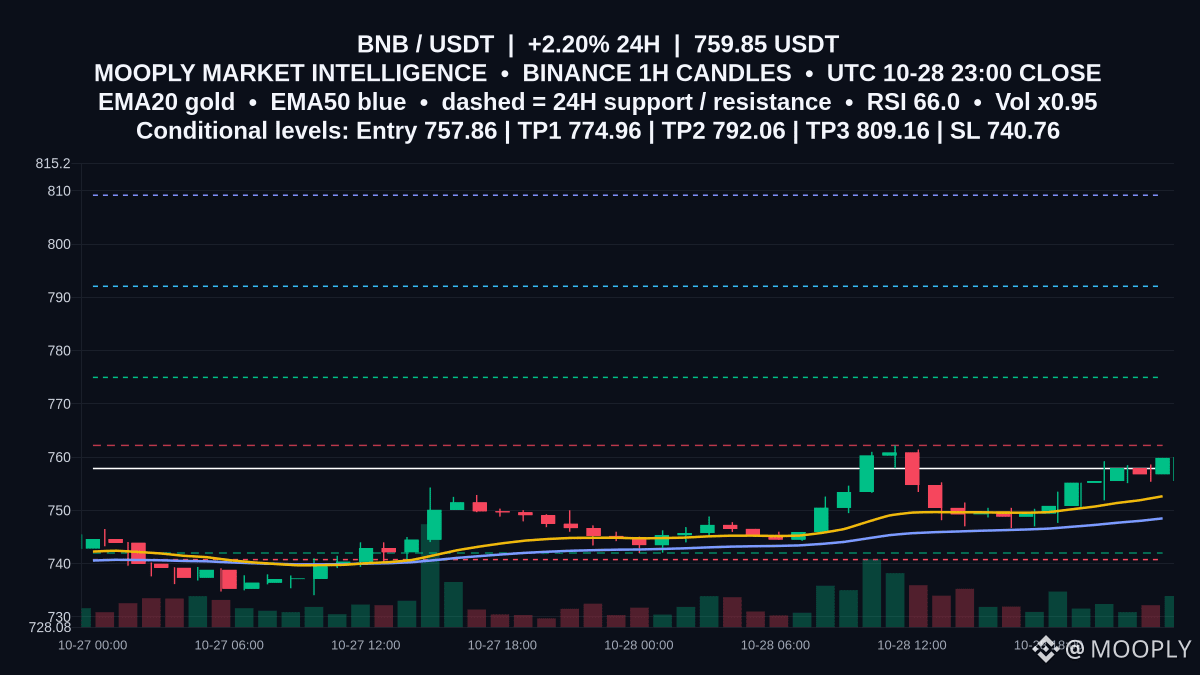
Breakout watch: $BNB sits just below a defined ceiling as momentum firms.
Price is 759.85, holding above EMA20 752.66 and EMA50 748.5, with RSI at 65.98. That alignment spotlights 762.2 resistance; a clean move through it would mark shift from the 742 support base toward higher levels.
📍 Potential entry: 757.86
🎯 Target 1: 774.96
🎯 Target 2: 792.06
🛑 Stop / invalidation: 740.76
Confirmation improves on a 1h close above 762.2 while staying bid over 757.86; that keeps 774.96 and 792.06 in play. If 742 support breaks or price closes below 740.76, the scenario is invalidated. Holding above EMA20 752.66 preserves the near-term bullish bias.
Would you like an alert on a confirmed 1h close over 762.2 or a retest of 742?
Not financial advice.
#BNB #ChartStructure #UpsideScenario
59
·
--
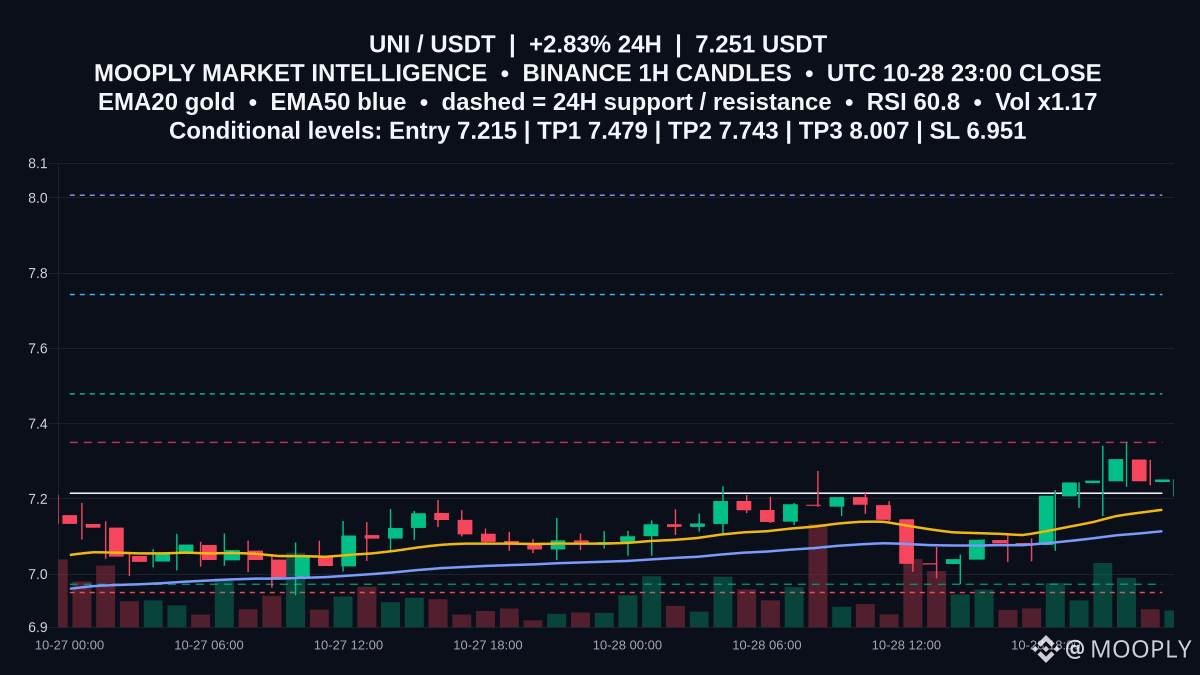
Quick read on $UNI — trading at 7.251 USDT with a 24h move of 2.833%.
EMA20 (7.171) sits above EMA50 (7.114) and MACD is positive, suggesting short-term bullish bias. The 24h resistance at 7.35 is the immediate level that would confirm momentum; ATR14 0.089 shows measured volatility, and support at 6.973 lines up near the proposed invalidation zone.
📍 Potential entry: 7.215
🎯 Target 1: 7.479
🎯 Target 2: 7.743
🛑 Stop / invalidation: 6.951
This is a conditional bullish scenario: a sustained move above resistance 7.35 would confirm momentum while a drop below 6.973 (stop at 6.951 sits just below support) would invalidate it. Entry here is a scenario based on ATR and completed 1h candles, not an execution signal.
Do you want me to track 1h closes above 7.35 and alert on a confirmed breakout?
Not financial advice.
#UNI #ChartStructure #UpsideScenario
34
·
--
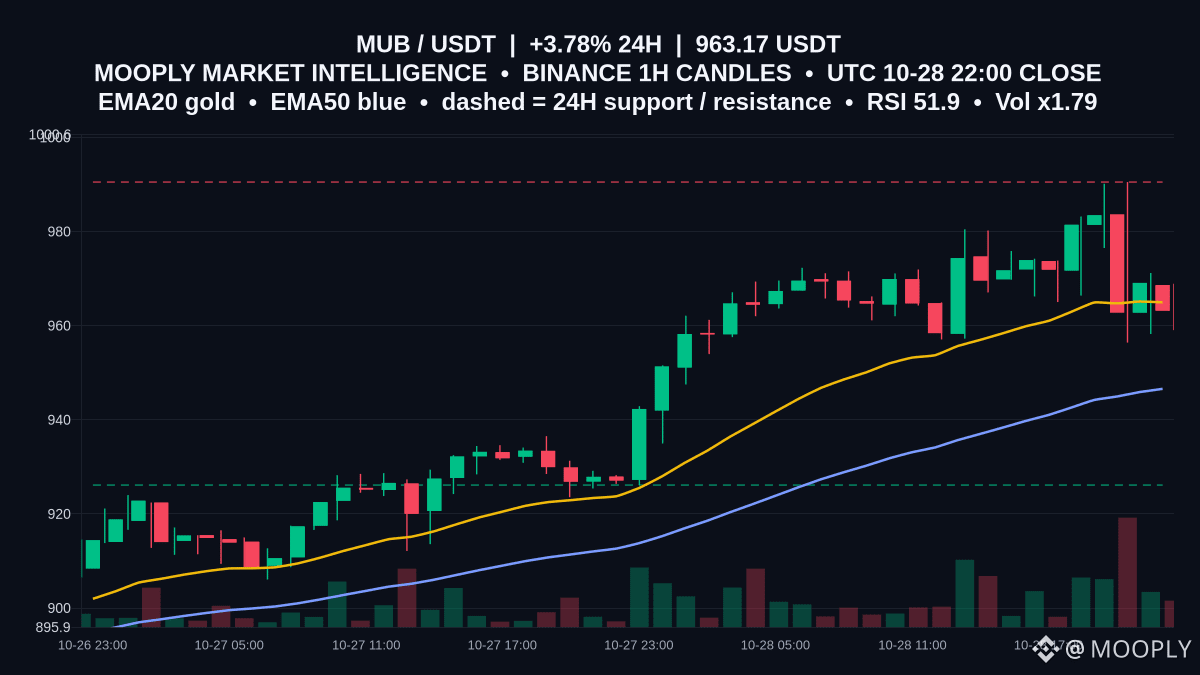
$MUB — The chart looks like a corridor more than a trend: price 963.17 sits just below EMA20 964.94 and above EMA50 946.57, inside the 24h dashed bands (support 926.12 / resistance 990.5). ATR14 = 12.63 shows modest hourly volatility, while volRatio 1.79 signals above-average activity. MACD (7.83) below its signal (10.14) hints momentum softness.
tradePlan = RANGE (confidence: wait; method: ATR14 and completed Binance 1h candles). Wait for a clear 1h close beyond 990.5 to consider a breakout confirmation, or a decisive close below 926.12 to invalidate the range—which 1h close will you watch first?
Not financial advice.
#MUB #ChartStructure #RangeWatch
21
·
--
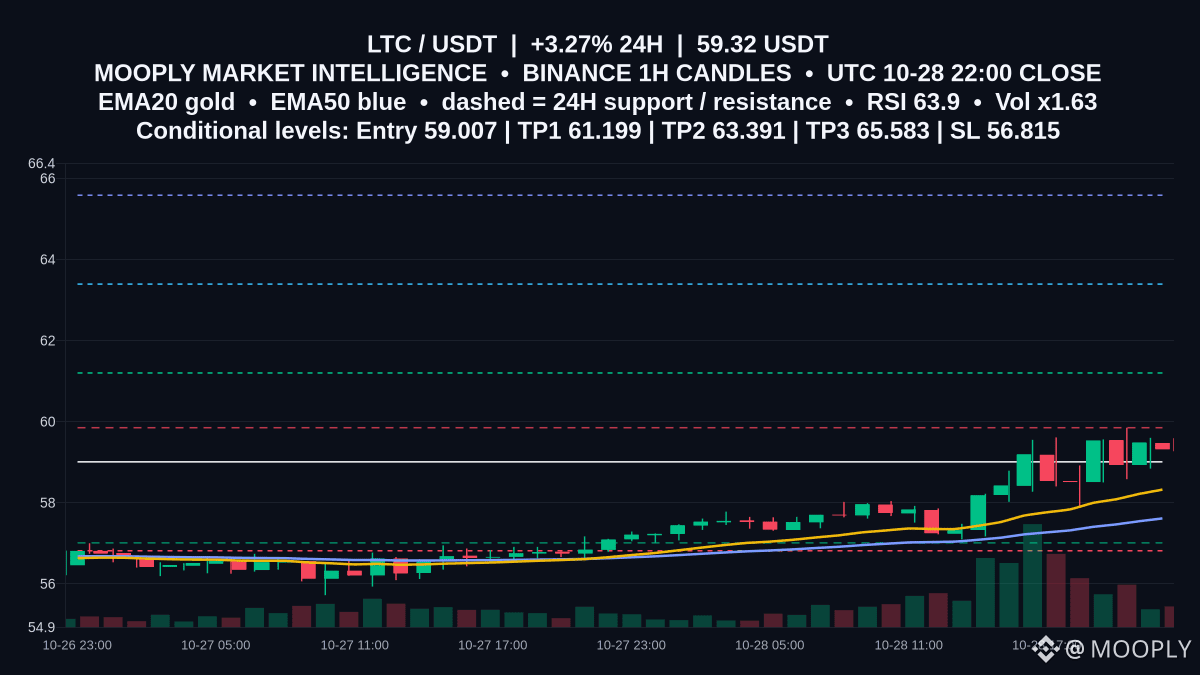
$LTC — Chart walkthrough — 1h shows the short EMAs leading the move: EMA20 58.323 over EMA50 57.613, with price at 59.32 and RSI 63.93. Volume is elevated (volRatio 1.63), so momentum has weight.
Conditional plan notes entry 59.007, SL 56.815, TP1 61.199 and TP2 63.391. Confirmation would be a sustained close above resistance 59.85 on continued volume; a breach below 56.815 or support 57.01 would invalidate. Can volume push and hold above 59.85?
Not financial advice.
#LTC #ChartStructure #UpsideScenario
36


·
--
Жоғары (өспелі)
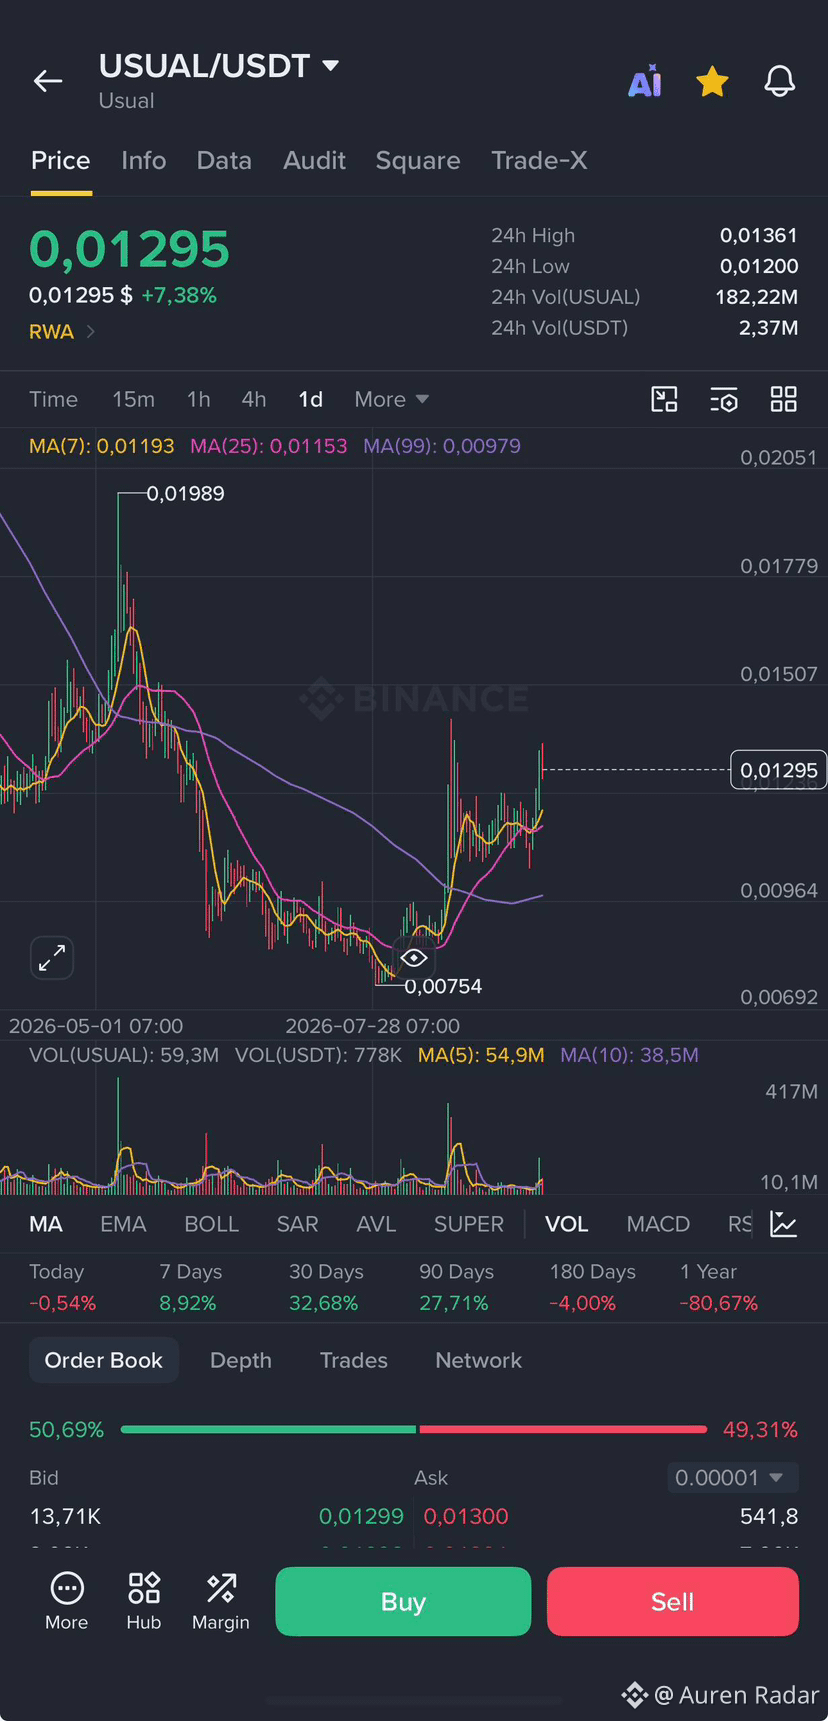
📡 $USUAL | Update
Up 5% then backtesting for confirmation, clean chart structure forming.
Support holding strong through the retest, setup remains solid for sustainable growth as RWA trend continues👀
📌 Personal opinion, not financial advice. DYOR.
#USUAL #RWA #Altcoins #ChartStructure $USUAL
{future}(USUALUSDT)
📡 $USUAL | Update
Up 5% then backtesting for confirmation, clean chart structure forming.
Support holding strong through the retest, setup remains solid for sustainable growth as RWA trend continues👀
📌 Personal opinion, not financial advice. DYOR.
#USUAL #RWA #Altcoins #ChartStructure $USUAL
Up 5% then backtesting for confirmation, clean chart structure forming.
Support holding strong through the retest, setup remains solid for sustainable growth as RWA trend continues👀
📌 Personal opinion, not financial advice. DYOR.
#USUAL #RWA #Altcoins #ChartStructure $USUAL
Auren Radar
·
--
Жоғары (өспелі)📡 $USUAL | RWA
Chart breakout confirmed with backtest holding strong, RWA trend heating up with $ONDO leading hard.
Same sector momentum, clean chart structure, positioned to follow when RWA wave extends👀
📌 Personal opinion, not financial advice. DYOR.
#USUAL #RWA #Altcoins #Breakout $USUAL
Chart breakout confirmed with backtest holding strong, RWA trend heating up with $ONDO leading hard.
Same sector momentum, clean chart structure, positioned to follow when RWA wave extends👀
📌 Personal opinion, not financial advice. DYOR.
#USUAL #RWA #Altcoins #Breakout $USUAL
1
353
·
--
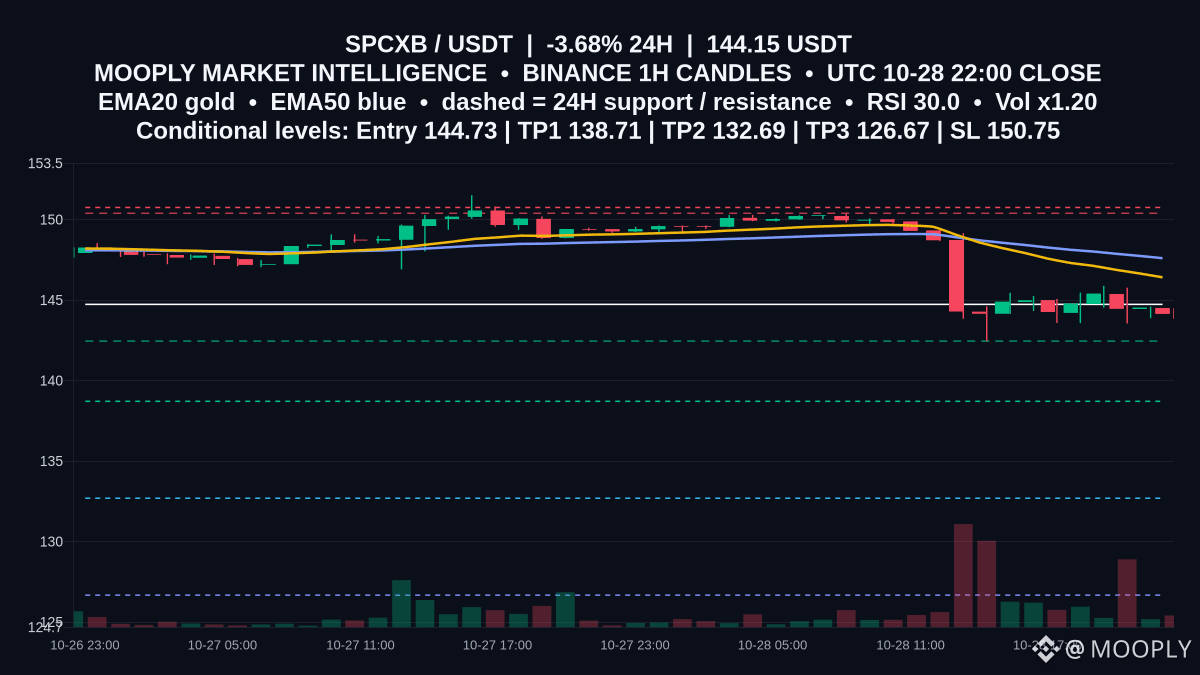
The 1h chart shows $SPCXB trading below EMA20 146.41 and EMA50 147.6, with RSI 29.99 and MACD -1.3198 vs signal -1.01097 — momentum tilted down.
MOOPLY's conditional bearish plan (ATR14 + completed 1h candles) lists Entry 144.73, StopLoss 150.75, TP1 138.71 and TP2 132.69. ATR is 1.45 and volRatio 1.2 — volume slightly elevated during the pullback.
Confirmation = a completed 1h around/below 144.73; invalidation = decisive closes above 150.75 or sustained reclaim of EMA20/50.
Will a 1h close below 144.73 target 138.71 next?
Not financial advice.
#SPCXB #ChartStructure #DownsideScenario
30
Көбірек контент көру үшін кіріңіз
Binance Square платформасында әлемдік криптоқоғамдастыққа қосылыңыз
⚡️ Криптовалюта туралы ең соңғы және пайдалы ақпаратты алыңыз.
💬 Әлемдегі ең ірі криптобиржаның сеніміне ие.
👍 Расталған авторлардың нақты пікірлерін табыңыз.
Электрондық пошта/телефон нөмірі
Трендтегі тақырыптар
1
#CanMicrosoftDeliverOnAI
592,165 рет көрілді
3,853 адам талқылап жатыр
2
#CanGoogleDefindItsCore
363,127 рет көрілді
2,735 адам талқылап жатыр
3
#FedWatch
16.1M рет көрілді
37,025 адам талқылап жатыр
4
#EarningsSeason
6.1M рет көрілді
30,118 адам талқылап жатыр
5
#BitcoinCoreIdentifiesThreeVulnerabilities
8,478 рет көрілді
175 адам талқылап жатыр
6
#RippleExpects$900MAnnualizedProductRevenueRunRate
340 рет көрілді
4 адам талқылап жатыр
7
#GoogleToPreviewCryptoCustodySecuritySystem
2,264 рет көрілді
74 адам талқылап жатыр
8
#FedToBeginShrinkingRateSettingCalendarIn2027
3,319 рет көрілді
46 адам талқылап жатыр
9
#StrategyShareholdersApproveDailyDividends
3,390 рет көрілді
68 адам талқылап жатыр
10
#FedLowerBoundRateDecisionAt3.75%
3,704 рет көрілді
42 адам талқылап жатыр