
#supportandresistance
supportandresistance
728,535 рет көрілді
1,685 адам талқылап жатыр
Қызу саудада
Ең соңғы

Ethereum is down 1.3% in 24h to $1805.7 with $635M in volume. Let's use this to learn support & resistance.
Support is a price floor where buyers historically step in. Resistance is a ceiling where sellers unload. Right now $ETH sits near a key support zone.
The golden rule: a support level is only valid if volume confirms it. $635M is meaningful activity, but if price slides through this zone on HIGH volume, support has failed and becomes new resistance. If it bounces on LOW volume, buyers lack conviction.
Always pair price action with volume. What's your favorite chart indicator for confirming a support bounce?
We post every algo signal's REAL result openly and the full live track record + a free preview channel are in our bio/profile.
#SupportAndResistance #CryptoTrading
Ethereum is down 1.3% in 24h to $1805.7 with $635M in volume. Let's use this to learn support & resistance.
Support is a price floor where buyers historically step in. Resistance is a ceiling where sellers unload. Right now $ETH sits near a key support zone.
The golden rule: a support level is only valid if volume confirms it. $635M is meaningful activity, but if price slides through this zone on HIGH volume, support has failed and becomes new resistance. If it bounces on LOW volume, buyers lack conviction.
Always pair price action with volume. What's your favorite chart indicator for confirming a support bounce?
We post every algo signal's REAL result openly and the full live track record + a free preview channel are in our bio/profile.
#SupportAndResistance #CryptoTrading
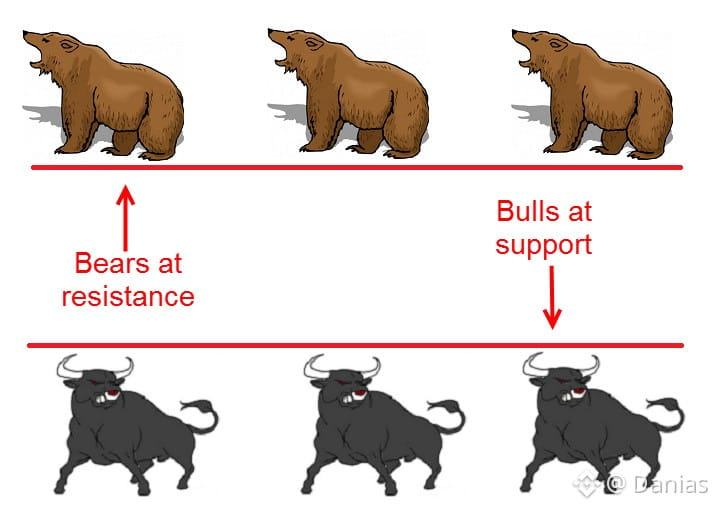
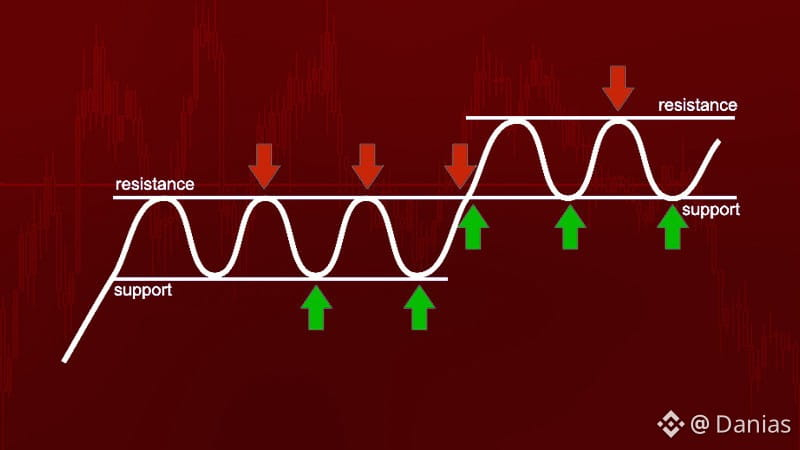
Support is a price floor where buyers historically step in. Resistance is a ceiling where sellers unload. Right now $ETH sits near a key support zone.
The golden rule: a support level is only valid if volume confirms it. $635M is meaningful activity, but if price slides through this zone on HIGH volume, support has failed and becomes new resistance. If it bounces on LOW volume, buyers lack conviction.
Always pair price action with volume. What's your favorite chart indicator for confirming a support bounce?
We post every algo signal's REAL result openly and the full live track record + a free preview channel are in our bio/profile.
#SupportAndResistance #CryptoTrading
4

·
--
🔥 MASTER SUPPORT & RESISTANCE – TRADE LIKE A PRO!
Most traders lose money because they enter at the wrong levels.
Remember these 2 golden rules:
🔵 SUPPORT: The price zone where buyers may step in.
🔴 RESISTANCE: The price zone where sellers may step in.
Example Trading Chart:
RESISTANCE ───────────── $105
↘ ↗ ↗ ↘ ↗ ↘ PRICE MOVEMENT ↘ ↗
───────────── $95 SUPPORT
📈 Buy near support after confirmation.
📉 Consider selling near resistance after confirmation.
⚠️ Never enter a trade without risk management.
💬 Question: Do you prefer buying support or trading resistance breakouts?
#SupportAndResistance
#TradingTips
#ConfirmationFirst
#RiskMamagement
#GoldenRules
🔥 MASTER SUPPORT & RESISTANCE – TRADE LIKE A PRO!
Most traders lose money because they enter at the wrong levels.
Remember these 2 golden rules:
🔵 SUPPORT: The price zone where buyers may step in.
🔴 RESISTANCE: The price zone where sellers may step in.
Example Trading Chart:
RESISTANCE ───────────── $105
↘ ↗ ↗ ↘ ↗ ↘ PRICE MOVEMENT ↘ ↗
───────────── $95 SUPPORT
📈 Buy near support after confirmation.
📉 Consider selling near resistance after confirmation.
⚠️ Never enter a trade without risk management.
💬 Question: Do you prefer buying support or trading resistance breakouts?
#SupportAndResistance
#TradingTips
#ConfirmationFirst
#RiskMamagement
#GoldenRules
Most traders lose money because they enter at the wrong levels.
Remember these 2 golden rules:
🔵 SUPPORT: The price zone where buyers may step in.
🔴 RESISTANCE: The price zone where sellers may step in.
Example Trading Chart:
RESISTANCE ───────────── $105
↘ ↗ ↗ ↘ ↗ ↘ PRICE MOVEMENT ↘ ↗
───────────── $95 SUPPORT
📈 Buy near support after confirmation.
📉 Consider selling near resistance after confirmation.
⚠️ Never enter a trade without risk management.
💬 Question: Do you prefer buying support or trading resistance breakouts?
#SupportAndResistance
#TradingTips
#ConfirmationFirst
#RiskMamagement
#GoldenRules
Hassan Kettmann b2NE:
sa
7
30

·
--
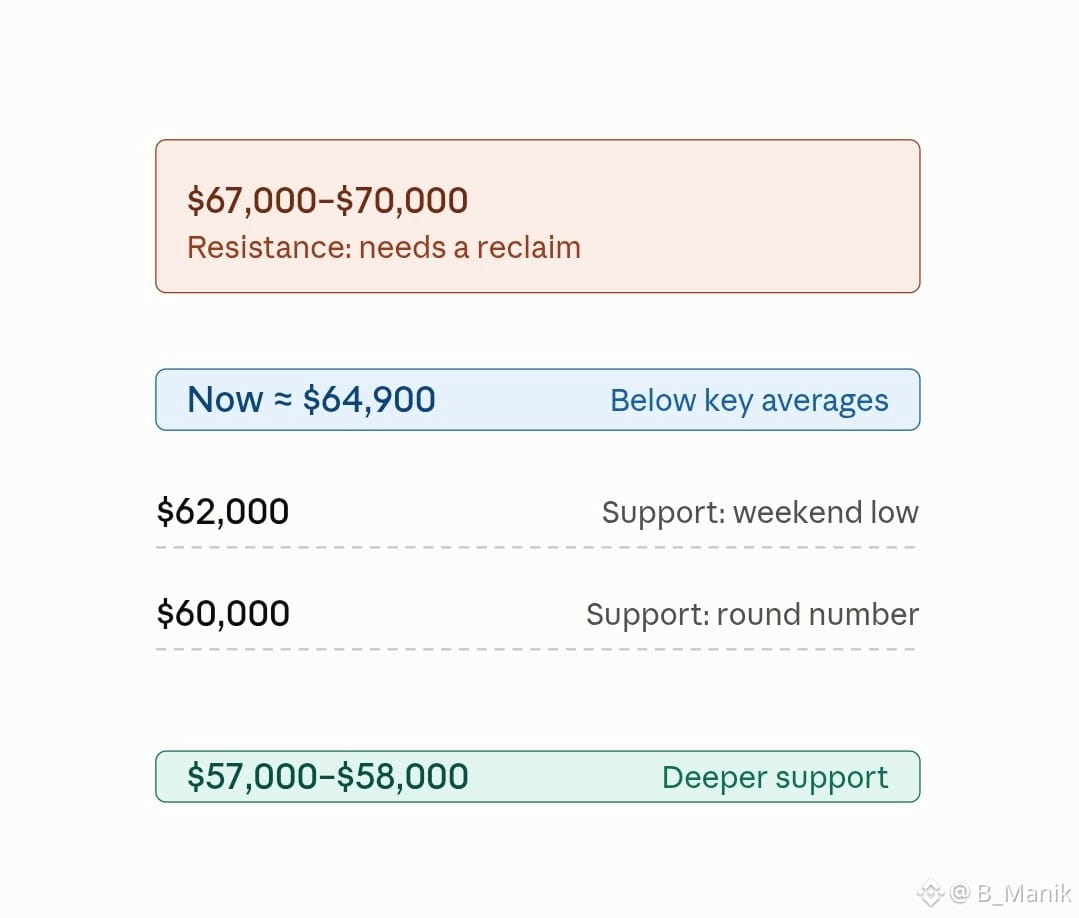
$BTC is trading around $64.9K after a weekend flush to ~$62K, its lowest level since July. Price is still below the key 4H moving averages, and Fear & Greed sits at 10 (extreme fear).
🔴 Resistance
• $65K–$66.1K: Sunday's high zone
• $67K–$70K: needs a reclaim to ease selling pressure
🟢 Support
• $62K: weekend low
• $60K: round-number level
• $57K–$58K: deeper support if $62K breaks
👀 Watching: ETF flows (7 straight outflow sessions, ~$1.9B) and Wednesday's Fed minutes.
A daily close above $67K would be the first real sign of recovery. Until then, treat bounces with caution.
Which level are you watching? 👇
Not financial advice. DYOR.
#BTC #Bitcoin❗ #CryptoAnalysisUpdate #supportandresistance #BinanceSquare
$BTC is trading around $64.9K after a weekend flush to ~$62K, its lowest level since July. Price is still below the key 4H moving averages, and Fear & Greed sits at 10 (extreme fear).
🔴 Resistance
• $65K–$66.1K: Sunday's high zone
• $67K–$70K: needs a reclaim to ease selling pressure
🟢 Support
• $62K: weekend low
• $60K: round-number level
• $57K–$58K: deeper support if $62K breaks
👀 Watching: ETF flows (7 straight outflow sessions, ~$1.9B) and Wednesday's Fed minutes.
A daily close above $67K would be the first real sign of recovery. Until then, treat bounces with caution.
Which level are you watching? 👇
Not financial advice. DYOR.
#BTC #Bitcoin❗ #CryptoAnalysisUpdate #supportandresistance #BinanceSquare
🔴 Resistance
• $65K–$66.1K: Sunday's high zone
• $67K–$70K: needs a reclaim to ease selling pressure
🟢 Support
• $62K: weekend low
• $60K: round-number level
• $57K–$58K: deeper support if $62K breaks
👀 Watching: ETF flows (7 straight outflow sessions, ~$1.9B) and Wednesday's Fed minutes.
A daily close above $67K would be the first real sign of recovery. Until then, treat bounces with caution.
Which level are you watching? 👇
Not financial advice. DYOR.
#BTC #Bitcoin❗ #CryptoAnalysisUpdate #supportandresistance #BinanceSquare
91

·
--
Жоғары (өспелі)
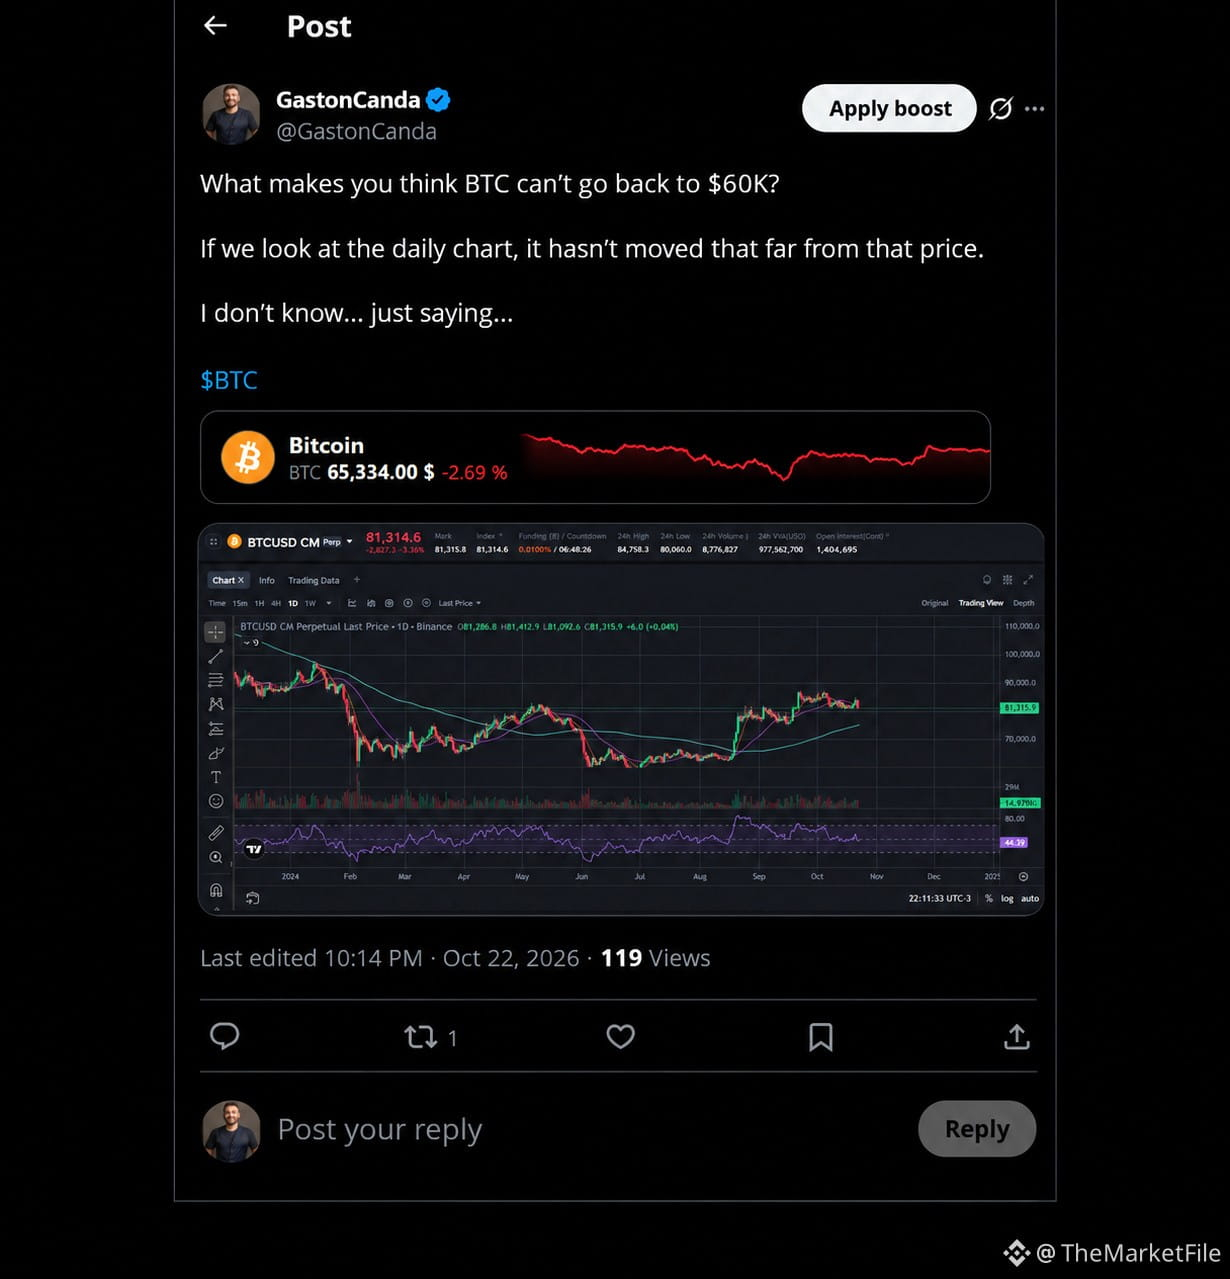
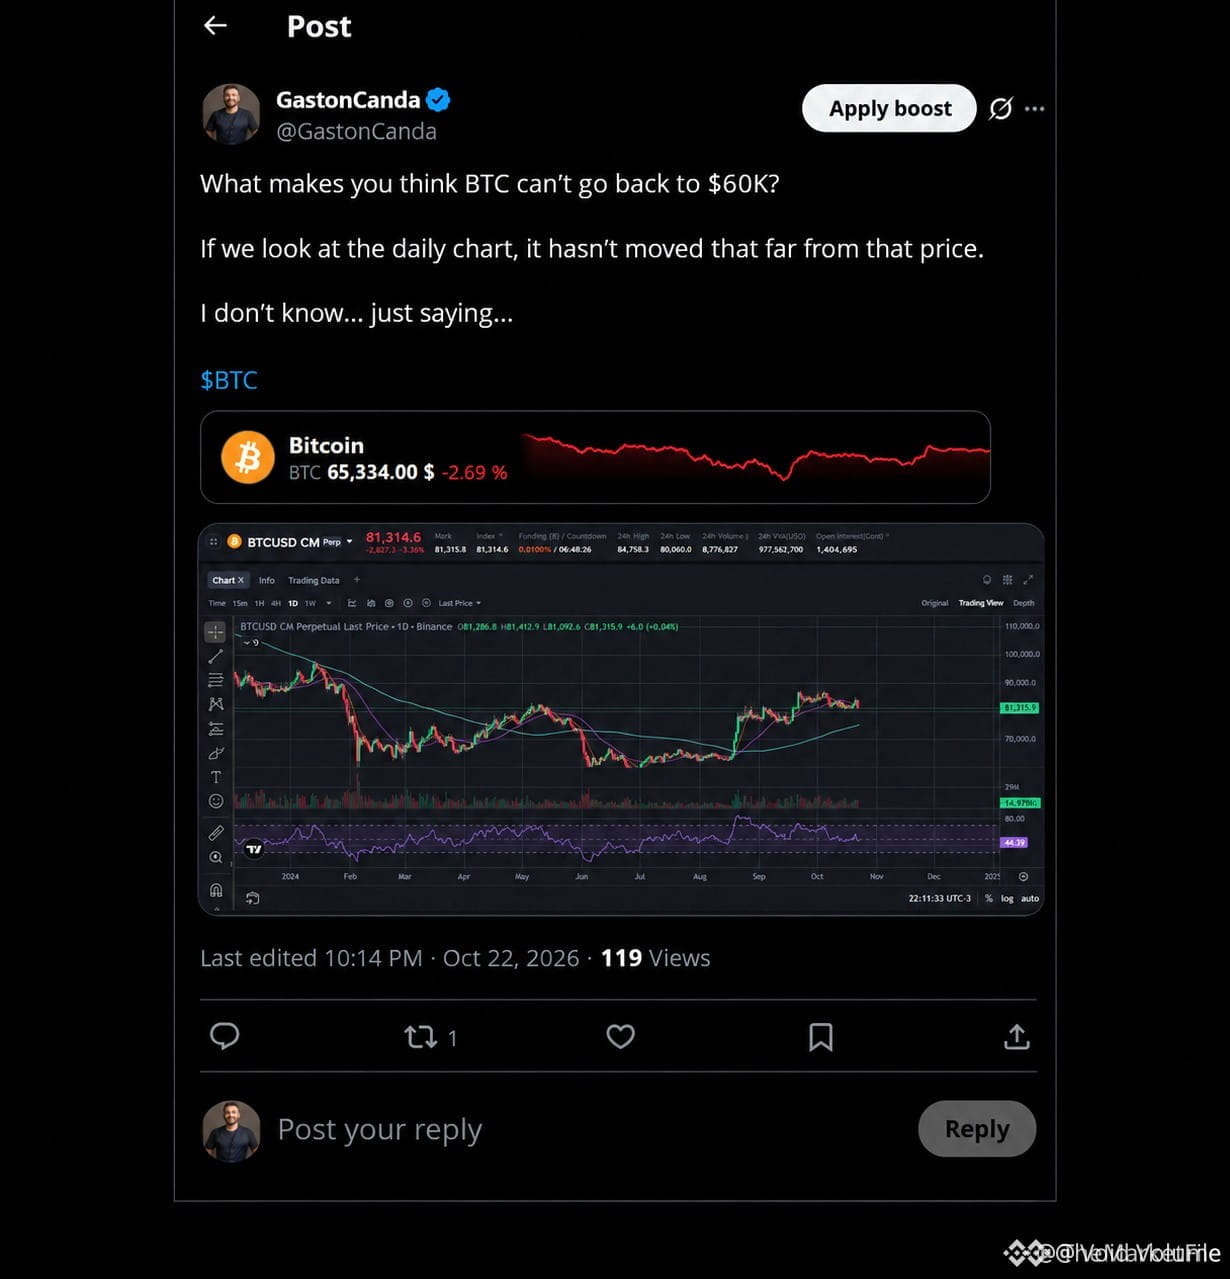
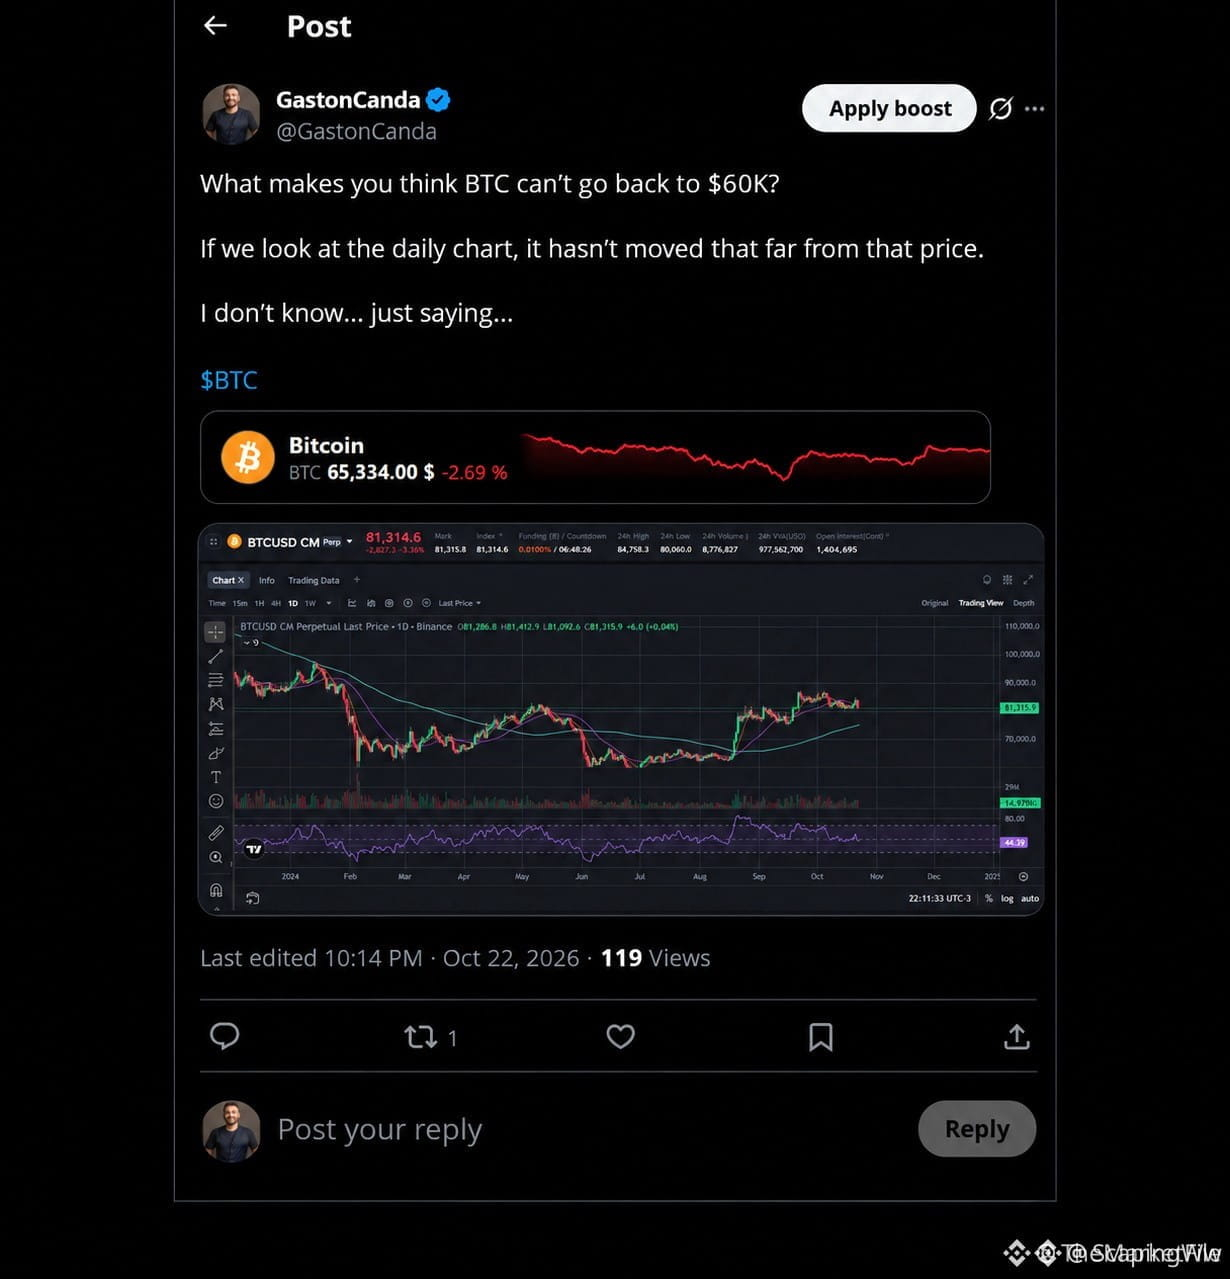
🚨 When Bitcoin was at $81,300, I asked on X what made people think it couldn’t go back to $60,000. Twenty-four days later, BTC hit 62,006 USDT on Binance.
THE MARKET FILE — FROM $81K TO $62K. NOW WHAT?
On October 22, before the U.S. midterms, I shared Bitcoin’s daily chart on X. The $60,000 area looked closer than market sentiment suggested. The chart attached to that post shows BTC trading around $81,300 at the time.
BTC has since bounced toward $65,400. The question I care about now is how much ground buyers can reclaim.
👀 What I’m watching this Sunday
I expect BTC to make a run at $68,000. Tonight’s Asian session is the first test. If BTC reclaims that level and finds buyers on a retest, I’ll be watching Monday’s Wall Street open to see if it gives Bitcoin enough momentum to challenge $70,000.
If BTC gets rejected between $66,500 and $68,000, I’ll watch how buyers respond around $62,000.
💬 At $81,300, I asked what was stopping BTC from going back to $60,000. Today, I’ll flip the question. What would Bitcoin have to show you before you’d believe in a move back to $70,000?
$BTC
#WhatWillDriveCryptoandStocks’NextRebound?
#BTCPriceAction
#SupportAndResistance
{future}(BTCUSDT)
🚨 When Bitcoin was at $81,300, I asked on X what made people think it couldn’t go back to $60,000. Twenty-four days later, BTC hit 62,006 USDT on Binance.
THE MARKET FILE — FROM $81K TO $62K. NOW WHAT?
On October 22, before the U.S. midterms, I shared Bitcoin’s daily chart on X. The $60,000 area looked closer than market sentiment suggested. The chart attached to that post shows BTC trading around $81,300 at the time.
BTC has since bounced toward $65,400. The question I care about now is how much ground buyers can reclaim.
👀 What I’m watching this Sunday
I expect BTC to make a run at $68,000. Tonight’s Asian session is the first test. If BTC reclaims that level and finds buyers on a retest, I’ll be watching Monday’s Wall Street open to see if it gives Bitcoin enough momentum to challenge $70,000.
If BTC gets rejected between $66,500 and $68,000, I’ll watch how buyers respond around $62,000.
💬 At $81,300, I asked what was stopping BTC from going back to $60,000. Today, I’ll flip the question. What would Bitcoin have to show you before you’d believe in a move back to $70,000?
$BTC
#WhatWillDriveCryptoandStocks’NextRebound?
#BTCPriceAction
#SupportAndResistance
THE MARKET FILE — FROM $81K TO $62K. NOW WHAT?
On October 22, before the U.S. midterms, I shared Bitcoin’s daily chart on X. The $60,000 area looked closer than market sentiment suggested. The chart attached to that post shows BTC trading around $81,300 at the time.
BTC has since bounced toward $65,400. The question I care about now is how much ground buyers can reclaim.
👀 What I’m watching this Sunday
I expect BTC to make a run at $68,000. Tonight’s Asian session is the first test. If BTC reclaims that level and finds buyers on a retest, I’ll be watching Monday’s Wall Street open to see if it gives Bitcoin enough momentum to challenge $70,000.
If BTC gets rejected between $66,500 and $68,000, I’ll watch how buyers respond around $62,000.
💬 At $81,300, I asked what was stopping BTC from going back to $60,000. Today, I’ll flip the question. What would Bitcoin have to show you before you’d believe in a move back to $70,000?
$BTC
#WhatWillDriveCryptoandStocks’NextRebound?
#BTCPriceAction
#SupportAndResistance
4
953

·
--
🚨 $BTC CLEARS THE 65,400 FLOOR AS SMART MONEY EYES THE 68,000 LIQUIDITY POOL 💥
Entry: 65,400 ⚡
Target: 68,000 🚀
Stop Loss: 62,000 ⚠️
After sweeping liquidity down to the 62,000 structural floor, price has reacted cleanly toward 65,400. 📊 Market participants are now watching the Asian session test to see if momentum can pierce the 66,500 to 68,000 overhead resistance zone. ⚡ If the Wall Street open fuels enough demand to flip that block, a clean path toward 70,000 opens up. 🔍
💬 What would Bitcoin have to show you before you would believe in a sustained move back to 70,000? 👇
⚠️ Not financial advice. Always manage your risk. 🛡️
🏷️ #BTC #PriceAction #SupportAndResistance #Crypto
🔥 💎
🚨 $BTC CLEARS THE 65,400 FLOOR AS SMART MONEY EYES THE 68,000 LIQUIDITY POOL 💥
Entry: 65,400 ⚡
Target: 68,000 🚀
Stop Loss: 62,000 ⚠️
After sweeping liquidity down to the 62,000 structural floor, price has reacted cleanly toward 65,400. 📊 Market participants are now watching the Asian session test to see if momentum can pierce the 66,500 to 68,000 overhead resistance zone. ⚡ If the Wall Street open fuels enough demand to flip that block, a clean path toward 70,000 opens up. 🔍
💬 What would Bitcoin have to show you before you would believe in a sustained move back to 70,000? 👇
⚠️ Not financial advice. Always manage your risk. 🛡️
🏷️ #BTC #PriceAction #SupportAndResistance #Crypto
🔥 💎
Entry: 65,400 ⚡
Target: 68,000 🚀
Stop Loss: 62,000 ⚠️
After sweeping liquidity down to the 62,000 structural floor, price has reacted cleanly toward 65,400. 📊 Market participants are now watching the Asian session test to see if momentum can pierce the 66,500 to 68,000 overhead resistance zone. ⚡ If the Wall Street open fuels enough demand to flip that block, a clean path toward 70,000 opens up. 🔍
💬 What would Bitcoin have to show you before you would believe in a sustained move back to 70,000? 👇
⚠️ Not financial advice. Always manage your risk. 🛡️
🏷️ #BTC #PriceAction #SupportAndResistance #Crypto
🔥 💎
11

·
--
🚨 $BTC RECLAIMING KEY LEVELS AFTER THE DROP FROM 81K TO 62K! 💥
Entry: 65,400 ⚡
Target: 68,000 🚀
Stop Loss: 62,000 ⚠️
The flush from 81k down to 62k tested every sidelined buyer, but the bounce toward 65,400 shows demand is waking up. 📊
If the Asian session clears the 68k test and Wall Street brings follow-through volume, the path to 70k opens right up. ⚡
A rejection in that upper band means watching how buyers defend the 62k floor. 🔍 What would Bitcoin have to show you before you believe in a run back to 70k? 👇
⚠️ Not financial advice. Always manage your risk. 🛡️
🏷️ #BTC #SupportAndResistance #PriceAction #Crypto
🔥 💎
🚨 $BTC RECLAIMING KEY LEVELS AFTER THE DROP FROM 81K TO 62K! 💥
Entry: 65,400 ⚡
Target: 68,000 🚀
Stop Loss: 62,000 ⚠️
The flush from 81k down to 62k tested every sidelined buyer, but the bounce toward 65,400 shows demand is waking up. 📊
If the Asian session clears the 68k test and Wall Street brings follow-through volume, the path to 70k opens right up. ⚡
A rejection in that upper band means watching how buyers defend the 62k floor. 🔍 What would Bitcoin have to show you before you believe in a run back to 70k? 👇
⚠️ Not financial advice. Always manage your risk. 🛡️
🏷️ #BTC #SupportAndResistance #PriceAction #Crypto
🔥 💎
Entry: 65,400 ⚡
Target: 68,000 🚀
Stop Loss: 62,000 ⚠️
The flush from 81k down to 62k tested every sidelined buyer, but the bounce toward 65,400 shows demand is waking up. 📊
If the Asian session clears the 68k test and Wall Street brings follow-through volume, the path to 70k opens right up. ⚡
A rejection in that upper band means watching how buyers defend the 62k floor. 🔍 What would Bitcoin have to show you before you believe in a run back to 70k? 👇
⚠️ Not financial advice. Always manage your risk. 🛡️
🏷️ #BTC #SupportAndResistance #PriceAction #Crypto
🔥 💎
19

Ішінара рас
🚨 $SKHYNIX — Bears Are Taking Control! 📉
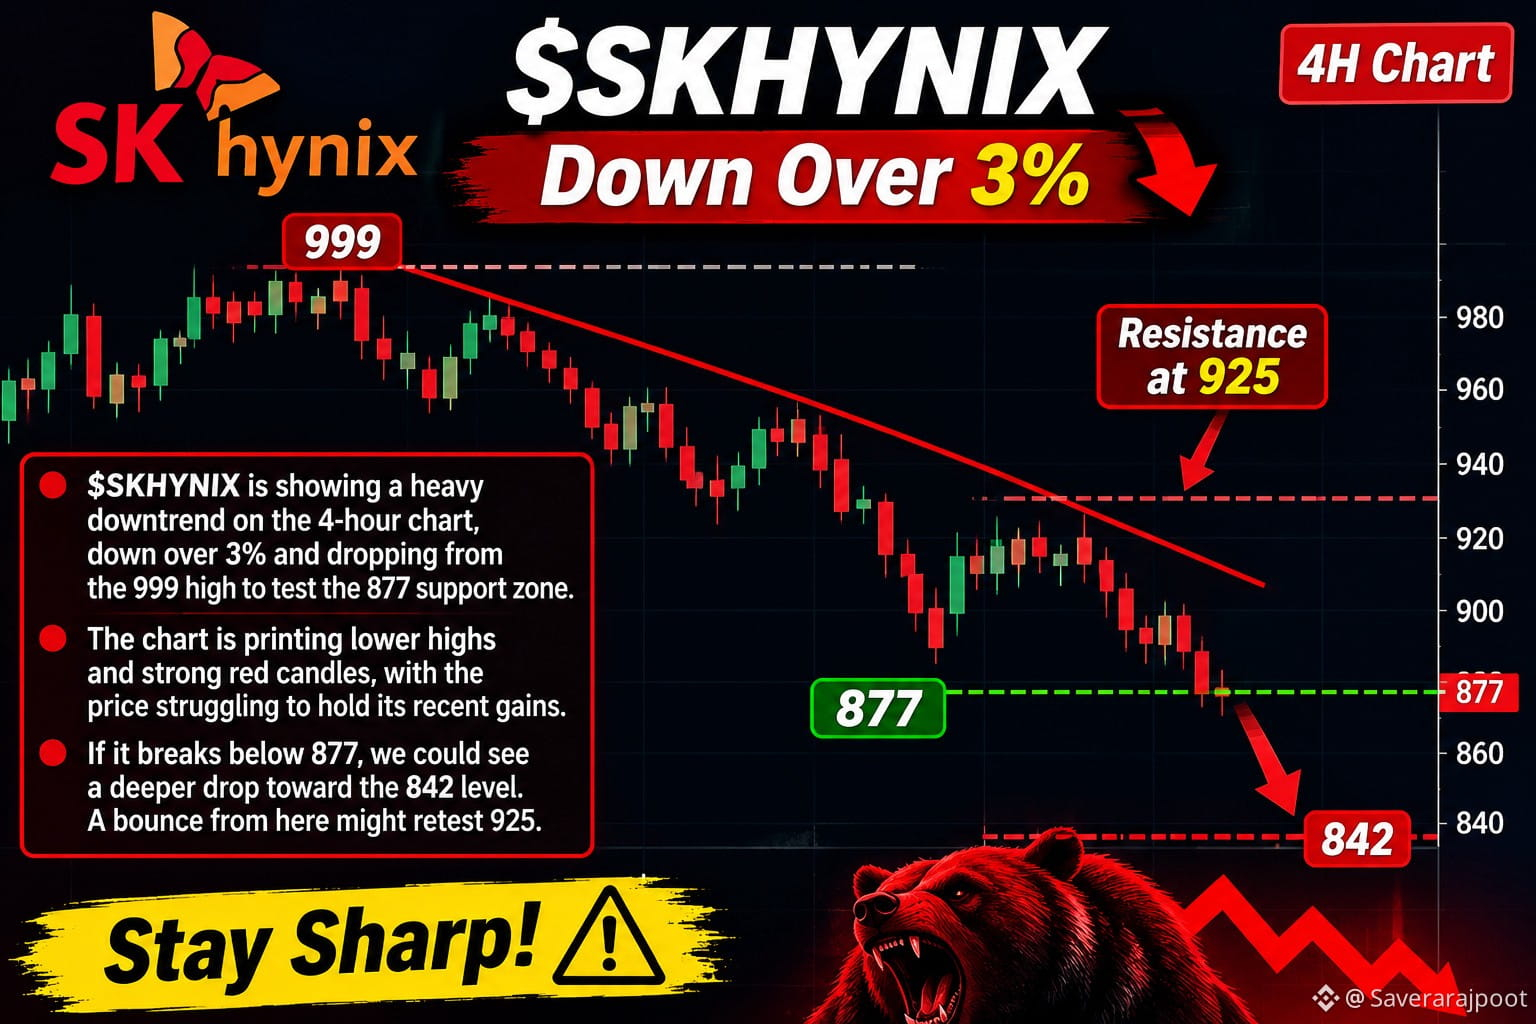
$SKHYV.US SKHYNIX is showing a strong downtrend on the 4-hour chart, down over 3% after falling from the 999 high toward the 877 support zone.
The chart is forming lower highs with strong bearish candles, showing weakness in the recent price action. 👀
🔻 Below 877: Possible downside toward 842
🔺 If support holds: A bounce could retest 925
Watch these key levels closely. The next move could be important! ⚠️
Stay patient, avoid FOMO, and manage risk carefully.
#Trading #BearishTrend #supportandresistance
🚨 $SKHYNIX — Bears Are Taking Control! 📉
$SKHYV.US SKHYNIX is showing a strong downtrend on the 4-hour chart, down over 3% after falling from the 999 high toward the 877 support zone.
The chart is forming lower highs with strong bearish candles, showing weakness in the recent price action. 👀
🔻 Below 877: Possible downside toward 842
🔺 If support holds: A bounce could retest 925
Watch these key levels closely. The next move could be important! ⚠️
Stay patient, avoid FOMO, and manage risk carefully.
#Trading #BearishTrend #supportandresistance
$SKHYV.US SKHYNIX is showing a strong downtrend on the 4-hour chart, down over 3% after falling from the 999 high toward the 877 support zone.
The chart is forming lower highs with strong bearish candles, showing weakness in the recent price action. 👀
🔻 Below 877: Possible downside toward 842
🔺 If support holds: A bounce could retest 925
Watch these key levels closely. The next move could be important! ⚠️
Stay patient, avoid FOMO, and manage risk carefully.
#Trading #BearishTrend #supportandresistance
1
850

·
--
Жоғары (өспелі)
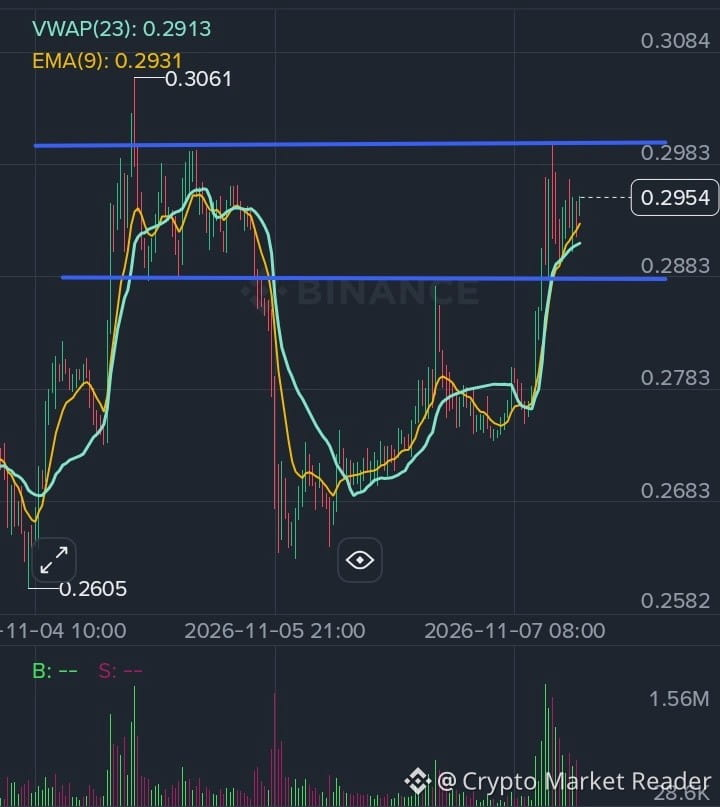
$MET 👉We come back to the same place where there was a very good price decline, same support, same resistance,
🤔 but this time the volume is higher than before and that too more on the buy side and there is a possibility of a pump 🚀.
But if $MET breaks the 0.2883 level, it will go down again🌹.
#supportandresistance
#Volume
#buyers
{future}(METUSDT)
$MET 👉We come back to the same place where there was a very good price decline, same support, same resistance,
🤔 but this time the volume is higher than before and that too more on the buy side and there is a possibility of a pump 🚀.
But if $MET breaks the 0.2883 level, it will go down again🌹.
#supportandresistance
#Volume
#buyers
🤔 but this time the volume is higher than before and that too more on the buy side and there is a possibility of a pump 🚀.
But if $MET breaks the 0.2883 level, it will go down again🌹.
#supportandresistance
#Volume
#buyers
1
171

·
--
A support level that gets tested five times in eight days isn't getting stronger. It's getting tired.
Look at $BTC on the daily. Since Oct 30 the lows have printed at 76,326, 76,705, 76,389, 75,736 and yesterday 75,208. Price now sits around 75,800, down roughly 5.9% in 24h.
Many traders read "support held again" as a reason to buy. Here's how I'd think about it instead:
1. Support is a zone, not a line. The 75.2K to 76.7K band is the area, so a stop placed exactly at 76,000 sits right where everyone else's is.
2. Every retest eats bids. Buyers who defended the zone last time are partly filled, so each bounce has less fuel behind it.
3. Watch the reaction, not the touch. A strong level gives a fast, high-volume bounce. Weak, slow bounces near the same floor are a warning.
4. Old resistance matters too. BTC rejected the 81K area on Oct 27, 28, 29 and again on Nov 4 (high 81,196). Until that breaks, the range is the story.
5. Plan both outcomes before they happen: where you're wrong if the floor breaks, and where you'd reconsider if price reclaims the top.
Levels describe where decisions get made. They don't tell you which decision the market will make.
How do you handle a support level that keeps getting hit?
Not financial advice.
#BTC #TradingTips #SupportAndResistance
A support level that gets tested five times in eight days isn't getting stronger. It's getting tired.
Look at $BTC on the daily. Since Oct 30 the lows have printed at 76,326, 76,705, 76,389, 75,736 and yesterday 75,208. Price now sits around 75,800, down roughly 5.9% in 24h.
Many traders read "support held again" as a reason to buy. Here's how I'd think about it instead:
1. Support is a zone, not a line. The 75.2K to 76.7K band is the area, so a stop placed exactly at 76,000 sits right where everyone else's is.
2. Every retest eats bids. Buyers who defended the zone last time are partly filled, so each bounce has less fuel behind it.
3. Watch the reaction, not the touch. A strong level gives a fast, high-volume bounce. Weak, slow bounces near the same floor are a warning.
4. Old resistance matters too. BTC rejected the 81K area on Oct 27, 28, 29 and again on Nov 4 (high 81,196). Until that breaks, the range is the story.
5. Plan both outcomes before they happen: where you're wrong if the floor breaks, and where you'd reconsider if price reclaims the top.
Levels describe where decisions get made. They don't tell you which decision the market will make.
How do you handle a support level that keeps getting hit?
Not financial advice.
#BTC #TradingTips #SupportAndResistance
Look at $BTC on the daily. Since Oct 30 the lows have printed at 76,326, 76,705, 76,389, 75,736 and yesterday 75,208. Price now sits around 75,800, down roughly 5.9% in 24h.
Many traders read "support held again" as a reason to buy. Here's how I'd think about it instead:
1. Support is a zone, not a line. The 75.2K to 76.7K band is the area, so a stop placed exactly at 76,000 sits right where everyone else's is.
2. Every retest eats bids. Buyers who defended the zone last time are partly filled, so each bounce has less fuel behind it.
3. Watch the reaction, not the touch. A strong level gives a fast, high-volume bounce. Weak, slow bounces near the same floor are a warning.
4. Old resistance matters too. BTC rejected the 81K area on Oct 27, 28, 29 and again on Nov 4 (high 81,196). Until that breaks, the range is the story.
5. Plan both outcomes before they happen: where you're wrong if the floor breaks, and where you'd reconsider if price reclaims the top.
Levels describe where decisions get made. They don't tell you which decision the market will make.
How do you handle a support level that keeps getting hit?
Not financial advice.
#BTC #TradingTips #SupportAndResistance
7

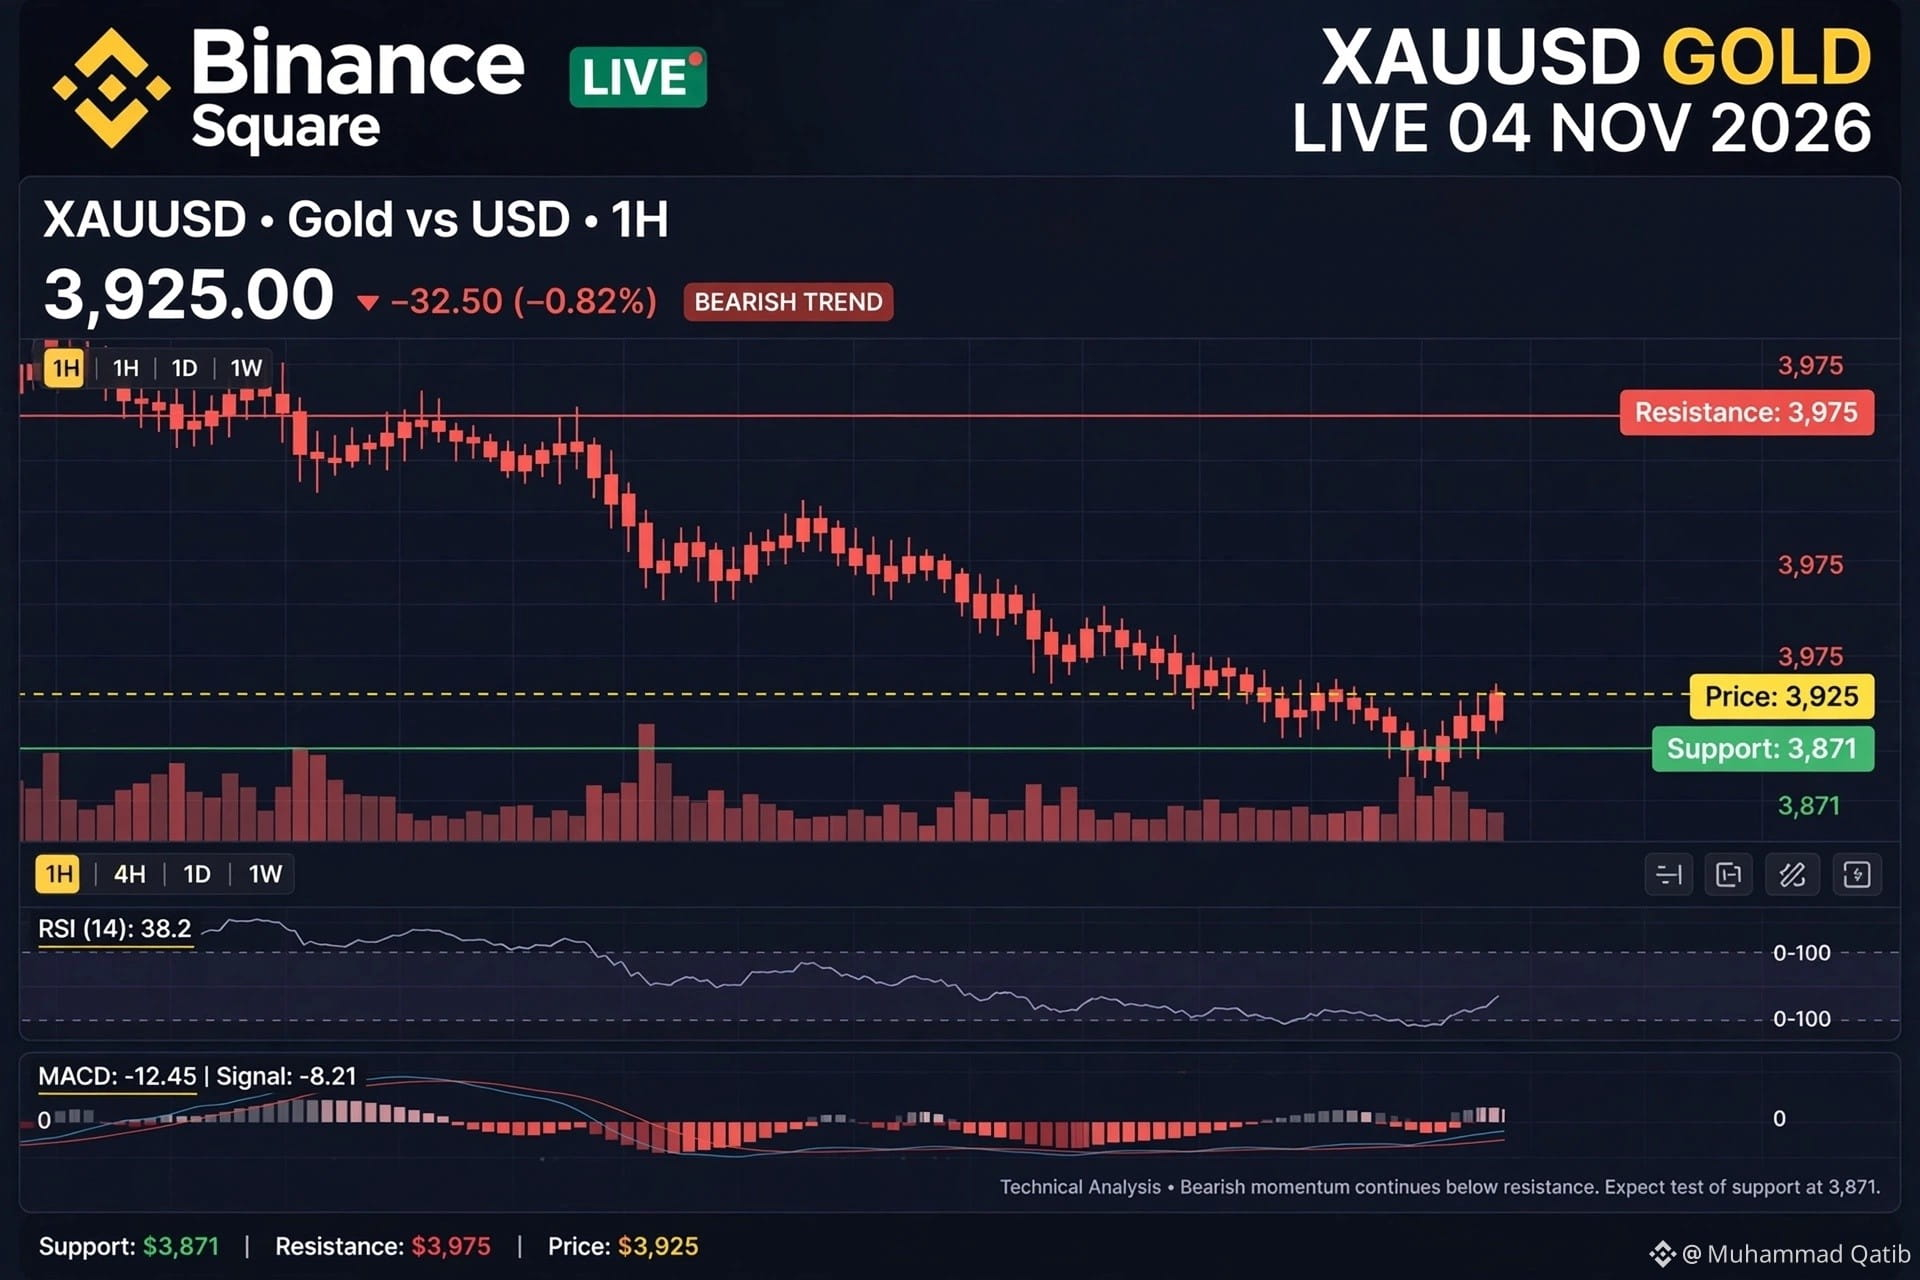
🚨 XAUUSD GOLD LIVE ANALYSIS - 04 NOV 2026 🚨
$XAUT
📉 GOLD PRICE NOW: $3,925 (-0.82%)
Live Market Update!
$XAUT
Gold is trading under heavy bearish pressure today! Currently at $3,925 after falling from $3,975 resistance.
#XAUUSD
🔑 KEY LEVELS TO WATCH:
$XAUT
Support: $3,871 → If break, next target $3,797
{spot}(XAUTUSDT)
Resistance: $3,975 → This was support in October, now strong resistance
Pivot: $3,954
📊 TECHNICAL ANALYSIS:
1H Chart: Bearish Trend Continues
RSI (14): 38.2 - Near oversold, but still weak__#BinanceIncidentReport #XAUUSD #dailyanalysis #supportandresistance
🚨 XAUUSD GOLD LIVE ANALYSIS - 04 NOV 2026 🚨
$XAUT
📉 GOLD PRICE NOW: $3,925 (-0.82%)
Live Market Update!
$XAUT
Gold is trading under heavy bearish pressure today! Currently at $3,925 after falling from $3,975 resistance.
#XAUUSD
🔑 KEY LEVELS TO WATCH:
$XAUT
Support: $3,871 → If break, next target $3,797
Resistance: $3,975 → This was support in October, now strong resistance
Pivot: $3,954
📊 TECHNICAL ANALYSIS:
1H Chart: Bearish Trend Continues
RSI (14): 38.2 - Near oversold, but still weak__#BinanceIncidentReport #XAUUSD #dailyanalysis #supportandresistance
$XAUT
📉 GOLD PRICE NOW: $3,925 (-0.82%)
Live Market Update!
$XAUT
Gold is trading under heavy bearish pressure today! Currently at $3,925 after falling from $3,975 resistance.
#XAUUSD
🔑 KEY LEVELS TO WATCH:
$XAUT
Support: $3,871 → If break, next target $3,797
Resistance: $3,975 → This was support in October, now strong resistance
Pivot: $3,954
📊 TECHNICAL ANALYSIS:
1H Chart: Bearish Trend Continues
RSI (14): 38.2 - Near oversold, but still weak__#BinanceIncidentReport #XAUUSD #dailyanalysis #supportandresistance
2
317

·
--
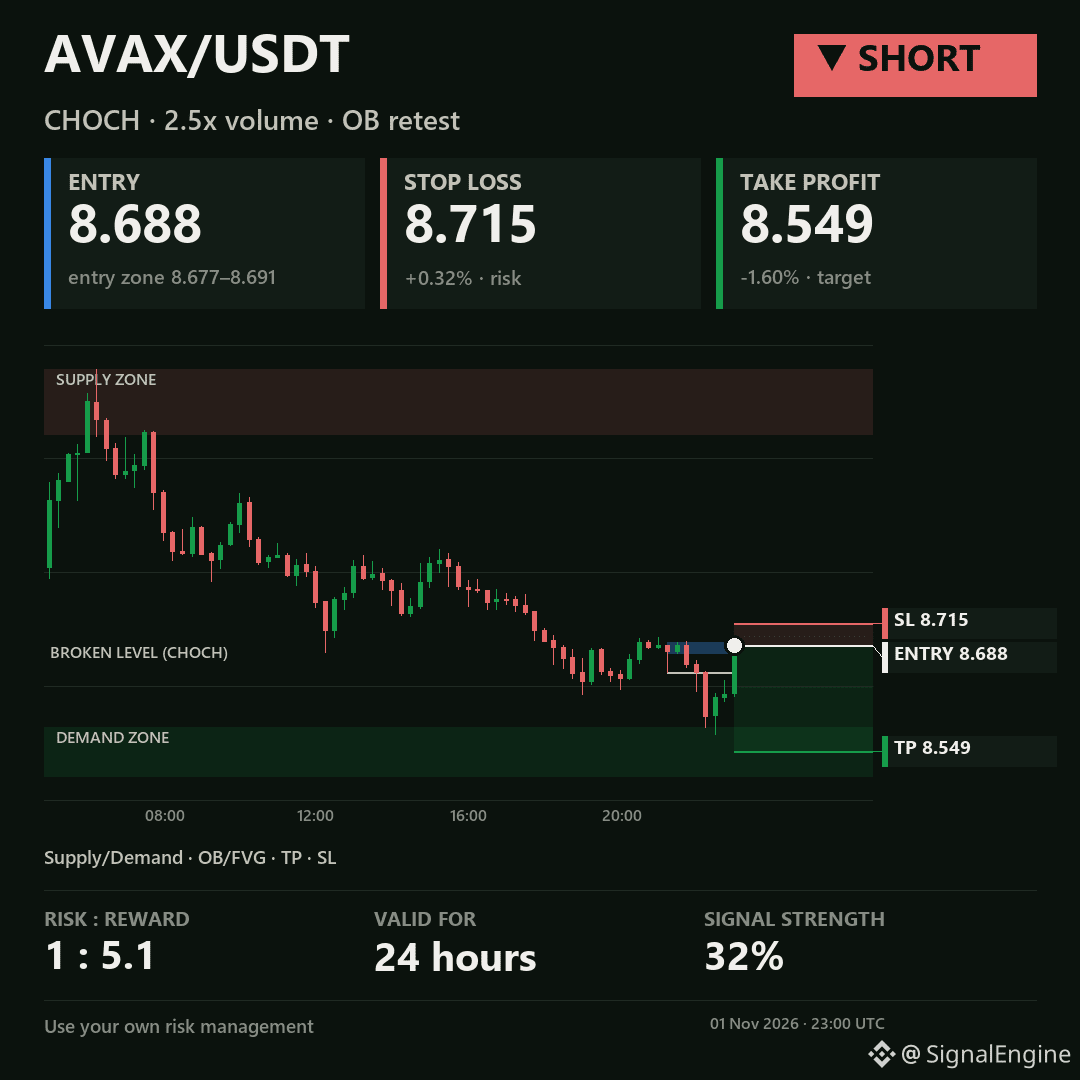
🔴 SHORT $AVAX (AVAXUSDT)
ENTRY: 8.688 · SL: 8.715 · TP: 8.549 · R/R: 1:5.1
Change of character with 2.5x volume → retest of the order block · valid 24 hours
01/11/2026 🗓️ 23:15 UTC 🌐
#AVAX #SupportAndResistance
🔴 SHORT $AVAX (AVAXUSDT)
ENTRY: 8.688 · SL: 8.715 · TP: 8.549 · R/R: 1:5.1
Change of character with 2.5x volume → retest of the order block · valid 24 hours
01/11/2026 🗓️ 23:15 UTC 🌐
#AVAX #SupportAndResistance
ENTRY: 8.688 · SL: 8.715 · TP: 8.549 · R/R: 1:5.1
Change of character with 2.5x volume → retest of the order block · valid 24 hours
01/11/2026 🗓️ 23:15 UTC 🌐
#AVAX #SupportAndResistance
119

·
--
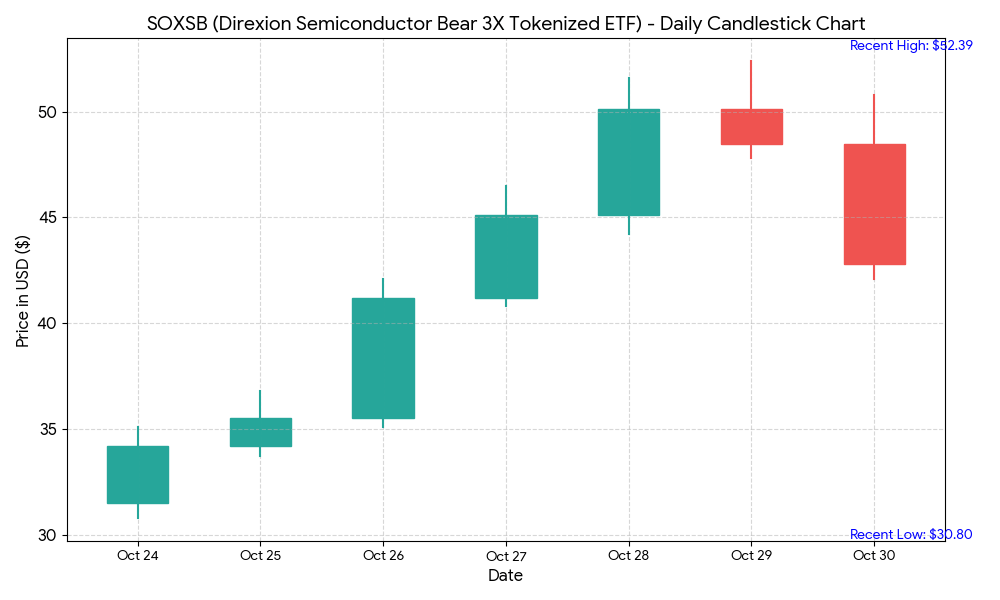
$SOXSB 📊 UNDERSTANDING SUPPORT & RESISTANCE
🟢 Support is a price zone where buyers may enter the market.
🔴 Resistance is a price zone where sellers may become active.
Understanding these levels can help traders analyze market movements.
#SOXSB #SupportAndResistance #TechnicalAnalysis #TradingEducation
{spot}(SOXSBUSDT)
$SOXSB 📊 UNDERSTANDING SUPPORT & RESISTANCE
🟢 Support is a price zone where buyers may enter the market.
🔴 Resistance is a price zone where sellers may become active.
Understanding these levels can help traders analyze market movements.
#SOXSB #SupportAndResistance #TechnicalAnalysis #TradingEducation
🟢 Support is a price zone where buyers may enter the market.
🔴 Resistance is a price zone where sellers may become active.
Understanding these levels can help traders analyze market movements.
#SOXSB #SupportAndResistance #TechnicalAnalysis #TradingEducation
52

$SHELL | Hướng dẫn người mới đọc thị trường đi ngang
Thị trường đi ngang là trạng thái giá dao động trong một vùng tương đối xác định thay vì hình thành xu hướng tăng hoặc giảm rõ ràng. Các dữ liệu $SHELL được trích trong báo cáo đặt vùng dao động gần đây quanh 0,021–0,023 USD.
Đối với người mới, bước đầu tiên là xác định vùng giá mà không mặc định rằng các biên của vùng đó sẽ luôn được giữ vững. Nếu giá nhiều lần phản ứng tại biên trên, khu vực này có thể đóng vai trò kháng cự. Nếu lực mua thường xuất hiện gần biên dưới, khu vực đó có thể đóng vai trò hỗ trợ. Đây là những vùng cần theo dõi, không phải điểm đảo chiều được bảo đảm.
Bước tiếp theo là quan sát cách giá phản ứng khi tiến đến các khu vực đó. Giá có liên tục bị từ chối tại vùng kháng cự không? Áp lực bán có suy yếu gần vùng hỗ trợ không? Khối lượng có tăng khi giá vượt ra khỏi vùng dao động không? Sau khi đóng cửa bên ngoài vùng, giá có tiếp tục giữ được vị trí mới hay nhanh chóng quay lại?
Một cú vượt kháng cự trong thời gian ngắn có thể nhanh chóng đảo chiều. Hiện tượng này thường được gọi là phá vỡ giả. Nó có thể xảy ra khi lực mua không đủ duy trì đà tăng, thanh khoản mỏng hoặc nhà giao dịch phản ứng quá sớm trước một biến động giá.
Vì vậy, một số nhà giao dịch chờ tín hiệu xác nhận thay vì cố đoán chính xác hướng bứt phá. Những người khác giảm quy mô vị thế vì thị trường đi ngang có thể tạo ra nhiều tín hiệu sai liên tiếp.
#RangeTrading #SupportAndResistance #PriceAction TradingEducation MyShell
$SHELL | Hướng dẫn người mới đọc thị trường đi ngang
Thị trường đi ngang là trạng thái giá dao động trong một vùng tương đối xác định thay vì hình thành xu hướng tăng hoặc giảm rõ ràng. Các dữ liệu $SHELL được trích trong báo cáo đặt vùng dao động gần đây quanh 0,021–0,023 USD.
Đối với người mới, bước đầu tiên là xác định vùng giá mà không mặc định rằng các biên của vùng đó sẽ luôn được giữ vững. Nếu giá nhiều lần phản ứng tại biên trên, khu vực này có thể đóng vai trò kháng cự. Nếu lực mua thường xuất hiện gần biên dưới, khu vực đó có thể đóng vai trò hỗ trợ. Đây là những vùng cần theo dõi, không phải điểm đảo chiều được bảo đảm.
Bước tiếp theo là quan sát cách giá phản ứng khi tiến đến các khu vực đó. Giá có liên tục bị từ chối tại vùng kháng cự không? Áp lực bán có suy yếu gần vùng hỗ trợ không? Khối lượng có tăng khi giá vượt ra khỏi vùng dao động không? Sau khi đóng cửa bên ngoài vùng, giá có tiếp tục giữ được vị trí mới hay nhanh chóng quay lại?
Một cú vượt kháng cự trong thời gian ngắn có thể nhanh chóng đảo chiều. Hiện tượng này thường được gọi là phá vỡ giả. Nó có thể xảy ra khi lực mua không đủ duy trì đà tăng, thanh khoản mỏng hoặc nhà giao dịch phản ứng quá sớm trước một biến động giá.
Vì vậy, một số nhà giao dịch chờ tín hiệu xác nhận thay vì cố đoán chính xác hướng bứt phá. Những người khác giảm quy mô vị thế vì thị trường đi ngang có thể tạo ra nhiều tín hiệu sai liên tiếp.
#RangeTrading #SupportAndResistance #PriceAction TradingEducation MyShell
Thị trường đi ngang là trạng thái giá dao động trong một vùng tương đối xác định thay vì hình thành xu hướng tăng hoặc giảm rõ ràng. Các dữ liệu $SHELL được trích trong báo cáo đặt vùng dao động gần đây quanh 0,021–0,023 USD.
Đối với người mới, bước đầu tiên là xác định vùng giá mà không mặc định rằng các biên của vùng đó sẽ luôn được giữ vững. Nếu giá nhiều lần phản ứng tại biên trên, khu vực này có thể đóng vai trò kháng cự. Nếu lực mua thường xuất hiện gần biên dưới, khu vực đó có thể đóng vai trò hỗ trợ. Đây là những vùng cần theo dõi, không phải điểm đảo chiều được bảo đảm.
Bước tiếp theo là quan sát cách giá phản ứng khi tiến đến các khu vực đó. Giá có liên tục bị từ chối tại vùng kháng cự không? Áp lực bán có suy yếu gần vùng hỗ trợ không? Khối lượng có tăng khi giá vượt ra khỏi vùng dao động không? Sau khi đóng cửa bên ngoài vùng, giá có tiếp tục giữ được vị trí mới hay nhanh chóng quay lại?
Một cú vượt kháng cự trong thời gian ngắn có thể nhanh chóng đảo chiều. Hiện tượng này thường được gọi là phá vỡ giả. Nó có thể xảy ra khi lực mua không đủ duy trì đà tăng, thanh khoản mỏng hoặc nhà giao dịch phản ứng quá sớm trước một biến động giá.
Vì vậy, một số nhà giao dịch chờ tín hiệu xác nhận thay vì cố đoán chính xác hướng bứt phá. Những người khác giảm quy mô vị thế vì thị trường đi ngang có thể tạo ra nhiều tín hiệu sai liên tiếp.
#RangeTrading #SupportAndResistance #PriceAction TradingEducation MyShell

30
$SHELL | How Beginners Can Read a Sideways Market
A sideways market is one in which price moves back and forth within a relatively defined range instead of establishing a clear upward or downward trend. The recent $SHELL snapshots cited in the research report placed the trading range around $0.021–0.023.
For beginners, the first task is to identify the range without assuming that its boundaries will hold forever. Repeated reactions near the upper boundary may suggest resistance, while repeated buying near the lower boundary may suggest support. These are areas of interest, not guaranteed turning points.
The next step is to watch how price behaves when it reaches those areas. Does it repeatedly reject the upper boundary? Does selling pressure weaken near the lower boundary? Does volume expand when price moves outside the range? Does the market close beyond the boundary and remain there?
A brief move above resistance can reverse quickly. This is sometimes called a false breakout. It can happen when there is insufficient follow-through buying, when liquidity is thin or when traders react too early to a price move.
That is why some traders wait for confirmation rather than trying to predict the exact breakout direction. Others reduce position size because range-bound conditions can produce repeated false signals.
There is no single strategy that works in every market. The important skill is recognizing the current environment and adjusting expectations accordingly.
#RangeTrading #SupportAndResistance #PriceAction TradingEducation MyShell
$SHELL | How Beginners Can Read a Sideways Market
A sideways market is one in which price moves back and forth within a relatively defined range instead of establishing a clear upward or downward trend. The recent $SHELL snapshots cited in the research report placed the trading range around $0.021–0.023.
For beginners, the first task is to identify the range without assuming that its boundaries will hold forever. Repeated reactions near the upper boundary may suggest resistance, while repeated buying near the lower boundary may suggest support. These are areas of interest, not guaranteed turning points.
The next step is to watch how price behaves when it reaches those areas. Does it repeatedly reject the upper boundary? Does selling pressure weaken near the lower boundary? Does volume expand when price moves outside the range? Does the market close beyond the boundary and remain there?
A brief move above resistance can reverse quickly. This is sometimes called a false breakout. It can happen when there is insufficient follow-through buying, when liquidity is thin or when traders react too early to a price move.
That is why some traders wait for confirmation rather than trying to predict the exact breakout direction. Others reduce position size because range-bound conditions can produce repeated false signals.
There is no single strategy that works in every market. The important skill is recognizing the current environment and adjusting expectations accordingly.
#RangeTrading #SupportAndResistance #PriceAction TradingEducation MyShell
A sideways market is one in which price moves back and forth within a relatively defined range instead of establishing a clear upward or downward trend. The recent $SHELL snapshots cited in the research report placed the trading range around $0.021–0.023.
For beginners, the first task is to identify the range without assuming that its boundaries will hold forever. Repeated reactions near the upper boundary may suggest resistance, while repeated buying near the lower boundary may suggest support. These are areas of interest, not guaranteed turning points.
The next step is to watch how price behaves when it reaches those areas. Does it repeatedly reject the upper boundary? Does selling pressure weaken near the lower boundary? Does volume expand when price moves outside the range? Does the market close beyond the boundary and remain there?
A brief move above resistance can reverse quickly. This is sometimes called a false breakout. It can happen when there is insufficient follow-through buying, when liquidity is thin or when traders react too early to a price move.
That is why some traders wait for confirmation rather than trying to predict the exact breakout direction. Others reduce position size because range-bound conditions can produce repeated false signals.
There is no single strategy that works in every market. The important skill is recognizing the current environment and adjusting expectations accordingly.
#RangeTrading #SupportAndResistance #PriceAction TradingEducation MyShell

34

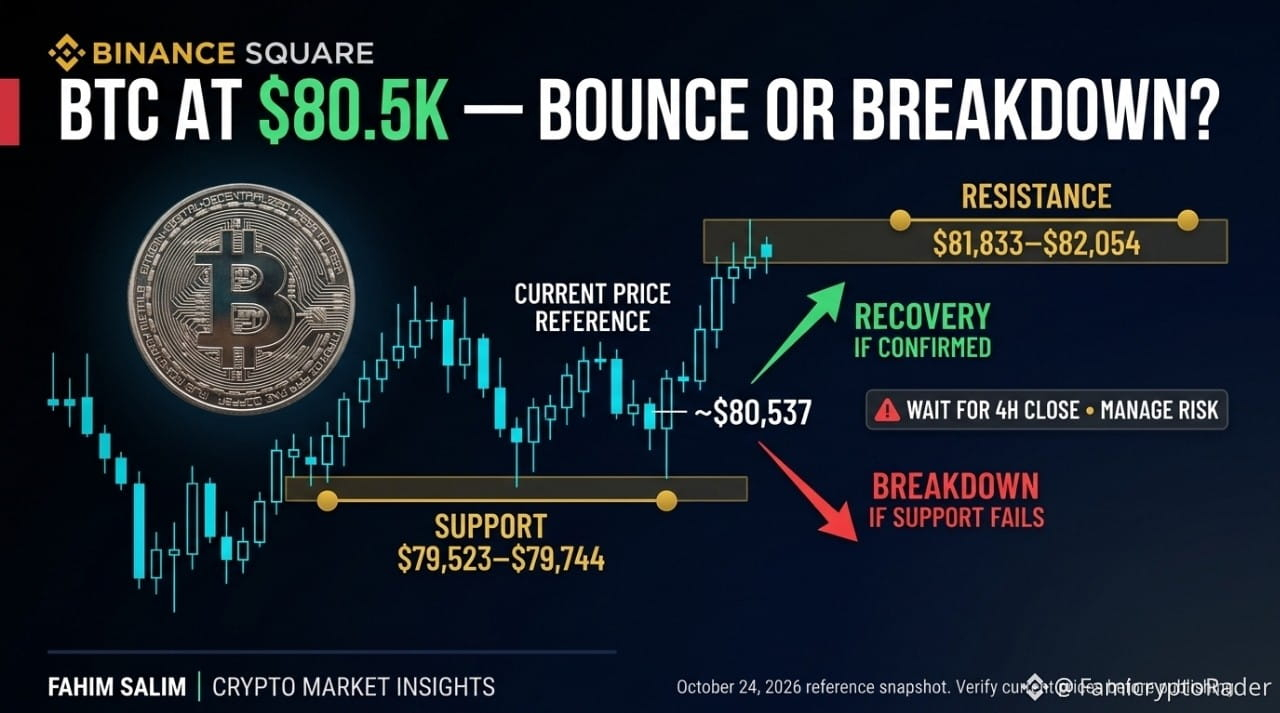
🚨 BITCOIN AT $80.5K: BOUNCE OR BREAKDOWN? WATCH THESE LEVELS!
Bitcoin is testing an important area after recent selling pressure. Here's a conditional technical setup traders can watch. 👇
📊 BTC/USD SNAPSHOT
🟠 Price: approximately $80,537
🟢 Near support: $79,523–$79,744
🔴 Near resistance: $81,833–$82,054
🟢 Scenario 1 — Bullish recovery
If BTC closes above the nearby $81,000 area on the 4-hour chart and buyers follow through, price could retest the $81,833–$82,054 resistance zone.
A breakout is not confirmed by a brief wick alone.
🔴 Scenario 2 — Bearish continuation
If BTC loses the $80,160 area on a 4-hour closing basis, downside pressure could increase toward $79,744–$79,523.
That zone may hold—or fail.
🟡 Scenario 3 — Sideways movement
If BTC remains between approximately $80,160 and $81,003, the market may continue consolidating without a clear directional signal.
🎯 My trading checklist
✅ Wait for the candle close.
✅ Check volume and retest behavior.
✅ Set your invalidation level before entering.
✅ Avoid oversized positions in volatile conditions.
⚠️ These are conditional scenarios, not price predictions or guaranteed trade signals.
💬 What's your BTC view?
1️⃣ Rebound
2️⃣ Breakdown
3️⃣ Sideways
Comment below! 👇
#Bitcoin #BTC #TechnicalAnalysis #CryptoTrading #SupportAndResistance
$BTC
{future}(BTCUSDT)
🚨 BITCOIN AT $80.5K: BOUNCE OR BREAKDOWN? WATCH THESE LEVELS!
Bitcoin is testing an important area after recent selling pressure. Here's a conditional technical setup traders can watch. 👇
📊 BTC/USD SNAPSHOT
🟠 Price: approximately $80,537
🟢 Near support: $79,523–$79,744
🔴 Near resistance: $81,833–$82,054
🟢 Scenario 1 — Bullish recovery
If BTC closes above the nearby $81,000 area on the 4-hour chart and buyers follow through, price could retest the $81,833–$82,054 resistance zone.
A breakout is not confirmed by a brief wick alone.
🔴 Scenario 2 — Bearish continuation
If BTC loses the $80,160 area on a 4-hour closing basis, downside pressure could increase toward $79,744–$79,523.
That zone may hold—or fail.
🟡 Scenario 3 — Sideways movement
If BTC remains between approximately $80,160 and $81,003, the market may continue consolidating without a clear directional signal.
🎯 My trading checklist
✅ Wait for the candle close.
✅ Check volume and retest behavior.
✅ Set your invalidation level before entering.
✅ Avoid oversized positions in volatile conditions.
⚠️ These are conditional scenarios, not price predictions or guaranteed trade signals.
💬 What's your BTC view?
1️⃣ Rebound
2️⃣ Breakdown
3️⃣ Sideways
Comment below! 👇
#Bitcoin #BTC #TechnicalAnalysis #CryptoTrading #SupportAndResistance
$BTC
Bitcoin is testing an important area after recent selling pressure. Here's a conditional technical setup traders can watch. 👇
📊 BTC/USD SNAPSHOT
🟠 Price: approximately $80,537
🟢 Near support: $79,523–$79,744
🔴 Near resistance: $81,833–$82,054
🟢 Scenario 1 — Bullish recovery
If BTC closes above the nearby $81,000 area on the 4-hour chart and buyers follow through, price could retest the $81,833–$82,054 resistance zone.
A breakout is not confirmed by a brief wick alone.
🔴 Scenario 2 — Bearish continuation
If BTC loses the $80,160 area on a 4-hour closing basis, downside pressure could increase toward $79,744–$79,523.
That zone may hold—or fail.
🟡 Scenario 3 — Sideways movement
If BTC remains between approximately $80,160 and $81,003, the market may continue consolidating without a clear directional signal.
🎯 My trading checklist
✅ Wait for the candle close.
✅ Check volume and retest behavior.
✅ Set your invalidation level before entering.
✅ Avoid oversized positions in volatile conditions.
⚠️ These are conditional scenarios, not price predictions or guaranteed trade signals.
💬 What's your BTC view?
1️⃣ Rebound
2️⃣ Breakdown
3️⃣ Sideways
Comment below! 👇
#Bitcoin #BTC #TechnicalAnalysis #CryptoTrading #SupportAndResistance
$BTC
42

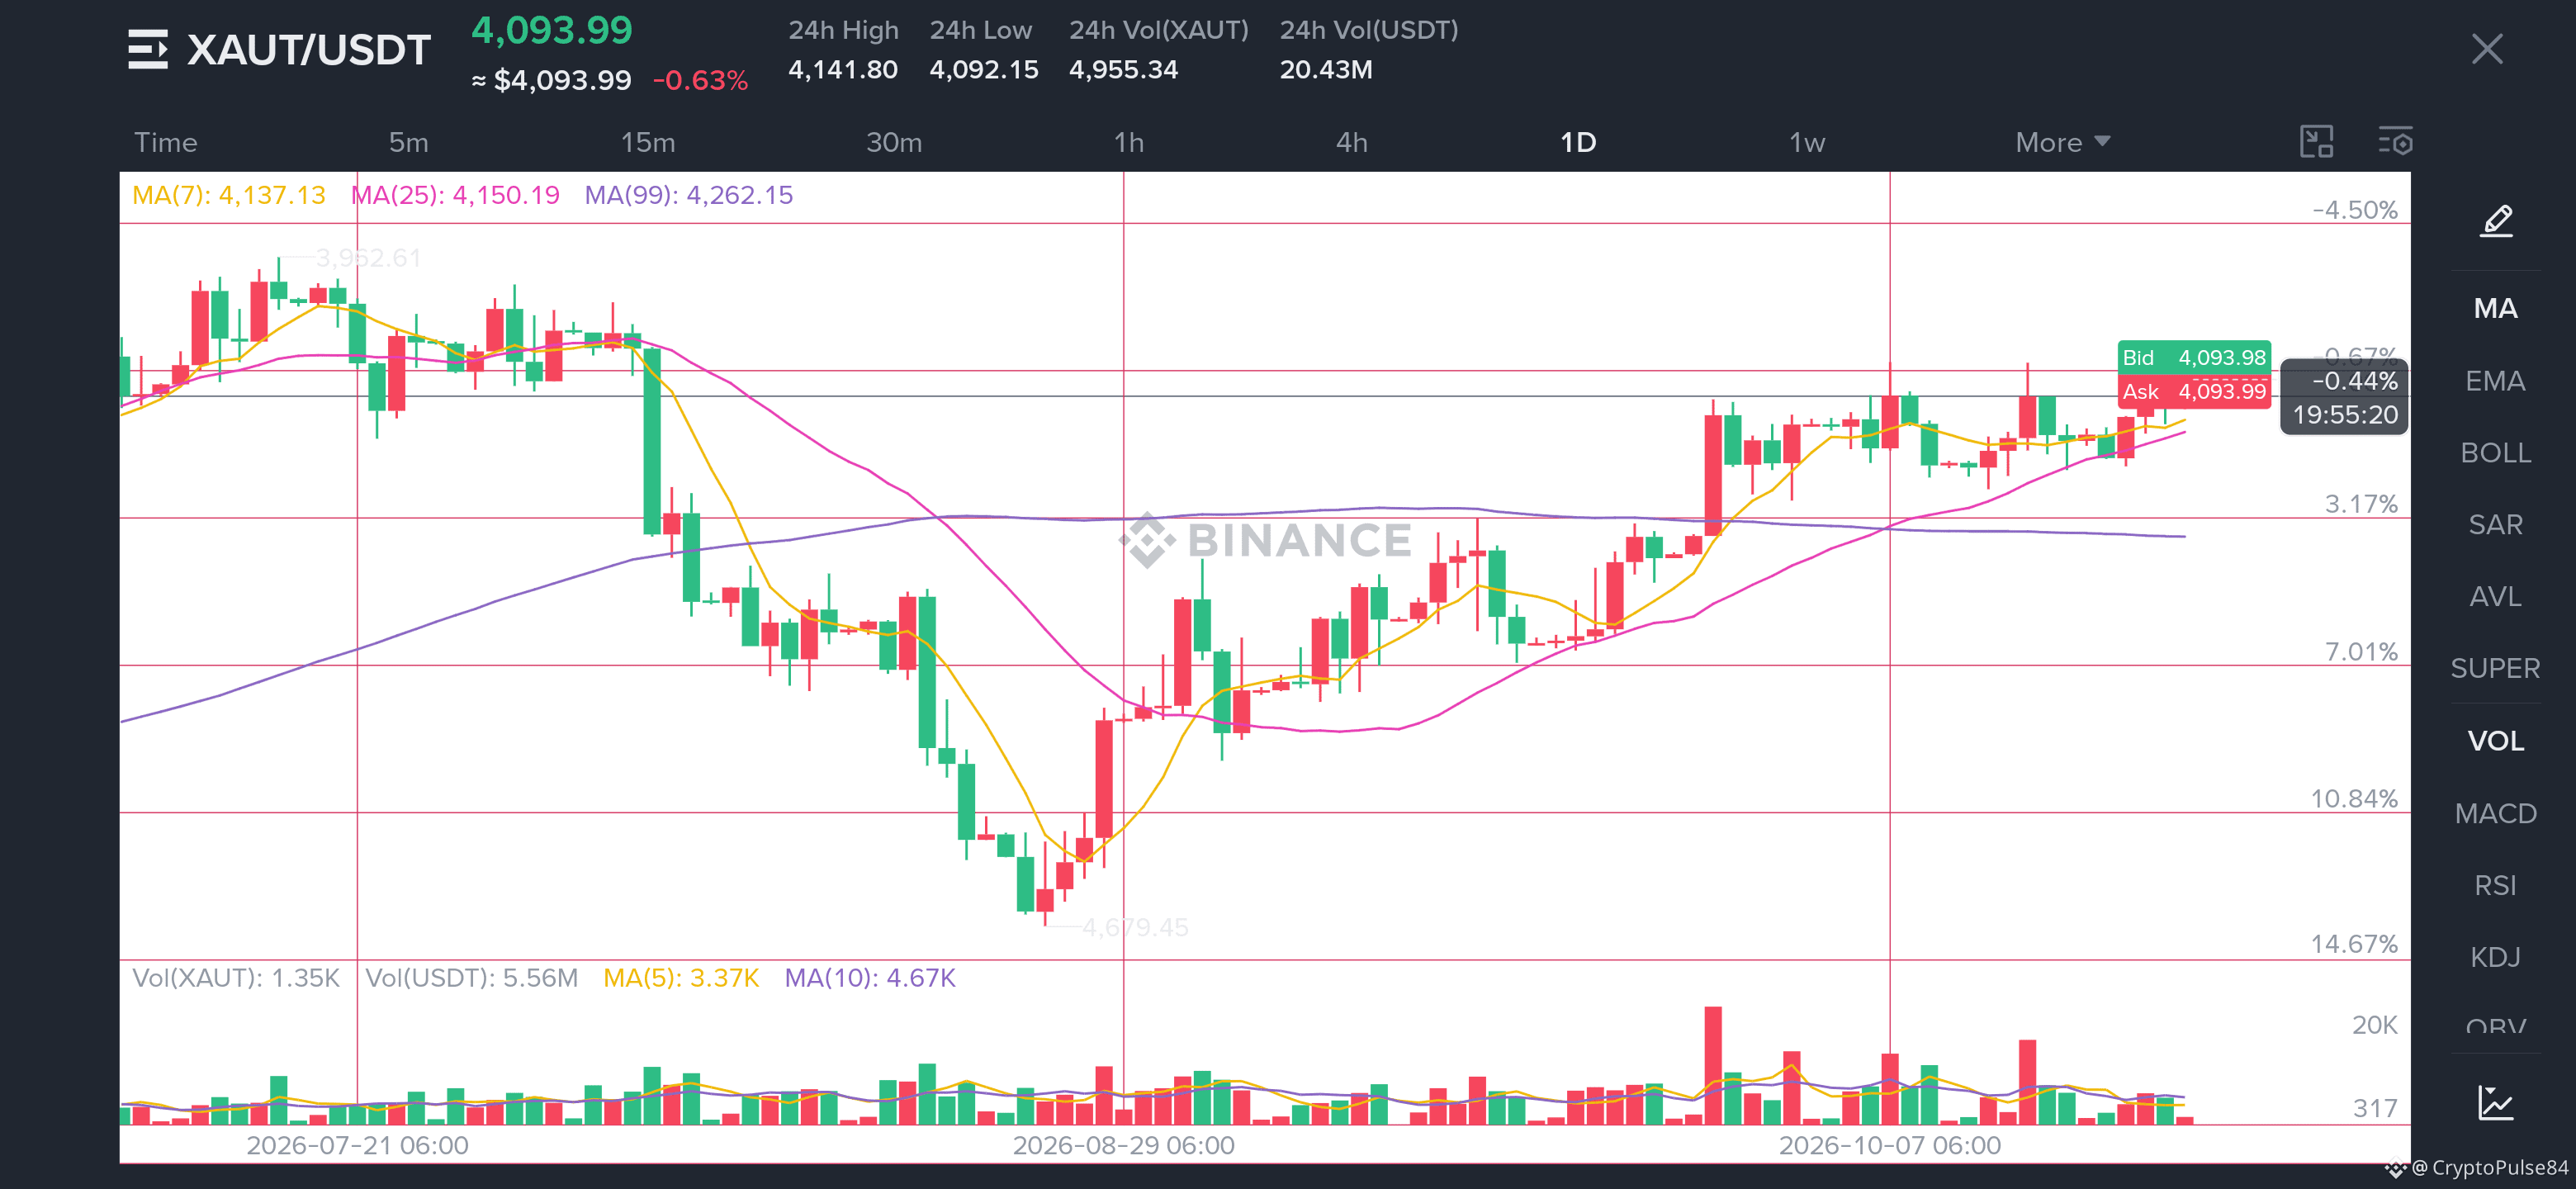
XAUT/USDT Market Analysis | 1D
$XAUT is currently trading around $4,093.99, showing short-term weakness after a recovery from recent lows.
🔹 Support: $4,050 – $4,000
🔹 Resistance: $4,140 – $4,200
🔹 Major Resistance: $4,260
📈 Market Outlook: Price is trading below MA(7), MA(25), and MA(99), indicating that bearish pressure remains. A breakout above $4,200 could support further upside, while a drop below $4,000 may increase downside risk.
🎯 Key Levels Matter, Trade Smart, Manage Risk!
⚠️ Technical analysis only. Not financial advice.
#XAUT #GoldTrading #CryptoAnalysis #Binance #SupportAndResistance
XAUT/USDT Market Analysis | 1D
$XAUT is currently trading around $4,093.99, showing short-term weakness after a recovery from recent lows.
🔹 Support: $4,050 – $4,000
🔹 Resistance: $4,140 – $4,200
🔹 Major Resistance: $4,260
📈 Market Outlook: Price is trading below MA(7), MA(25), and MA(99), indicating that bearish pressure remains. A breakout above $4,200 could support further upside, while a drop below $4,000 may increase downside risk.
🎯 Key Levels Matter, Trade Smart, Manage Risk!
⚠️ Technical analysis only. Not financial advice.
#XAUT #GoldTrading #CryptoAnalysis #Binance #SupportAndResistance
$XAUT is currently trading around $4,093.99, showing short-term weakness after a recovery from recent lows.
🔹 Support: $4,050 – $4,000
🔹 Resistance: $4,140 – $4,200
🔹 Major Resistance: $4,260
📈 Market Outlook: Price is trading below MA(7), MA(25), and MA(99), indicating that bearish pressure remains. A breakout above $4,200 could support further upside, while a drop below $4,000 may increase downside risk.
🎯 Key Levels Matter, Trade Smart, Manage Risk!
⚠️ Technical analysis only. Not financial advice.
#XAUT #GoldTrading #CryptoAnalysis #Binance #SupportAndResistance
245

🚨 $CRWV DEFENDING THE CRITICAL $62 PIVOT AS VOLATILITY COMPRESSES! ⚡
📌 The $62 level is the definitive line in the sand for $CRWV , separating current structural resilience from an aggressive flush into the $40-$50 liquidity pocket. 🌊
Sellers are pressing hard, but long-term expansion potential remains heavily discounted if the tape can carve out a verified bottom above the $51 support shelf. ⚡
The market is pricing in heavy uncertainty, yet asymmetric upside belongs to those who react at macro inflection zones. 💬 Are you looking for a clean reversal here, or waiting to catch the bid in the $40 range? 👇
⚠️ Not financial advice. Always manage your risk. 🛡️
🏷️ #CRWV #CryptoTrading #SupportAndResistance #PriceAction
🎯 🦈
🚨 $CRWV DEFENDING THE CRITICAL $62 PIVOT AS VOLATILITY COMPRESSES! ⚡
📌 The $62 level is the definitive line in the sand for $CRWV , separating current structural resilience from an aggressive flush into the $40-$50 liquidity pocket. 🌊
Sellers are pressing hard, but long-term expansion potential remains heavily discounted if the tape can carve out a verified bottom above the $51 support shelf. ⚡
The market is pricing in heavy uncertainty, yet asymmetric upside belongs to those who react at macro inflection zones. 💬 Are you looking for a clean reversal here, or waiting to catch the bid in the $40 range? 👇
⚠️ Not financial advice. Always manage your risk. 🛡️
🏷️ #CRWV #CryptoTrading #SupportAndResistance #PriceAction
🎯 🦈
📌 The $62 level is the definitive line in the sand for $CRWV , separating current structural resilience from an aggressive flush into the $40-$50 liquidity pocket. 🌊
Sellers are pressing hard, but long-term expansion potential remains heavily discounted if the tape can carve out a verified bottom above the $51 support shelf. ⚡
The market is pricing in heavy uncertainty, yet asymmetric upside belongs to those who react at macro inflection zones. 💬 Are you looking for a clean reversal here, or waiting to catch the bid in the $40 range? 👇
⚠️ Not financial advice. Always manage your risk. 🛡️
🏷️ #CRWV #CryptoTrading #SupportAndResistance #PriceAction
🎯 🦈
3
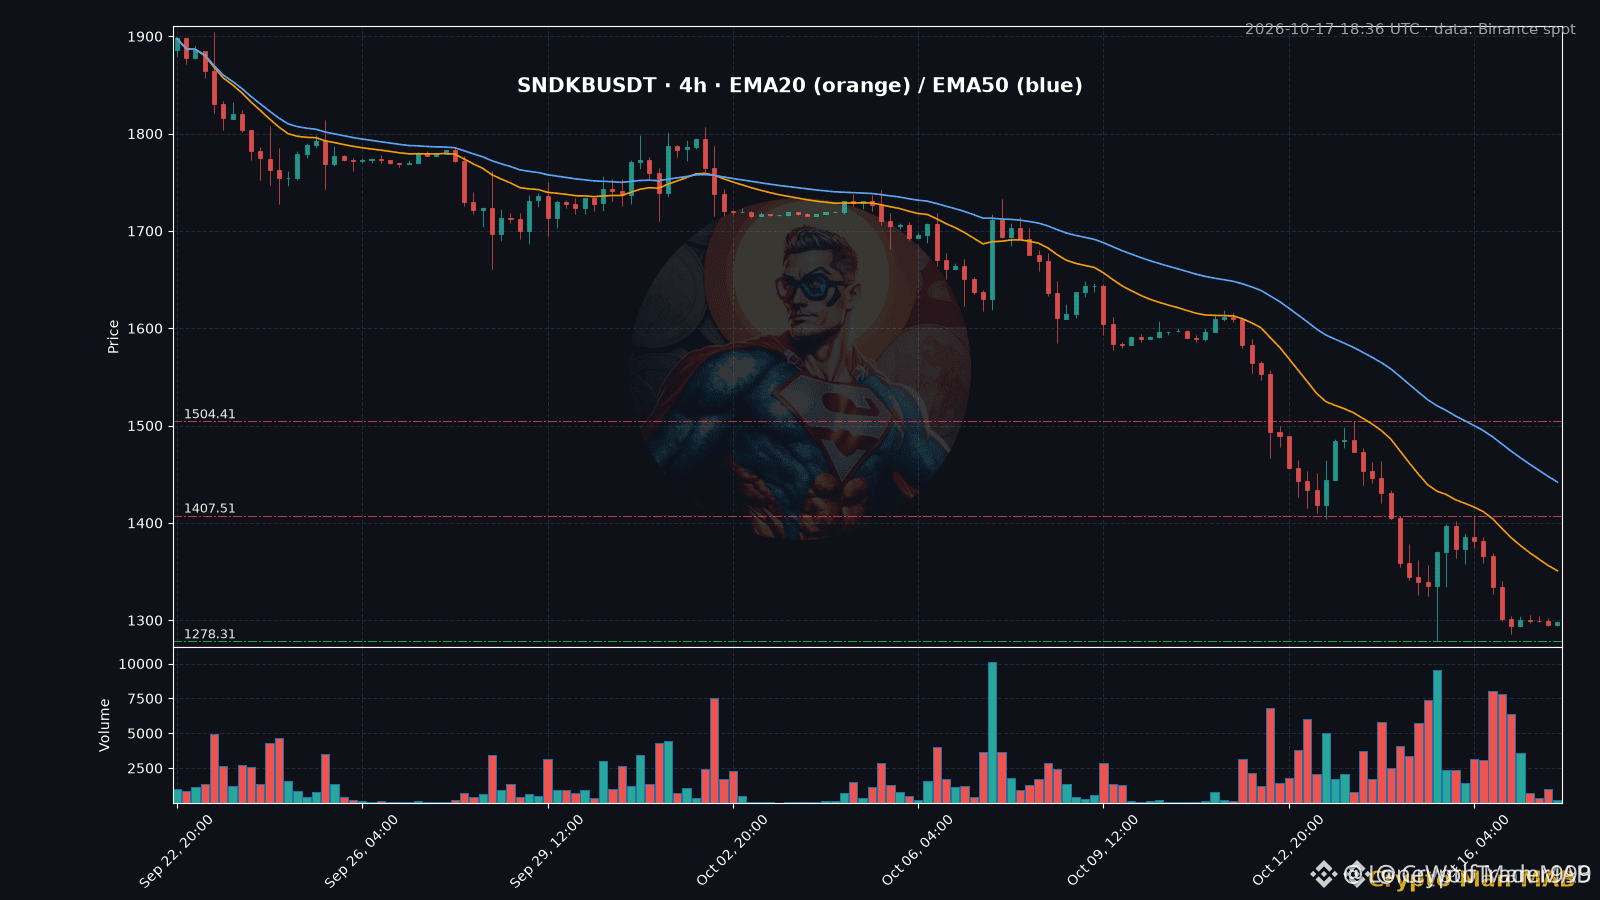
📉 $SNDKB BLEEDING OVER 30% AS SELLERS EYE THE CRITICAL 1278 SUPPORT CLIFF! 🚨
📌 After shedding a brutal third of its valuation from the 1900 peak, $SNDKB is compressing inside a paper-thin weekend range between 1294 and 1305. The momentum bleed has pinned price firmly beneath both 4H EMAs, with the 20 EMA hovering like heavy overhead supply at 1350.
🔍 Everything now hinges on the 1278 wick from October 15; a 4H breakdown there opens the trapdoor for another sharp slide. Bulls have zero footing until buyers reclaim 1350 with authority to contest 1407. 💬 Are you bidding this blood on the line, or waiting for a confirmed reclaim above 1350? 👇
⚠️ Not financial advice. Always manage your risk. 🛡️
🏷️ #SNDKB #PriceAction #SupportAndResistance #CryptoTrading
📉 ⚡
📉 $SNDKB BLEEDING OVER 30% AS SELLERS EYE THE CRITICAL 1278 SUPPORT CLIFF! 🚨
📌 After shedding a brutal third of its valuation from the 1900 peak, $SNDKB is compressing inside a paper-thin weekend range between 1294 and 1305. The momentum bleed has pinned price firmly beneath both 4H EMAs, with the 20 EMA hovering like heavy overhead supply at 1350.
🔍 Everything now hinges on the 1278 wick from October 15; a 4H breakdown there opens the trapdoor for another sharp slide. Bulls have zero footing until buyers reclaim 1350 with authority to contest 1407. 💬 Are you bidding this blood on the line, or waiting for a confirmed reclaim above 1350? 👇
⚠️ Not financial advice. Always manage your risk. 🛡️
🏷️ #SNDKB #PriceAction #SupportAndResistance #CryptoTrading
📉 ⚡
📌 After shedding a brutal third of its valuation from the 1900 peak, $SNDKB is compressing inside a paper-thin weekend range between 1294 and 1305. The momentum bleed has pinned price firmly beneath both 4H EMAs, with the 20 EMA hovering like heavy overhead supply at 1350.
🔍 Everything now hinges on the 1278 wick from October 15; a 4H breakdown there opens the trapdoor for another sharp slide. Bulls have zero footing until buyers reclaim 1350 with authority to contest 1407. 💬 Are you bidding this blood on the line, or waiting for a confirmed reclaim above 1350? 👇
⚠️ Not financial advice. Always manage your risk. 🛡️
🏷️ #SNDKB #PriceAction #SupportAndResistance #CryptoTrading
📉 ⚡
18

·
--
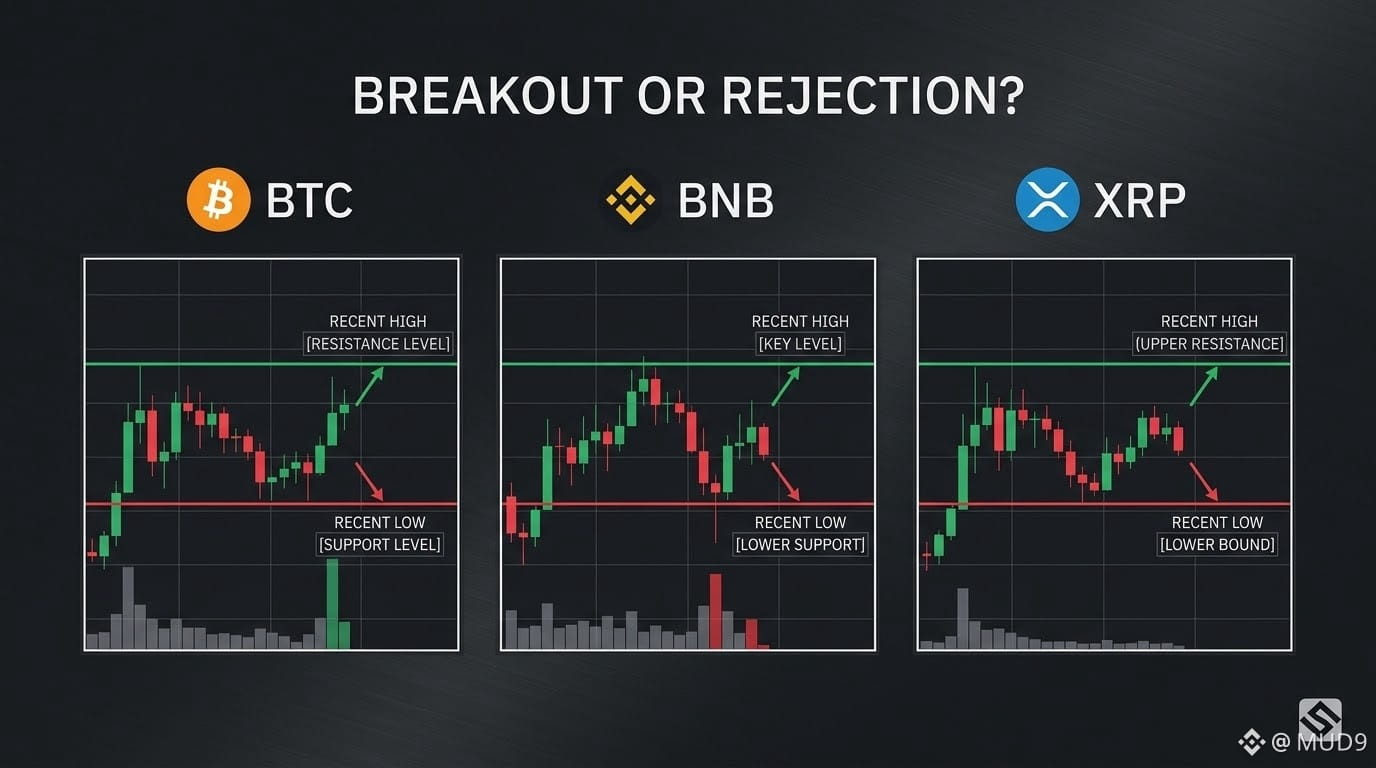
m$BTC , $BNB & $XRP : Watch the Levels, Not the Headlines
The latest available snapshot placed BTC near $82.4K, BNB near $732.75, and XRP near $1.34. BTC was positive over 24 hours, while BNB was nearly unchanged and XRP showed a smaller gain.
Mark recent highs and lows on all three charts. If price breaks a level, check whether volume supports the move; if it fails, be ready for a reversal rather than forcing a bullish view.
Do you prefer trading breakouts or waiting for a retest?
#BTC #BNB #XRP #SupportAndResistance #CryptoTradingInsights #BinanceSquareFamily
{spot}(XRPUSDT)
{spot}(BNBUSDT)
{spot}(BTCUSDT)
m$BTC , $BNB & $XRP : Watch the Levels, Not the Headlines
The latest available snapshot placed BTC near $82.4K, BNB near $732.75, and XRP near $1.34. BTC was positive over 24 hours, while BNB was nearly unchanged and XRP showed a smaller gain.
Mark recent highs and lows on all three charts. If price breaks a level, check whether volume supports the move; if it fails, be ready for a reversal rather than forcing a bullish view.
Do you prefer trading breakouts or waiting for a retest?
#BTC #BNB #XRP #SupportAndResistance #CryptoTradingInsights #BinanceSquareFamily
The latest available snapshot placed BTC near $82.4K, BNB near $732.75, and XRP near $1.34. BTC was positive over 24 hours, while BNB was nearly unchanged and XRP showed a smaller gain.
Mark recent highs and lows on all three charts. If price breaks a level, check whether volume supports the move; if it fails, be ready for a reversal rather than forcing a bullish view.
Do you prefer trading breakouts or waiting for a retest?
#BTC #BNB #XRP #SupportAndResistance #CryptoTradingInsights #BinanceSquareFamily
1
16

·
--
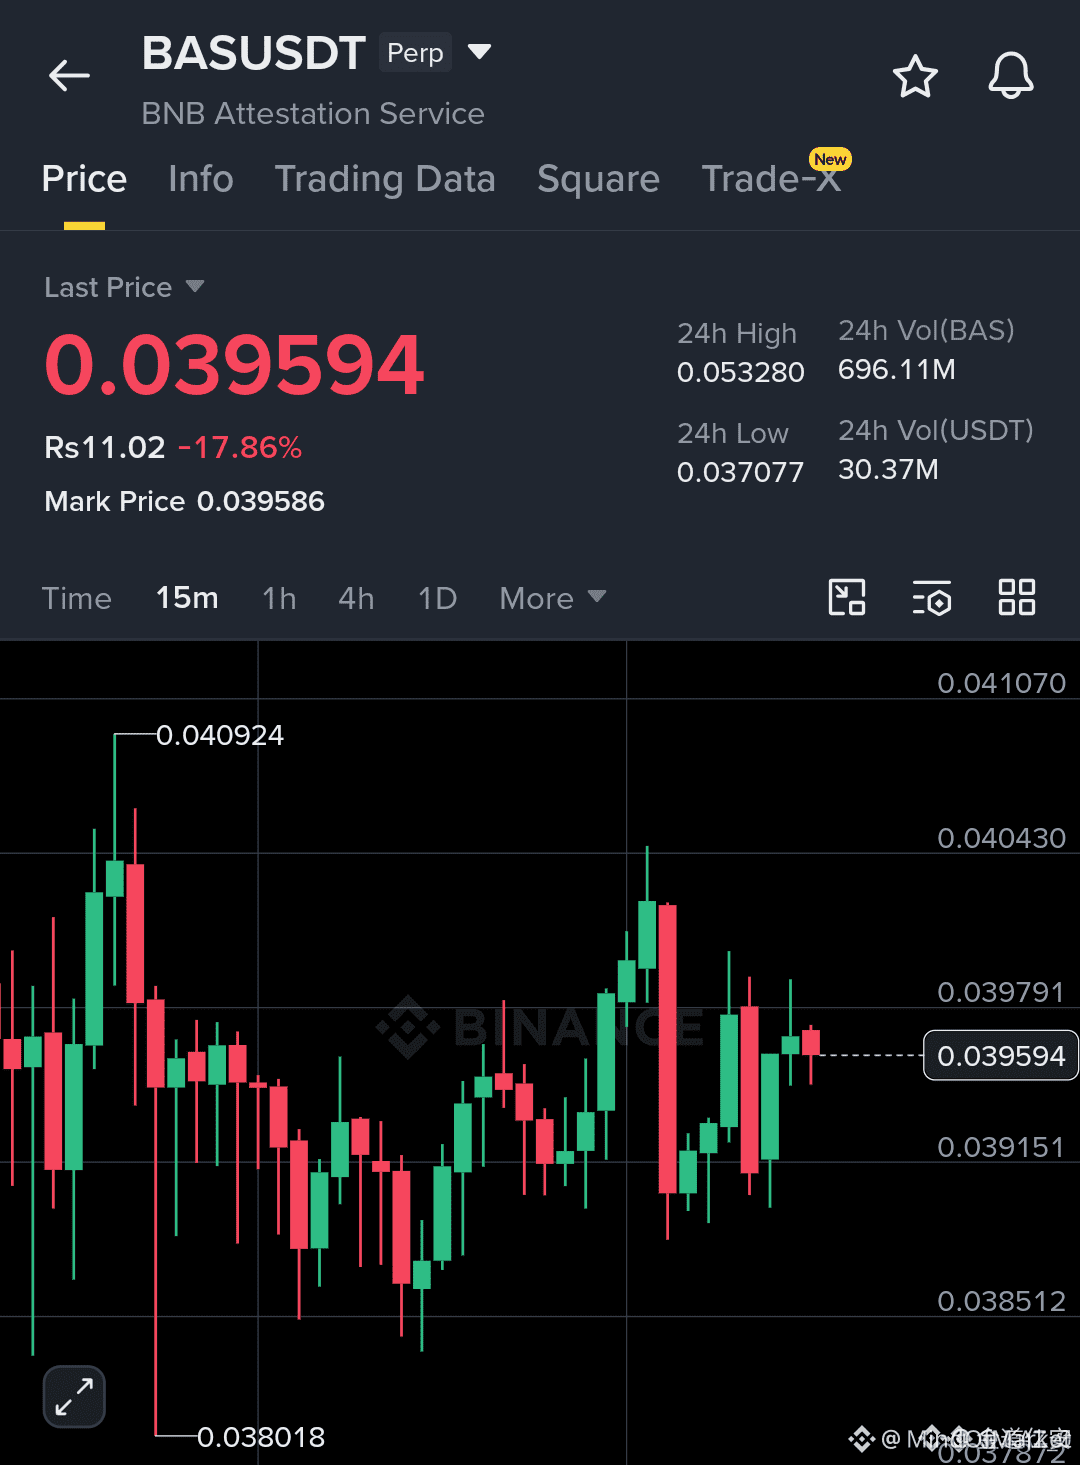
$BAS IS HOLDING ABOVE KEY SUPPORT AFTER A SHARP DECLINE 🔥
Entry: 0.0395 🔥
Target: 0.0404 🚀
Stop Loss: 0.0388 ⚠️
This support zone has attracted bids after the sell-off, but volume remains below average — the lack of conviction keeps the setup in limbo. A clean break above 0.0404 with volume would confirm buyer intent, while a loss of 0.0388 likely triggers a liquidity grab lower.
The risk-reward on the first target is roughly 1:2, but the key is waiting for the trigger. Are you watching this level or already positioned?
Not financial advice. Always manage your risk.
#BAS #SupportAndResistance #ReversalSetup #Crypto
⚡
$BAS IS HOLDING ABOVE KEY SUPPORT AFTER A SHARP DECLINE 🔥
Entry: 0.0395 🔥
Target: 0.0404 🚀
Stop Loss: 0.0388 ⚠️
This support zone has attracted bids after the sell-off, but volume remains below average — the lack of conviction keeps the setup in limbo. A clean break above 0.0404 with volume would confirm buyer intent, while a loss of 0.0388 likely triggers a liquidity grab lower.
The risk-reward on the first target is roughly 1:2, but the key is waiting for the trigger. Are you watching this level or already positioned?
Not financial advice. Always manage your risk.
#BAS #SupportAndResistance #ReversalSetup #Crypto
⚡
Entry: 0.0395 🔥
Target: 0.0404 🚀
Stop Loss: 0.0388 ⚠️
This support zone has attracted bids after the sell-off, but volume remains below average — the lack of conviction keeps the setup in limbo. A clean break above 0.0404 with volume would confirm buyer intent, while a loss of 0.0388 likely triggers a liquidity grab lower.
The risk-reward on the first target is roughly 1:2, but the key is waiting for the trigger. Are you watching this level or already positioned?
Not financial advice. Always manage your risk.
#BAS #SupportAndResistance #ReversalSetup #Crypto
⚡
142
Көбірек контент көру үшін кіріңіз
Binance Square платформасында әлемдік криптоқоғамдастыққа қосылыңыз
⚡️ Криптовалюта туралы ең соңғы және пайдалы ақпаратты алыңыз.
💬 Әлемдегі ең ірі криптобиржаның сеніміне ие.
👍 Расталған авторлардың нақты пікірлерін табыңыз.
Электрондық пошта/телефон нөмірі
Трендтегі тақырыптар
1
#NvidiaBeatsEstimatesWith$130BQ4Outlook
2,354 рет көрілді
49 адам талқылап жатыр
2
#AnthropicIPOPriceCouldExceed$80
5,964 рет көрілді
54 адам талқылап жатыр
3
#CanNvidia’sDataCenterGrowthContinue?
12,992 рет көрілді
229 адам талқылап жатыр
4
#DBSAndCirclePartnerToExpandAsianInstitutionsUSDCAccess
400 рет көрілді
7 адам талқылап жатыр
5
#NvidiaBoardNotConsideringHuang’sReturnasCEO
169,812 рет көрілді
1,249 адам талқылап жатыр
6
#KOSPIFalls2.59%ToLowestCloseSinceFebruary
46,778 рет көрілді
517 адам талқылап жатыр
7
#AnthropicClearedToListOnNasdaqAsANT
40,724 рет көрілді
403 адам талқылап жатыр
8
#WhatInvestmentSignalsDo13FFilingsReveal?
91,792 рет көрілді
812 адам талқылап жатыр
9
#TetherCapitalMakesStrategicInvestmentInStables
23,695 рет көрілді
224 адам талқылап жатыр
10
#EvernorthRecords$505MImpairmentOnPreListingXRP
2,752 рет көрілді
30 адам талқылап жатыр