

#quanttrading
quanttrading
34,309 рет көрілді
396 адам талқылап жатыр
Қызу саудада
Ең соңғы

Wiring your strategy logic directly into order placement is tempting, but it's fundamentally flawed. ⚠️
Changing entry rules forces you to touch execution, risk, and permissions all at once. This tight coupling creates a massive bottleneck for iteration.
The proper way to build robust systems is by separating these layers.
Your strategy should only define the 'when to enter' and 'when to exit.' Everything downstream—sizing, risk guards, permission checks, and order routing—should be handled by a stable, reusable layer.
This creates a predictable pipeline:
1. Strategy feeds into the Risk layer.
2. Risk feeds into the Execution layer.
3. All monitored by a final Monitoring layer. ✅
The major benefit? When you test a new signal, the underlying risk controls, reconciliation processes, and alerts remain untouched and battle-tested. Failed experiments can't destabilize your core infrastructure.
WolfBot manages this separation entirely. You define the signal rules, and the system automatically handles sizing, guards, order routing, partial fills, and reconciliation underneath. ⚙️
This architectural clean break means you focus purely on alpha generation while the infrastructure remains rock solid.
See how this separation works in practice and explore building strategies without rebuilding execution infrastructure here: https://wolfbot.io/en/academy/strategy-automation-without-rebuilding-execution-infrastructure 🚀
#QuantTrading #AutomatedTrading #RiskManagement #CryptoDev #StrategyAutomation
Wiring your strategy logic directly into order placement is tempting, but it's fundamentally flawed. ⚠️
Changing entry rules forces you to touch execution, risk, and permissions all at once. This tight coupling creates a massive bottleneck for iteration.
The proper way to build robust systems is by separating these layers.
Your strategy should only define the 'when to enter' and 'when to exit.' Everything downstream—sizing, risk guards, permission checks, and order routing—should be handled by a stable, reusable layer.
This creates a predictable pipeline:
1. Strategy feeds into the Risk layer.
2. Risk feeds into the Execution layer.
3. All monitored by a final Monitoring layer. ✅
The major benefit? When you test a new signal, the underlying risk controls, reconciliation processes, and alerts remain untouched and battle-tested. Failed experiments can't destabilize your core infrastructure.
WolfBot manages this separation entirely. You define the signal rules, and the system automatically handles sizing, guards, order routing, partial fills, and reconciliation underneath. ⚙️
This architectural clean break means you focus purely on alpha generation while the infrastructure remains rock solid.
See how this separation works in practice and explore building strategies without rebuilding execution infrastructure here: https://wolfbot.io/en/academy/strategy-automation-without-rebuilding-execution-infrastructure 🚀
#QuantTrading #AutomatedTrading #RiskManagement #CryptoDev #StrategyAutomation
Changing entry rules forces you to touch execution, risk, and permissions all at once. This tight coupling creates a massive bottleneck for iteration.
The proper way to build robust systems is by separating these layers.
Your strategy should only define the 'when to enter' and 'when to exit.' Everything downstream—sizing, risk guards, permission checks, and order routing—should be handled by a stable, reusable layer.
This creates a predictable pipeline:
1. Strategy feeds into the Risk layer.
2. Risk feeds into the Execution layer.
3. All monitored by a final Monitoring layer. ✅
The major benefit? When you test a new signal, the underlying risk controls, reconciliation processes, and alerts remain untouched and battle-tested. Failed experiments can't destabilize your core infrastructure.
WolfBot manages this separation entirely. You define the signal rules, and the system automatically handles sizing, guards, order routing, partial fills, and reconciliation underneath. ⚙️
This architectural clean break means you focus purely on alpha generation while the infrastructure remains rock solid.
See how this separation works in practice and explore building strategies without rebuilding execution infrastructure here: https://wolfbot.io/en/academy/strategy-automation-without-rebuilding-execution-infrastructure 🚀
#QuantTrading #AutomatedTrading #RiskManagement #CryptoDev #StrategyAutomation

83

Мақала
Optimize on one year, and if it's profitable every year after, you've found an edge.I tested that theory on a Bollinger Band mean-reversion system for $BTC and $ETH . The data says otherwise. 🔬
📊 Test parameters
• Assets: BTCUSDT and ETHUSDT (tested separately)
• Timeframe: 1H
• Period: Jan 2024 to Present
• Friction: 0.05% commission per trade, no slippage modelled
• Sample: 153 trades on BTCUSDT , 87 trades on $ETH (selected sets)
• Process: Optimized 192 parameter combinations on 2024 data only, then ran one continuous walk-forward test over the full history.
📐 Strategy rules
• Long: Previous 1H candle closed below the lower Bollinger Band, current candle closes back above it, and price is above a long-term EMA. (Shorts are the mirror image).
• The trend filter ensures a strong breakout is never faded head-on.
• Stop: Fixed ATR-based hard stop. No trailing.
• Target: Fixed ATR-based full exit inside the opposite band.
• Risk: Position size is a fixed fraction of equity divided by stop distance.
⚠️ Reality check
The flattering part: The selected sets were net-positive in every single year. returned +15.34% (max drawdown -7.56%). ETHUSDT returned +17.37% (max drawdown -5.18%).
The part that hurts: Those sets were chosen after seeing the full history. That isn't clean out-of-sample data. When I judged every set that was profitable in 2024 only on the later blind years:
Only 10.59% of BTCUSDT sets and 12.77% of ETHUSDT sets stayed positive in every out-of-sample year.
The median out-of-sample return fell to -2.89% for BTCUSDT and -2.24% for ETHUSDT.
The worst-case scenario was -17.68% for BTCUSDT and -20.69% for ETHUSDT.
A better training year did not predict a better future (Rank correlation was negative for both assets).
Exactly 0 sets met my quality targets for out-of-sample profit factor and drawdowns.
🛠 How I handle it
Why it fails: Mean reversion earns small, frequent wins, but gets crushed when price trends heavily through the bands. The 2024 optimization mostly just memorized that specific year's market chop. It didn't carry forward.
What I do about it: I keep the trend-bias filter, add range-regime and volatility filters so the system stays entirely out of trending conditions, and fix risk per trade with ATR-based stops. I judge sets on their worst year, not their best total return.
This is research, not a promise of returns. If you want to see how a systematic approach actually behaves live—drawdowns included—follow my Binance lead-trader profile. 📉
🔗 [Lead Trader Profile](https://www.binance.com/en/copy-trading/lead-details/5042838003766000384)
(Disclaimer: Backtested and past results are hypothetical and do not guarantee future performance. Not financial advice.)
#cryptotrading #Backtesting #QuantTrading #bitcoin
Optimize on one year, and if it's profitable every year after, you've found an edge.
I tested that theory on a Bollinger Band mean-reversion system for $BTC and $ETH . The data says otherwise. 🔬
📊 Test parameters
• Assets: BTCUSDT and ETHUSDT (tested separately)
• Timeframe: 1H
• Period: Jan 2024 to Present
• Friction: 0.05% commission per trade, no slippage modelled
• Sample: 153 trades on BTCUSDT , 87 trades on $ETH (selected sets)
• Process: Optimized 192 parameter combinations on 2024 data only, then ran one continuous walk-forward test over the full history.
📐 Strategy rules
• Long: Previous 1H candle closed below the lower Bollinger Band, current candle closes back above it, and price is above a long-term EMA. (Shorts are the mirror image).
• The trend filter ensures a strong breakout is never faded head-on.
• Stop: Fixed ATR-based hard stop. No trailing.
• Target: Fixed ATR-based full exit inside the opposite band.
• Risk: Position size is a fixed fraction of equity divided by stop distance.
⚠️ Reality check
The flattering part: The selected sets were net-positive in every single year. returned +15.34% (max drawdown -7.56%). ETHUSDT returned +17.37% (max drawdown -5.18%).
The part that hurts: Those sets were chosen after seeing the full history. That isn't clean out-of-sample data. When I judged every set that was profitable in 2024 only on the later blind years:
Only 10.59% of BTCUSDT sets and 12.77% of ETHUSDT sets stayed positive in every out-of-sample year.
The median out-of-sample return fell to -2.89% for BTCUSDT and -2.24% for ETHUSDT.
The worst-case scenario was -17.68% for BTCUSDT and -20.69% for ETHUSDT.
A better training year did not predict a better future (Rank correlation was negative for both assets).
Exactly 0 sets met my quality targets for out-of-sample profit factor and drawdowns.
🛠 How I handle it
Why it fails: Mean reversion earns small, frequent wins, but gets crushed when price trends heavily through the bands. The 2024 optimization mostly just memorized that specific year's market chop. It didn't carry forward.
What I do about it: I keep the trend-bias filter, add range-regime and volatility filters so the system stays entirely out of trending conditions, and fix risk per trade with ATR-based stops. I judge sets on their worst year, not their best total return.
This is research, not a promise of returns. If you want to see how a systematic approach actually behaves live—drawdowns included—follow my Binance lead-trader profile. 📉
🔗 Lead Trader Profile
(Disclaimer: Backtested and past results are hypothetical and do not guarantee future performance. Not financial advice.)
#cryptotrading #Backtesting #QuantTrading #bitcoin
📊 Test parameters
• Assets: BTCUSDT and ETHUSDT (tested separately)
• Timeframe: 1H
• Period: Jan 2024 to Present
• Friction: 0.05% commission per trade, no slippage modelled
• Sample: 153 trades on BTCUSDT , 87 trades on $ETH (selected sets)
• Process: Optimized 192 parameter combinations on 2024 data only, then ran one continuous walk-forward test over the full history.
📐 Strategy rules
• Long: Previous 1H candle closed below the lower Bollinger Band, current candle closes back above it, and price is above a long-term EMA. (Shorts are the mirror image).
• The trend filter ensures a strong breakout is never faded head-on.
• Stop: Fixed ATR-based hard stop. No trailing.
• Target: Fixed ATR-based full exit inside the opposite band.
• Risk: Position size is a fixed fraction of equity divided by stop distance.
⚠️ Reality check
The flattering part: The selected sets were net-positive in every single year. returned +15.34% (max drawdown -7.56%). ETHUSDT returned +17.37% (max drawdown -5.18%).
The part that hurts: Those sets were chosen after seeing the full history. That isn't clean out-of-sample data. When I judged every set that was profitable in 2024 only on the later blind years:
Only 10.59% of BTCUSDT sets and 12.77% of ETHUSDT sets stayed positive in every out-of-sample year.
The median out-of-sample return fell to -2.89% for BTCUSDT and -2.24% for ETHUSDT.
The worst-case scenario was -17.68% for BTCUSDT and -20.69% for ETHUSDT.
A better training year did not predict a better future (Rank correlation was negative for both assets).
Exactly 0 sets met my quality targets for out-of-sample profit factor and drawdowns.
🛠 How I handle it
Why it fails: Mean reversion earns small, frequent wins, but gets crushed when price trends heavily through the bands. The 2024 optimization mostly just memorized that specific year's market chop. It didn't carry forward.
What I do about it: I keep the trend-bias filter, add range-regime and volatility filters so the system stays entirely out of trending conditions, and fix risk per trade with ATR-based stops. I judge sets on their worst year, not their best total return.
This is research, not a promise of returns. If you want to see how a systematic approach actually behaves live—drawdowns included—follow my Binance lead-trader profile. 📉
🔗 Lead Trader Profile
(Disclaimer: Backtested and past results are hypothetical and do not guarantee future performance. Not financial advice.)
#cryptotrading #Backtesting #QuantTrading #bitcoin
128

【QuantConnect 量化架構解密:散戶交易最大的致命傷,是把「信號、倉位與風控」全混成一鍋粥!】
很多加密貨幣交易員在寫策略或手動交易時,往往把整套邏輯寫成一句話:
「當 RSI < 30 且均線金叉時,立刻開 10 倍槓桿買入 $BTC !」
但全球領先的量化交易平台 QuantConnect(其開源 LEAN 引擎被無數華爾街基金採用)指出:
這種把「信號、倉位、執行與風控」混為一談的思維,正是 90% 交易者賺不到錢的根本原因!
因為一旦策略虧錢,你根本無法分辨:究竟是「信號判斷錯了(Alpha 失效)」、還是「單筆倉位過大(配置失控)」、抑或是「滑點被磨光(執行太爛)」?
🧱 QuantConnect 頂級量化架構的 5 大「職責分離(Separation of Concerns)」模組:
1️⃣ 標的池模型(Universe Selection)
- 只回答一個問題:今天該關注哪些標的?
- 例如:只從全市場篩選流動性前 20 大的加密代幣,把沒有成交量、隨時可能歸零的空氣幣隔絕在交易池之外。
2️⃣ Alpha 預測模型(Alpha Model)
- 只負責預測,絕不直接下單!
- 它的唯一任務是發出預測洞察(Insights):預測某個幣未來的方向(看漲/看跌)、置信度與預期持續時間。
- 頂級量化不會讓指標直接決定開多少手,它只輸出概率評估。
3️⃣ 投資組合構建模型(Portfolio Construction)
- 決定「下注大小(Position Sizing)」的真正大腦。
- 它接收所有 Alpha 信號,結合整體市場的波動率與相關性,計算每個幣種該分配多少資金比例(如等權重、風險平價 Risk Parity)。防止你把身家押在同一類型的資產上。
4️⃣ 執行模型(Execution Model)
- 告別無腦市價單。
- 針對 $BTC 、 $ETH 與 $SOL 的大單,自動採用 TWAP(時間加權平均)或冰山算法拆單,將盤口滑點與市場衝擊成本降至最低。
5️⃣ 風險管理模型(Risk Management)
- 懸在頭頂的達摩克利斯之劍。
- 獨立於所有策略之外運行的「熔斷器」:監控單幣最大回撤是否達到 2%?總賬戶浮虧是否觸發紅線?一旦超標,立刻強制砍倉,不給任何僥倖死扛的機會!
🎯 給加密交易員的思維進化課:
無論你是手動盯盤還是寫代碼跑量化:
「不要讓發現信號的興奮感,越權去決定你該下多少倉位!」
把「信號分析」、「倉位計算」與「無條件風控」徹底拆分成三個獨立開關,你的交易曲線才能從大起大落的賭博,蛻變為穩步上升的複利機器!
💬 扎心問卷:在你的日常交易中,你是否有清晰區分「信號強度」與「倉位控制」?
- 投 1:有!我有嚴格的倉位與風控規則,信號再好也不隨便加大槓桿
- 投 2:沒有,經常信號一來就憑感覺梭哈,全憑當下心情決定開多大
#QuantConnect #QuantTrading #BinanceSquare
【QuantConnect 量化架構解密:散戶交易最大的致命傷,是把「信號、倉位與風控」全混成一鍋粥!】
很多加密貨幣交易員在寫策略或手動交易時,往往把整套邏輯寫成一句話:
「當 RSI < 30 且均線金叉時,立刻開 10 倍槓桿買入 $BTC !」
但全球領先的量化交易平台 QuantConnect(其開源 LEAN 引擎被無數華爾街基金採用)指出:
這種把「信號、倉位、執行與風控」混為一談的思維,正是 90% 交易者賺不到錢的根本原因!
因為一旦策略虧錢,你根本無法分辨:究竟是「信號判斷錯了(Alpha 失效)」、還是「單筆倉位過大(配置失控)」、抑或是「滑點被磨光(執行太爛)」?
🧱 QuantConnect 頂級量化架構的 5 大「職責分離(Separation of Concerns)」模組:
1️⃣ 標的池模型(Universe Selection)
- 只回答一個問題:今天該關注哪些標的?
- 例如:只從全市場篩選流動性前 20 大的加密代幣,把沒有成交量、隨時可能歸零的空氣幣隔絕在交易池之外。
2️⃣ Alpha 預測模型(Alpha Model)
- 只負責預測,絕不直接下單!
- 它的唯一任務是發出預測洞察(Insights):預測某個幣未來的方向(看漲/看跌)、置信度與預期持續時間。
- 頂級量化不會讓指標直接決定開多少手,它只輸出概率評估。
3️⃣ 投資組合構建模型(Portfolio Construction)
- 決定「下注大小(Position Sizing)」的真正大腦。
- 它接收所有 Alpha 信號,結合整體市場的波動率與相關性,計算每個幣種該分配多少資金比例(如等權重、風險平價 Risk Parity)。防止你把身家押在同一類型的資產上。
4️⃣ 執行模型(Execution Model)
- 告別無腦市價單。
- 針對 $BTC 、 $ETH 與 $SOL 的大單,自動採用 TWAP(時間加權平均)或冰山算法拆單,將盤口滑點與市場衝擊成本降至最低。
5️⃣ 風險管理模型(Risk Management)
- 懸在頭頂的達摩克利斯之劍。
- 獨立於所有策略之外運行的「熔斷器」:監控單幣最大回撤是否達到 2%?總賬戶浮虧是否觸發紅線?一旦超標,立刻強制砍倉,不給任何僥倖死扛的機會!
🎯 給加密交易員的思維進化課:
無論你是手動盯盤還是寫代碼跑量化:
「不要讓發現信號的興奮感,越權去決定你該下多少倉位!」
把「信號分析」、「倉位計算」與「無條件風控」徹底拆分成三個獨立開關,你的交易曲線才能從大起大落的賭博,蛻變為穩步上升的複利機器!
💬 扎心問卷:在你的日常交易中,你是否有清晰區分「信號強度」與「倉位控制」?
- 投 1:有!我有嚴格的倉位與風控規則,信號再好也不隨便加大槓桿
- 投 2:沒有,經常信號一來就憑感覺梭哈,全憑當下心情決定開多大
#QuantConnect #QuantTrading #BinanceSquare
很多加密貨幣交易員在寫策略或手動交易時,往往把整套邏輯寫成一句話:
「當 RSI < 30 且均線金叉時,立刻開 10 倍槓桿買入 $BTC !」
但全球領先的量化交易平台 QuantConnect(其開源 LEAN 引擎被無數華爾街基金採用)指出:
這種把「信號、倉位、執行與風控」混為一談的思維,正是 90% 交易者賺不到錢的根本原因!
因為一旦策略虧錢,你根本無法分辨:究竟是「信號判斷錯了(Alpha 失效)」、還是「單筆倉位過大(配置失控)」、抑或是「滑點被磨光(執行太爛)」?
🧱 QuantConnect 頂級量化架構的 5 大「職責分離(Separation of Concerns)」模組:
1️⃣ 標的池模型(Universe Selection)
- 只回答一個問題:今天該關注哪些標的?
- 例如:只從全市場篩選流動性前 20 大的加密代幣,把沒有成交量、隨時可能歸零的空氣幣隔絕在交易池之外。
2️⃣ Alpha 預測模型(Alpha Model)
- 只負責預測,絕不直接下單!
- 它的唯一任務是發出預測洞察(Insights):預測某個幣未來的方向(看漲/看跌)、置信度與預期持續時間。
- 頂級量化不會讓指標直接決定開多少手,它只輸出概率評估。
3️⃣ 投資組合構建模型(Portfolio Construction)
- 決定「下注大小(Position Sizing)」的真正大腦。
- 它接收所有 Alpha 信號,結合整體市場的波動率與相關性,計算每個幣種該分配多少資金比例(如等權重、風險平價 Risk Parity)。防止你把身家押在同一類型的資產上。
4️⃣ 執行模型(Execution Model)
- 告別無腦市價單。
- 針對 $BTC 、 $ETH 與 $SOL 的大單,自動採用 TWAP(時間加權平均)或冰山算法拆單,將盤口滑點與市場衝擊成本降至最低。
5️⃣ 風險管理模型(Risk Management)
- 懸在頭頂的達摩克利斯之劍。
- 獨立於所有策略之外運行的「熔斷器」:監控單幣最大回撤是否達到 2%?總賬戶浮虧是否觸發紅線?一旦超標,立刻強制砍倉,不給任何僥倖死扛的機會!
🎯 給加密交易員的思維進化課:
無論你是手動盯盤還是寫代碼跑量化:
「不要讓發現信號的興奮感,越權去決定你該下多少倉位!」
把「信號分析」、「倉位計算」與「無條件風控」徹底拆分成三個獨立開關,你的交易曲線才能從大起大落的賭博,蛻變為穩步上升的複利機器!
💬 扎心問卷:在你的日常交易中,你是否有清晰區分「信號強度」與「倉位控制」?
- 投 1:有!我有嚴格的倉位與風控規則,信號再好也不隨便加大槓桿
- 投 2:沒有,經常信號一來就憑感覺梭哈,全憑當下心情決定開多大
#QuantConnect #QuantTrading #BinanceSquare
466
Nobody likes red, but transparency means showing the losses too.
Just closed a trade on $ARK for -9.4%. The algo flagged a momentum breakout that failed to hold its support level — price reversed before confirmation, triggering our protective exit.
Current walk-forward window winrate sits at 65% (385/592). We log every trade, including losses, because real edge isn't about never losing — it's about the math holding up over hundreds of trades.
Full open track record in bio.
What's your approach when a breakout setup fails — do you cut immediately or wait for confirmation? $ARK #QuantTrading
Nobody likes red, but transparency means showing the losses too.
Just closed a trade on $ARK for -9.4%. The algo flagged a momentum breakout that failed to hold its support level — price reversed before confirmation, triggering our protective exit.
Current walk-forward window winrate sits at 65% (385/592). We log every trade, including losses, because real edge isn't about never losing — it's about the math holding up over hundreds of trades.
Full open track record in bio.
What's your approach when a breakout setup fails — do you cut immediately or wait for confirmation? $ARK #QuantTrading
Just closed a trade on $ARK for -9.4%. The algo flagged a momentum breakout that failed to hold its support level — price reversed before confirmation, triggering our protective exit.
Current walk-forward window winrate sits at 65% (385/592). We log every trade, including losses, because real edge isn't about never losing — it's about the math holding up over hundreds of trades.
Full open track record in bio.
What's your approach when a breakout setup fails — do you cut immediately or wait for confirmation? $ARK #QuantTrading
19

·
--
Жоғары (өспелі)
The Secret Relationship Between Bitcoin and Altcoins.
In quantitative analysis, context is everything. You cannot trade an altcoin in isolation; you must understand its relationship to the market leader.
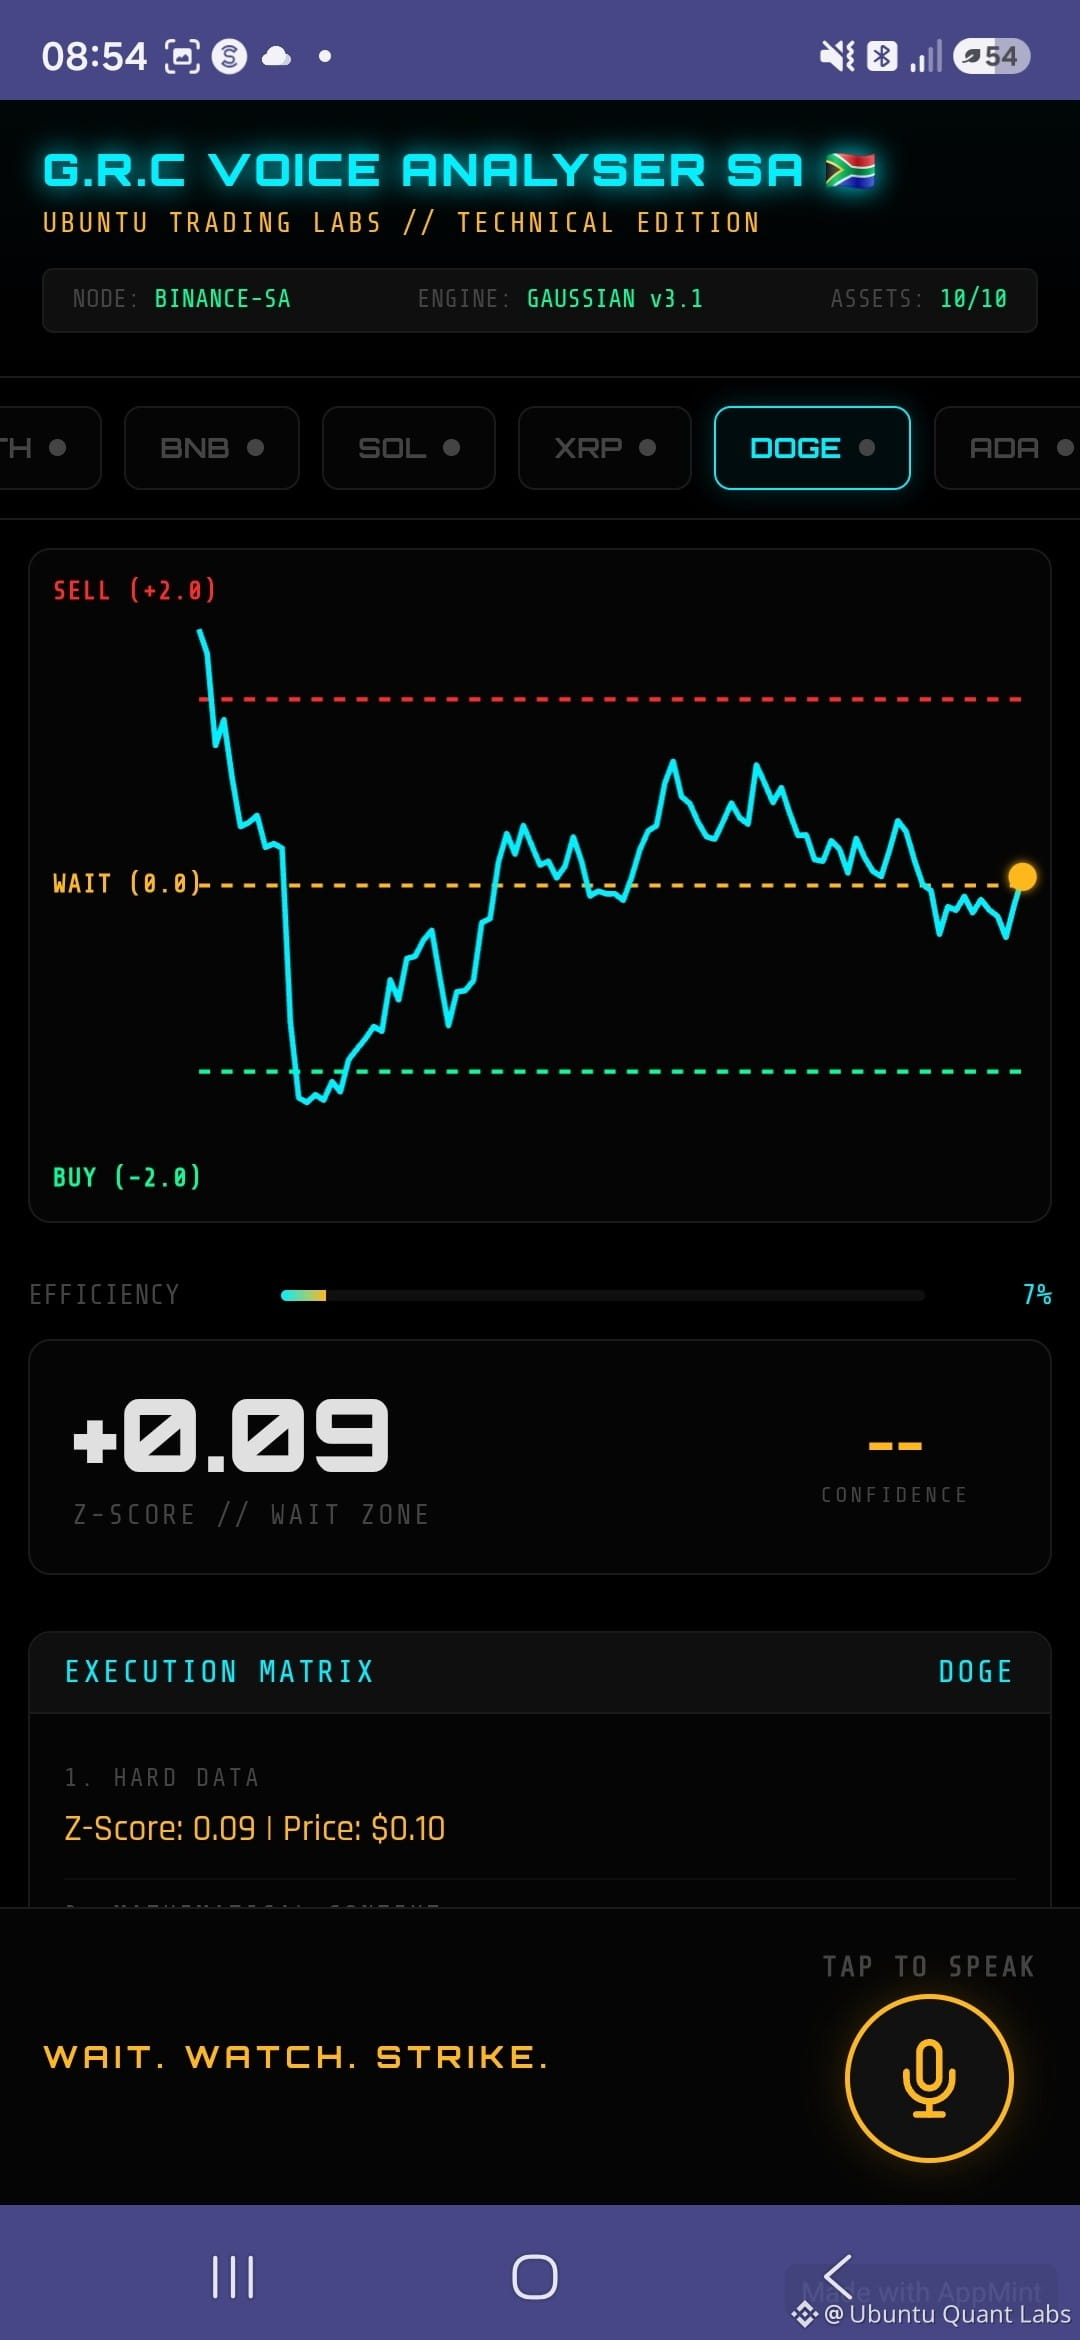
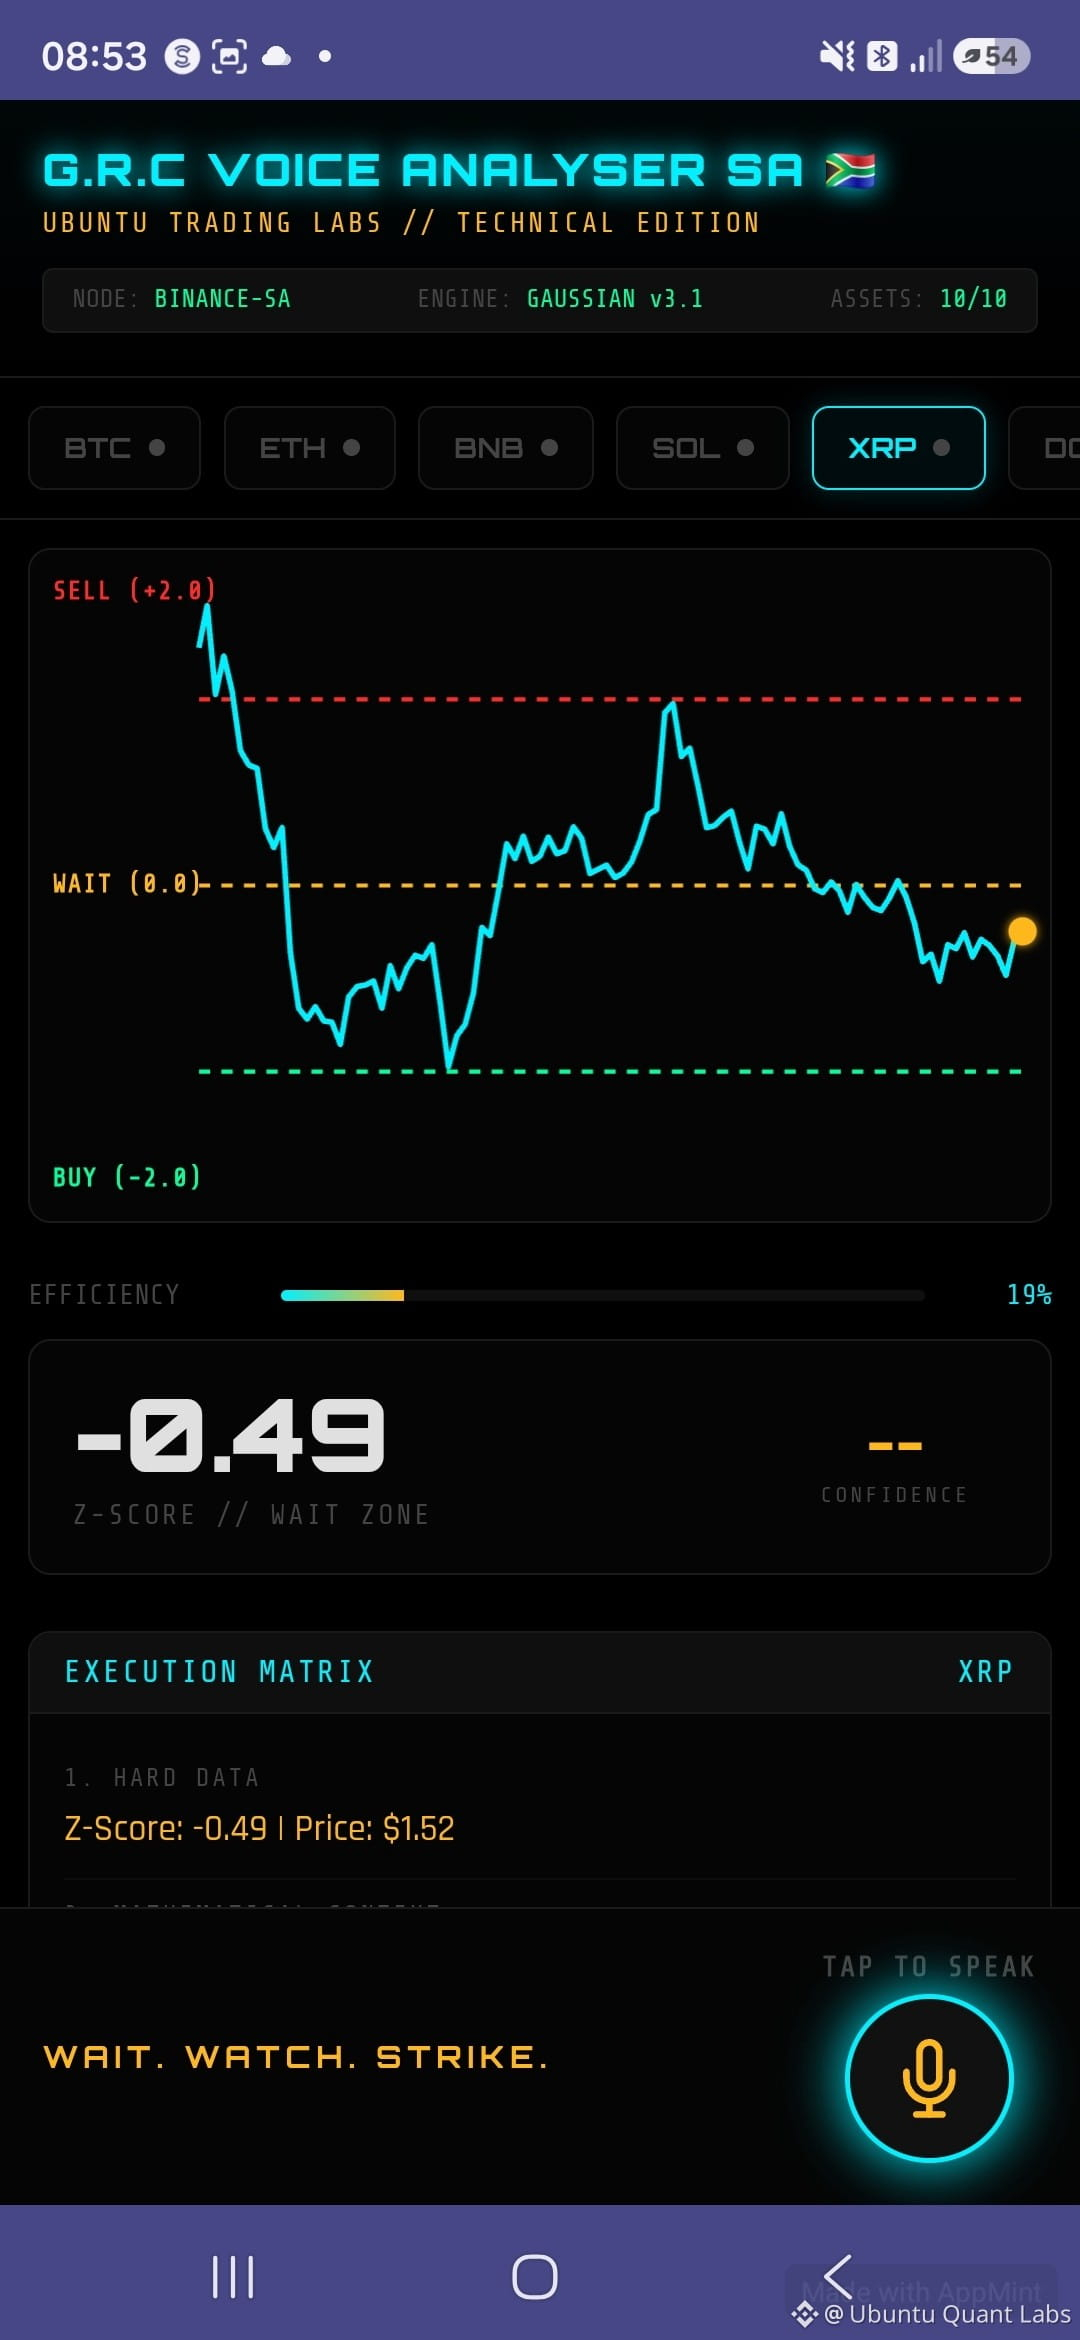
Today, our Z-Score models highlighted a classic "Lag Effect" across the crypto structure:
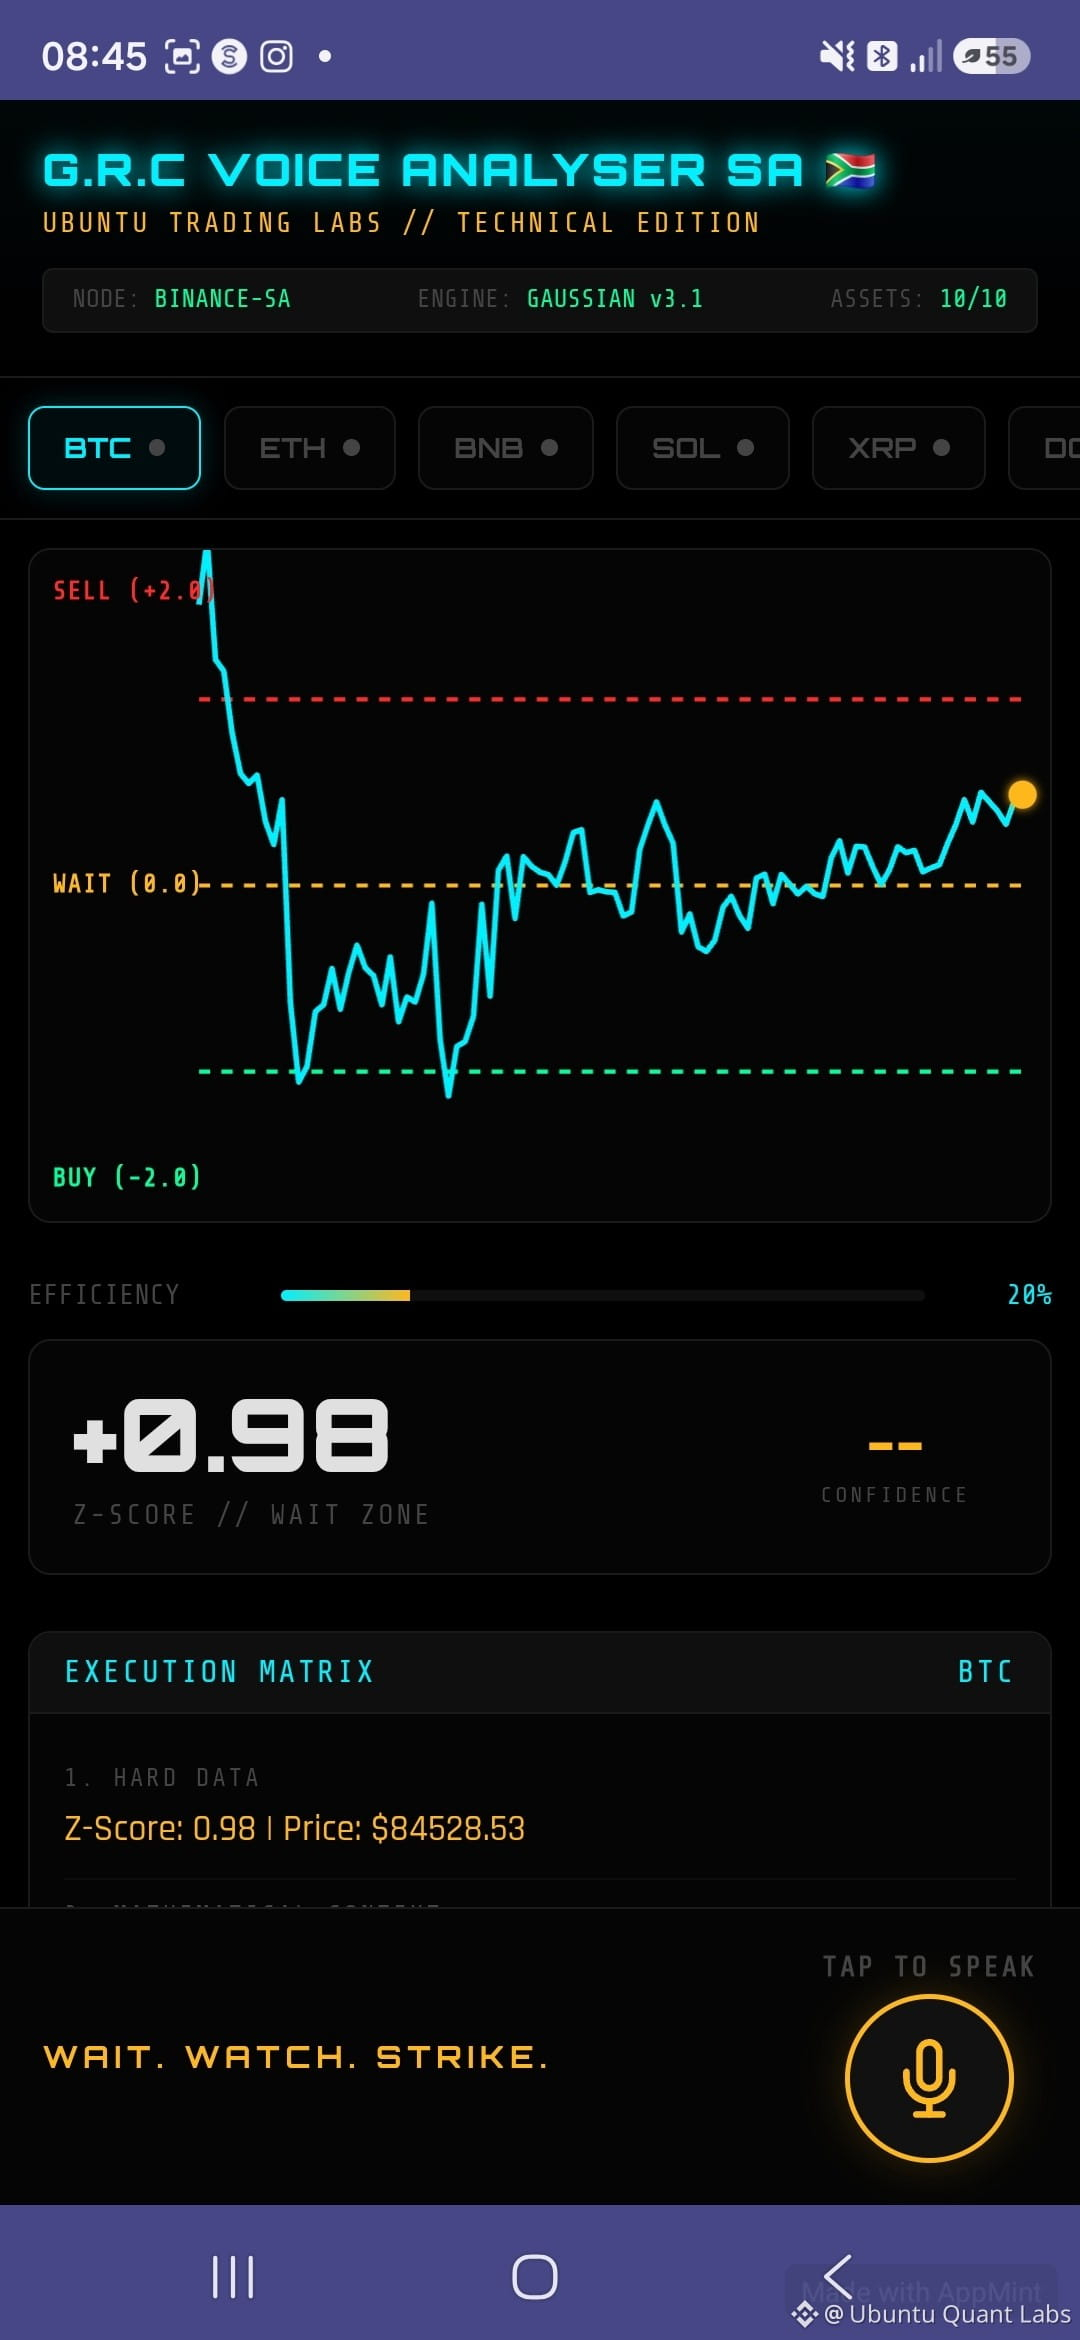
🟠 The General (BTC): Z-Score at +0.98. Bitcoin has already crossed the statistical mean and is leading the upside momentum.
🟡 The Soldier (DOGE): Z-Score at +0.09. Dogecoin is just now crossing the mean, reacting to Bitcoin's strength.
🔵 The Laggard (XRP): Z-Score at -0.49. Still below the mean, waiting for the momentum to pull it up.
The Lesson:
When the leader (BTC) confirms an upward trend, the statistical probability of the laggards (DOGE, XRP) reverting to their own means increases significantly.
We don't guess which coin will pump. We look at the mathematical structure. When the General moves, the Soldiers follow.
Based on this structural alignment, positions have been acquired across all three assets to capture the mean reversion.
Math > Emotion.
#QuantTrading #Bitcoin #CryptoAnalysis #ZScore #DataDriven #BinanceSquare
The Secret Relationship Between Bitcoin and Altcoins.
In quantitative analysis, context is everything. You cannot trade an altcoin in isolation; you must understand its relationship to the market leader.
Today, our Z-Score models highlighted a classic "Lag Effect" across the crypto structure:
🟠 The General (BTC): Z-Score at +0.98. Bitcoin has already crossed the statistical mean and is leading the upside momentum.
🟡 The Soldier (DOGE): Z-Score at +0.09. Dogecoin is just now crossing the mean, reacting to Bitcoin's strength.
🔵 The Laggard (XRP): Z-Score at -0.49. Still below the mean, waiting for the momentum to pull it up.
The Lesson:
When the leader (BTC) confirms an upward trend, the statistical probability of the laggards (DOGE, XRP) reverting to their own means increases significantly.
We don't guess which coin will pump. We look at the mathematical structure. When the General moves, the Soldiers follow.
Based on this structural alignment, positions have been acquired across all three assets to capture the mean reversion.
Math > Emotion.
#QuantTrading #Bitcoin #CryptoAnalysis #ZScore #DataDriven #BinanceSquare
In quantitative analysis, context is everything. You cannot trade an altcoin in isolation; you must understand its relationship to the market leader.
Today, our Z-Score models highlighted a classic "Lag Effect" across the crypto structure:
🟠 The General (BTC): Z-Score at +0.98. Bitcoin has already crossed the statistical mean and is leading the upside momentum.
🟡 The Soldier (DOGE): Z-Score at +0.09. Dogecoin is just now crossing the mean, reacting to Bitcoin's strength.
🔵 The Laggard (XRP): Z-Score at -0.49. Still below the mean, waiting for the momentum to pull it up.
The Lesson:
When the leader (BTC) confirms an upward trend, the statistical probability of the laggards (DOGE, XRP) reverting to their own means increases significantly.
We don't guess which coin will pump. We look at the mathematical structure. When the General moves, the Soldiers follow.
Based on this structural alignment, positions have been acquired across all three assets to capture the mean reversion.
Math > Emotion.
#QuantTrading #Bitcoin #CryptoAnalysis #ZScore #DataDriven #BinanceSquare
162

·
--
Another interesting day for my automated trading bot 🤖📈
After weeks of development, testing, and continuous refinement, the bot has been performing surprisingly well. Over the past weeks, around 95% of its executed trades have ended successfully based on my own trading records.
Today, the algorithm detected opportunities and entered several assets including $HUMA , $IMX, $RENDER, $POLYX, $LINK , $IOTA , $BONK, $KAIA, and $MORPHO.
So far, the market is moving favorably across these positions. 🟢
What interests me most isn't predicting which coin will pump. The goal is to build a systematic strategy that can identify market conditions, manage entries and exits, and make decisions consistently without emotion.
Still experimenting. Still collecting data. Still improving the algorithm.
One good week proves very little — long-term consistency is the real test.
This is my personal trading experiment and trading journal, not financial advice or a trading signal. DYOR.
#TradingBot #AlgorithmicTrading #CryptoTrading #QuantTrading #Binance
Another interesting day for my automated trading bot 🤖📈
After weeks of development, testing, and continuous refinement, the bot has been performing surprisingly well. Over the past weeks, around 95% of its executed trades have ended successfully based on my own trading records.
Today, the algorithm detected opportunities and entered several assets including $HUMA , $IMX, $RENDER, $POLYX, $LINK , $IOTA , $BONK, $KAIA, and $MORPHO.
So far, the market is moving favorably across these positions. 🟢
What interests me most isn't predicting which coin will pump. The goal is to build a systematic strategy that can identify market conditions, manage entries and exits, and make decisions consistently without emotion.
Still experimenting. Still collecting data. Still improving the algorithm.
One good week proves very little — long-term consistency is the real test.
This is my personal trading experiment and trading journal, not financial advice or a trading signal. DYOR.
#TradingBot #AlgorithmicTrading #CryptoTrading #QuantTrading #Binance
After weeks of development, testing, and continuous refinement, the bot has been performing surprisingly well. Over the past weeks, around 95% of its executed trades have ended successfully based on my own trading records.
Today, the algorithm detected opportunities and entered several assets including $HUMA , $IMX, $RENDER, $POLYX, $LINK , $IOTA , $BONK, $KAIA, and $MORPHO.
So far, the market is moving favorably across these positions. 🟢
What interests me most isn't predicting which coin will pump. The goal is to build a systematic strategy that can identify market conditions, manage entries and exits, and make decisions consistently without emotion.
Still experimenting. Still collecting data. Still improving the algorithm.
One good week proves very little — long-term consistency is the real test.
This is my personal trading experiment and trading journal, not financial advice or a trading signal. DYOR.
#TradingBot #AlgorithmicTrading #CryptoTrading #QuantTrading #Binance
1
510

·
--
🔬 ALGO RESEARCH NOTE
📌 Why Most Algorithmic Traders Still Fail — The Drawdown Problem
📄 Why Most Algorithmic Traders Still Fail: The Drawdown Problem
Introduction
Cryptocurrency and algorithmic trading are often seen as solutions to emotional decision-making.
If emotions destroy manual traders, then removing emotions with algorithms should solve the problem.
Many traders using algorithms still lose money — not because their strategies don’t work, but because they fail to handle one unavoidable part of trading:
#CryptoStrategy #QuantTrading #AlgoTrading #Crypto
🔬 ALGO RESEARCH NOTE
📌 Why Most Algorithmic Traders Still Fail — The Drawdown Problem
📄 Why Most Algorithmic Traders Still Fail: The Drawdown Problem
Introduction
Cryptocurrency and algorithmic trading are often seen as solutions to emotional decision-making.
If emotions destroy manual traders, then removing emotions with algorithms should solve the problem.
Many traders using algorithms still lose money — not because their strategies don’t work, but because they fail to handle one unavoidable part of trading:
#CryptoStrategy #QuantTrading #AlgoTrading #Crypto
📌 Why Most Algorithmic Traders Still Fail — The Drawdown Problem
📄 Why Most Algorithmic Traders Still Fail: The Drawdown Problem
Introduction
Cryptocurrency and algorithmic trading are often seen as solutions to emotional decision-making.
If emotions destroy manual traders, then removing emotions with algorithms should solve the problem.
Many traders using algorithms still lose money — not because their strategies don’t work, but because they fail to handle one unavoidable part of trading:
#CryptoStrategy #QuantTrading #AlgoTrading #Crypto
16
·
--
🚀 AUTO-TRADING 101
📌 Balanced Crypto Core Portfolio: AI Crypto Trading Strategy for SOL, AVAX, NEAR, DASH & ENA
The Balanced Crypto Core portfolio by Radiant AI is a systematic crypto trading portfolio designed to combine diversification, adaptive execution, and algorithmic risk management across multiple digital assets.
As part of the broader crypto portfolio ecosystem available through Radiant AI Portfolios
this portfolio is built around a carefully selected basket of SOL (Solana), NEAR Protocol (NEAR), Avalanche (AVAX), DASH (Dash), and Ethena (ENA), aiming to balance momentum opportunities with controlled downside exposure in changing crypto market conditions.
Unlike static crypto investing strategies, Balanced Crypto Core uses AI trading infrastructure and automated portfolio logic to dynamically adapt to volatility, trend shifts, and changing market structure.
🎯 Recently in the rotation: HOME · PUMP · TURBO · SEI · LYN · RIVER · ARC · FIDA.
📊 Edge is not one trade — it is thousands of consistent decisions. That is why we let the bot run it.
AI trading desk in bio.
#QuantTrading #AlgoTrading #RadiantAI #TradingBot #Crypto
🚀 AUTO-TRADING 101
📌 Balanced Crypto Core Portfolio: AI Crypto Trading Strategy for SOL, AVAX, NEAR, DASH & ENA
The Balanced Crypto Core portfolio by Radiant AI is a systematic crypto trading portfolio designed to combine diversification, adaptive execution, and algorithmic risk management across multiple digital assets.
As part of the broader crypto portfolio ecosystem available through Radiant AI Portfolios
this portfolio is built around a carefully selected basket of SOL (Solana), NEAR Protocol (NEAR), Avalanche (AVAX), DASH (Dash), and Ethena (ENA), aiming to balance momentum opportunities with controlled downside exposure in changing crypto market conditions.
Unlike static crypto investing strategies, Balanced Crypto Core uses AI trading infrastructure and automated portfolio logic to dynamically adapt to volatility, trend shifts, and changing market structure.
🎯 Recently in the rotation: HOME · PUMP · TURBO · SEI · LYN · RIVER · ARC · FIDA.
📊 Edge is not one trade — it is thousands of consistent decisions. That is why we let the bot run it.
AI trading desk in bio.
#QuantTrading #AlgoTrading #RadiantAI #TradingBot #Crypto
📌 Balanced Crypto Core Portfolio: AI Crypto Trading Strategy for SOL, AVAX, NEAR, DASH & ENA
The Balanced Crypto Core portfolio by Radiant AI is a systematic crypto trading portfolio designed to combine diversification, adaptive execution, and algorithmic risk management across multiple digital assets.
As part of the broader crypto portfolio ecosystem available through Radiant AI Portfolios
this portfolio is built around a carefully selected basket of SOL (Solana), NEAR Protocol (NEAR), Avalanche (AVAX), DASH (Dash), and Ethena (ENA), aiming to balance momentum opportunities with controlled downside exposure in changing crypto market conditions.
Unlike static crypto investing strategies, Balanced Crypto Core uses AI trading infrastructure and automated portfolio logic to dynamically adapt to volatility, trend shifts, and changing market structure.
🎯 Recently in the rotation: HOME · PUMP · TURBO · SEI · LYN · RIVER · ARC · FIDA.
📊 Edge is not one trade — it is thousands of consistent decisions. That is why we let the bot run it.
AI trading desk in bio.
#QuantTrading #AlgoTrading #RadiantAI #TradingBot #Crypto
103
·
--
🧠 HOW THE BOT THINKS
📌 Radiant Daily Pulse — June 15, 2026
The trading session on June 15, 2026, presented a mixed performance landscape. Our AI system executed a series of trades across several high-profile symbols as it navigated the market's fluctuations. This daily pulse aims to provide a clear, data-driven overview of the recent activity. We focus on objective analysis to understand the underlying dynamics of each trade. Radiant’s commitment is to transparent reporting.
| Metric | Value |
|---|---|
| Closed trades | 41 |
| Win rate | 36.6% |
| Net PnL | −$54.20 |
| ROI on capital | -0.26% |
| New signals dispatched | 150 |
| Asset | Trades | Net PnL | ROI on $700 capital |
|---|---|---|---|
| MRVL | 1 | +$76.00 | +10.86% |
| GRASS | 1 | +$34.50 | +4.93% |
| TSLA | 2 | +$29.20 | +4.17% |
| INTC | 1 | +$20.70 | +2.96% |
| HOOD | 1 | +$18.50 | +2.64% |
Active on the radar today: DASH, RIVER, FHE, PIPPIN, INTC, 1000SHIB, ENA, PENGU, SKYAI, GOOGL, SWARMS, ZRO.
🎯 Recently in the rotation: RKLB · BBX · LLY · AMD · HIMS · RIVN · LITE · SAMSUNG.
🧠 The model does not flinch on red candles. Neither should the system.
AI trading desk in bio.
#QuantTrading #AlgoTrading #RadiantAI #TradingBot #Crypto
🧠 HOW THE BOT THINKS
📌 Radiant Daily Pulse — June 15, 2026
The trading session on June 15, 2026, presented a mixed performance landscape. Our AI system executed a series of trades across several high-profile symbols as it navigated the market's fluctuations. This daily pulse aims to provide a clear, data-driven overview of the recent activity. We focus on objective analysis to understand the underlying dynamics of each trade. Radiant’s commitment is to transparent reporting.
| Metric | Value |
|---|---|
| Closed trades | 41 |
| Win rate | 36.6% |
| Net PnL | −$54.20 |
| ROI on capital | -0.26% |
| New signals dispatched | 150 |
| Asset | Trades | Net PnL | ROI on $700 capital |
|---|---|---|---|
| MRVL | 1 | +$76.00 | +10.86% |
| GRASS | 1 | +$34.50 | +4.93% |
| TSLA | 2 | +$29.20 | +4.17% |
| INTC | 1 | +$20.70 | +2.96% |
| HOOD | 1 | +$18.50 | +2.64% |
Active on the radar today: DASH, RIVER, FHE, PIPPIN, INTC, 1000SHIB, ENA, PENGU, SKYAI, GOOGL, SWARMS, ZRO.
🎯 Recently in the rotation: RKLB · BBX · LLY · AMD · HIMS · RIVN · LITE · SAMSUNG.
🧠 The model does not flinch on red candles. Neither should the system.
AI trading desk in bio.
#QuantTrading #AlgoTrading #RadiantAI #TradingBot #Crypto
📌 Radiant Daily Pulse — June 15, 2026
The trading session on June 15, 2026, presented a mixed performance landscape. Our AI system executed a series of trades across several high-profile symbols as it navigated the market's fluctuations. This daily pulse aims to provide a clear, data-driven overview of the recent activity. We focus on objective analysis to understand the underlying dynamics of each trade. Radiant’s commitment is to transparent reporting.
| Metric | Value |
|---|---|
| Closed trades | 41 |
| Win rate | 36.6% |
| Net PnL | −$54.20 |
| ROI on capital | -0.26% |
| New signals dispatched | 150 |
| Asset | Trades | Net PnL | ROI on $700 capital |
|---|---|---|---|
| MRVL | 1 | +$76.00 | +10.86% |
| GRASS | 1 | +$34.50 | +4.93% |
| TSLA | 2 | +$29.20 | +4.17% |
| INTC | 1 | +$20.70 | +2.96% |
| HOOD | 1 | +$18.50 | +2.64% |
Active on the radar today: DASH, RIVER, FHE, PIPPIN, INTC, 1000SHIB, ENA, PENGU, SKYAI, GOOGL, SWARMS, ZRO.
🎯 Recently in the rotation: RKLB · BBX · LLY · AMD · HIMS · RIVN · LITE · SAMSUNG.
🧠 The model does not flinch on red candles. Neither should the system.
AI trading desk in bio.
#QuantTrading #AlgoTrading #RadiantAI #TradingBot #Crypto
62
·
--
🧠 HOW THE BOT THINKS
📌 DASH-CORE (Stable): Automated Breakouts for DASH/USDT
DASH-CORE (Stable): Automated Breakouts for DASH/USDT Explained
In the dynamic world of cryptocurrency, identifying effective trading strategies that balance potential returns with manageable risk is a perpetual challenge. For those interested in the DASH/USDT trading pair, the DASH-CORE (Stable) algorithm offers an insightful case study into AI-driven autotrading, particularly for individuals seeking a low-risk approach.
DASH-CORE (Stable) is an autotrading algorithm specifically designed to operate on the DASH/USDT pair. Its primary mechanism is a breakout strategy, meaning it aims to identify and capitalize on moments when the price of DASH moves significantly beyond predefined resistance or support levels. By trading in both directions—long and short—the algorithm seeks to profit from upward and downward price trends.
🎯 Recently in the rotation: BBX · POWER · SNDK · BE · SOXL · RIVN · NBIS · BABA.
AI trading desk in bio.
#QuantTrading #AlgoTrading #RadiantAI #TradingBot #Crypto
🧠 HOW THE BOT THINKS
📌 DASH-CORE (Stable): Automated Breakouts for DASH/USDT
DASH-CORE (Stable): Automated Breakouts for DASH/USDT Explained
In the dynamic world of cryptocurrency, identifying effective trading strategies that balance potential returns with manageable risk is a perpetual challenge. For those interested in the DASH/USDT trading pair, the DASH-CORE (Stable) algorithm offers an insightful case study into AI-driven autotrading, particularly for individuals seeking a low-risk approach.
DASH-CORE (Stable) is an autotrading algorithm specifically designed to operate on the DASH/USDT pair. Its primary mechanism is a breakout strategy, meaning it aims to identify and capitalize on moments when the price of DASH moves significantly beyond predefined resistance or support levels. By trading in both directions—long and short—the algorithm seeks to profit from upward and downward price trends.
🎯 Recently in the rotation: BBX · POWER · SNDK · BE · SOXL · RIVN · NBIS · BABA.
AI trading desk in bio.
#QuantTrading #AlgoTrading #RadiantAI #TradingBot #Crypto
📌 DASH-CORE (Stable): Automated Breakouts for DASH/USDT
DASH-CORE (Stable): Automated Breakouts for DASH/USDT Explained
In the dynamic world of cryptocurrency, identifying effective trading strategies that balance potential returns with manageable risk is a perpetual challenge. For those interested in the DASH/USDT trading pair, the DASH-CORE (Stable) algorithm offers an insightful case study into AI-driven autotrading, particularly for individuals seeking a low-risk approach.
DASH-CORE (Stable) is an autotrading algorithm specifically designed to operate on the DASH/USDT pair. Its primary mechanism is a breakout strategy, meaning it aims to identify and capitalize on moments when the price of DASH moves significantly beyond predefined resistance or support levels. By trading in both directions—long and short—the algorithm seeks to profit from upward and downward price trends.
🎯 Recently in the rotation: BBX · POWER · SNDK · BE · SOXL · RIVN · NBIS · BABA.
AI trading desk in bio.
#QuantTrading #AlgoTrading #RadiantAI #TradingBot #Crypto
111
·
--
🧠 HOW THE BOT THINKS
📌 Can You Really Make 1000% with a Crypto Trading Bot?
The short answer is yes — a crypto trading bot can absolutely deliver 1000% returns (or even more).
But the real, more important question is:
Can it do so sustainably, repeatedly, and without blowing up your account?
This article gives you the honest truth based on how professional algorithmic trading actually works in 2026.
Extreme gains in crypto are possible — and they usually happen through a combination of:
• High leverage (10x–50x)
• Aggressive position sizing
• Strong bull market with clear trends
• Luck with narrative timing
🎯 Recently in the rotation: AIO · PIEVERSE · IP · ENA · AIOT · SKYAI · GRIFFAIN · LYN.
AI trading desk in bio.
#QuantTrading #AlgoTrading #RadiantAI #TradingBot #Crypto
🧠 HOW THE BOT THINKS
📌 Can You Really Make 1000% with a Crypto Trading Bot?
The short answer is yes — a crypto trading bot can absolutely deliver 1000% returns (or even more).
But the real, more important question is:
Can it do so sustainably, repeatedly, and without blowing up your account?
This article gives you the honest truth based on how professional algorithmic trading actually works in 2026.
Extreme gains in crypto are possible — and they usually happen through a combination of:
• High leverage (10x–50x)
• Aggressive position sizing
• Strong bull market with clear trends
• Luck with narrative timing
🎯 Recently in the rotation: AIO · PIEVERSE · IP · ENA · AIOT · SKYAI · GRIFFAIN · LYN.
AI trading desk in bio.
#QuantTrading #AlgoTrading #RadiantAI #TradingBot #Crypto
📌 Can You Really Make 1000% with a Crypto Trading Bot?
The short answer is yes — a crypto trading bot can absolutely deliver 1000% returns (or even more).
But the real, more important question is:
Can it do so sustainably, repeatedly, and without blowing up your account?
This article gives you the honest truth based on how professional algorithmic trading actually works in 2026.
Extreme gains in crypto are possible — and they usually happen through a combination of:
• High leverage (10x–50x)
• Aggressive position sizing
• Strong bull market with clear trends
• Luck with narrative timing
🎯 Recently in the rotation: AIO · PIEVERSE · IP · ENA · AIOT · SKYAI · GRIFFAIN · LYN.
AI trading desk in bio.
#QuantTrading #AlgoTrading #RadiantAI #TradingBot #Crypto
487
·
--
📊 STRATEGY DEEP-DIVE
📌 🔥 High-Volatility Crypto Assets: Why Coins Like MYX, ZEREBRO & TRADOOR Create Trading Opportunities
The crypto market constantly introduces new assets, but only a small group shows the level of volatility that creates real trading opportunities.
Coins like MYX, ZEREBRO, GRIFFAIN, LAB, TAC, BSB, and TRADOOR represent a new wave of high-beta assets where price movements are driven by:
• liquidity inflows
• narrative shifts
• speculative momentum
👉 These conditions are ideal for algorithmic breakout and trend-following strategies.
🎯 Recently in the rotation: POWER · PIPPIN · SOL · IP · SWARMS · DASH · FIDA · RIVER.
🧠 The model does not flinch on red candles. Neither should the system.
#CryptoStrategy #QuantTrading #AlgoTrading #Crypto
📊 STRATEGY DEEP-DIVE
📌 🔥 High-Volatility Crypto Assets: Why Coins Like MYX, ZEREBRO & TRADOOR Create Trading Opportunities
The crypto market constantly introduces new assets, but only a small group shows the level of volatility that creates real trading opportunities.
Coins like MYX, ZEREBRO, GRIFFAIN, LAB, TAC, BSB, and TRADOOR represent a new wave of high-beta assets where price movements are driven by:
• liquidity inflows
• narrative shifts
• speculative momentum
👉 These conditions are ideal for algorithmic breakout and trend-following strategies.
🎯 Recently in the rotation: POWER · PIPPIN · SOL · IP · SWARMS · DASH · FIDA · RIVER.
🧠 The model does not flinch on red candles. Neither should the system.
#CryptoStrategy #QuantTrading #AlgoTrading #Crypto
📌 🔥 High-Volatility Crypto Assets: Why Coins Like MYX, ZEREBRO & TRADOOR Create Trading Opportunities
The crypto market constantly introduces new assets, but only a small group shows the level of volatility that creates real trading opportunities.
Coins like MYX, ZEREBRO, GRIFFAIN, LAB, TAC, BSB, and TRADOOR represent a new wave of high-beta assets where price movements are driven by:
• liquidity inflows
• narrative shifts
• speculative momentum
👉 These conditions are ideal for algorithmic breakout and trend-following strategies.
🎯 Recently in the rotation: POWER · PIPPIN · SOL · IP · SWARMS · DASH · FIDA · RIVER.
🧠 The model does not flinch on red candles. Neither should the system.
#CryptoStrategy #QuantTrading #AlgoTrading #Crypto
851
·
--
🧠 HOW THE BOT THINKS
📌 META, GLW Lead 7-Day Gains Amidst Broad Market Signals
Our tokenized stock focus paid off this week, with META notching significant gains. GLW also provided a clear, winning trade signal. These highlight algorithmic precision.
Active on the radar: AIO, NEAR, AIOT, MRVL, PUMP, DUSK, LYN, GUN, SKYAI, FARTCOIN, INTC, SOL.
We observed varied performance across the broader asset mix. While certain signals represented a learning curve, the emphasis remains on the quality of execution for our highest-conviction trades. Continued analysis of market dynamics ensures our algorithms adapt, aiming to amplify positive outcomes in subsequent periods.
🎯 Recently in the rotation: BEAT · META · NEAR · 1000BONK · PUMP · MRVL · RIVER · AIO.
📊 Edge is not one trade — it is thousands of consistent decisions. That is why we let the bot run it.
AI trading desk in bio.
#QuantTrading #AlgoTrading #RadiantAI #TradingBot #Crypto
🧠 HOW THE BOT THINKS
📌 META, GLW Lead 7-Day Gains Amidst Broad Market Signals
Our tokenized stock focus paid off this week, with META notching significant gains. GLW also provided a clear, winning trade signal. These highlight algorithmic precision.
Active on the radar: AIO, NEAR, AIOT, MRVL, PUMP, DUSK, LYN, GUN, SKYAI, FARTCOIN, INTC, SOL.
We observed varied performance across the broader asset mix. While certain signals represented a learning curve, the emphasis remains on the quality of execution for our highest-conviction trades. Continued analysis of market dynamics ensures our algorithms adapt, aiming to amplify positive outcomes in subsequent periods.
🎯 Recently in the rotation: BEAT · META · NEAR · 1000BONK · PUMP · MRVL · RIVER · AIO.
📊 Edge is not one trade — it is thousands of consistent decisions. That is why we let the bot run it.
AI trading desk in bio.
#QuantTrading #AlgoTrading #RadiantAI #TradingBot #Crypto
📌 META, GLW Lead 7-Day Gains Amidst Broad Market Signals
Our tokenized stock focus paid off this week, with META notching significant gains. GLW also provided a clear, winning trade signal. These highlight algorithmic precision.
Active on the radar: AIO, NEAR, AIOT, MRVL, PUMP, DUSK, LYN, GUN, SKYAI, FARTCOIN, INTC, SOL.
We observed varied performance across the broader asset mix. While certain signals represented a learning curve, the emphasis remains on the quality of execution for our highest-conviction trades. Continued analysis of market dynamics ensures our algorithms adapt, aiming to amplify positive outcomes in subsequent periods.
🎯 Recently in the rotation: BEAT · META · NEAR · 1000BONK · PUMP · MRVL · RIVER · AIO.
📊 Edge is not one trade — it is thousands of consistent decisions. That is why we let the bot run it.
AI trading desk in bio.
#QuantTrading #AlgoTrading #RadiantAI #TradingBot #Crypto
69
·
--
🔬 ALGO RESEARCH NOTE
📌 🚀 How to Trade Crypto in 2026 and Actually Make Money
If you think crypto is “dead” or “too hard to trade” — you’re looking at it the wrong way.
• thousands of new coins
• constant new listings
• attention shifts daily
price moves are faster than ever — and they don’t last
📉 Why Most Traders Fail in 2026
• coins pump fast
• momentum fades quickly
• trends collapse before you react
🎯 Recently in the rotation: AMD · SAHARA · GRASS · FARTCOIN · HOME · LYN · ZRO · SEI.
🤖 This is exactly the kind of edge Radiant AI is built around — rules over emotion, process over guesswork.
#CryptoStrategy #QuantTrading #AlgoTrading #Crypto
🔬 ALGO RESEARCH NOTE
📌 🚀 How to Trade Crypto in 2026 and Actually Make Money
If you think crypto is “dead” or “too hard to trade” — you’re looking at it the wrong way.
• thousands of new coins
• constant new listings
• attention shifts daily
price moves are faster than ever — and they don’t last
📉 Why Most Traders Fail in 2026
• coins pump fast
• momentum fades quickly
• trends collapse before you react
🎯 Recently in the rotation: AMD · SAHARA · GRASS · FARTCOIN · HOME · LYN · ZRO · SEI.
🤖 This is exactly the kind of edge Radiant AI is built around — rules over emotion, process over guesswork.
#CryptoStrategy #QuantTrading #AlgoTrading #Crypto
📌 🚀 How to Trade Crypto in 2026 and Actually Make Money
If you think crypto is “dead” or “too hard to trade” — you’re looking at it the wrong way.
• thousands of new coins
• constant new listings
• attention shifts daily
price moves are faster than ever — and they don’t last
📉 Why Most Traders Fail in 2026
• coins pump fast
• momentum fades quickly
• trends collapse before you react
🎯 Recently in the rotation: AMD · SAHARA · GRASS · FARTCOIN · HOME · LYN · ZRO · SEI.
🤖 This is exactly the kind of edge Radiant AI is built around — rules over emotion, process over guesswork.
#CryptoStrategy #QuantTrading #AlgoTrading #Crypto
353
·
--
📊 STRATEGY DEEP-DIVE
📌 Radiant Daily Pulse — June 17, 2026
Welcome to the Radiant Daily Pulse for June 17, 2026. Today, we review the latest trading session's outcomes. Our system executed a series of trades across various assets. This report offers an objective overview of the performance metrics. We aim to provide clarity on the recent market activity and its implications.
| Metric | Value |
|---|---|
| Closed trades | 28 |
| Win rate | 35.7% |
| Net PnL | −$26.40 |
| ROI on capital | -0.15% |
| New signals dispatched | 67 |
| Asset | Trades | Net PnL | ROI on $700 capital |
|---|---|---|---|
| NBIS | 1 | +$52.50 | +7.50% |
| QCOM | 1 | +$47.80 | +6.83% |
| SKYAI | 1 | +$41.80 | +5.97% |
| ASTS | 2 | +$36.50 | +5.21% |
| LITE | 1 | +$36.30 | +5.19% |
Active on the radar today: IP, DOGE, ENA, PUMP, ARC, RIVER, PENGU, SEI, SKYAI, TURBO, MRVL, LITE.
🎯 Recently in the rotation: SKYAI · AIOT · BABY · GRIFFAIN · RIVER · TAC · ENA · PENGU.
🤖 This is exactly the kind of edge Radiant AI is built around — rules over emotion, process over guesswork.
#CryptoStrategy #QuantTrading #AlgoTrading #Crypto
📊 STRATEGY DEEP-DIVE
📌 Radiant Daily Pulse — June 17, 2026
Welcome to the Radiant Daily Pulse for June 17, 2026. Today, we review the latest trading session's outcomes. Our system executed a series of trades across various assets. This report offers an objective overview of the performance metrics. We aim to provide clarity on the recent market activity and its implications.
| Metric | Value |
|---|---|
| Closed trades | 28 |
| Win rate | 35.7% |
| Net PnL | −$26.40 |
| ROI on capital | -0.15% |
| New signals dispatched | 67 |
| Asset | Trades | Net PnL | ROI on $700 capital |
|---|---|---|---|
| NBIS | 1 | +$52.50 | +7.50% |
| QCOM | 1 | +$47.80 | +6.83% |
| SKYAI | 1 | +$41.80 | +5.97% |
| ASTS | 2 | +$36.50 | +5.21% |
| LITE | 1 | +$36.30 | +5.19% |
Active on the radar today: IP, DOGE, ENA, PUMP, ARC, RIVER, PENGU, SEI, SKYAI, TURBO, MRVL, LITE.
🎯 Recently in the rotation: SKYAI · AIOT · BABY · GRIFFAIN · RIVER · TAC · ENA · PENGU.
🤖 This is exactly the kind of edge Radiant AI is built around — rules over emotion, process over guesswork.
#CryptoStrategy #QuantTrading #AlgoTrading #Crypto
📌 Radiant Daily Pulse — June 17, 2026
Welcome to the Radiant Daily Pulse for June 17, 2026. Today, we review the latest trading session's outcomes. Our system executed a series of trades across various assets. This report offers an objective overview of the performance metrics. We aim to provide clarity on the recent market activity and its implications.
| Metric | Value |
|---|---|
| Closed trades | 28 |
| Win rate | 35.7% |
| Net PnL | −$26.40 |
| ROI on capital | -0.15% |
| New signals dispatched | 67 |
| Asset | Trades | Net PnL | ROI on $700 capital |
|---|---|---|---|
| NBIS | 1 | +$52.50 | +7.50% |
| QCOM | 1 | +$47.80 | +6.83% |
| SKYAI | 1 | +$41.80 | +5.97% |
| ASTS | 2 | +$36.50 | +5.21% |
| LITE | 1 | +$36.30 | +5.19% |
Active on the radar today: IP, DOGE, ENA, PUMP, ARC, RIVER, PENGU, SEI, SKYAI, TURBO, MRVL, LITE.
🎯 Recently in the rotation: SKYAI · AIOT · BABY · GRIFFAIN · RIVER · TAC · ENA · PENGU.
🤖 This is exactly the kind of edge Radiant AI is built around — rules over emotion, process over guesswork.
#CryptoStrategy #QuantTrading #AlgoTrading #Crypto
151
·
--
📊 STRATEGY DEEP-DIVE
📌 What Is AI algorithmic trading in Crypto?
What Is Algorithmic Trading in Crypto? A Complete Beginner-to-Advanced Guide
Algorithmic trading in crypto is the automated execution of trades using computer systems and AI models that follow predefined rules and real-time market data.
Instead of relying on manual chart analysis and emotional decisions, traders use algorithmic systems that systematically identify opportunities, manage positions, and control risk across major exchanges.
Algorithmic trading (also known as algo trading) refers to the use of automated programs that execute cryptocurrency trades based on quantitative rules, technical signals, volatility models, and market microstructure data.
🎯 Recently in the rotation: AIO · PIEVERSE · IP · AIOT · SKYAI · ENA · GRIFFAIN · SWARMS.
🧠 The model does not flinch on red candles. Neither should the system.
#CryptoStrategy #QuantTrading #AlgoTrading #Crypto
📊 STRATEGY DEEP-DIVE
📌 What Is AI algorithmic trading in Crypto?
What Is Algorithmic Trading in Crypto? A Complete Beginner-to-Advanced Guide
Algorithmic trading in crypto is the automated execution of trades using computer systems and AI models that follow predefined rules and real-time market data.
Instead of relying on manual chart analysis and emotional decisions, traders use algorithmic systems that systematically identify opportunities, manage positions, and control risk across major exchanges.
Algorithmic trading (also known as algo trading) refers to the use of automated programs that execute cryptocurrency trades based on quantitative rules, technical signals, volatility models, and market microstructure data.
🎯 Recently in the rotation: AIO · PIEVERSE · IP · AIOT · SKYAI · ENA · GRIFFAIN · SWARMS.
🧠 The model does not flinch on red candles. Neither should the system.
#CryptoStrategy #QuantTrading #AlgoTrading #Crypto
📌 What Is AI algorithmic trading in Crypto?
What Is Algorithmic Trading in Crypto? A Complete Beginner-to-Advanced Guide
Algorithmic trading in crypto is the automated execution of trades using computer systems and AI models that follow predefined rules and real-time market data.
Instead of relying on manual chart analysis and emotional decisions, traders use algorithmic systems that systematically identify opportunities, manage positions, and control risk across major exchanges.
Algorithmic trading (also known as algo trading) refers to the use of automated programs that execute cryptocurrency trades based on quantitative rules, technical signals, volatility models, and market microstructure data.
🎯 Recently in the rotation: AIO · PIEVERSE · IP · AIOT · SKYAI · ENA · GRIFFAIN · SWARMS.
🧠 The model does not flinch on red candles. Neither should the system.
#CryptoStrategy #QuantTrading #AlgoTrading #Crypto
750
·
--
📊 STRATEGY DEEP-DIVE
📌 Radiant Oscillator: How Our Market Indicator Reads the Tape in Real Time
The Radiant Oscillator — you''ll also see it called the Radiant Indicator in the app — is our own market signal. It''s not RSI, not MACD, not something we pulled off TradingView. It''s built from one thing: what our fleet of trading bots is doing right now and what it just finished doing over the last 30 days.
Every bot on Radiant opens and closes real positions on Binance and Bybit. We take that raw stream — thousands of longs, shorts, wins and losses per week — and boil it down to a single number between -100 and +100. Positive means our bots are net-long. Negative means net-short. Zero means the market is genuinely undecided.
🎯 Recently in the rotation: DELL · SAMSUNG · SNDK · SEI · RIVN · SKYAI · MSTR · SOXL.
#CryptoStrategy #QuantTrading #AlgoTrading #Crypto
📊 STRATEGY DEEP-DIVE
📌 Radiant Oscillator: How Our Market Indicator Reads the Tape in Real Time
The Radiant Oscillator — you''ll also see it called the Radiant Indicator in the app — is our own market signal. It''s not RSI, not MACD, not something we pulled off TradingView. It''s built from one thing: what our fleet of trading bots is doing right now and what it just finished doing over the last 30 days.
Every bot on Radiant opens and closes real positions on Binance and Bybit. We take that raw stream — thousands of longs, shorts, wins and losses per week — and boil it down to a single number between -100 and +100. Positive means our bots are net-long. Negative means net-short. Zero means the market is genuinely undecided.
🎯 Recently in the rotation: DELL · SAMSUNG · SNDK · SEI · RIVN · SKYAI · MSTR · SOXL.
#CryptoStrategy #QuantTrading #AlgoTrading #Crypto
📌 Radiant Oscillator: How Our Market Indicator Reads the Tape in Real Time
The Radiant Oscillator — you''ll also see it called the Radiant Indicator in the app — is our own market signal. It''s not RSI, not MACD, not something we pulled off TradingView. It''s built from one thing: what our fleet of trading bots is doing right now and what it just finished doing over the last 30 days.
Every bot on Radiant opens and closes real positions on Binance and Bybit. We take that raw stream — thousands of longs, shorts, wins and losses per week — and boil it down to a single number between -100 and +100. Positive means our bots are net-long. Negative means net-short. Zero means the market is genuinely undecided.
🎯 Recently in the rotation: DELL · SAMSUNG · SNDK · SEI · RIVN · SKYAI · MSTR · SOXL.
#CryptoStrategy #QuantTrading #AlgoTrading #Crypto
354
·
--
🧠 HOW THE BOT THINKS
📌 Radiant Daily Pulse — June 3, 2026
Welcome to the Radiant Daily Pulse for June 3, 2026. Yesterday's trading session saw a series of calculated moves across several niche digital assets. Our platform executed trades with precision, reflecting the ongoing efforts to navigate the dynamic cryptocurrency market. This summary provides essential insights into the performance metrics for the period.
| Metric | Value |
|---|---|
| Closed trades | 28 |
| Win rate | 64.3% |
| Net PnL | +$278.70 |
| Avg ROI per trade | +0.96% |
| New signals dispatched | 268 |
| Asset | Trades | Net PnL | Avg ROI |
|---|---|---|---|
| AIO | 1 | +$106.10 | +4.80% |
| USELESS | 1 | +$58.20 | +6.44% |
| 1000PEPE | 1 | +$37.80 | +4.24% |
| 1000BONK | 1 | +$33.50 | +4.87% |
| FARTCOIN | 1 | +$33.30 | +3.39% |
Active on the radar today: 1000PEPE, ZRO, ENA, BEAT, USELESS, SEI, AIO, BLUAI, PUMP, 1000BONK, AIOT, DUSK.
🎯 Recently in the rotation: AMD · SAHARA · GRASS · LITE · HOME · ZRO · SEI · LYN.
AI trading desk in bio.
#QuantTrading #AlgoTrading #RadiantAI #TradingBot #Crypto
🧠 HOW THE BOT THINKS
📌 Radiant Daily Pulse — June 3, 2026
Welcome to the Radiant Daily Pulse for June 3, 2026. Yesterday's trading session saw a series of calculated moves across several niche digital assets. Our platform executed trades with precision, reflecting the ongoing efforts to navigate the dynamic cryptocurrency market. This summary provides essential insights into the performance metrics for the period.
| Metric | Value |
|---|---|
| Closed trades | 28 |
| Win rate | 64.3% |
| Net PnL | +$278.70 |
| Avg ROI per trade | +0.96% |
| New signals dispatched | 268 |
| Asset | Trades | Net PnL | Avg ROI |
|---|---|---|---|
| AIO | 1 | +$106.10 | +4.80% |
| USELESS | 1 | +$58.20 | +6.44% |
| 1000PEPE | 1 | +$37.80 | +4.24% |
| 1000BONK | 1 | +$33.50 | +4.87% |
| FARTCOIN | 1 | +$33.30 | +3.39% |
Active on the radar today: 1000PEPE, ZRO, ENA, BEAT, USELESS, SEI, AIO, BLUAI, PUMP, 1000BONK, AIOT, DUSK.
🎯 Recently in the rotation: AMD · SAHARA · GRASS · LITE · HOME · ZRO · SEI · LYN.
AI trading desk in bio.
#QuantTrading #AlgoTrading #RadiantAI #TradingBot #Crypto
📌 Radiant Daily Pulse — June 3, 2026
Welcome to the Radiant Daily Pulse for June 3, 2026. Yesterday's trading session saw a series of calculated moves across several niche digital assets. Our platform executed trades with precision, reflecting the ongoing efforts to navigate the dynamic cryptocurrency market. This summary provides essential insights into the performance metrics for the period.
| Metric | Value |
|---|---|
| Closed trades | 28 |
| Win rate | 64.3% |
| Net PnL | +$278.70 |
| Avg ROI per trade | +0.96% |
| New signals dispatched | 268 |
| Asset | Trades | Net PnL | Avg ROI |
|---|---|---|---|
| AIO | 1 | +$106.10 | +4.80% |
| USELESS | 1 | +$58.20 | +6.44% |
| 1000PEPE | 1 | +$37.80 | +4.24% |
| 1000BONK | 1 | +$33.50 | +4.87% |
| FARTCOIN | 1 | +$33.30 | +3.39% |
Active on the radar today: 1000PEPE, ZRO, ENA, BEAT, USELESS, SEI, AIO, BLUAI, PUMP, 1000BONK, AIOT, DUSK.
🎯 Recently in the rotation: AMD · SAHARA · GRASS · LITE · HOME · ZRO · SEI · LYN.
AI trading desk in bio.
#QuantTrading #AlgoTrading #RadiantAI #TradingBot #Crypto
7
·
--
📊 STRATEGY DEEP-DIVE
📌 Older Coins Stay Flat While New Narrative Coins Explode in Volatility
Today was another strong example of why some of the best AI trading opportunities right now are not coming from old “safe” crypto names.
While many large established coins moved slowly or barely reacted to market pressure, newer high-volatility assets delivered some of the strongest trading setups of the week.
• TAOUSDT →
• WUSDT →
• BEATUSDT →
• AVAXUSDT →
• SEIUSDT →
• SKYAIUSDT →
• GUNUSDT →
Most of these positions are currently running in strong profit as volatility expands across newer market narratives.
🎯 Recently in the rotation: AIOT · SKYAI · TURBO · TRUTH · BLUAI · TAO · IP · PIPPIN.
🤖 This is exactly the kind of edge Radiant AI is built around — rules over emotion, process over guesswork.
#CryptoStrategy #QuantTrading #AlgoTrading #Crypto
📊 STRATEGY DEEP-DIVE
📌 Older Coins Stay Flat While New Narrative Coins Explode in Volatility
Today was another strong example of why some of the best AI trading opportunities right now are not coming from old “safe” crypto names.
While many large established coins moved slowly or barely reacted to market pressure, newer high-volatility assets delivered some of the strongest trading setups of the week.
• TAOUSDT →
• WUSDT →
• BEATUSDT →
• AVAXUSDT →
• SEIUSDT →
• SKYAIUSDT →
• GUNUSDT →
Most of these positions are currently running in strong profit as volatility expands across newer market narratives.
🎯 Recently in the rotation: AIOT · SKYAI · TURBO · TRUTH · BLUAI · TAO · IP · PIPPIN.
🤖 This is exactly the kind of edge Radiant AI is built around — rules over emotion, process over guesswork.
#CryptoStrategy #QuantTrading #AlgoTrading #Crypto
📌 Older Coins Stay Flat While New Narrative Coins Explode in Volatility
Today was another strong example of why some of the best AI trading opportunities right now are not coming from old “safe” crypto names.
While many large established coins moved slowly or barely reacted to market pressure, newer high-volatility assets delivered some of the strongest trading setups of the week.
• TAOUSDT →
• WUSDT →
• BEATUSDT →
• AVAXUSDT →
• SEIUSDT →
• SKYAIUSDT →
• GUNUSDT →
Most of these positions are currently running in strong profit as volatility expands across newer market narratives.
🎯 Recently in the rotation: AIOT · SKYAI · TURBO · TRUTH · BLUAI · TAO · IP · PIPPIN.
🤖 This is exactly the kind of edge Radiant AI is built around — rules over emotion, process over guesswork.
#CryptoStrategy #QuantTrading #AlgoTrading #Crypto
640
·
--
🧠 HOW THE BOT THINKS
📌 High Beta Momentum: Ride the Meme Coin Wave with Radiant
High Beta Momentum: Unleashing Volatility for Aggressive Growth
If you're seeking to actively engage with the most reactive segment of the crypto market without managing multiple individual speculative strategies, this portfolio offers a streamlined, efficient solution. It simplifies execution and aims to improve performance through structured diversification, providing a discounted and efficient alternative to purchasing numerous highly speculative strategies separately. Explore the potential of High Beta Momentum today.
🎯 Recently in the rotation: AIO · PIPPIN · TURBO · RIVER · PENGU · HOME · IP · FIDA.
Live dashboard linked in bio.
#AITrading #CryptoStrategy #QuantTrading #AlgoTrading #Crypto
🧠 HOW THE BOT THINKS
📌 High Beta Momentum: Ride the Meme Coin Wave with Radiant
High Beta Momentum: Unleashing Volatility for Aggressive Growth
If you're seeking to actively engage with the most reactive segment of the crypto market without managing multiple individual speculative strategies, this portfolio offers a streamlined, efficient solution. It simplifies execution and aims to improve performance through structured diversification, providing a discounted and efficient alternative to purchasing numerous highly speculative strategies separately. Explore the potential of High Beta Momentum today.
🎯 Recently in the rotation: AIO · PIPPIN · TURBO · RIVER · PENGU · HOME · IP · FIDA.
Live dashboard linked in bio.
#AITrading #CryptoStrategy #QuantTrading #AlgoTrading #Crypto
📌 High Beta Momentum: Ride the Meme Coin Wave with Radiant
High Beta Momentum: Unleashing Volatility for Aggressive Growth
If you're seeking to actively engage with the most reactive segment of the crypto market without managing multiple individual speculative strategies, this portfolio offers a streamlined, efficient solution. It simplifies execution and aims to improve performance through structured diversification, providing a discounted and efficient alternative to purchasing numerous highly speculative strategies separately. Explore the potential of High Beta Momentum today.
🎯 Recently in the rotation: AIO · PIPPIN · TURBO · RIVER · PENGU · HOME · IP · FIDA.
Live dashboard linked in bio.
#AITrading #CryptoStrategy #QuantTrading #AlgoTrading #Crypto
290
Көбірек контент көру үшін кіріңіз
Binance Square платформасында әлемдік криптоқоғамдастыққа қосылыңыз
⚡️ Криптовалюта туралы ең соңғы және пайдалы ақпаратты алыңыз.
💬 Әлемдегі ең ірі криптобиржаның сеніміне ие.
👍 Расталған авторлардың нақты пікірлерін табыңыз.
Электрондық пошта/телефон нөмірі
Трендтегі тақырыптар
1
#BinancePick
2.8M рет көрілді
147,427 адам талқылап жатыр
2
#EarningsSeason
5.1M рет көрілді
25,193 адам талқылап жатыр
3
#AnthropicTTMRevenueGrewAbout1200%
1,272 рет көрілді
101 адам талқылап жатыр
4
#AnthropicS1ExpectedToday
3,870 рет көрілді
117 адам талқылап жатыр
5
#SouthKoreaReportedlyWeighsFourthCryptoTaxDelay
12,235 рет көрілді
278 адам талқылап жатыр
6
#FranklinTempletonFilesForTwoDividendToBitcoinETFs
19,486 рет көрілді
402 адам талқылап жатыр
7
#StrategyMSTRSurpassesNasdaqInMarketCap
16,075 рет көрілді
309 адам талқылап жатыр
8
#CanadaProposesStablecoinRedemptionWithin3BusinessDays
717 рет көрілді
31 адам талқылап жатыр
9
#ElectrumWalletBugLetRogueServersStealFunds
19,942 рет көрілді
401 адам талқылап жатыр
10
#ArgentineCourtDismissesLIBRACaseAgainstMilei
31,237 рет көрілді
489 адам талқылап жатыр