
BM Trading
20 投稿

BM Trading
報告
ユーザーをブロック
Crypto & Fx Trader
取引を発注
低高頻度トレーダー
5.1年
1 フォロー
23 フォロワー
40 いいね
投稿
ポートフォリオ
すべて
引用
·
--
ブリッシュ
翻訳参照
🐸 PEPE/USDT (4H Chart) - Potential Reversal Setup 🚀
Hey guys! Here is a detailed technical breakdown of the PEPE/USDT 4-hour chart based on Smart Money Concepts (SMC) and price action. We are looking at a potential major reversal setup ahead.
🔍 Market Structure Analysis (What Happened?)
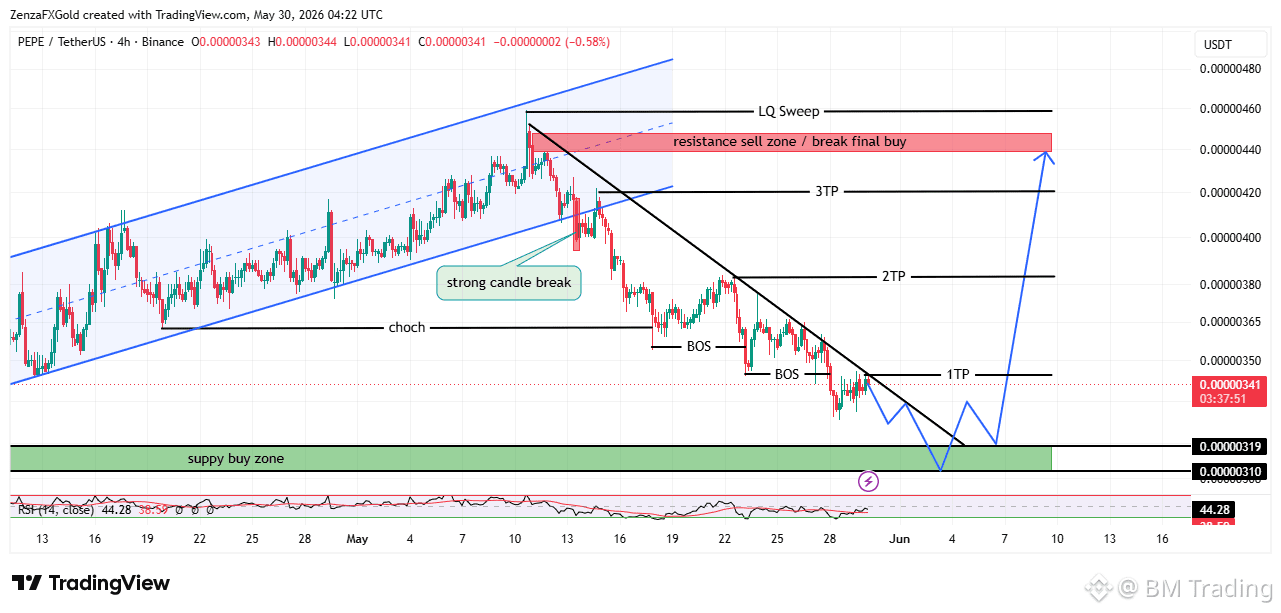
Ascending Channel & LQ Sweep: Price was initially moving inside a strong bullish ascending channel. It then hit a major liquidity sweep (LQ Sweep) at the top, capturing buy-side liquidity.
CHoCH & Strong Candle Break: After the sweep, a aggressive bearish momentum triggered a Change of Character (CHoCH) with a strong candle break below the channel's support line.
Break of Structure (BOS): The bearish trend was confirmed by consecutive Breaks of Structure (BOS) on the way down, establishing a clear short-term downtrend.
📉 Current Situation
Price is currently following a descending trendline (resistance). However, it is steadily approaching a critical demand area.
The Supply/Buy Zone: A major institutional demand zone is sitting between 0.00000310 and 0.00000319. This is where we expect smart money to step in.
🎯 The Game Plan (Bullish Reversal Setup)
We are waiting for the price to mitigate the green Supply/Buy Zone before looking for a long opportunity.
1 Entry Zone: Look for entries inside the 0.00000310 – 0.00000319 area (Watch for a bullish confirmation/reversal pattern on lower timeframes once it hits this zone).
2 Take Profit (TP) Targets:
1st TP: 0.00000350 (Recent minor lower high / trendline break confirmation)
2nd TP: 0.00000380
3rd TP: 0.00000420
Final Target: 0.00000440+ (The Resistance Sell Zone / Break Final Buy area)
⚠️ Note: Always practice proper risk management. Wait for the price to drop into the buy zone and show signs of rejection before jumping in!
What are your thoughts on PEPE? Let me know in the comments! 👇#PEPE #usdt #BTC #NewsAboutCrypto
🐸 PEPE/USDT (4H Chart) - Potential Reversal Setup 🚀
Hey guys! Here is a detailed technical breakdown of the PEPE/USDT 4-hour chart based on Smart Money Concepts (SMC) and price action. We are looking at a potential major reversal setup ahead.
🔍 Market Structure Analysis (What Happened?)
Ascending Channel & LQ Sweep: Price was initially moving inside a strong bullish ascending channel. It then hit a major liquidity sweep (LQ Sweep) at the top, capturing buy-side liquidity.
CHoCH & Strong Candle Break: After the sweep, a aggressive bearish momentum triggered a Change of Character (CHoCH) with a strong candle break below the channel's support line.
Break of Structure (BOS): The bearish trend was confirmed by consecutive Breaks of Structure (BOS) on the way down, establishing a clear short-term downtrend.
📉 Current Situation
Price is currently following a descending trendline (resistance). However, it is steadily approaching a critical demand area.
The Supply/Buy Zone: A major institutional demand zone is sitting between 0.00000310 and 0.00000319. This is where we expect smart money to step in.
🎯 The Game Plan (Bullish Reversal Setup)
We are waiting for the price to mitigate the green Supply/Buy Zone before looking for a long opportunity.
1 Entry Zone: Look for entries inside the 0.00000310 – 0.00000319 area (Watch for a bullish confirmation/reversal pattern on lower timeframes once it hits this zone).
2 Take Profit (TP) Targets:
1st TP: 0.00000350 (Recent minor lower high / trendline break confirmation)
2nd TP: 0.00000380
3rd TP: 0.00000420
Final Target: 0.00000440+ (The Resistance Sell Zone / Break Final Buy area)
⚠️ Note: Always practice proper risk management. Wait for the price to drop into the buy zone and show signs of rejection before jumping in!
What are your thoughts on PEPE? Let me know in the comments! 👇#PEPE #usdt #BTC #NewsAboutCrypto
Hey guys! Here is a detailed technical breakdown of the PEPE/USDT 4-hour chart based on Smart Money Concepts (SMC) and price action. We are looking at a potential major reversal setup ahead.
🔍 Market Structure Analysis (What Happened?)
Ascending Channel & LQ Sweep: Price was initially moving inside a strong bullish ascending channel. It then hit a major liquidity sweep (LQ Sweep) at the top, capturing buy-side liquidity.
CHoCH & Strong Candle Break: After the sweep, a aggressive bearish momentum triggered a Change of Character (CHoCH) with a strong candle break below the channel's support line.
Break of Structure (BOS): The bearish trend was confirmed by consecutive Breaks of Structure (BOS) on the way down, establishing a clear short-term downtrend.
📉 Current Situation
Price is currently following a descending trendline (resistance). However, it is steadily approaching a critical demand area.
The Supply/Buy Zone: A major institutional demand zone is sitting between 0.00000310 and 0.00000319. This is where we expect smart money to step in.
🎯 The Game Plan (Bullish Reversal Setup)
We are waiting for the price to mitigate the green Supply/Buy Zone before looking for a long opportunity.
1 Entry Zone: Look for entries inside the 0.00000310 – 0.00000319 area (Watch for a bullish confirmation/reversal pattern on lower timeframes once it hits this zone).
2 Take Profit (TP) Targets:
1st TP: 0.00000350 (Recent minor lower high / trendline break confirmation)
2nd TP: 0.00000380
3rd TP: 0.00000420
Final Target: 0.00000440+ (The Resistance Sell Zone / Break Final Buy area)
⚠️ Note: Always practice proper risk management. Wait for the price to drop into the buy zone and show signs of rejection before jumping in!
What are your thoughts on PEPE? Let me know in the comments! 👇#PEPE #usdt #BTC #NewsAboutCrypto
1
115
·
--
ブリッシュ
翻訳参照
🚀 SOL/USDT Technical Analysis: Navigating the Consolidation Phase
Solana ($SOL) is currently exhibiting a strategic consolidation pattern, signaling a potential buildup for its next major move. After experiencing volatility earlier in the year, the price action is now stabilizing within a defined range.
📊 Key Technical Indicators:
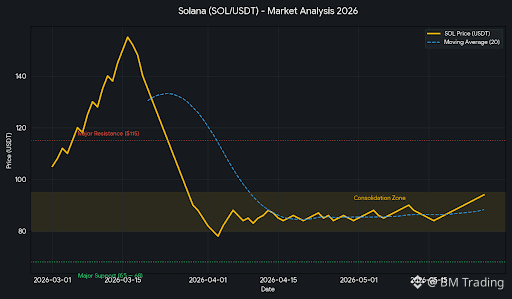
Current Trend: $SOL is currently trading within a Consolidation Zone between $80 and $95. This sideways movement suggests that the market is absorbing previous sell-offs and preparing for a breakout.
Moving Averages: The 20-day Moving Average is beginning to flatten, indicating a temporary equilibrium between buyers and sellers.
Support Level: A rock-solid Major Support exists between $65 - $68. This zone has historically acted as a strong demand area where buyers step in aggressively.
Resistance Level: The immediate hurdle for a bullish reversal is the $115 Major Resistance. A clean daily close above this level with high volume is required to confirm a trend shift.
💡 Trading Strategy:
Bullish Case: If $SOL breaks and holds above $115, we could see a rapid move toward the $140 - $160 targets.
Bearish Case: A breakdown below the $80 mark might lead to a "re-test" of the $65 support level before the next leg up.
Conclusion: This is an ideal time for "accumulation" for long-term holders, while swing traders should wait for a confirmed breakout above resistance.
Disclaimer: This analysis is for educational purposes only and does not constitute financial advice. Always perform your own research (DYOR) before trading.
Hashtags: #SOL #Solana #CryptoAnalysis #BinanceSquare #Altcoins #TradingSignals
🚀 SOL/USDT Technical Analysis: Navigating the Consolidation Phase
Solana ($SOL) is currently exhibiting a strategic consolidation pattern, signaling a potential buildup for its next major move. After experiencing volatility earlier in the year, the price action is now stabilizing within a defined range.
📊 Key Technical Indicators:
Current Trend: $SOL is currently trading within a Consolidation Zone between $80 and $95. This sideways movement suggests that the market is absorbing previous sell-offs and preparing for a breakout.
Moving Averages: The 20-day Moving Average is beginning to flatten, indicating a temporary equilibrium between buyers and sellers.
Support Level: A rock-solid Major Support exists between $65 - $68. This zone has historically acted as a strong demand area where buyers step in aggressively.
Resistance Level: The immediate hurdle for a bullish reversal is the $115 Major Resistance. A clean daily close above this level with high volume is required to confirm a trend shift.
💡 Trading Strategy:
Bullish Case: If $SOL breaks and holds above $115, we could see a rapid move toward the $140 - $160 targets.
Bearish Case: A breakdown below the $80 mark might lead to a "re-test" of the $65 support level before the next leg up.
Conclusion: This is an ideal time for "accumulation" for long-term holders, while swing traders should wait for a confirmed breakout above resistance.
Disclaimer: This analysis is for educational purposes only and does not constitute financial advice. Always perform your own research (DYOR) before trading.
Hashtags: #SOL #Solana #CryptoAnalysis #BinanceSquare #Altcoins #TradingSignals
Solana ($SOL) is currently exhibiting a strategic consolidation pattern, signaling a potential buildup for its next major move. After experiencing volatility earlier in the year, the price action is now stabilizing within a defined range.
📊 Key Technical Indicators:
Current Trend: $SOL is currently trading within a Consolidation Zone between $80 and $95. This sideways movement suggests that the market is absorbing previous sell-offs and preparing for a breakout.
Moving Averages: The 20-day Moving Average is beginning to flatten, indicating a temporary equilibrium between buyers and sellers.
Support Level: A rock-solid Major Support exists between $65 - $68. This zone has historically acted as a strong demand area where buyers step in aggressively.
Resistance Level: The immediate hurdle for a bullish reversal is the $115 Major Resistance. A clean daily close above this level with high volume is required to confirm a trend shift.
💡 Trading Strategy:
Bullish Case: If $SOL breaks and holds above $115, we could see a rapid move toward the $140 - $160 targets.
Bearish Case: A breakdown below the $80 mark might lead to a "re-test" of the $65 support level before the next leg up.
Conclusion: This is an ideal time for "accumulation" for long-term holders, while swing traders should wait for a confirmed breakout above resistance.
Disclaimer: This analysis is for educational purposes only and does not constitute financial advice. Always perform your own research (DYOR) before trading.
Hashtags: #SOL #Solana #CryptoAnalysis #BinanceSquare #Altcoins #TradingSignals
1
110
·
--

記事
こんにちは、皆さん!バイナンスのプレゼント 🏆️🏆️🇬🇧こんにちは、皆さん 🏆️
[https://app.binance.com/uni-qr/Lqp3F7Ud?utm_medium=web_share_copy](https://app.binance.com/uni-qr/Lqp3F7Ud?utm_medium=web_share_copy)
このリンクにアクセスして、10000USDCを受け取ってください。
同時に、無料のプレゼントをお送りします。皆さん、あなたのバイナンスID / メール / 電話番号を入力してください。
こんにちは、皆さん!バイナンスのプレゼント 🏆️🏆️🇬🇧
こんにちは、皆さん 🏆️
https://app.binance.com/uni-qr/Lqp3F7Ud?utm_medium=web_share_copy
このリンクにアクセスして、10000USDCを受け取ってください。
同時に、無料のプレゼントをお送りします。皆さん、あなたのバイナンスID / メール / 電話番号を入力してください。
https://app.binance.com/uni-qr/Lqp3F7Ud?utm_medium=web_share_copy
このリンクにアクセスして、10000USDCを受け取ってください。
同時に、無料のプレゼントをお送りします。皆さん、あなたのバイナンスID / メール / 電話番号を入力してください。
15

·
--
記事
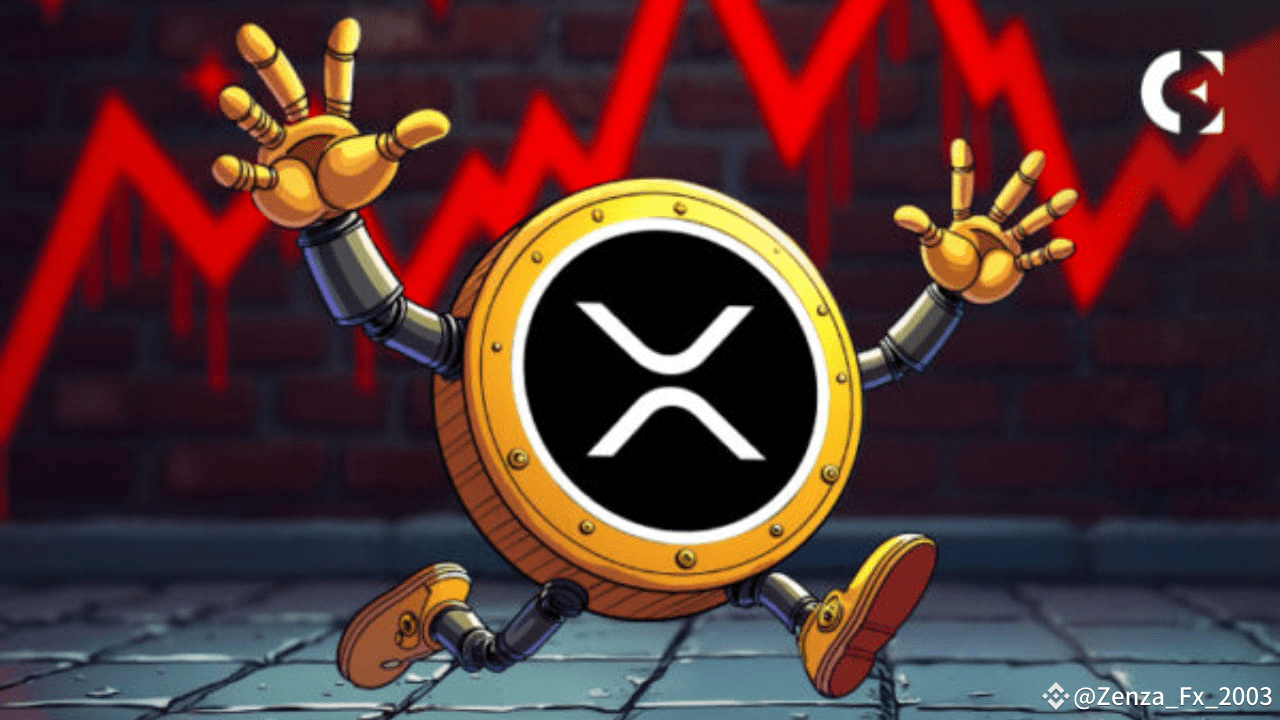
SECの控訴の憶測と戦略的準備の話し合いの中でXRPが急騰2025年3月6日 – XRPに関する最新情報
XRPは、Rippleとの進行中の法的闘争における米国証券取引委員会(SEC)の次の動きに関する憶測が高まる中、今日の見出しを飾っています。これは、ホワイトハウスがXRPを米国の暗号戦略準備資産の一部として検討しているという報告とともに発表されており、これは暗号通貨の将来に大きな影響を与える可能性があります。
SECの控訴:取り下げられるのか?
SECは、3月6日にRippleに対する控訴についての非公開会議を開く予定です。これは、XRPのプログラム的販売は証券提供には該当しないと裁判所が判断したRippleの以前の法的勝利に続くものです。SECが控訴を取り下げることを決定すれば、規制の不確実性が解消され、XRPの大幅なラリーが引き起こされる可能性があります。一方、控訴が進む場合、XRPはボラティリティが増す可能性があります(FXEmpire)。
SECの控訴の憶測と戦略的準備の話し合いの中でXRPが急騰
2025年3月6日 – XRPに関する最新情報
XRPは、Rippleとの進行中の法的闘争における米国証券取引委員会(SEC)の次の動きに関する憶測が高まる中、今日の見出しを飾っています。これは、ホワイトハウスがXRPを米国の暗号戦略準備資産の一部として検討しているという報告とともに発表されており、これは暗号通貨の将来に大きな影響を与える可能性があります。
SECの控訴:取り下げられるのか?
SECは、3月6日にRippleに対する控訴についての非公開会議を開く予定です。これは、XRPのプログラム的販売は証券提供には該当しないと裁判所が判断したRippleの以前の法的勝利に続くものです。SECが控訴を取り下げることを決定すれば、規制の不確実性が解消され、XRPの大幅なラリーが引き起こされる可能性があります。一方、控訴が進む場合、XRPはボラティリティが増す可能性があります(FXEmpire)。
XRPは、Rippleとの進行中の法的闘争における米国証券取引委員会(SEC)の次の動きに関する憶測が高まる中、今日の見出しを飾っています。これは、ホワイトハウスがXRPを米国の暗号戦略準備資産の一部として検討しているという報告とともに発表されており、これは暗号通貨の将来に大きな影響を与える可能性があります。
SECの控訴:取り下げられるのか?
SECは、3月6日にRippleに対する控訴についての非公開会議を開く予定です。これは、XRPのプログラム的販売は証券提供には該当しないと裁判所が判断したRippleの以前の法的勝利に続くものです。SECが控訴を取り下げることを決定すれば、規制の不確実性が解消され、XRPの大幅なラリーが引き起こされる可能性があります。一方、控訴が進む場合、XRPはボラティリティが増す可能性があります(FXEmpire)。
1
1
8
6.7k
·
--

記事
米国が65億ドルのBTC保有を売却する動きによりビットコインは圧力に直面ビットコイン市場は、米政府が65億ドル相当のビットコインを売却することが許可されたとのニュースが報じられたため、緊張状態にあります。この売却は押収された暗号資産に関連しており、市場に大規模な流入があるため、価格の下落を懸念させています。BTCは一時的に下落しましたが、投資家が状況を評価する中で回復力を示しています。アナリストは、今後数日間にビットコインの価格動向に影響を与える可能性のあるさらなる展開を注意深く見守っています。
米国が65億ドルのBTC保有を売却する動きによりビットコインは圧力に直面
ビットコイン市場は、米政府が65億ドル相当のビットコインを売却することが許可されたとのニュースが報じられたため、緊張状態にあります。この売却は押収された暗号資産に関連しており、市場に大規模な流入があるため、価格の下落を懸念させています。BTCは一時的に下落しましたが、投資家が状況を評価する中で回復力を示しています。アナリストは、今後数日間にビットコインの価格動向に影響を与える可能性のあるさらなる展開を注意深く見守っています。
1
209
·
--
記事
今日のPEPE価格アラートPepe (PEPE) 価格予測: 今日のPEPEはどこに向かっていますか?
2025年3月5日
Pepe (PEPE)は現在$0.0000065で取引されており、過去24時間で4.46%のわずかな増加を示しています。このミームコインは投機的な関心の波に乗り続けていますが、アナリストは短期的に上昇の勢いと潜在的な修正の両方を予測しています。
市場の概要
24時間高値: $0.0000066
24時間安値: $0.0000063
7日間高値: $0.0000070
7日間安値: $0.0000061
史上最高値: $0.0000098
テクニカル分析
PEPEはサポートとレジスタンスの範囲内で安定を保っており、短期的なボラティリティが予想されます。PEPEが現在の強気の勢いを維持できれば、$0.0000072のレジスタンスレベルを試す可能性があります。しかし、利益を維持できない場合、$0.0000061のサポートに向かう可能性があります。
今日のPEPE価格アラート
Pepe (PEPE) 価格予測: 今日のPEPEはどこに向かっていますか?
2025年3月5日
Pepe (PEPE)は現在$0.0000065で取引されており、過去24時間で4.46%のわずかな増加を示しています。このミームコインは投機的な関心の波に乗り続けていますが、アナリストは短期的に上昇の勢いと潜在的な修正の両方を予測しています。
市場の概要
24時間高値: $0.0000066
24時間安値: $0.0000063
7日間高値: $0.0000070
7日間安値: $0.0000061
史上最高値: $0.0000098
テクニカル分析
PEPEはサポートとレジスタンスの範囲内で安定を保っており、短期的なボラティリティが予想されます。PEPEが現在の強気の勢いを維持できれば、$0.0000072のレジスタンスレベルを試す可能性があります。しかし、利益を維持できない場合、$0.0000061のサポートに向かう可能性があります。
2025年3月5日
Pepe (PEPE)は現在$0.0000065で取引されており、過去24時間で4.46%のわずかな増加を示しています。このミームコインは投機的な関心の波に乗り続けていますが、アナリストは短期的に上昇の勢いと潜在的な修正の両方を予測しています。
市場の概要
24時間高値: $0.0000066
24時間安値: $0.0000063
7日間高値: $0.0000070
7日間安値: $0.0000061
史上最高値: $0.0000098
テクニカル分析
PEPEはサポートとレジスタンスの範囲内で安定を保っており、短期的なボラティリティが予想されます。PEPEが現在の強気の勢いを維持できれば、$0.0000072のレジスタンスレベルを試す可能性があります。しかし、利益を維持できない場合、$0.0000061のサポートに向かう可能性があります。
1
1
3
3k
·
--

記事
今日のビットコイン価格アラートビットコイン価格予測:今日のBTCはどこに向かっているか?
2025年3月5日
本日、ビットコイン(BTC)は$90,338.65で取引されており、最近の市場修正を受けて強い強気トレンドを経験しています。総時価総額は$1.79兆で、ビットコインは暗号通貨市場を支配し続けています。
市場の概要
24時間の高値:$88,107
24時間の安値:$82,670
7日間の高値:$90,880
7日間の安値:$82,038
過去最高値:$109,021
テクニカル分析
ビットコインは最近、強気の包み足パターンを形成し、上昇トレンドの可能性を示しています。このパターンは強い買い手の勢いを示し、BTCが今後数日内に$109,021の過去最高値に挑戦する可能性があることを示唆しています。しかし、アナリストは決定的なブレイクアウトの前に短期的な価格変動があると予測しています。
今日のビットコイン価格アラート
ビットコイン価格予測:今日のBTCはどこに向かっているか?
2025年3月5日
本日、ビットコイン(BTC)は$90,338.65で取引されており、最近の市場修正を受けて強い強気トレンドを経験しています。総時価総額は$1.79兆で、ビットコインは暗号通貨市場を支配し続けています。
市場の概要
24時間の高値:$88,107
24時間の安値:$82,670
7日間の高値:$90,880
7日間の安値:$82,038
過去最高値:$109,021
テクニカル分析
ビットコインは最近、強気の包み足パターンを形成し、上昇トレンドの可能性を示しています。このパターンは強い買い手の勢いを示し、BTCが今後数日内に$109,021の過去最高値に挑戦する可能性があることを示唆しています。しかし、アナリストは決定的なブレイクアウトの前に短期的な価格変動があると予測しています。
2025年3月5日
本日、ビットコイン(BTC)は$90,338.65で取引されており、最近の市場修正を受けて強い強気トレンドを経験しています。総時価総額は$1.79兆で、ビットコインは暗号通貨市場を支配し続けています。
市場の概要
24時間の高値:$88,107
24時間の安値:$82,670
7日間の高値:$90,880
7日間の安値:$82,038
過去最高値:$109,021
テクニカル分析
ビットコインは最近、強気の包み足パターンを形成し、上昇トレンドの可能性を示しています。このパターンは強い買い手の勢いを示し、BTCが今後数日内に$109,021の過去最高値に挑戦する可能性があることを示唆しています。しかし、アナリストは決定的なブレイクアウトの前に短期的な価格変動があると予測しています。
2
412
·
--

記事
今日のPEPEコインのアップデート 🇬🇧2025年3月4日現在、Pepe Coin(PEPE)市場はわずかな下落トレンドを経験しています。
最近の分析では、2025年のPEPEのパフォーマンスに関して混合の予測が示されています。CoinGapeによると、2025年3月1日現在、PEPEは$0.00000761で取引されており、市場価値は32億ドルです。週次のテクニカルチャートは強気の包み足パターンを示しており、買い手に有利な強い勢いを示唆しています。しかし、このパターンにもかかわらず、価格は過去24時間で約3.88%減少しています。
今日のPEPEコインのアップデート 🇬🇧
2025年3月4日現在、Pepe Coin(PEPE)市場はわずかな下落トレンドを経験しています。
最近の分析では、2025年のPEPEのパフォーマンスに関して混合の予測が示されています。CoinGapeによると、2025年3月1日現在、PEPEは$0.00000761で取引されており、市場価値は32億ドルです。週次のテクニカルチャートは強気の包み足パターンを示しており、買い手に有利な強い勢いを示唆しています。しかし、このパターンにもかかわらず、価格は過去24時間で約3.88%減少しています。
最近の分析では、2025年のPEPEのパフォーマンスに関して混合の予測が示されています。CoinGapeによると、2025年3月1日現在、PEPEは$0.00000761で取引されており、市場価値は32億ドルです。週次のテクニカルチャートは強気の包み足パターンを示しており、買い手に有利な強い勢いを示唆しています。しかし、このパターンにもかかわらず、価格は過去24時間で約3.88%減少しています。
1
187
·
--
ブリッシュ
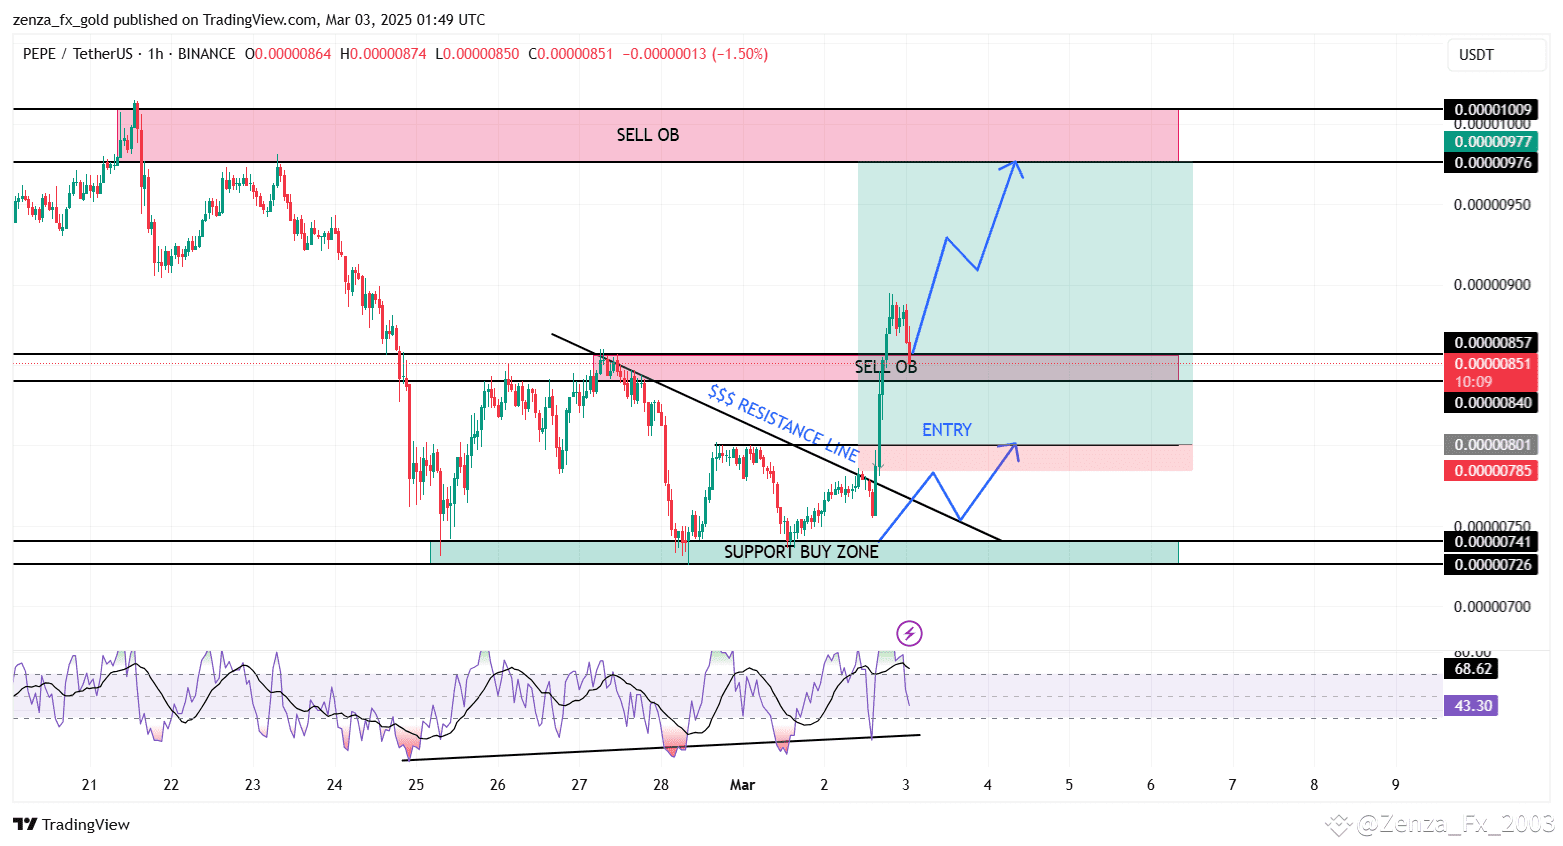
WOW 😍😍 PEPE 1 TP ステップ完了
私たちの最初のTPは達成されました。再び、私たちの2番目のTPは売却ゾーンであり、0.00000976です。これまでのところ、ペペトレーダーたちは良い利益を上げています。しかし、皆さん注意してください。私は段階的に更新を行います。
{spot}(PEPEUSDT)
WOW 😍😍 PEPE 1 TP ステップ完了
私たちの最初のTPは達成されました。再び、私たちの2番目のTPは売却ゾーンであり、0.00000976です。これまでのところ、ペペトレーダーたちは良い利益を上げています。しかし、皆さん注意してください。私は段階的に更新を行います。
私たちの最初のTPは達成されました。再び、私たちの2番目のTPは売却ゾーンであり、0.00000976です。これまでのところ、ペペトレーダーたちは良い利益を上げています。しかし、皆さん注意してください。私は段階的に更新を行います。
1
5
7.7k
·
--
ブリッシュ
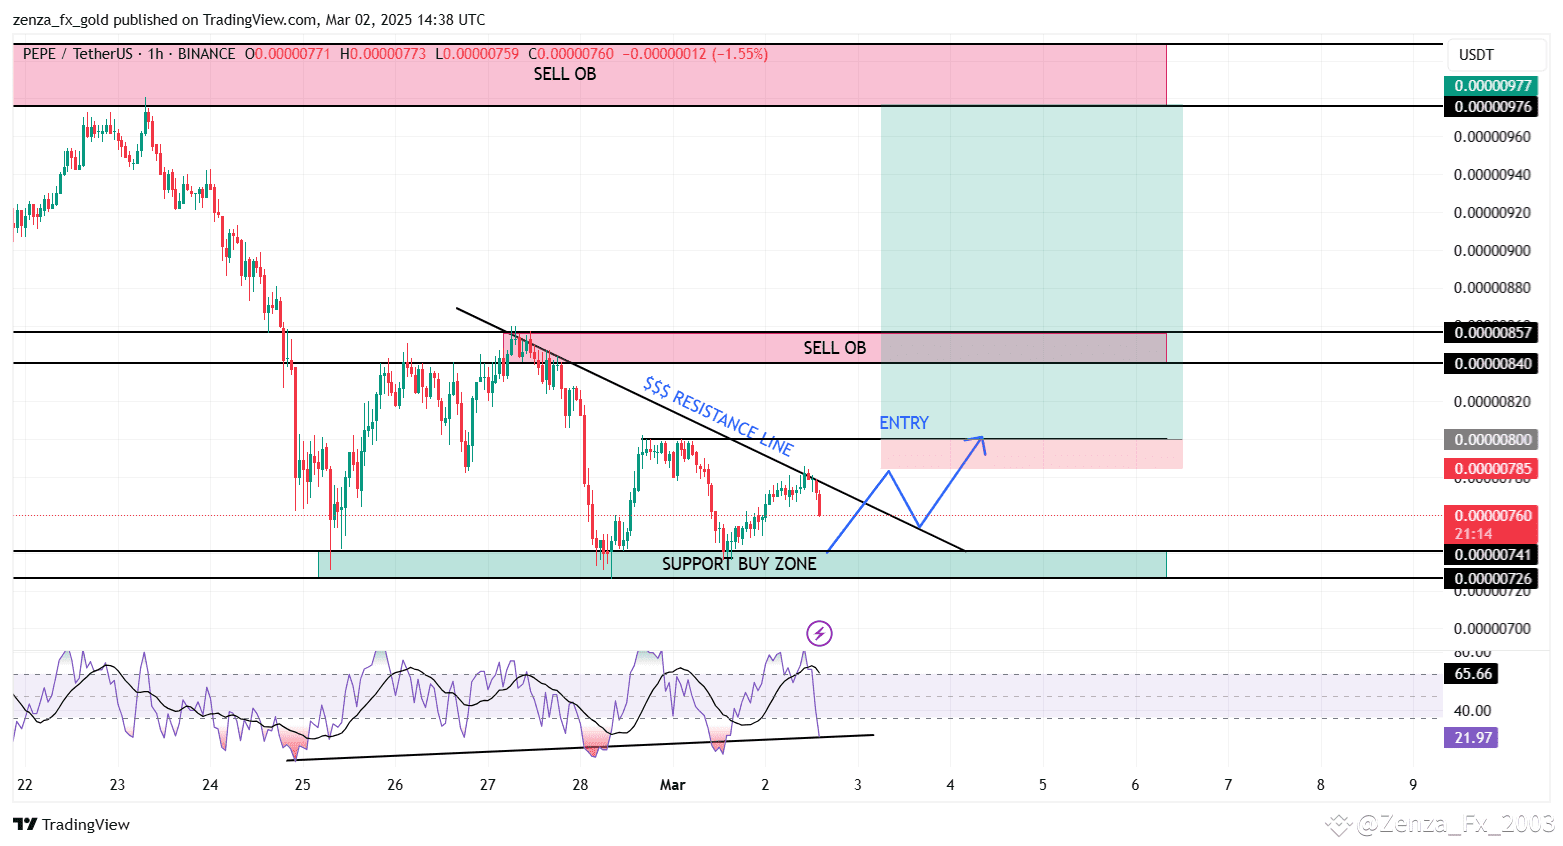
PEPE ドロップ 0.00000741 / 良好な確認 0.00000800 エントリーポイント。
次のターゲット 0.00000978 $
{spot}(PEPEUSDT)
PEPE ドロップ 0.00000741 / 良好な確認 0.00000800 エントリーポイント。
次のターゲット 0.00000978 $
次のターゲット 0.00000978 $
7
4.6k
·
--
ブリッシュ
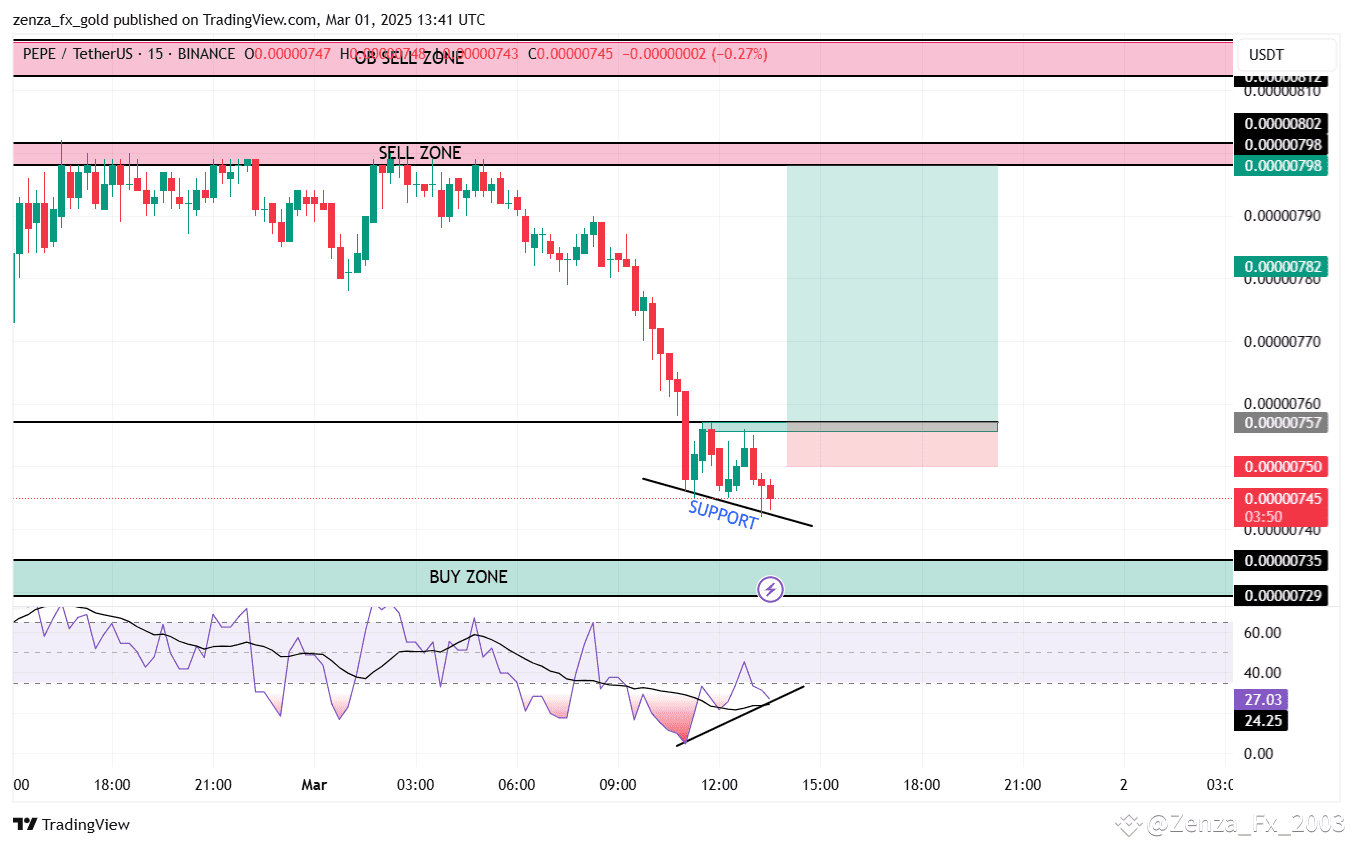
PEPEの確認されたエントリー。将来のトレーダーは辛抱強く待つべきです。強い買いトレードの可能性があります。0.00000757の間
{spot}(PEPEUSDT)
PEPEの確認されたエントリー。将来のトレーダーは辛抱強く待つべきです。強い買いトレードの可能性があります。0.00000757の間
2
969
·
--
ブリッシュ
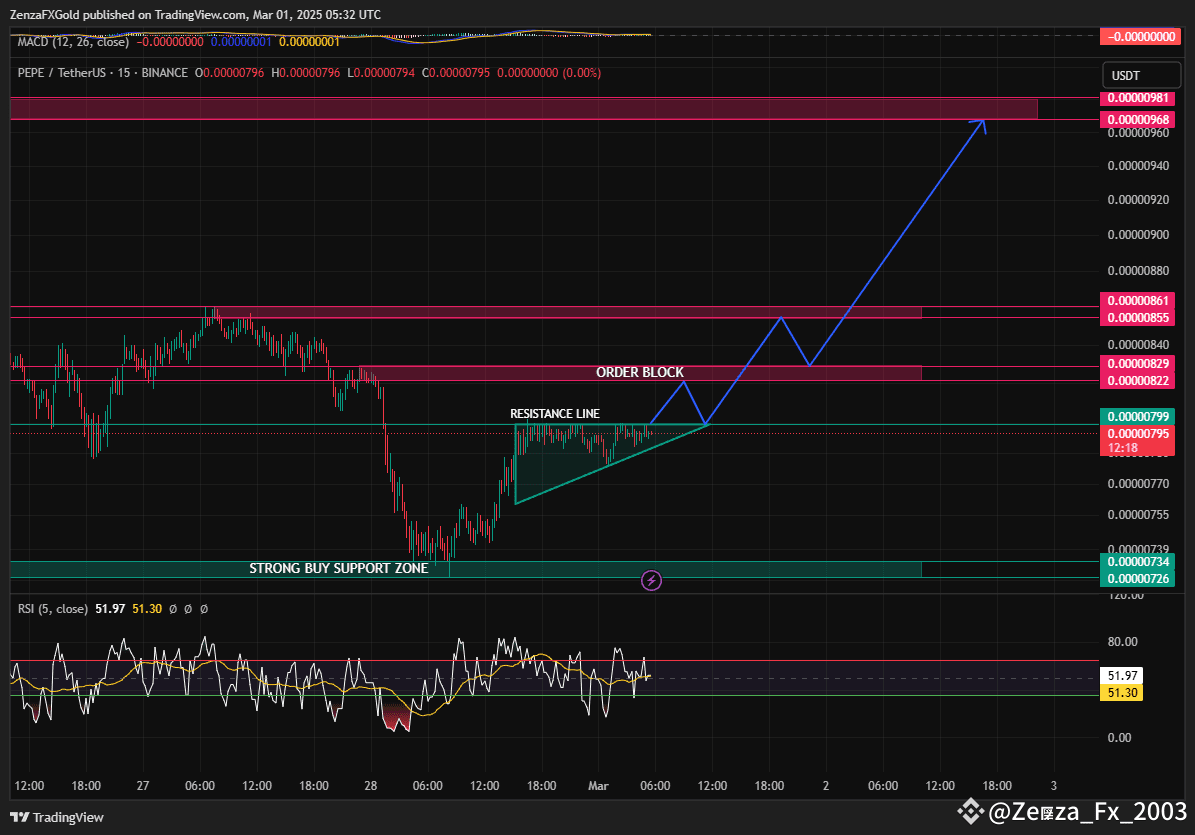
私たちの分析によると、pepeは0.00000797から0.00000968まで飛ぶ傾向があります。おそらく、pepe市場がその売却ゾーンに飛ぶと、pepe市場がこの強力な買いサポートゾーンに戻らない大きな傾向があります。pepeコインを保持することで良い利益を得ることができます。$
{spot}(PEPEUSDT)
私たちの分析によると、pepeは0.00000797から0.00000968まで飛ぶ傾向があります。おそらく、pepe市場がその売却ゾーンに飛ぶと、pepe市場がこの強力な買いサポートゾーンに戻らない大きな傾向があります。pepeコインを保持することで良い利益を得ることができます。$
2
627
·
--
弱気相場
PEPE 今すぐ売る 🧨 エントリー価格 0.0000929 / 0.0000930
🎯 1TP 0.0000914
🎯 2TP 0.0000906
🎯 3TP 0.0000895
🧨 SL 0.0000934
{spot}(PEPEUSDT)
PEPE 今すぐ売る 🧨 エントリー価格 0.0000929 / 0.0000930
🎯 1TP 0.0000914
🎯 2TP 0.0000906
🎯 3TP 0.0000895
🧨 SL 0.0000934
🎯 1TP 0.0000914
🎯 2TP 0.0000906
🎯 3TP 0.0000895
🧨 SL 0.0000934
1
426
·
--
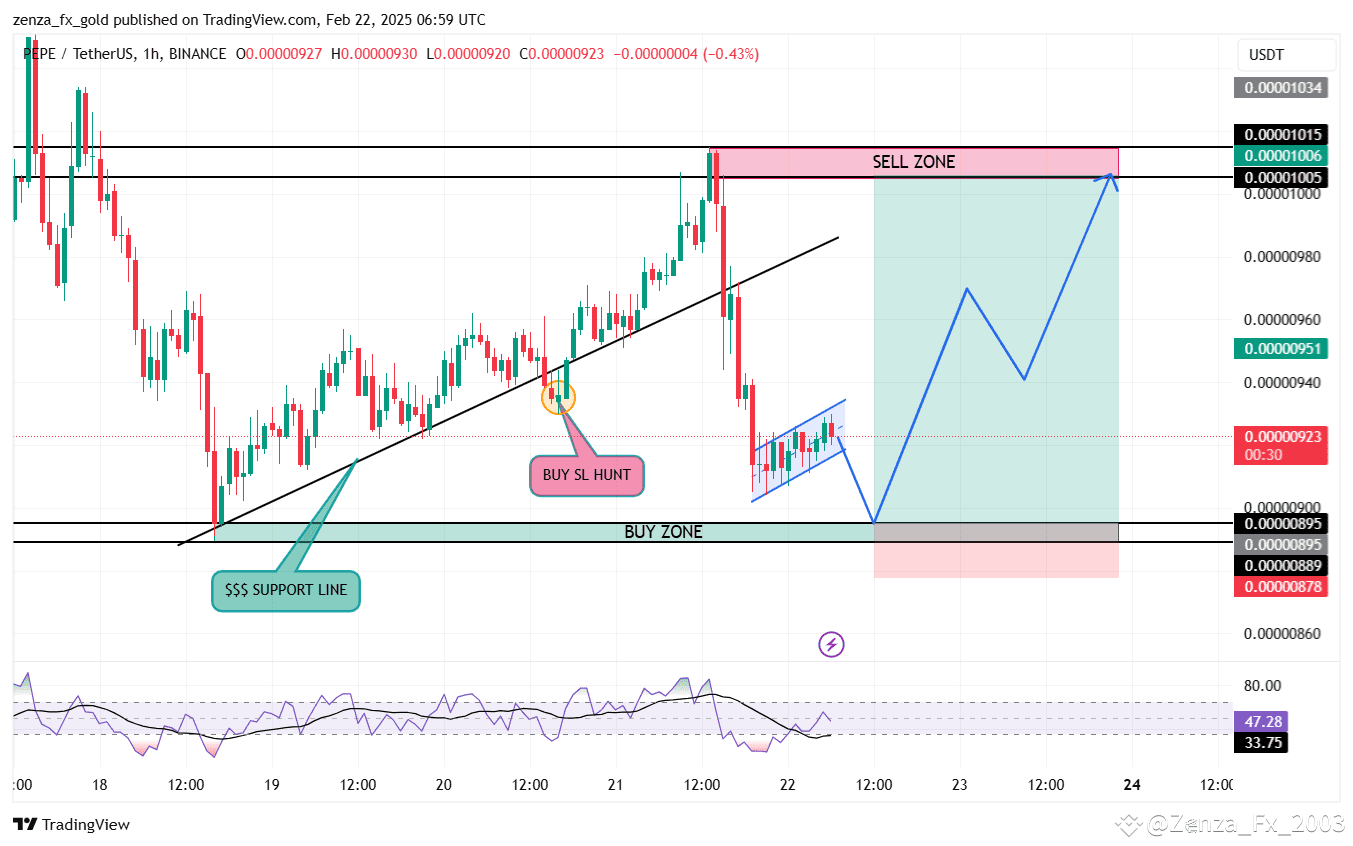
私の分析によると、PEPE市場は0.0000895または0.0000889の価格帯に下落した後、0.0001005の売りゾーンに戻る強い傾向があります。その売りゾーンが破られた場合、再度分析を行ってお話しします。しかし、皆さん、慎重に取引してください。私は良いエントリーポイントを探し、シグナルをお伝えします。頑張ってください
{spot}(PEPEUSDT)
私の分析によると、PEPE市場は0.0000895または0.0000889の価格帯に下落した後、0.0001005の売りゾーンに戻る強い傾向があります。その売りゾーンが破られた場合、再度分析を行ってお話しします。しかし、皆さん、慎重に取引してください。私は良いエントリーポイントを探し、シグナルをお伝えします。頑張ってください
1
753
·
--
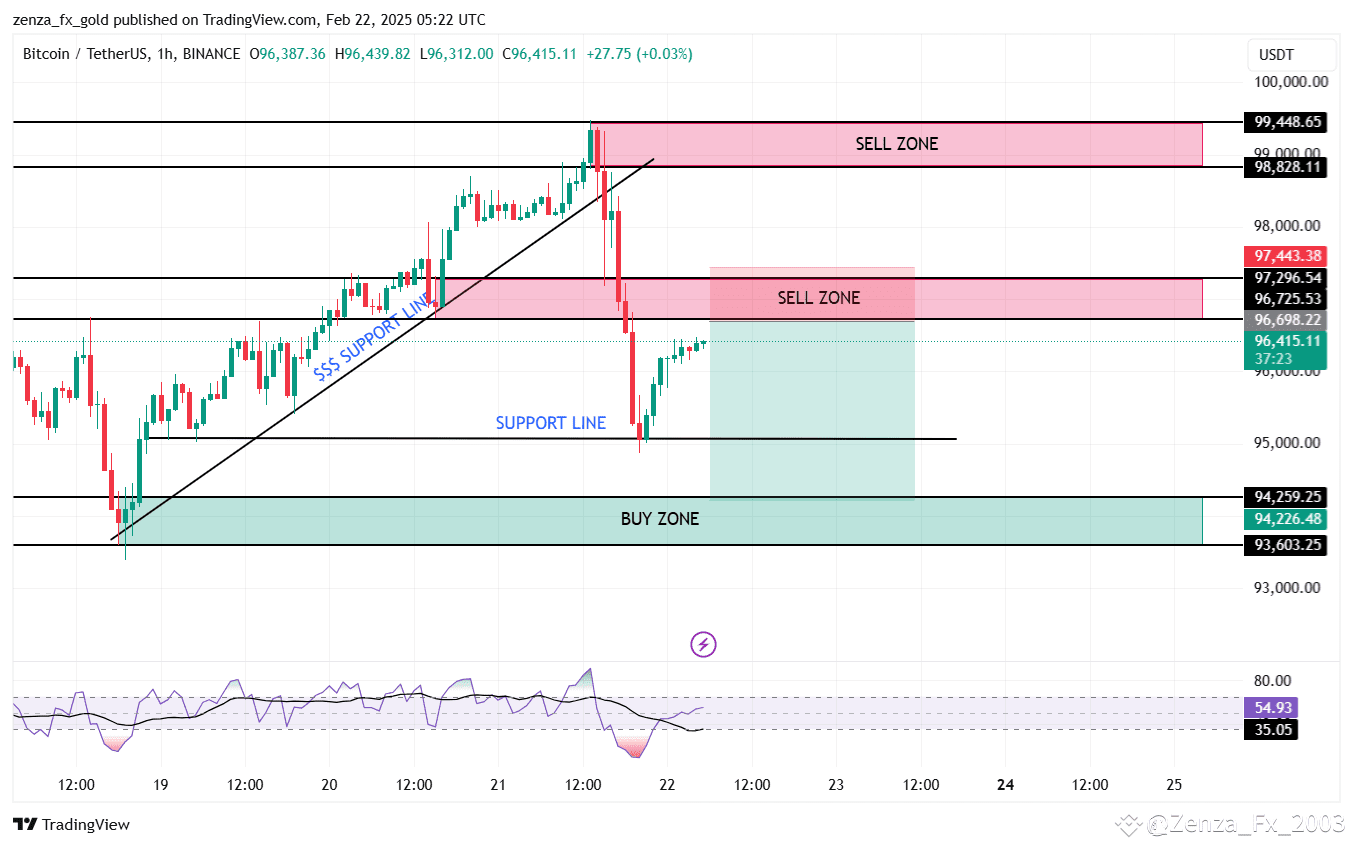
$BTC 私の分析によると、BTC市場は96,743または97,296の価格帯に飛び込む強い傾向があり、その後94,259の買いゾーンに戻るでしょう。もしその買いゾーンが破られた場合、再度分析を交えてお話しします。
{future}(BTCUSDT)
$BTC 私の分析によると、BTC市場は96,743または97,296の価格帯に飛び込む強い傾向があり、その後94,259の買いゾーンに戻るでしょう。もしその買いゾーンが破られた場合、再度分析を交えてお話しします。
4
761
ログインして、さらにコンテンツを読む
厳選トピックで世界の暗号資産トレーダーの仲間入り
⚡️ 暗号資産に関する最新かつ有益な情報が見つかります。
💬 世界最大の暗号資産取引所から信頼されています。
👍 認証を受けたクリエイターから、有益なインサイトを得られます。
メール / 電話番号
トレンドトピック
BTCBreaks80K
閲覧回数 57,182
1,366人が討論中
米連邦準備制度(FED)の爆撃と、$80Kの空白:ビットコインの流動性トラップ 🐋📊
連邦準備制度のマクロ経済ニュースによる騒音の後、相場は熱狂状態。上昇の追い風が一撃で入り、ビットコインは$80,989.99の“ぴったり”の高値を付けた。ニュースに導かれてこの水準で買うのは、数学的なパラシュートなしで宙に飛び込むことだ。
スキャナーの冷徹な数字が明かすのは、臨界的な過熱(オーバーエクステンション):
🔥 クオンティタティブ・イージング(4H):勢いのあるローソク足が重力を突き破った。4時間足のKDJオシレーターは極端な買われ過ぎで燃え上がっており、ライン「J」が100.83の上限をブチ破っている。価格は、構造的な主要サポートであるEMA20から危険なほど乖離しており、そのEMA20は下の$77,270.34に置き去りにされたままだ。
📐 フィボナッチの檻:インパルスの起点である$74,967.97から、$80,989.99の高値までのリトレースを引くと、38.2%のフィボナッチ・レベルが精密に合流する。狙うべき「ターミナルの確認」は?その水準は、1HのSuperTrendのダイナミックなフロアである$78,702.50とまったく一致する。
🩸 短期ドレイン(1H):慣性はすでに割れ始めている。1時間足のKDJでは「J」ラインが87.22まで後退しており、ニュースの燃料が尽きつつあることを確認している。
フリーライターのセットアップ(FOMOゼロ):
$80,748の水準を、3,000ドル以上も離れたEMAで取引することは、リスク管理を完全に破壊する。
🔴 トラップゾーン:現在の天井である“FEDの熱狂”を買うことは、すでに売り分け(ディストリビュート)に使っている機関投資家に流動性をプレゼントすることだ。
🟢 構造的な狩場ゾーン:規律は、平均回帰を待つことを命じる。私たちの数学的な“釣り網”は、フィボナッチ38.2%と1HのSuperTrendが重なる合流地点で展開され、安全なブロックである$78,700台を狙っている。
統計はニュースではなく、後に残る“構造”を動かす。📐
$BTC #BTCBreaks80K
RelatoCriptoPRO
·いいね:2件
·閲覧回数 1.2k
比特币突破8万
閲覧回数 57,223
208人が討論中
BuffettBecomesBerkshireChairmanEmeritus
閲覧回数 12,922
472人が討論中