
Wiсk
70 投稿

Wiсk
報告
ユーザーをブロック
Market Structure • Liquidity • Cycles, Crypto trader & analyst since 2019
高頻度トレーダー
5.4年
0 フォロー
184 フォロワー
590 いいね
投稿
すべて
引用
·
--
翻訳参照
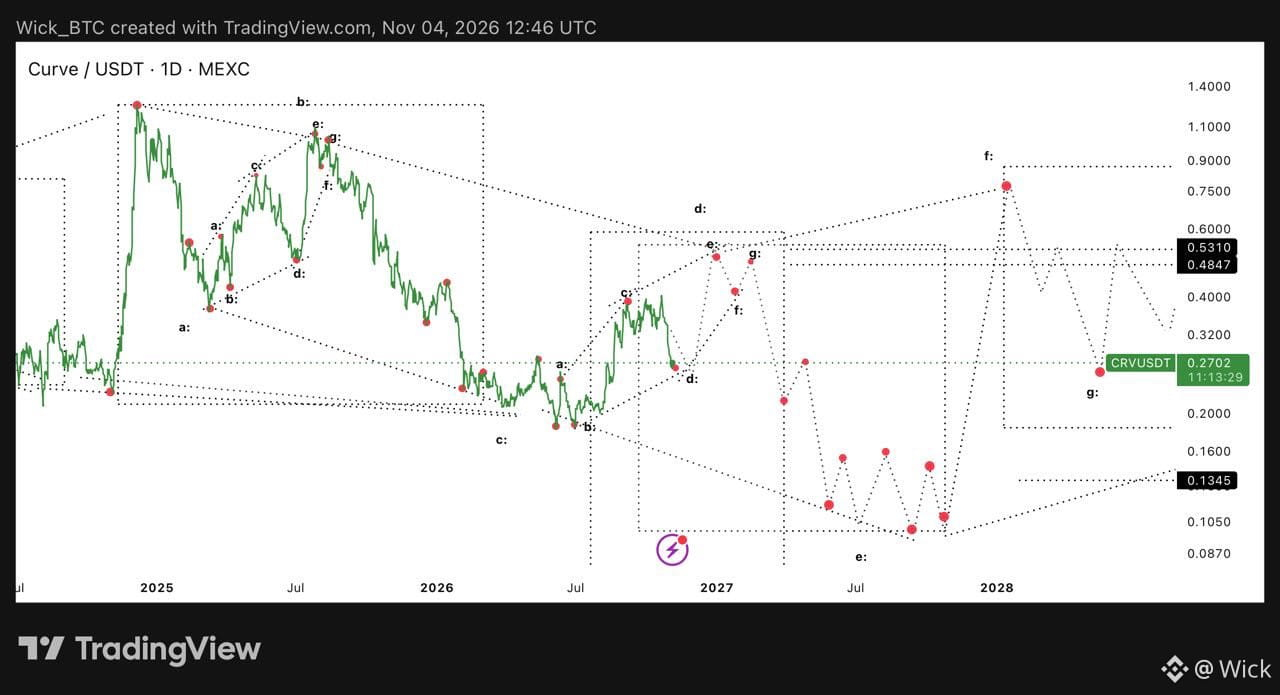
$CRV 1D : Diametric View:
As an additional perspective to my previous post, where I outlined the same projected scenario using a different wave count — an Impulsive Multiwave structure.
The Diametric view provides a more detailed breakdown of the projected path, illustrating each expected phase and its potential development rather than simply highlighting the target and bottom zones.
This offers a clearer, step-by-step picture of how the entire structure could unfold.
$CRV 1D : Diametric View:
As an additional perspective to my previous post, where I outlined the same projected scenario using a different wave count — an Impulsive Multiwave structure.
The Diametric view provides a more detailed breakdown of the projected path, illustrating each expected phase and its potential development rather than simply highlighting the target and bottom zones.
This offers a clearer, step-by-step picture of how the entire structure could unfold.
As an additional perspective to my previous post, where I outlined the same projected scenario using a different wave count — an Impulsive Multiwave structure.
The Diametric view provides a more detailed breakdown of the projected path, illustrating each expected phase and its potential development rather than simply highlighting the target and bottom zones.
This offers a clearer, step-by-step picture of how the entire structure could unfold.
1
49
·
--
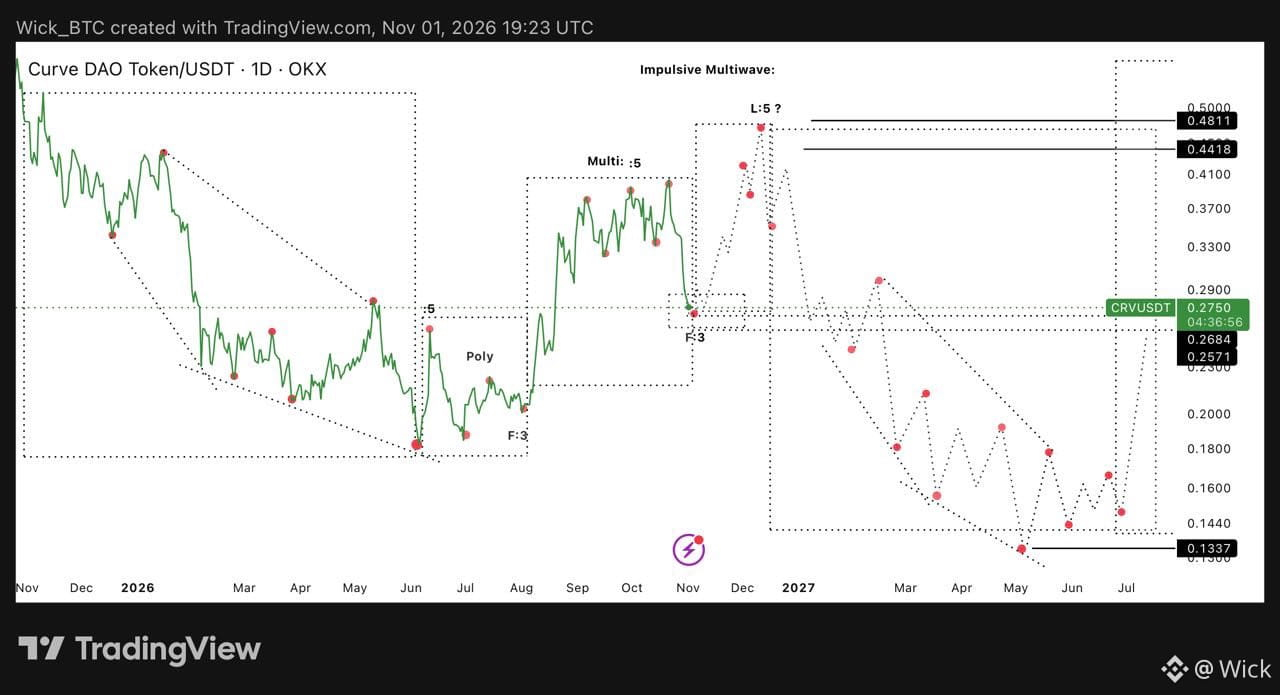
$CRV 1D: 更新:
CRVは、ポリウェーブに続いてマルチウェーブが形成される、インパルシブ・マルチウェーブ構造を形成しているようです。
構造は現在、最終段階に近づいています。価格はF:3の修正局面を形成しているようで、最終的なL:5のインパルシブな波が展開し、構造全体が完成する前に、0.25~0.268ドルの範囲内で完了する可能性があります。
この最終波が完了した後、大きな反転を見込んでいます。CRVは、予測されるサイクルの真の底値ゾーンである約0.13ドルに向けて下落する可能性があります。
$CRV 1D: 更新:
CRVは、ポリウェーブに続いてマルチウェーブが形成される、インパルシブ・マルチウェーブ構造を形成しているようです。
構造は現在、最終段階に近づいています。価格はF:3の修正局面を形成しているようで、最終的なL:5のインパルシブな波が展開し、構造全体が完成する前に、0.25~0.268ドルの範囲内で完了する可能性があります。
この最終波が完了した後、大きな反転を見込んでいます。CRVは、予測されるサイクルの真の底値ゾーンである約0.13ドルに向けて下落する可能性があります。
CRVは、ポリウェーブに続いてマルチウェーブが形成される、インパルシブ・マルチウェーブ構造を形成しているようです。
構造は現在、最終段階に近づいています。価格はF:3の修正局面を形成しているようで、最終的なL:5のインパルシブな波が展開し、構造全体が完成する前に、0.25~0.268ドルの範囲内で完了する可能性があります。
この最終波が完了した後、大きな反転を見込んでいます。CRVは、予測されるサイクルの真の底値ゾーンである約0.13ドルに向けて下落する可能性があります。
463
·
--
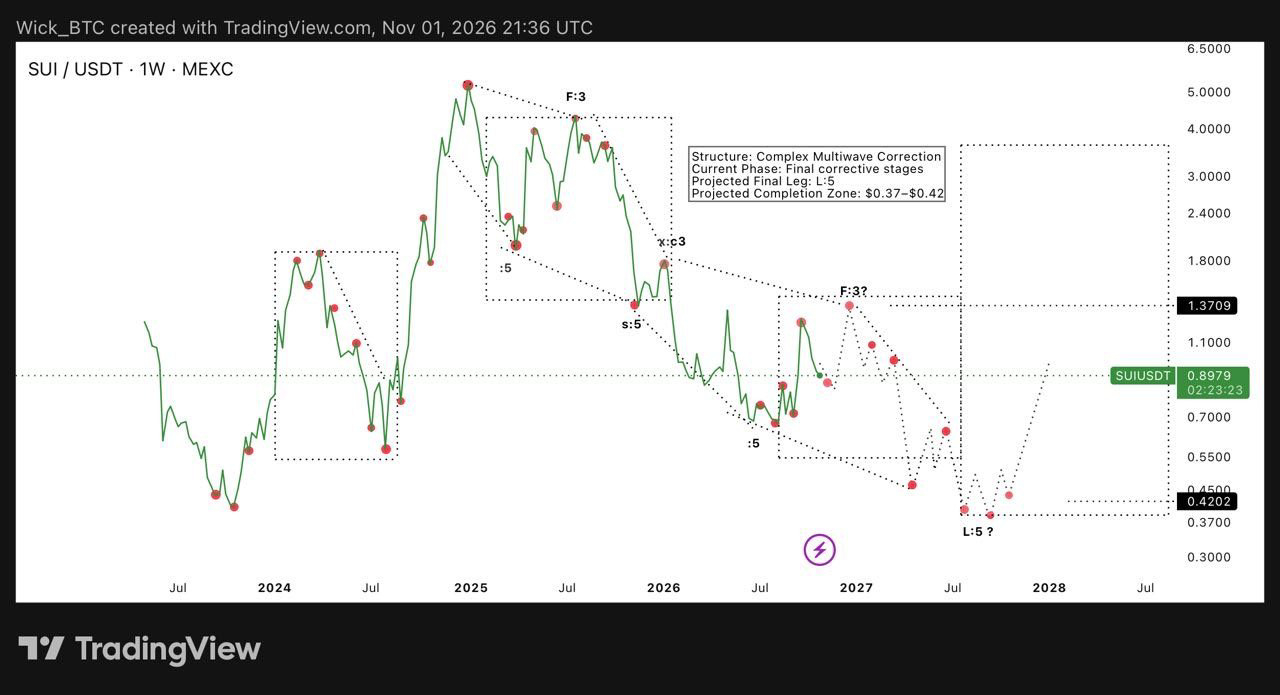
$SUI 1W :(更新):
SUIは複雑なマルチウェーブ修正を形成中のようで、全体構造は最終段階に近づいています。
現在のカウントからは、市場が最終的な修正局面を進んでおり、最終的な大幅下落(L:5)の前に、F:3の形成が続く可能性が示唆されています。
予測される構造に基づくと、現在の弱気局面における底値圏となる可能性のある0.37~0.42ドルの範囲内で、最後の下落波が完了すると見ています。
このエリアは、より大きな修正パターンの完了予想ゾーンです。構造全体が完成したら、大きなトレンド転換の確認と、次の強気サイクルの始まりを注意深く見守るつもりです。
$SUI 1W :(更新):
SUIは複雑なマルチウェーブ修正を形成中のようで、全体構造は最終段階に近づいています。
現在のカウントからは、市場が最終的な修正局面を進んでおり、最終的な大幅下落(L:5)の前に、F:3の形成が続く可能性が示唆されています。
予測される構造に基づくと、現在の弱気局面における底値圏となる可能性のある0.37~0.42ドルの範囲内で、最後の下落波が完了すると見ています。
このエリアは、より大きな修正パターンの完了予想ゾーンです。構造全体が完成したら、大きなトレンド転換の確認と、次の強気サイクルの始まりを注意深く見守るつもりです。
SUIは複雑なマルチウェーブ修正を形成中のようで、全体構造は最終段階に近づいています。
現在のカウントからは、市場が最終的な修正局面を進んでおり、最終的な大幅下落(L:5)の前に、F:3の形成が続く可能性が示唆されています。
予測される構造に基づくと、現在の弱気局面における底値圏となる可能性のある0.37~0.42ドルの範囲内で、最後の下落波が完了すると見ています。
このエリアは、より大きな修正パターンの完了予想ゾーンです。構造全体が完成したら、大きなトレンド転換の確認と、次の強気サイクルの始まりを注意深く見守るつもりです。
2
2.2k
·
--
翻訳参照
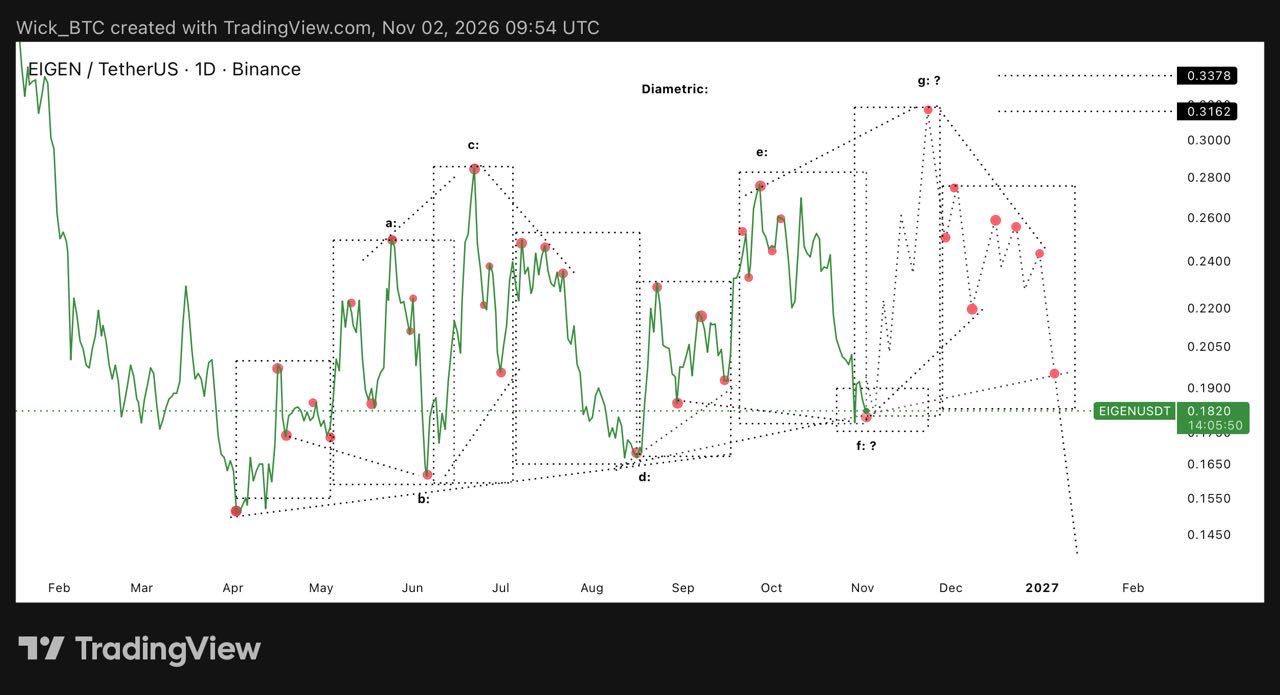
$EIGEN 1D update:
The current structure appears to be developing as a Diametric Multiwave pattern, consisting of seven corrective wave groups (A–G).
Progress so far: Waves A, B, C, D, and E appear to be complete, while Wave F seems to be nearing completion.
One final phase, Wave G, is still ahead. This wave is expected to complete the entire Diametric structure.
Once the final Wave G is complete, we could see a major reversal, potentially marking the beginning of a decline toward the true cycle-bottom ranges.
$EIGEN 1D update:
The current structure appears to be developing as a Diametric Multiwave pattern, consisting of seven corrective wave groups (A–G).
Progress so far: Waves A, B, C, D, and E appear to be complete, while Wave F seems to be nearing completion.
One final phase, Wave G, is still ahead. This wave is expected to complete the entire Diametric structure.
Once the final Wave G is complete, we could see a major reversal, potentially marking the beginning of a decline toward the true cycle-bottom ranges.
The current structure appears to be developing as a Diametric Multiwave pattern, consisting of seven corrective wave groups (A–G).
Progress so far: Waves A, B, C, D, and E appear to be complete, while Wave F seems to be nearing completion.
One final phase, Wave G, is still ahead. This wave is expected to complete the entire Diametric structure.
Once the final Wave G is complete, we could see a major reversal, potentially marking the beginning of a decline toward the true cycle-bottom ranges.
82
·
--
翻訳参照
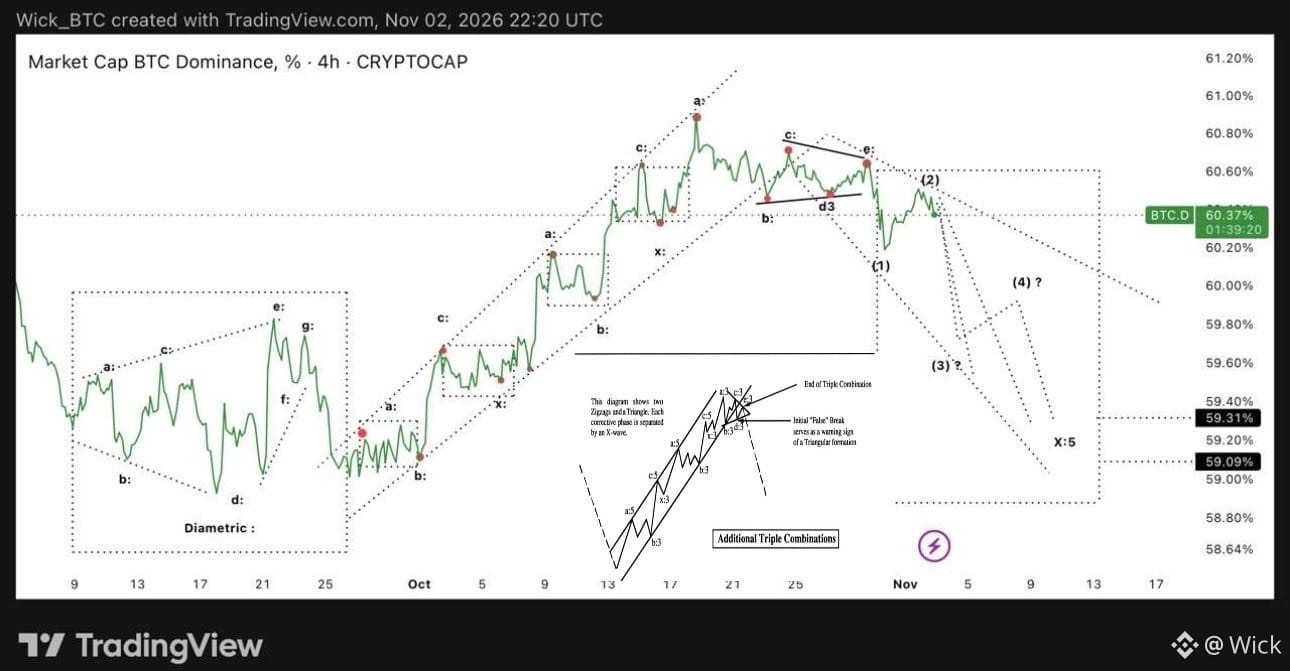
$BTC .D 4H :
Bitcoin Dominance appears to be developing a complex corrective structure.
The previous decline formed a Diametric pattern, followed by a recovery that appears to be unfolding as a Triple Combination. The current structure suggests that the final phase of this recovery may be approaching completion.
BTC Dominance is currently trading around 60.37%, with the 60.60%–60.80% region representing a key resistance area.
A rejection from the current resistance zone could mark the beginning of a broader bearish continuation in BTC Dominance.
The projected downside targets are:
59.31% : Initial target
59.09% : Intermediate target
58.64% : Extended downside target
$BTC .D 4H :
Bitcoin Dominance appears to be developing a complex corrective structure.
The previous decline formed a Diametric pattern, followed by a recovery that appears to be unfolding as a Triple Combination. The current structure suggests that the final phase of this recovery may be approaching completion.
BTC Dominance is currently trading around 60.37%, with the 60.60%–60.80% region representing a key resistance area.
A rejection from the current resistance zone could mark the beginning of a broader bearish continuation in BTC Dominance.
The projected downside targets are:
59.31% : Initial target
59.09% : Intermediate target
58.64% : Extended downside target
Bitcoin Dominance appears to be developing a complex corrective structure.
The previous decline formed a Diametric pattern, followed by a recovery that appears to be unfolding as a Triple Combination. The current structure suggests that the final phase of this recovery may be approaching completion.
BTC Dominance is currently trading around 60.37%, with the 60.60%–60.80% region representing a key resistance area.
A rejection from the current resistance zone could mark the beginning of a broader bearish continuation in BTC Dominance.
The projected downside targets are:
59.31% : Initial target
59.09% : Intermediate target
58.64% : Extended downside target
54
·
--
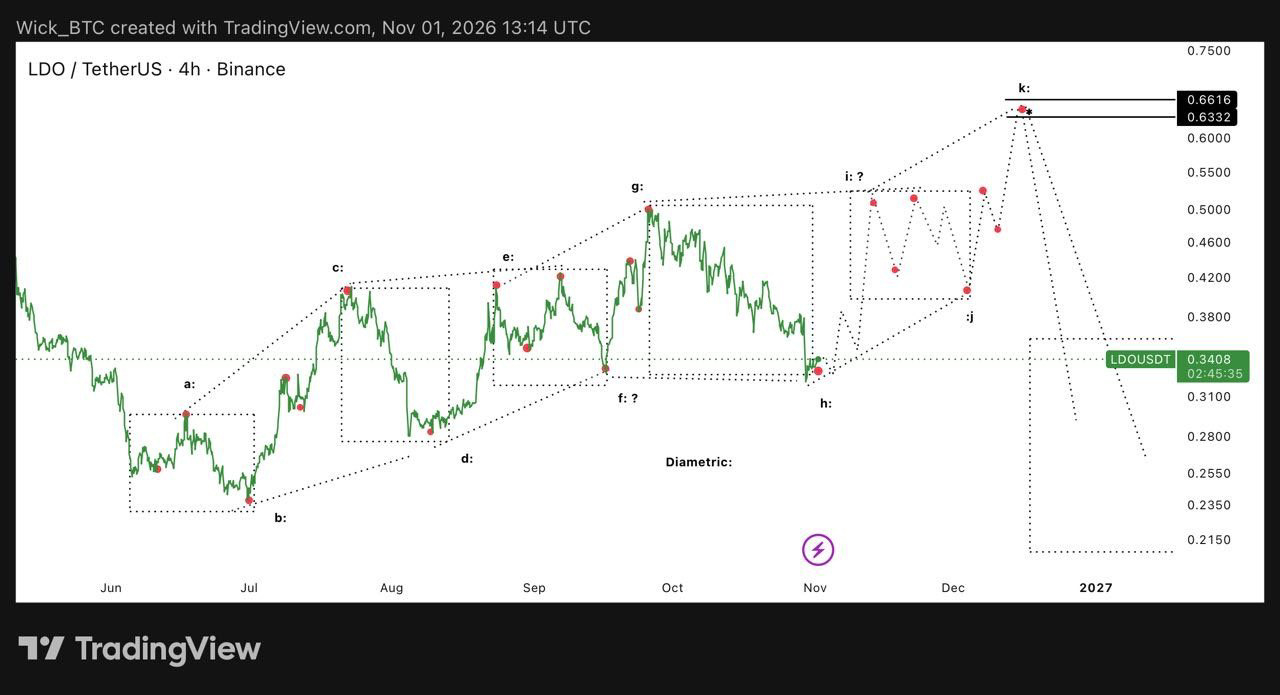
$LDO LTF:4時間足アップデート:
現在の構造はマルチウェーブ・ダイアメトリック・パターンとして形成されつつあり、全体の約65~70%がすでに完成しているようです。
これまでに、A、B、C、D、E、F、G、Hの各波が形成されたようです。残るI、J、Kの波はまだ先に控えている可能性があり、これらによってダイアメトリック構造全体が完成するかもしれません。
そのため、さらに上昇する展開も考えられ、上値目標は0.60~0.66ドルのゾーンとなる可能性があります。このエリアでパターンが完成した後、次の大きな下落局面が始まる可能性があります。
$LDO LTF:4時間足アップデート:
現在の構造はマルチウェーブ・ダイアメトリック・パターンとして形成されつつあり、全体の約65~70%がすでに完成しているようです。
これまでに、A、B、C、D、E、F、G、Hの各波が形成されたようです。残るI、J、Kの波はまだ先に控えている可能性があり、これらによってダイアメトリック構造全体が完成するかもしれません。
そのため、さらに上昇する展開も考えられ、上値目標は0.60~0.66ドルのゾーンとなる可能性があります。このエリアでパターンが完成した後、次の大きな下落局面が始まる可能性があります。
現在の構造はマルチウェーブ・ダイアメトリック・パターンとして形成されつつあり、全体の約65~70%がすでに完成しているようです。
これまでに、A、B、C、D、E、F、G、Hの各波が形成されたようです。残るI、J、Kの波はまだ先に控えている可能性があり、これらによってダイアメトリック構造全体が完成するかもしれません。
そのため、さらに上昇する展開も考えられ、上値目標は0.60~0.66ドルのゾーンとなる可能性があります。このエリアでパターンが完成した後、次の大きな下落局面が始まる可能性があります。
380
·
--
翻訳参照
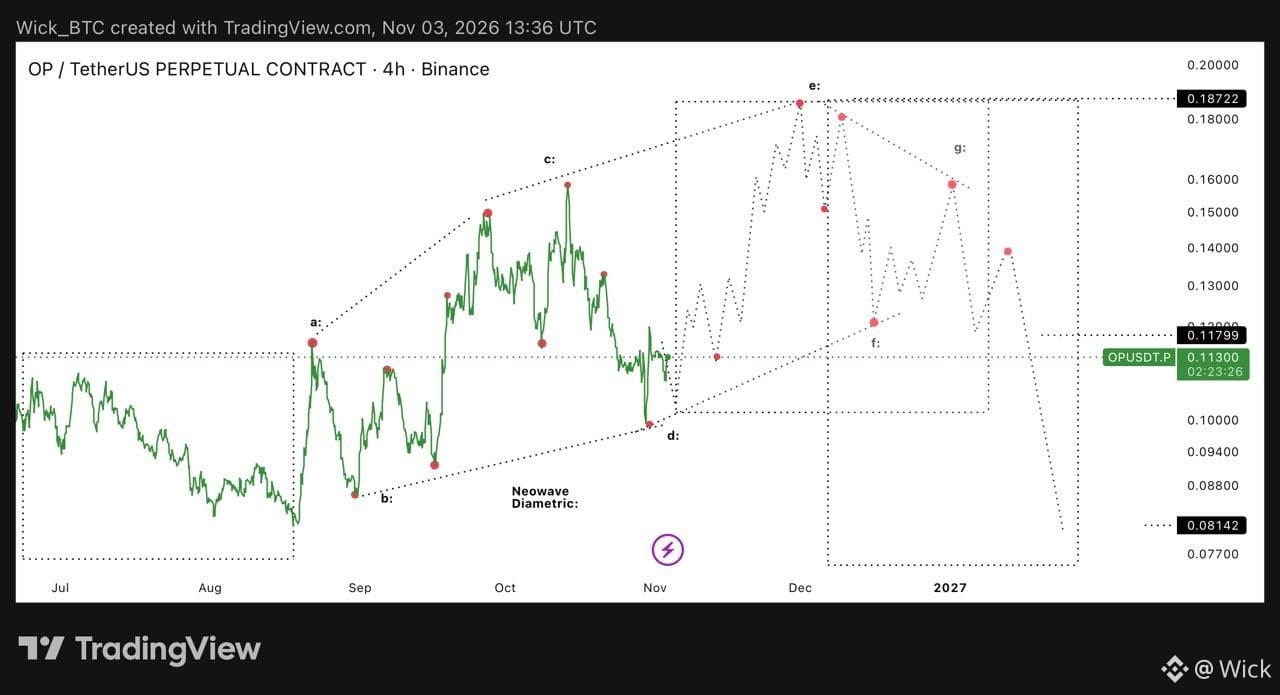
$OP LTF: 4H:
OP appears to be developing a Diametric pattern, with Waves A, B, C, and D seemingly complete.
The current structure suggests that Wave E could be the next major phase, potentially driving a recovery toward the $0,1750- $0.1872 area, which would mark the completion of the upper boundary of the Diametric formation.
Following the completion of Wave E, Waves F and G could develop, with the final bearish leg potentially pushing OP toward its true
cycle-bottom zone.
The broader structure remains corrective, and any recovery should be viewed within the context of this larger bearish scenario.
$OP LTF: 4H:
OP appears to be developing a Diametric pattern, with Waves A, B, C, and D seemingly complete.
The current structure suggests that Wave E could be the next major phase, potentially driving a recovery toward the $0,1750- $0.1872 area, which would mark the completion of the upper boundary of the Diametric formation.
Following the completion of Wave E, Waves F and G could develop, with the final bearish leg potentially pushing OP toward its true
cycle-bottom zone.
The broader structure remains corrective, and any recovery should be viewed within the context of this larger bearish scenario.
OP appears to be developing a Diametric pattern, with Waves A, B, C, and D seemingly complete.
The current structure suggests that Wave E could be the next major phase, potentially driving a recovery toward the $0,1750- $0.1872 area, which would mark the completion of the upper boundary of the Diametric formation.
Following the completion of Wave E, Waves F and G could develop, with the final bearish leg potentially pushing OP toward its true
cycle-bottom zone.
The broader structure remains corrective, and any recovery should be viewed within the context of this larger bearish scenario.
718
·
--
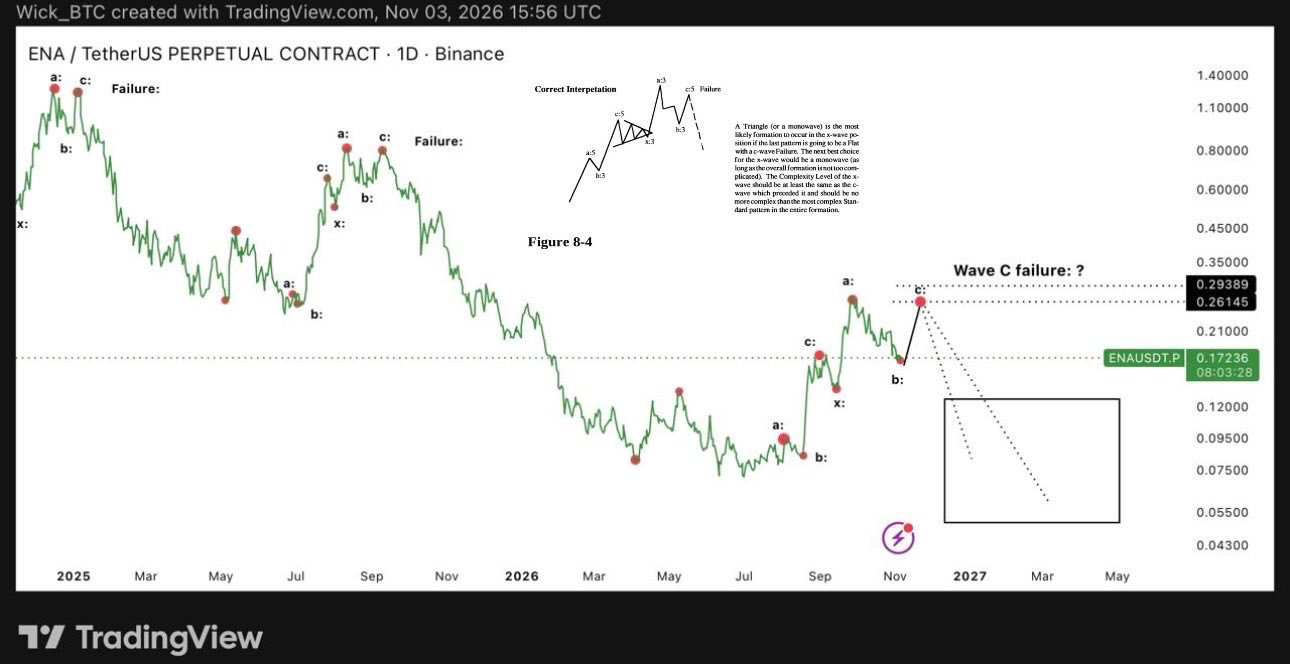
$ENA :
昨日の投稿で述べたように、一部のアルトコインには最後の上昇局面がまだ残っていると予想していますが、これはすべてのアルトコインが大きな上昇を見せるという意味ではありません。
アルトコインの中には、値動きのパターンがほぼ完成しているように見えるものもあれば、それぞれのパターンを完成させてから本来のサイクル底値圏に向けて下落するために、もう一度大きな回復局面が必要なものもあります。
さらに、すべてのアルトコインが直近の高値を必ず更新するとは限りません。最後の回復局面で新高値をつけるものもあれば、以前の高値を超えられないものもあるでしょう。
その一例が、$ENAです。
ENAの過去の値動きのパターンを見ると、繰り返し現れる傾向が確認できます。
強い上昇と局所的な高値の形成の後、価格は大きく下落します。しかし、その後には再び上昇の勢いが生まれるものの、以前の高値を超えることはありません。
まさにこのような値動きが、現在のパターンでも見られると予想しています。
ENAは再び回復した後、最後の上昇局面を迎えるものの、新高値をつけられない可能性があります。この局面が終わると、より大きな弱気構造が再開し、最終的にはENAが実際のサイクル底値圏に到達する展開も考えられます。
チャートを見ると、構造上の類似点がよりはっきりしてくるはずです。
$ENA :
昨日の投稿で述べたように、一部のアルトコインには最後の上昇局面がまだ残っていると予想していますが、これはすべてのアルトコインが大きな上昇を見せるという意味ではありません。
アルトコインの中には、値動きのパターンがほぼ完成しているように見えるものもあれば、それぞれのパターンを完成させてから本来のサイクル底値圏に向けて下落するために、もう一度大きな回復局面が必要なものもあります。
さらに、すべてのアルトコインが直近の高値を必ず更新するとは限りません。最後の回復局面で新高値をつけるものもあれば、以前の高値を超えられないものもあるでしょう。
その一例が、$ENA です。
ENAの過去の値動きのパターンを見ると、繰り返し現れる傾向が確認できます。
強い上昇と局所的な高値の形成の後、価格は大きく下落します。しかし、その後には再び上昇の勢いが生まれるものの、以前の高値を超えることはありません。
まさにこのような値動きが、現在のパターンでも見られると予想しています。
ENAは再び回復した後、最後の上昇局面を迎えるものの、新高値をつけられない可能性があります。この局面が終わると、より大きな弱気構造が再開し、最終的にはENAが実際のサイクル底値圏に到達する展開も考えられます。
チャートを見ると、構造上の類似点がよりはっきりしてくるはずです。
昨日の投稿で述べたように、一部のアルトコインには最後の上昇局面がまだ残っていると予想していますが、これはすべてのアルトコインが大きな上昇を見せるという意味ではありません。
アルトコインの中には、値動きのパターンがほぼ完成しているように見えるものもあれば、それぞれのパターンを完成させてから本来のサイクル底値圏に向けて下落するために、もう一度大きな回復局面が必要なものもあります。
さらに、すべてのアルトコインが直近の高値を必ず更新するとは限りません。最後の回復局面で新高値をつけるものもあれば、以前の高値を超えられないものもあるでしょう。
その一例が、$ENA です。
ENAの過去の値動きのパターンを見ると、繰り返し現れる傾向が確認できます。
強い上昇と局所的な高値の形成の後、価格は大きく下落します。しかし、その後には再び上昇の勢いが生まれるものの、以前の高値を超えることはありません。
まさにこのような値動きが、現在のパターンでも見られると予想しています。
ENAは再び回復した後、最後の上昇局面を迎えるものの、新高値をつけられない可能性があります。この局面が終わると、より大きな弱気構造が再開し、最終的にはENAが実際のサイクル底値圏に到達する展開も考えられます。
チャートを見ると、構造上の類似点がよりはっきりしてくるはずです。
1.6k
·
--
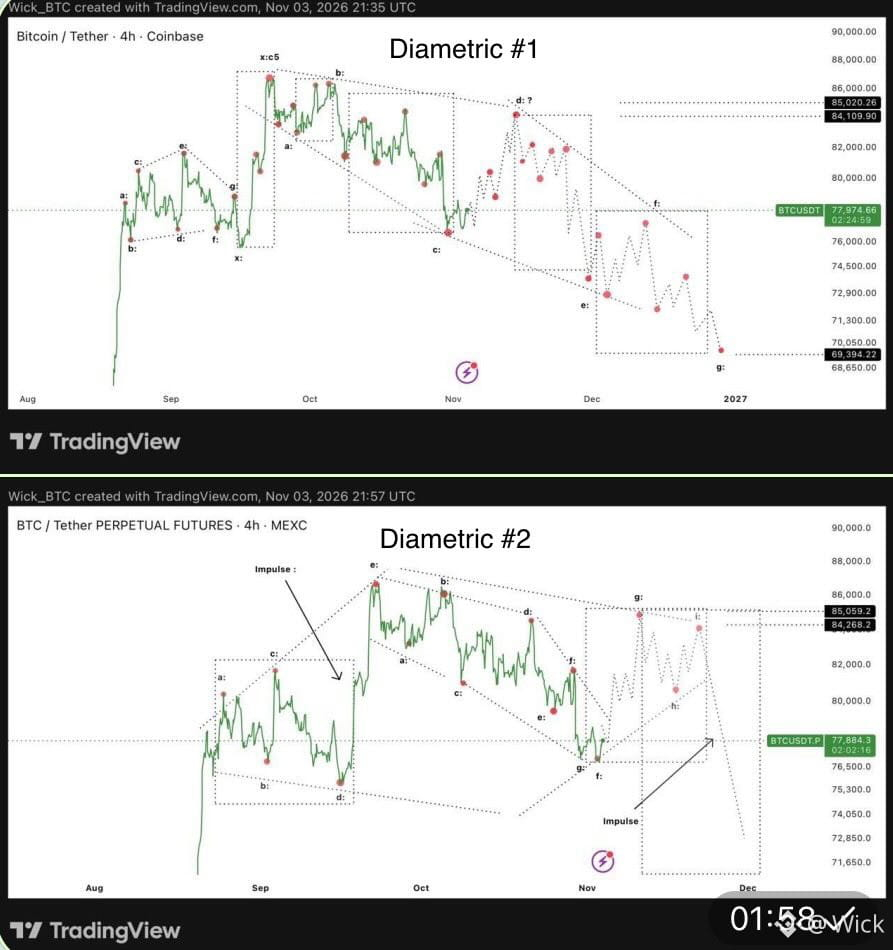
$BTC 追加のダイアメトリック構造2つ:
今後起こり得る展開を示すため、ダイアメトリック構造に基づく追加の解釈を2つまとめました。
以前の3時間足LTFマルチウェーブ分析では、7万5,000ドル〜7万6,000ドルの範囲から7万9,600ドルに向けて回復する可能性を示しました。
ビットコインはすでに約7万6,000ドルから7万9,000ドル付近まで回復しており、予測した3時間足構造の一部は想定どおりに展開しました。
しかし、その後、多数のアルトコインチャートを分析した結果、より広範な市場が本格的なサイクルの底値圏に向けて下落を再開する前に、アルトコイン市場には最後の上昇局面がまだ残されている可能性があるとの結論に至りました。
筋道立てて考えると、これはビットコインが、以前に示した7万9,600ドルの目標を超えて回復する余地があることも意味します。BTCがより力強く回復すれば、アルトコインもそれぞれの構造を完成させるために必要な上昇モメンタムを得て、最後のリリーフラリーとなる可能性のある局面を迎えるかもしれません。
ダイアメトリック構造に基づく、追加のLTF解釈を2つご紹介します。
どちらのダイアメトリック・シナリオも、ビットコインの全体的な価格推移については、ほぼ同じ軌道を予測しています。違いは、内部の細分化、波の順序、そして構造が展開していく個々の段階にあります。
つまり、内部の波のカウントは異なるものの、より広い視点で見た予測経路と想定される結果は同じです。
$BTC 追加のダイアメトリック構造2つ:
今後起こり得る展開を示すため、ダイアメトリック構造に基づく追加の解釈を2つまとめました。
以前の3時間足LTFマルチウェーブ分析では、7万5,000ドル〜7万6,000ドルの範囲から7万9,600ドルに向けて回復する可能性を示しました。
ビットコインはすでに約7万6,000ドルから7万9,000ドル付近まで回復しており、予測した3時間足構造の一部は想定どおりに展開しました。
しかし、その後、多数のアルトコインチャートを分析した結果、より広範な市場が本格的なサイクルの底値圏に向けて下落を再開する前に、アルトコイン市場には最後の上昇局面がまだ残されている可能性があるとの結論に至りました。
筋道立てて考えると、これはビットコインが、以前に示した7万9,600ドルの目標を超えて回復する余地があることも意味します。BTCがより力強く回復すれば、アルトコインもそれぞれの構造を完成させるために必要な上昇モメンタムを得て、最後のリリーフラリーとなる可能性のある局面を迎えるかもしれません。
ダイアメトリック構造に基づく、追加のLTF解釈を2つご紹介します。
どちらのダイアメトリック・シナリオも、ビットコインの全体的な価格推移については、ほぼ同じ軌道を予測しています。違いは、内部の細分化、波の順序、そして構造が展開していく個々の段階にあります。
つまり、内部の波のカウントは異なるものの、より広い視点で見た予測経路と想定される結果は同じです。
今後起こり得る展開を示すため、ダイアメトリック構造に基づく追加の解釈を2つまとめました。
以前の3時間足LTFマルチウェーブ分析では、7万5,000ドル〜7万6,000ドルの範囲から7万9,600ドルに向けて回復する可能性を示しました。
ビットコインはすでに約7万6,000ドルから7万9,000ドル付近まで回復しており、予測した3時間足構造の一部は想定どおりに展開しました。
しかし、その後、多数のアルトコインチャートを分析した結果、より広範な市場が本格的なサイクルの底値圏に向けて下落を再開する前に、アルトコイン市場には最後の上昇局面がまだ残されている可能性があるとの結論に至りました。
筋道立てて考えると、これはビットコインが、以前に示した7万9,600ドルの目標を超えて回復する余地があることも意味します。BTCがより力強く回復すれば、アルトコインもそれぞれの構造を完成させるために必要な上昇モメンタムを得て、最後のリリーフラリーとなる可能性のある局面を迎えるかもしれません。
ダイアメトリック構造に基づく、追加のLTF解釈を2つご紹介します。
どちらのダイアメトリック・シナリオも、ビットコインの全体的な価格推移については、ほぼ同じ軌道を予測しています。違いは、内部の細分化、波の順序、そして構造が展開していく個々の段階にあります。
つまり、内部の波のカウントは異なるものの、より広い視点で見た予測経路と想定される結果は同じです。
988
·
--
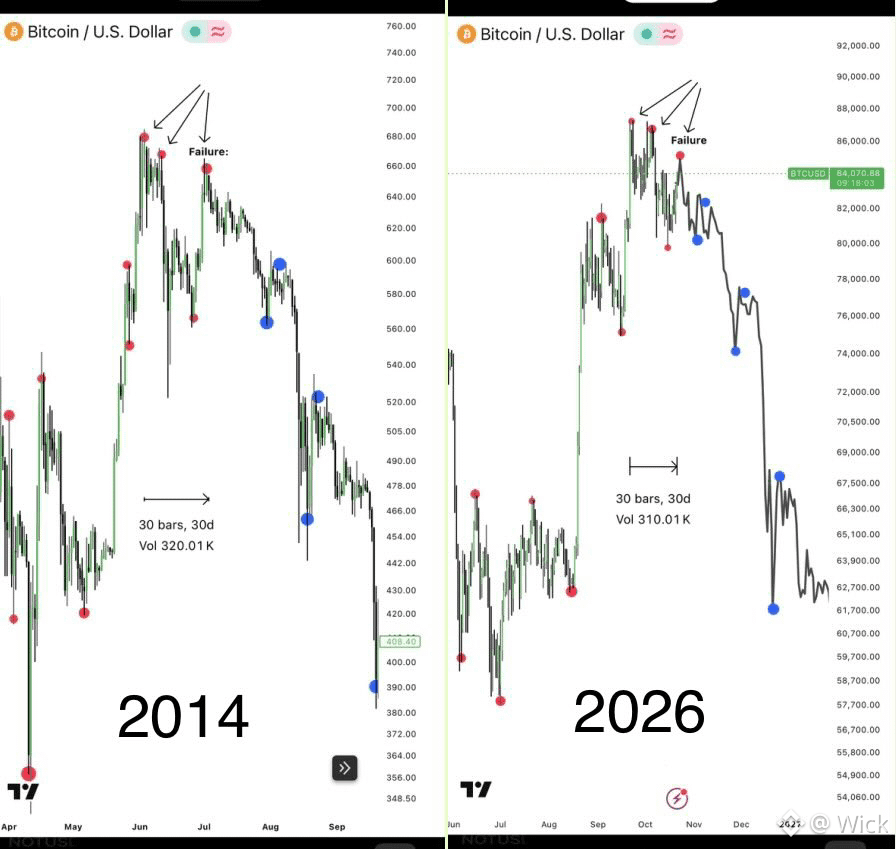
$BTC : 私の最初の論文:長期化する弱気相場
現在の構造的な値動きの範囲を、ビットコインの2013~2015年にかけての長期弱気相場における2014年の局面と比較してみましょう。
価格の動きが、同じ構造的なパターンを段階ごとに、いかに忠実になぞっているかに注目してください。
主な違いはボラティリティです。2013~2015年のサイクルでは、より急激な価格変動、長いヒゲ、そして激しい値動きが見られました。現在は機関投資家の参入やETFがボラティリティの低下につながっている可能性がありますが、ビットコイン初期のサイクルから繰り返されてきた根本的な市場構造まで変わったとは限りません。
ボラティリティが変化しても、構造は繰り返されることがあります。
引用した投稿で説明したように、私の追加の波動分析では、最終的な第C波の推進波(現在の推進波)が失敗し、その後、新たなサイクル安値に向けた大幅な下落が始まる可能性が示されています。
この見立てをまとめた後、2013~2015年のサイクルを振り返り、驚くほどよく似た構造に気づきました。私が何を見ているのか、そしてなぜこの比較が重要なのかをお伝えするため、両方のチャートを並べてみることにしました。
これは現在のサイクルにおける重要な局面となる可能性があります。
$BTC : 私の最初の論文:長期化する弱気相場
現在の構造的な値動きの範囲を、ビットコインの2013~2015年にかけての長期弱気相場における2014年の局面と比較してみましょう。
価格の動きが、同じ構造的なパターンを段階ごとに、いかに忠実になぞっているかに注目してください。
主な違いはボラティリティです。2013~2015年のサイクルでは、より急激な価格変動、長いヒゲ、そして激しい値動きが見られました。現在は機関投資家の参入やETFがボラティリティの低下につながっている可能性がありますが、ビットコイン初期のサイクルから繰り返されてきた根本的な市場構造まで変わったとは限りません。
ボラティリティが変化しても、構造は繰り返されることがあります。
引用した投稿で説明したように、私の追加の波動分析では、最終的な第C波の推進波(現在の推進波)が失敗し、その後、新たなサイクル安値に向けた大幅な下落が始まる可能性が示されています。
この見立てをまとめた後、2013~2015年のサイクルを振り返り、驚くほどよく似た構造に気づきました。私が何を見ているのか、そしてなぜこの比較が重要なのかをお伝えするため、両方のチャートを並べてみることにしました。
これは現在のサイクルにおける重要な局面となる可能性があります。
現在の構造的な値動きの範囲を、ビットコインの2013~2015年にかけての長期弱気相場における2014年の局面と比較してみましょう。
価格の動きが、同じ構造的なパターンを段階ごとに、いかに忠実になぞっているかに注目してください。
主な違いはボラティリティです。2013~2015年のサイクルでは、より急激な価格変動、長いヒゲ、そして激しい値動きが見られました。現在は機関投資家の参入やETFがボラティリティの低下につながっている可能性がありますが、ビットコイン初期のサイクルから繰り返されてきた根本的な市場構造まで変わったとは限りません。
ボラティリティが変化しても、構造は繰り返されることがあります。
引用した投稿で説明したように、私の追加の波動分析では、最終的な第C波の推進波(現在の推進波)が失敗し、その後、新たなサイクル安値に向けた大幅な下落が始まる可能性が示されています。
この見立てをまとめた後、2013~2015年のサイクルを振り返り、驚くほどよく似た構造に気づきました。私が何を見ているのか、そしてなぜこの比較が重要なのかをお伝えするため、両方のチャートを並べてみることにしました。
これは現在のサイクルにおける重要な局面となる可能性があります。
1
2.3k
·
--
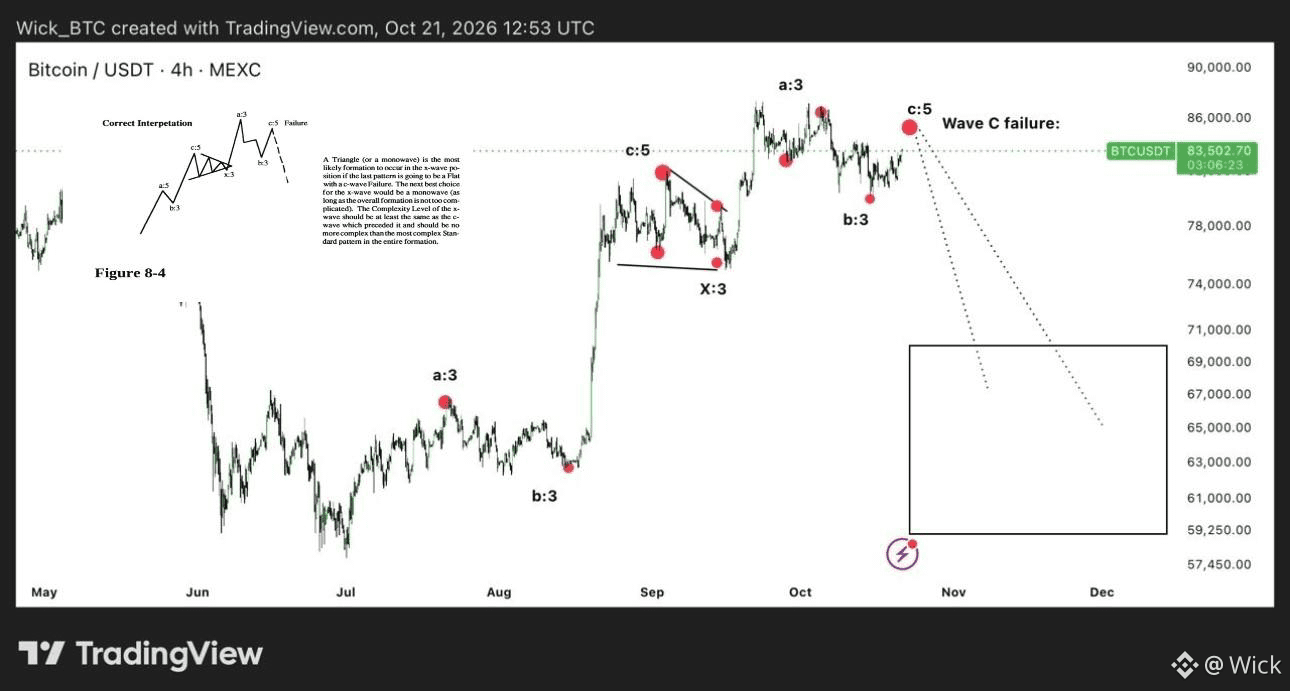
$BTC 1D 更新:
ビットコインの現在の構造は、ネオウェーブ理論で示されているルールに沿っているように見えます。
この解釈によると、C波がフェイラーとなるフラットが形成される場合、その前のX波はトライアングルかモノウェーブの形を取る可能性が最も高いと考えられます。
チャートはこのシナリオに当てはまるようです。
X波:ネオウェーブのパターンと一致する収縮トライアングル。
トライアングル後の上昇:価格は新高値まで上昇し、最終的な修正構造を形成する可能性があります。
C波のフェイラー:現在の構造が予想どおりに展開し続ける場合、発生する可能性があります。
ネオウェーブでは、構造の複雑さも重視されます。X波は先行するC波と同等以上に複雑である必要がありますが、全体の形成過程における最も複雑な標準パターンを上回るほど複雑であってはなりません。
これが現在のBTCの構造を興味深いものにしています。これまでの値動きはこの解釈に沿っているように見える一方、予想されるC波のフェイラーはまだ先に控えています。
このシナリオが展開すれば、持続的な強気ブレイクアウトではなく、さらなる下落への道が開かれる可能性があります。
$BTC 1D 更新:
ビットコインの現在の構造は、ネオウェーブ理論で示されているルールに沿っているように見えます。
この解釈によると、C波がフェイラーとなるフラットが形成される場合、その前のX波はトライアングルかモノウェーブの形を取る可能性が最も高いと考えられます。
チャートはこのシナリオに当てはまるようです。
X波:ネオウェーブのパターンと一致する収縮トライアングル。
トライアングル後の上昇:価格は新高値まで上昇し、最終的な修正構造を形成する可能性があります。
C波のフェイラー:現在の構造が予想どおりに展開し続ける場合、発生する可能性があります。
ネオウェーブでは、構造の複雑さも重視されます。X波は先行するC波と同等以上に複雑である必要がありますが、全体の形成過程における最も複雑な標準パターンを上回るほど複雑であってはなりません。
これが現在のBTCの構造を興味深いものにしています。これまでの値動きはこの解釈に沿っているように見える一方、予想されるC波のフェイラーはまだ先に控えています。
このシナリオが展開すれば、持続的な強気ブレイクアウトではなく、さらなる下落への道が開かれる可能性があります。
ビットコインの現在の構造は、ネオウェーブ理論で示されているルールに沿っているように見えます。
この解釈によると、C波がフェイラーとなるフラットが形成される場合、その前のX波はトライアングルかモノウェーブの形を取る可能性が最も高いと考えられます。
チャートはこのシナリオに当てはまるようです。
X波:ネオウェーブのパターンと一致する収縮トライアングル。
トライアングル後の上昇:価格は新高値まで上昇し、最終的な修正構造を形成する可能性があります。
C波のフェイラー:現在の構造が予想どおりに展開し続ける場合、発生する可能性があります。
ネオウェーブでは、構造の複雑さも重視されます。X波は先行するC波と同等以上に複雑である必要がありますが、全体の形成過程における最も複雑な標準パターンを上回るほど複雑であってはなりません。
これが現在のBTCの構造を興味深いものにしています。これまでの値動きはこの解釈に沿っているように見える一方、予想されるC波のフェイラーはまだ先に控えています。
このシナリオが展開すれば、持続的な強気ブレイクアウトではなく、さらなる下落への道が開かれる可能性があります。
142
·
--
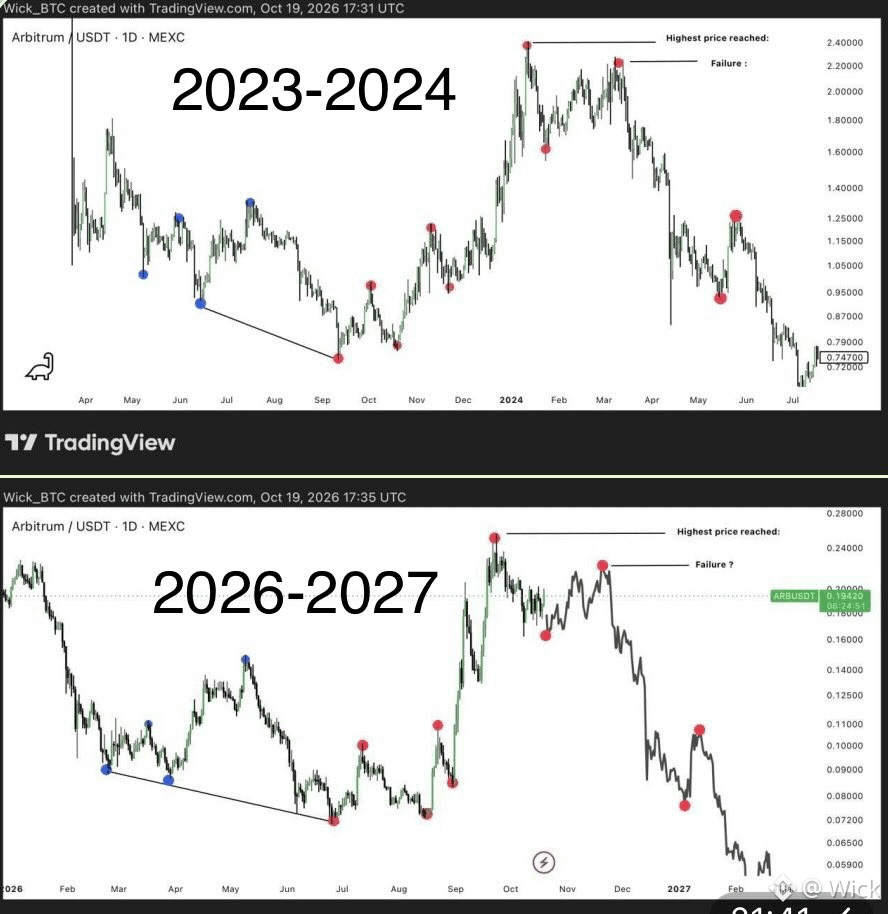
$ARB (1D) アップデート:
0.07ドルから0.23ドルへの上昇をうまく捉えられたものの、より大きなネオウェーブ構造であるトリプル・コンビネーションは、サイクルの最終底に至る前に自律反発が起こる可能性を示していました。
さらに現在、2023~2024年の値動きと構造的に非常によく似ていることを示す説得力のある比較材料もあります。一歩ずつ、現在の構造は前回のものを引き続きなぞっており、さらなる下落を示唆しています。
今後の調整によって上昇分がすべて帳消しとなり、最終的には真のサイクル底に至る可能性が高いと考えています。その水準は、0.05ドル前後になるかもしれません。
現在の水準からは、依然としてある程度のボラティリティが見込まれ、価格は2023~2024年の構造で見られたのと同様に、約±10%の範囲で変動する可能性があります。当時は、自律反発が最終的に失敗し、その後も下降トレンドが続きました。
今回も同様の展開になると予想しています。これまでのところ、価格は前回の構造を驚くほど忠実になぞり、ほぼすべての段階を繰り返しています。
$ARB (1D) アップデート:
0.07ドルから0.23ドルへの上昇をうまく捉えられたものの、より大きなネオウェーブ構造であるトリプル・コンビネーションは、サイクルの最終底に至る前に自律反発が起こる可能性を示していました。
さらに現在、2023~2024年の値動きと構造的に非常によく似ていることを示す説得力のある比較材料もあります。一歩ずつ、現在の構造は前回のものを引き続きなぞっており、さらなる下落を示唆しています。
今後の調整によって上昇分がすべて帳消しとなり、最終的には真のサイクル底に至る可能性が高いと考えています。その水準は、0.05ドル前後になるかもしれません。
現在の水準からは、依然としてある程度のボラティリティが見込まれ、価格は2023~2024年の構造で見られたのと同様に、約±10%の範囲で変動する可能性があります。当時は、自律反発が最終的に失敗し、その後も下降トレンドが続きました。
今回も同様の展開になると予想しています。これまでのところ、価格は前回の構造を驚くほど忠実になぞり、ほぼすべての段階を繰り返しています。
0.07ドルから0.23ドルへの上昇をうまく捉えられたものの、より大きなネオウェーブ構造であるトリプル・コンビネーションは、サイクルの最終底に至る前に自律反発が起こる可能性を示していました。
さらに現在、2023~2024年の値動きと構造的に非常によく似ていることを示す説得力のある比較材料もあります。一歩ずつ、現在の構造は前回のものを引き続きなぞっており、さらなる下落を示唆しています。
今後の調整によって上昇分がすべて帳消しとなり、最終的には真のサイクル底に至る可能性が高いと考えています。その水準は、0.05ドル前後になるかもしれません。
現在の水準からは、依然としてある程度のボラティリティが見込まれ、価格は2023~2024年の構造で見られたのと同様に、約±10%の範囲で変動する可能性があります。当時は、自律反発が最終的に失敗し、その後も下降トレンドが続きました。
今回も同様の展開になると予想しています。これまでのところ、価格は前回の構造を驚くほど忠実になぞり、ほぼすべての段階を繰り返しています。
2
1.7k
·
--
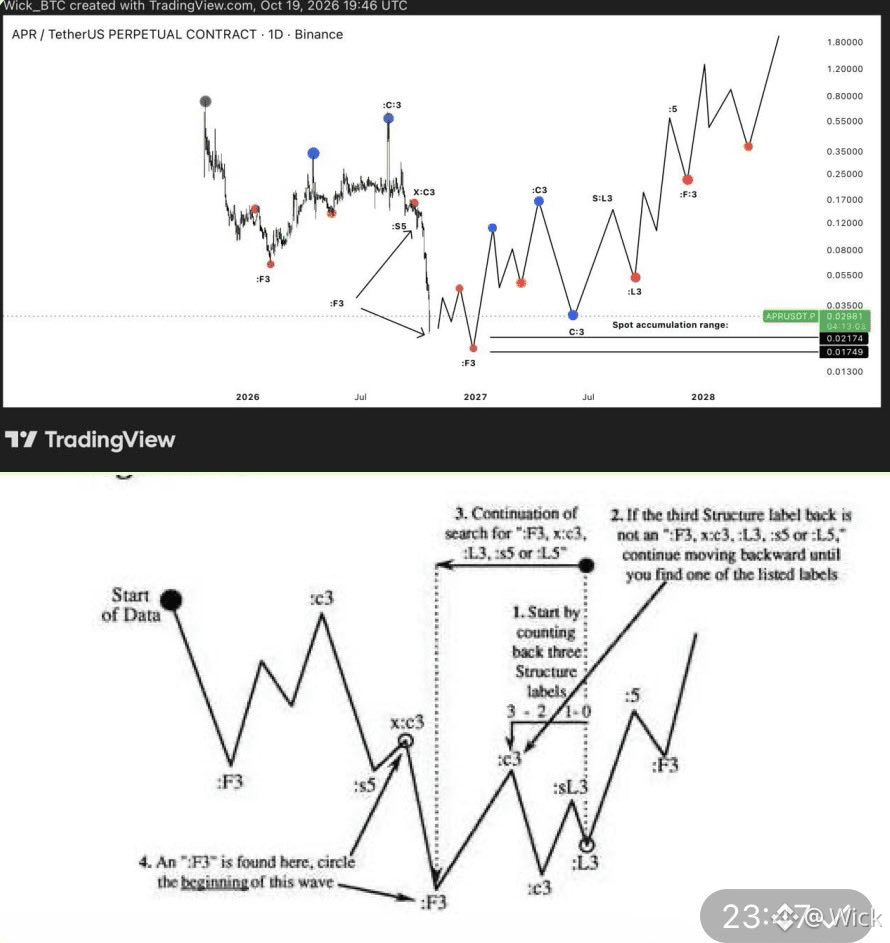
$APR 買いセットアップ:(現物)
APRは、NeoWaveの手法で説明されているパターンによく似た、複雑な修正構造を形成しつつあるようです。
この構造的な比較に基づくと、現在の下落は続き、最終的には現物の買い集めゾーンである$0.0175~$0.0217の範囲内で、サイクルの底をつける可能性があると予想しています。
現在の構造の進捗状況:
これまでに構造は約50%まで形成されています。NeoWaveの手法を用いて、以下の波を特定しました。
:F3 → :C3 → :S5 → :X:C3 → :F3
ここからは、構造の形成に合わせて値動きを引き続き監視し、次の波を特定していきます。残りの波が展開し、必要な構造ラベルがすべて確認されれば、NeoWaveのルールに基づいて、この構造を100%確認できることになります。
現物のエントリー戦略:
価格が前述の買い集めゾーンである$0.0175~$0.0217に達したら、現物を購入する予定です。その後は構造の進展を追跡し、次に起こりうる値動きを特定するため、その形成を注意深く監視します。
予想される値動きの道筋は、長期にわたる回復局面を示唆しています。APRがより大規模な強気相場へ移行する可能性がある前に、複数回の修正的な値動きが見込まれます。
$APR 買いセットアップ:(現物)
APRは、NeoWaveの手法で説明されているパターンによく似た、複雑な修正構造を形成しつつあるようです。
この構造的な比較に基づくと、現在の下落は続き、最終的には現物の買い集めゾーンである$0.0175~$0.0217の範囲内で、サイクルの底をつける可能性があると予想しています。
現在の構造の進捗状況:
これまでに構造は約50%まで形成されています。NeoWaveの手法を用いて、以下の波を特定しました。
:F3 → :C3 → :S5 → :X:C3 → :F3
ここからは、構造の形成に合わせて値動きを引き続き監視し、次の波を特定していきます。残りの波が展開し、必要な構造ラベルがすべて確認されれば、NeoWaveのルールに基づいて、この構造を100%確認できることになります。
現物のエントリー戦略:
価格が前述の買い集めゾーンである$0.0175~$0.0217に達したら、現物を購入する予定です。その後は構造の進展を追跡し、次に起こりうる値動きを特定するため、その形成を注意深く監視します。
予想される値動きの道筋は、長期にわたる回復局面を示唆しています。APRがより大規模な強気相場へ移行する可能性がある前に、複数回の修正的な値動きが見込まれます。
APRは、NeoWaveの手法で説明されているパターンによく似た、複雑な修正構造を形成しつつあるようです。
この構造的な比較に基づくと、現在の下落は続き、最終的には現物の買い集めゾーンである$0.0175~$0.0217の範囲内で、サイクルの底をつける可能性があると予想しています。
現在の構造の進捗状況:
これまでに構造は約50%まで形成されています。NeoWaveの手法を用いて、以下の波を特定しました。
:F3 → :C3 → :S5 → :X:C3 → :F3
ここからは、構造の形成に合わせて値動きを引き続き監視し、次の波を特定していきます。残りの波が展開し、必要な構造ラベルがすべて確認されれば、NeoWaveのルールに基づいて、この構造を100%確認できることになります。
現物のエントリー戦略:
価格が前述の買い集めゾーンである$0.0175~$0.0217に達したら、現物を購入する予定です。その後は構造の進展を追跡し、次に起こりうる値動きを特定するため、その形成を注意深く監視します。
予想される値動きの道筋は、長期にわたる回復局面を示唆しています。APRがより大規模な強気相場へ移行する可能性がある前に、複数回の修正的な値動きが見込まれます。
318
·
--
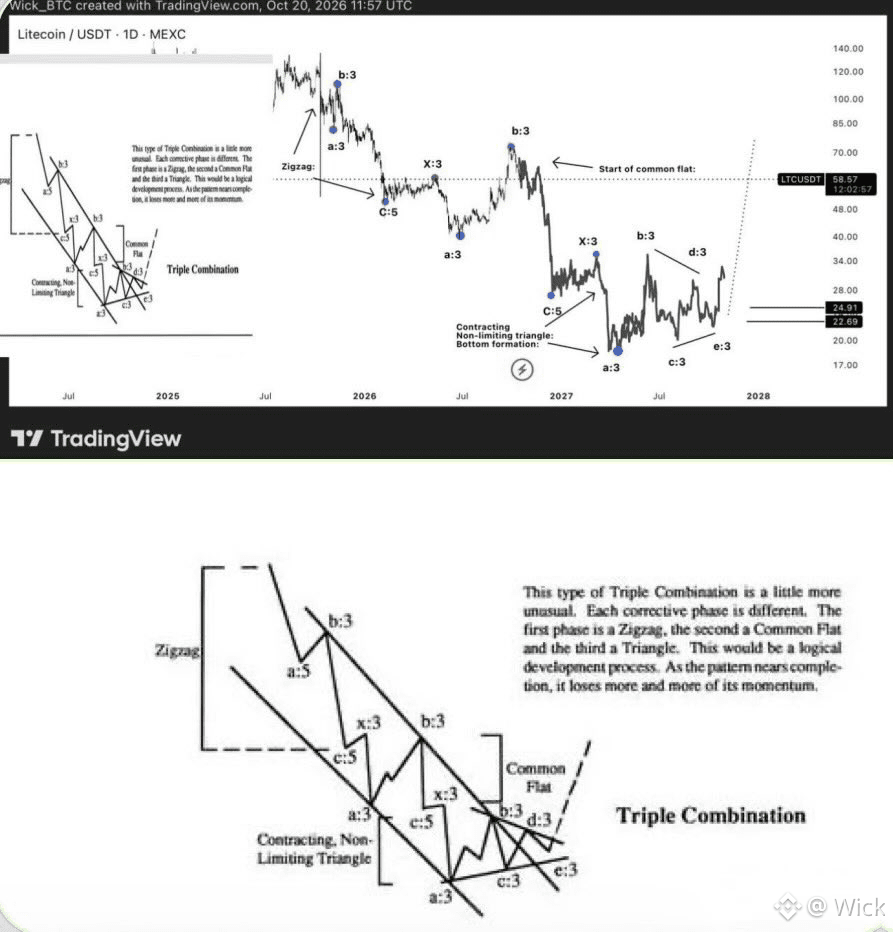
$LTC 詳細アップデート:
LTCは、NeoWaveの枠組みにおいてトリプルコンビネーションを形成しつつあるようです。
全体の構造は、現時点でおよそ50%まで進んでいます。
フェーズ1:最初の下落に続いてジグザグ構造が形成され、コンビネーションの第1フェーズが完了したように見えます。
フェーズ2:このフェーズは現在、進行中のようです。直近の値動きは、ローカル高値から急落するのが特徴の通常型フラットに酷似しています。この動きは、各修正フェーズが異なる構造をとるトリプルコンビネーションの想定される展開と一致しています。
次はどうなるでしょうか?
現在の構造の進展を踏まえると、LTCは今後数か月にわたってサイクルボトムの形成を続けると予想しています。最終的には、収縮型の非制限的なABCDEトライアングルで構造が完了し、最終的な底値は20~24ドルの範囲内で形成される可能性があります。
引用元の投稿では、2022年のサイクルとの構造的な比較も確認できます。値動きは段階ごとに一致しています。これは、現在の分析にさらなるコンフルエンスを加えるものです。
$LTC 詳細アップデート:
LTCは、NeoWaveの枠組みにおいてトリプルコンビネーションを形成しつつあるようです。
全体の構造は、現時点でおよそ50%まで進んでいます。
フェーズ1:最初の下落に続いてジグザグ構造が形成され、コンビネーションの第1フェーズが完了したように見えます。
フェーズ2:このフェーズは現在、進行中のようです。直近の値動きは、ローカル高値から急落するのが特徴の通常型フラットに酷似しています。この動きは、各修正フェーズが異なる構造をとるトリプルコンビネーションの想定される展開と一致しています。
次はどうなるでしょうか?
現在の構造の進展を踏まえると、LTCは今後数か月にわたってサイクルボトムの形成を続けると予想しています。最終的には、収縮型の非制限的なABCDEトライアングルで構造が完了し、最終的な底値は20~24ドルの範囲内で形成される可能性があります。
引用元の投稿では、2022年のサイクルとの構造的な比較も確認できます。値動きは段階ごとに一致しています。これは、現在の分析にさらなるコンフルエンスを加えるものです。
LTCは、NeoWaveの枠組みにおいてトリプルコンビネーションを形成しつつあるようです。
全体の構造は、現時点でおよそ50%まで進んでいます。
フェーズ1:最初の下落に続いてジグザグ構造が形成され、コンビネーションの第1フェーズが完了したように見えます。
フェーズ2:このフェーズは現在、進行中のようです。直近の値動きは、ローカル高値から急落するのが特徴の通常型フラットに酷似しています。この動きは、各修正フェーズが異なる構造をとるトリプルコンビネーションの想定される展開と一致しています。
次はどうなるでしょうか?
現在の構造の進展を踏まえると、LTCは今後数か月にわたってサイクルボトムの形成を続けると予想しています。最終的には、収縮型の非制限的なABCDEトライアングルで構造が完了し、最終的な底値は20~24ドルの範囲内で形成される可能性があります。
引用元の投稿では、2022年のサイクルとの構造的な比較も確認できます。値動きは段階ごとに一致しています。これは、現在の分析にさらなるコンフルエンスを加えるものです。
1
1.3k
·
--
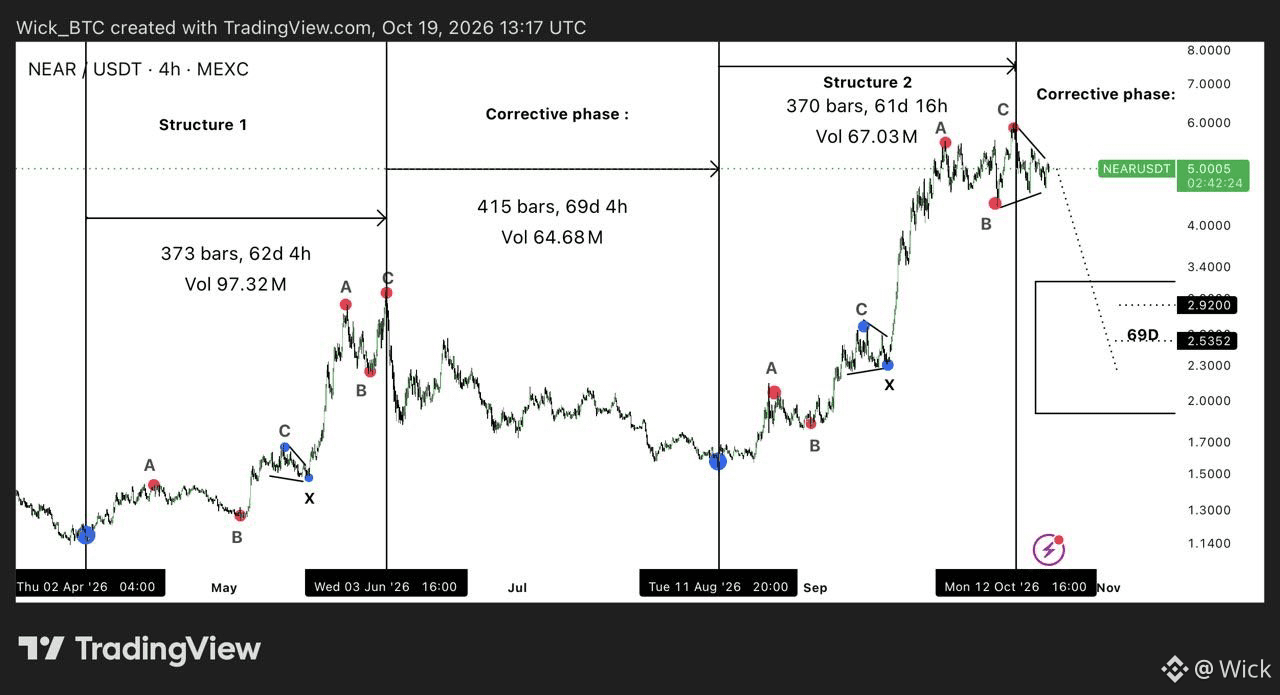
$NEAR LTF 4時間足アップデート:
NeoWaveのフレームワークに基づくと、現在の価格構造はダブルジグザグの複合パターンを形成しつつあるように見えます。各局面は似たパターンをたどっており、上位時間足ではこれらの局面が組み合わさり、より大きなダブルジグザグ構造を形成する可能性があります。
現時点で確認できている内容は以下のとおりです。
構造1:62日と4時間続いたダブルジグザグの後、69日と4時間続く調整局面があり、その間に価格は最終的に約50%下落しました。
構造2:その調整局面が終了した後、価格は再び別のダブルジグザグの複合パターンを形成し始めました。この構造は現在までに61日と16時間続いており、すでに値動きに弱さの兆候が見られます。
現在の構造が62〜63日の時間枠に近づくにつれ、今後1日以内にもう一度大幅な下落が始まる可能性があります。
もちろん、タイミングが完璧に一致することはありません。しかし、構造の類似性とタイミングの一致がますます明確になっており、引き続き注視すべきシナリオだと考えています。
想定どおりにパターンが展開し続けるなら、現在の構造の後には、前回と同様に約69日続く別の調整局面が訪れる可能性があります。その場合、現在の水準からさらに50〜60%下落し、$NEAR は3ドル、あるいはそれ以下まで下落する可能性があります。
$NEAR LTF 4時間足アップデート:
NeoWaveのフレームワークに基づくと、現在の価格構造はダブルジグザグの複合パターンを形成しつつあるように見えます。各局面は似たパターンをたどっており、上位時間足ではこれらの局面が組み合わさり、より大きなダブルジグザグ構造を形成する可能性があります。
現時点で確認できている内容は以下のとおりです。
構造1:62日と4時間続いたダブルジグザグの後、69日と4時間続く調整局面があり、その間に価格は最終的に約50%下落しました。
構造2:その調整局面が終了した後、価格は再び別のダブルジグザグの複合パターンを形成し始めました。この構造は現在までに61日と16時間続いており、すでに値動きに弱さの兆候が見られます。
現在の構造が62〜63日の時間枠に近づくにつれ、今後1日以内にもう一度大幅な下落が始まる可能性があります。
もちろん、タイミングが完璧に一致することはありません。しかし、構造の類似性とタイミングの一致がますます明確になっており、引き続き注視すべきシナリオだと考えています。
想定どおりにパターンが展開し続けるなら、現在の構造の後には、前回と同様に約69日続く別の調整局面が訪れる可能性があります。その場合、現在の水準からさらに50〜60%下落し、$NEAR は3ドル、あるいはそれ以下まで下落する可能性があります。
NeoWaveのフレームワークに基づくと、現在の価格構造はダブルジグザグの複合パターンを形成しつつあるように見えます。各局面は似たパターンをたどっており、上位時間足ではこれらの局面が組み合わさり、より大きなダブルジグザグ構造を形成する可能性があります。
現時点で確認できている内容は以下のとおりです。
構造1:62日と4時間続いたダブルジグザグの後、69日と4時間続く調整局面があり、その間に価格は最終的に約50%下落しました。
構造2:その調整局面が終了した後、価格は再び別のダブルジグザグの複合パターンを形成し始めました。この構造は現在までに61日と16時間続いており、すでに値動きに弱さの兆候が見られます。
現在の構造が62〜63日の時間枠に近づくにつれ、今後1日以内にもう一度大幅な下落が始まる可能性があります。
もちろん、タイミングが完璧に一致することはありません。しかし、構造の類似性とタイミングの一致がますます明確になっており、引き続き注視すべきシナリオだと考えています。
想定どおりにパターンが展開し続けるなら、現在の構造の後には、前回と同様に約69日続く別の調整局面が訪れる可能性があります。その場合、現在の水準からさらに50〜60%下落し、$NEAR は3ドル、あるいはそれ以下まで下落する可能性があります。
3
3.1k
·
--
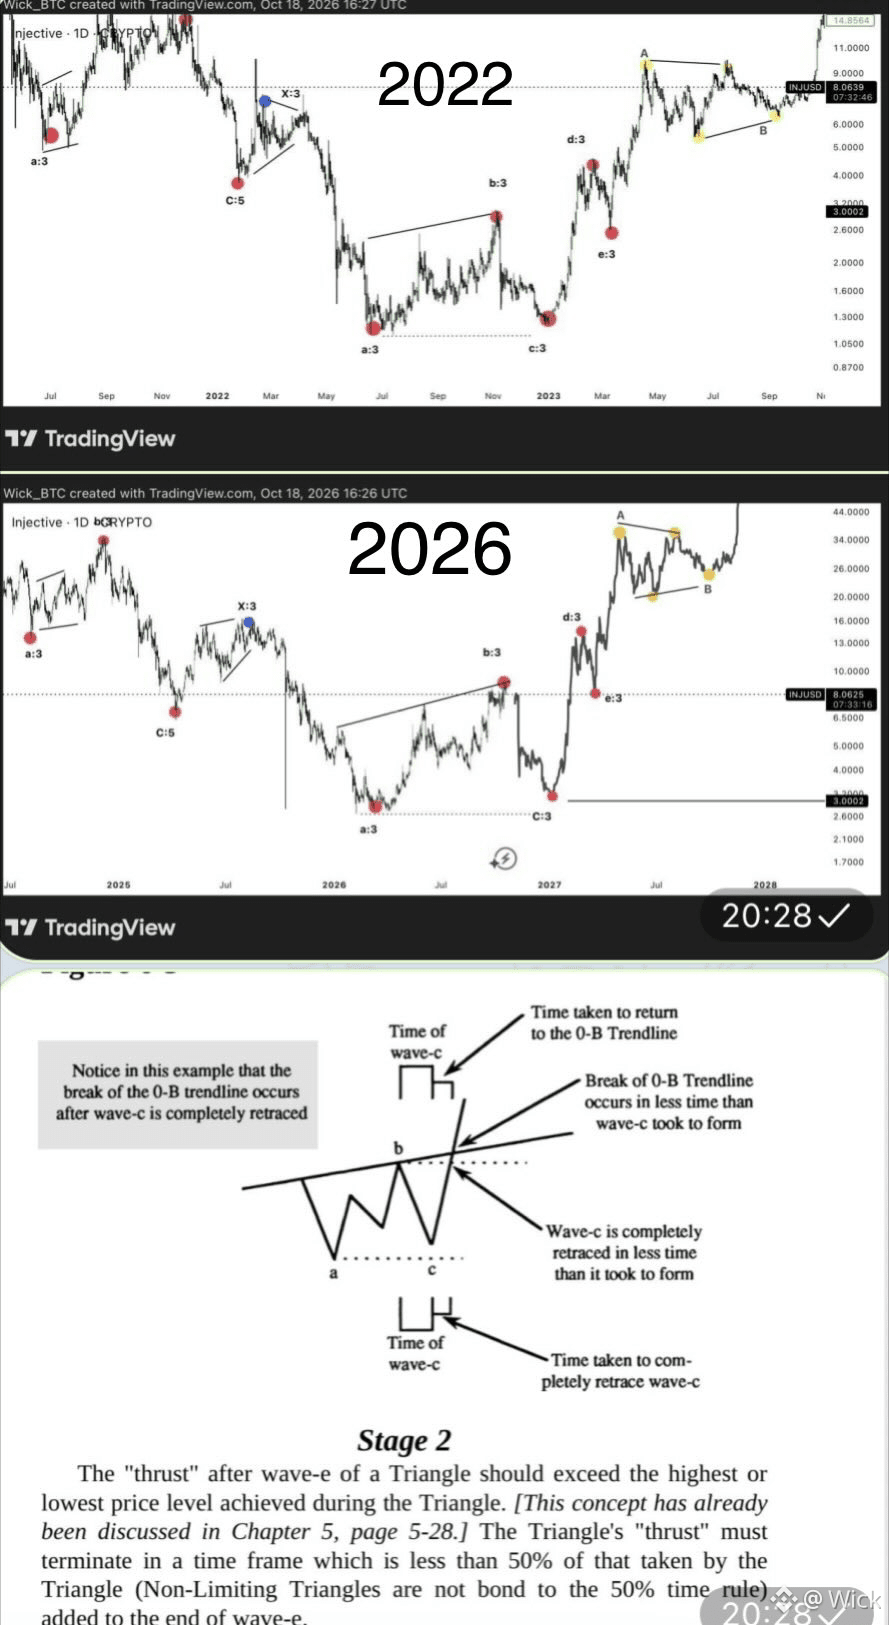
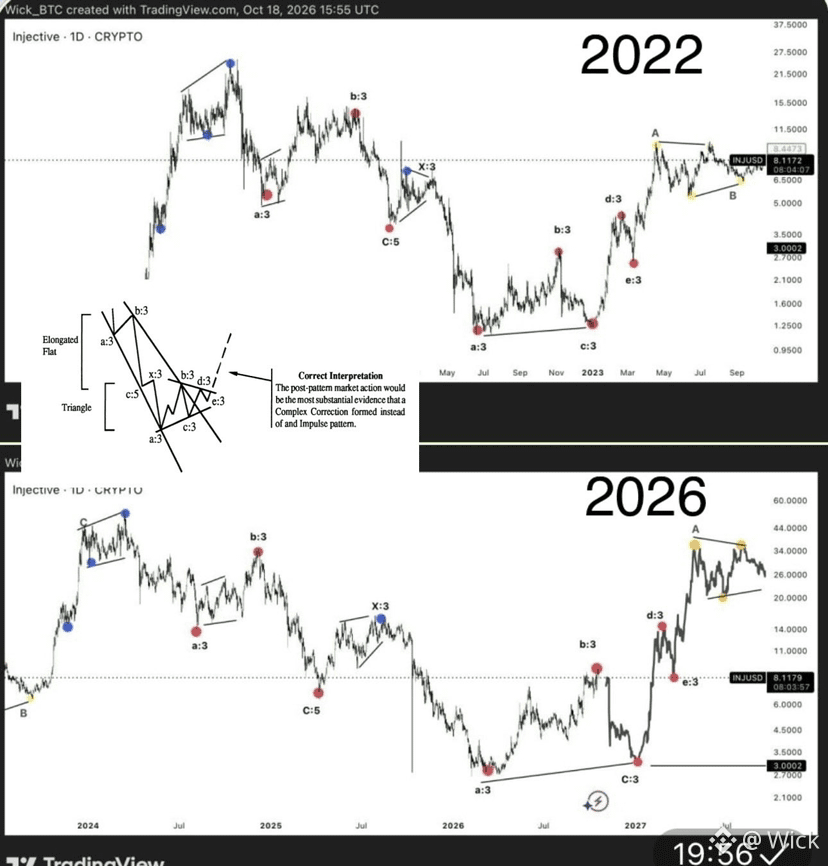
$INJ :詳細アップデート:引用投稿への補足:
もう一度下落の動き、つまり波(C)がまだ控えている可能性があります。その場合、INJは過去の底値圏、あるいはその少し上まで戻る展開が考えられます。2.7~3ドル
2022年にも似た展開が見られました。波(C)によって価格が過去の安値付近まで戻った後、より大きな調整構造がさらに進行しました。
現在の構造は、こうした過去のパターンと似た展開を示しているようです。次の大きな強気サイクルが始まる前に、この最後の下落が起こるシナリオに注目することが重要です。
$INJ :詳細アップデート:引用投稿への補足:
もう一度下落の動き、つまり波(C)がまだ控えている可能性があります。その場合、INJは過去の底値圏、あるいはその少し上まで戻る展開が考えられます。2.7~3ドル
2022年にも似た展開が見られました。波(C)によって価格が過去の安値付近まで戻った後、より大きな調整構造がさらに進行しました。
現在の構造は、こうした過去のパターンと似た展開を示しているようです。次の大きな強気サイクルが始まる前に、この最後の下落が起こるシナリオに注目することが重要です。
もう一度下落の動き、つまり波(C)がまだ控えている可能性があります。その場合、INJは過去の底値圏、あるいはその少し上まで戻る展開が考えられます。2.7~3ドル
2022年にも似た展開が見られました。波(C)によって価格が過去の安値付近まで戻った後、より大きな調整構造がさらに進行しました。
現在の構造は、こうした過去のパターンと似た展開を示しているようです。次の大きな強気サイクルが始まる前に、この最後の下落が起こるシナリオに注目することが重要です。
2
1.2k
·
--
$INJ HTFアップデート:ボトム目標の修正+スイングショート開始:
覚えている方もいると思いますが、以前のINJのボトム目標は約1.20ドルでした。しかし、最新の値動きを分析し、現在の構造を改めて評価した結果、予測を修正しました。
新たなボトム目標は2.70~3.00ドルの範囲で、現在の水準から約70~72%下落する可能性があります。
今回の修正に至った理由は次のとおりです。
NEoWaveの枠組みでは、現在の構造はダブルコンビネーションとして形成されつつあるように見えます。2022年の構造と比較することで、より大きな修正局面の中でINJがどの位置にあるのかを理解しやすくなります。
特に興味深いのは、現在の構造が2022年のパターンと引き続き似た展開をたどり、各段階が同じような順序で進んでいる点です。
現在のダブルコンビネーションは、完成に近づいているようです。ただし、INJが次の大きな強気サイクルに入る前に、最後の下落インパルスが前回のボトムゾーンに向かい、2.70~3.00ドルに達する可能性を想定しています。
2022年の構造を振り返ると、同様の展開が見られます。B波の後、価格はC波で下落し、前回のボトムゾーンまで戻って、そこをわずかに上回りました。その後、価格はD波とE波を形成してから、新たな強気サイクルへ移行しました。
INJも同じような道筋をたどる可能性があると考えています。より大きな構造が完成する前に、最後の修正下落が残っているかもしれません。
トレード計画:
この分析と予測した構造への確信に基づき、$INJのスイングショートを開始することにしました。
最初のエントリー:約8.060ドル
追加購入(DCA)の可能性:約9.00ドル(相場が機会を与えた場合)
目標ゾーン:2.70~3.00ドル
INJがこの水準に到達したら、より大きな修正構造が完了し、新たな強気局面が始まる兆候がないか、注意深く見ていきます。
$INJ HTFアップデート:ボトム目標の修正+スイングショート開始:
覚えている方もいると思いますが、以前のINJのボトム目標は約1.20ドルでした。しかし、最新の値動きを分析し、現在の構造を改めて評価した結果、予測を修正しました。
新たなボトム目標は2.70~3.00ドルの範囲で、現在の水準から約70~72%下落する可能性があります。
今回の修正に至った理由は次のとおりです。
NEoWaveの枠組みでは、現在の構造はダブルコンビネーションとして形成されつつあるように見えます。2022年の構造と比較することで、より大きな修正局面の中でINJがどの位置にあるのかを理解しやすくなります。
特に興味深いのは、現在の構造が2022年のパターンと引き続き似た展開をたどり、各段階が同じような順序で進んでいる点です。
現在のダブルコンビネーションは、完成に近づいているようです。ただし、INJが次の大きな強気サイクルに入る前に、最後の下落インパルスが前回のボトムゾーンに向かい、2.70~3.00ドルに達する可能性を想定しています。
2022年の構造を振り返ると、同様の展開が見られます。B波の後、価格はC波で下落し、前回のボトムゾーンまで戻って、そこをわずかに上回りました。その後、価格はD波とE波を形成してから、新たな強気サイクルへ移行しました。
INJも同じような道筋をたどる可能性があると考えています。より大きな構造が完成する前に、最後の修正下落が残っているかもしれません。
トレード計画:
この分析と予測した構造への確信に基づき、$INJ のスイングショートを開始することにしました。
最初のエントリー:約8.060ドル
追加購入(DCA)の可能性:約9.00ドル(相場が機会を与えた場合)
目標ゾーン:2.70~3.00ドル
INJがこの水準に到達したら、より大きな修正構造が完了し、新たな強気局面が始まる兆候がないか、注意深く見ていきます。
覚えている方もいると思いますが、以前のINJのボトム目標は約1.20ドルでした。しかし、最新の値動きを分析し、現在の構造を改めて評価した結果、予測を修正しました。
新たなボトム目標は2.70~3.00ドルの範囲で、現在の水準から約70~72%下落する可能性があります。
今回の修正に至った理由は次のとおりです。
NEoWaveの枠組みでは、現在の構造はダブルコンビネーションとして形成されつつあるように見えます。2022年の構造と比較することで、より大きな修正局面の中でINJがどの位置にあるのかを理解しやすくなります。
特に興味深いのは、現在の構造が2022年のパターンと引き続き似た展開をたどり、各段階が同じような順序で進んでいる点です。
現在のダブルコンビネーションは、完成に近づいているようです。ただし、INJが次の大きな強気サイクルに入る前に、最後の下落インパルスが前回のボトムゾーンに向かい、2.70~3.00ドルに達する可能性を想定しています。
2022年の構造を振り返ると、同様の展開が見られます。B波の後、価格はC波で下落し、前回のボトムゾーンまで戻って、そこをわずかに上回りました。その後、価格はD波とE波を形成してから、新たな強気サイクルへ移行しました。
INJも同じような道筋をたどる可能性があると考えています。より大きな構造が完成する前に、最後の修正下落が残っているかもしれません。
トレード計画:
この分析と予測した構造への確信に基づき、$INJ のスイングショートを開始することにしました。
最初のエントリー:約8.060ドル
追加購入(DCA)の可能性:約9.00ドル(相場が機会を与えた場合)
目標ゾーン:2.70~3.00ドル
INJがこの水準に到達したら、より大きな修正構造が完了し、新たな強気局面が始まる兆候がないか、注意深く見ていきます。
1
447
·
--
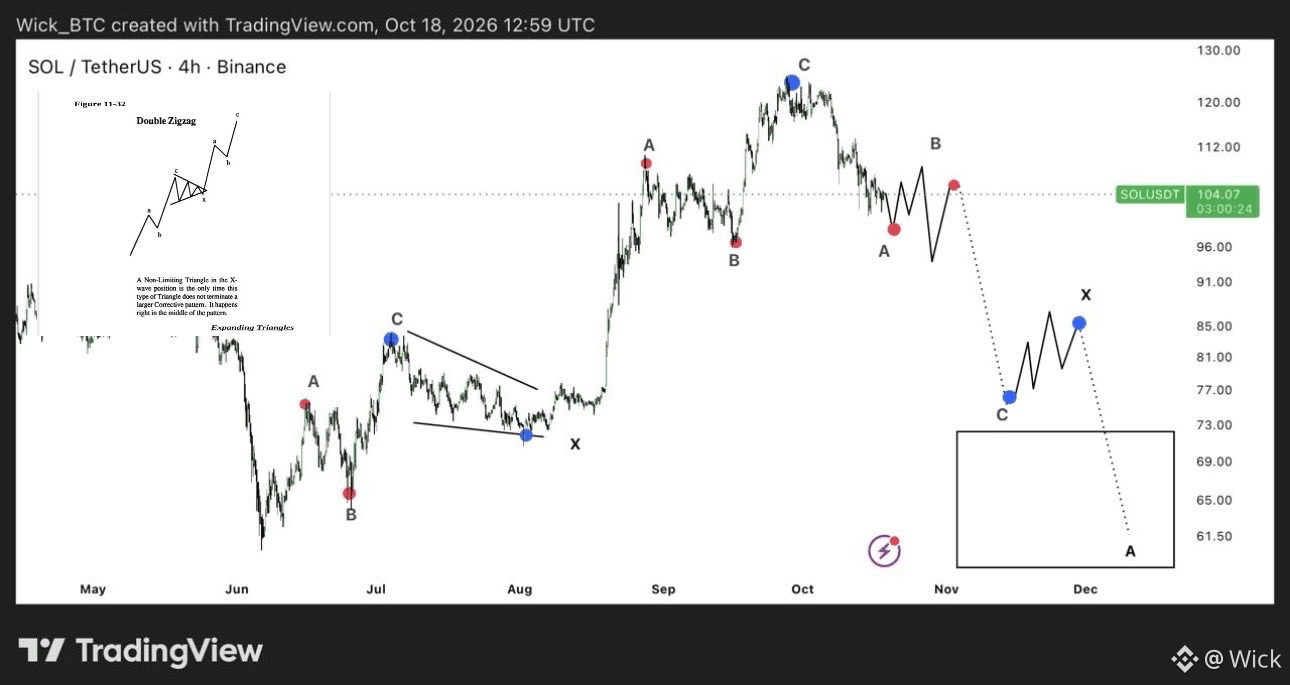
$SOL : LTF 4H
NEoWaveの枠組みでは、現在のSOLの構造はダブル・ジグザグとして形成されつつあるようです。
この解釈を裏付ける主な特徴の一つは、構造の中間に位置するX波の中で形成されている非制限三角形です。NEoWaveの枠組みによると、このタイプの三角形は、より大きな修正パターンを終わらせることなく、ダブル・ジグザグの内部に現れることがあります。
現在、両方のジグザグが完成したように見えることから、SOLは現在の構造の終わりに近づいており、その後、次の修正局面が始まる可能性があります。
$SOL : LTF 4H
NEoWaveの枠組みでは、現在のSOLの構造はダブル・ジグザグとして形成されつつあるようです。
この解釈を裏付ける主な特徴の一つは、構造の中間に位置するX波の中で形成されている非制限三角形です。NEoWaveの枠組みによると、このタイプの三角形は、より大きな修正パターンを終わらせることなく、ダブル・ジグザグの内部に現れることがあります。
現在、両方のジグザグが完成したように見えることから、SOLは現在の構造の終わりに近づいており、その後、次の修正局面が始まる可能性があります。
NEoWaveの枠組みでは、現在のSOLの構造はダブル・ジグザグとして形成されつつあるようです。
この解釈を裏付ける主な特徴の一つは、構造の中間に位置するX波の中で形成されている非制限三角形です。NEoWaveの枠組みによると、このタイプの三角形は、より大きな修正パターンを終わらせることなく、ダブル・ジグザグの内部に現れることがあります。
現在、両方のジグザグが完成したように見えることから、SOLは現在の構造の終わりに近づいており、その後、次の修正局面が始まる可能性があります。
1
768
·
--
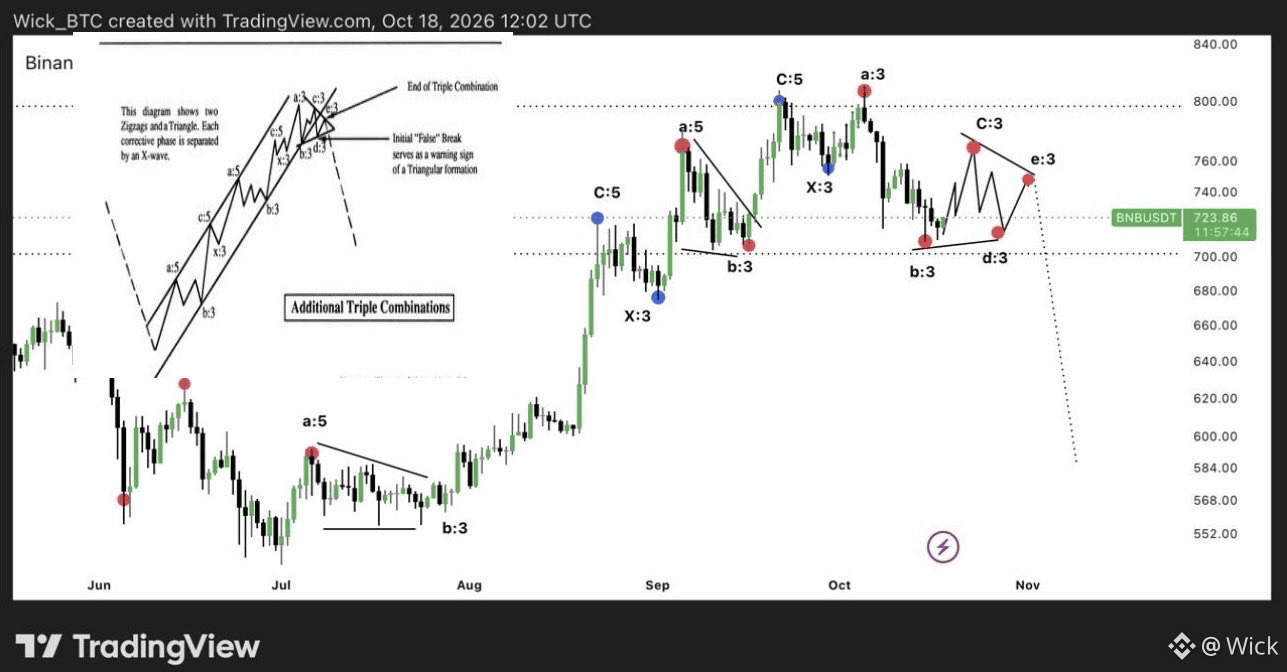
$BNB LTFの最新情報:
現在のBNBの値動きは、NEoWaveのフレームワークにおけるトリプルコンビネーションとして展開しているようです。
直近の安値以降、2つのジグザグを確認できます。それぞれの修正局面はX波で区切られており、修正がより複雑な形へと進化している可能性を示唆しています。
今回の展開で特に興味深いのは、高値付近でブレイクアウトの形が形成されつつあることです。これはトライアングル形成の初期シグナルとなる可能性があり、トリプルコンビネーションの最後の構成要素となるかもしれません。
この解釈が正しければ、トライアングルの完成はトリプルコンビネーション全体の終了と、次の修正局面への移行を示す可能性があります。その結果、より大きな下落への道が開かれるかもしれません。
$BNB LTFの最新情報:
現在のBNBの値動きは、NEoWaveのフレームワークにおけるトリプルコンビネーションとして展開しているようです。
直近の安値以降、2つのジグザグを確認できます。それぞれの修正局面はX波で区切られており、修正がより複雑な形へと進化している可能性を示唆しています。
今回の展開で特に興味深いのは、高値付近でブレイクアウトの形が形成されつつあることです。これはトライアングル形成の初期シグナルとなる可能性があり、トリプルコンビネーションの最後の構成要素となるかもしれません。
この解釈が正しければ、トライアングルの完成はトリプルコンビネーション全体の終了と、次の修正局面への移行を示す可能性があります。その結果、より大きな下落への道が開かれるかもしれません。
現在のBNBの値動きは、NEoWaveのフレームワークにおけるトリプルコンビネーションとして展開しているようです。
直近の安値以降、2つのジグザグを確認できます。それぞれの修正局面はX波で区切られており、修正がより複雑な形へと進化している可能性を示唆しています。
今回の展開で特に興味深いのは、高値付近でブレイクアウトの形が形成されつつあることです。これはトライアングル形成の初期シグナルとなる可能性があり、トリプルコンビネーションの最後の構成要素となるかもしれません。
この解釈が正しければ、トライアングルの完成はトリプルコンビネーション全体の終了と、次の修正局面への移行を示す可能性があります。その結果、より大きな下落への道が開かれるかもしれません。
1
160
·
--
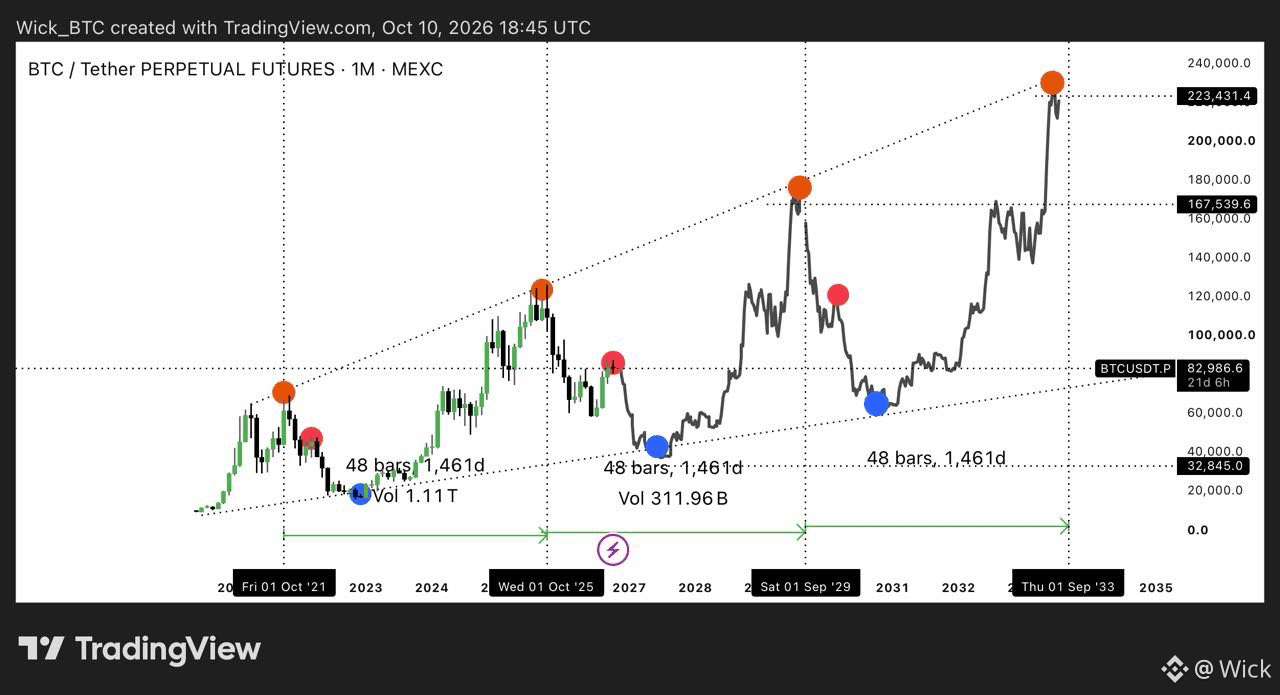
$BTC :これは、ビットコインの価格構造が線形(対数ではない)スケールで2033年までどのように推移する可能性があるかを示したものです。
4年サイクルは今も健在です。
オレンジの点:主要なサイクルのピーク。
赤い点:「底を打った」「強気相場が始まった」と人々が叫び始める場所。
2022年には約48Kドル、現在のサイクルでは再び約87Kドルのあたりに、同じ赤い点のパターンを示しました。さらに、このパターンが繰り返される可能性のある次のエリアも予測しました。
青い点:本当のサイクルの底。
$BTC :これは、ビットコインの価格構造が線形(対数ではない)スケールで2033年までどのように推移する可能性があるかを示したものです。
4年サイクルは今も健在です。
オレンジの点:主要なサイクルのピーク。
赤い点:「底を打った」「強気相場が始まった」と人々が叫び始める場所。
2022年には約48Kドル、現在のサイクルでは再び約87Kドルのあたりに、同じ赤い点のパターンを示しました。さらに、このパターンが繰り返される可能性のある次のエリアも予測しました。
青い点:本当のサイクルの底。
4年サイクルは今も健在です。
オレンジの点:主要なサイクルのピーク。
赤い点:「底を打った」「強気相場が始まった」と人々が叫び始める場所。
2022年には約48Kドル、現在のサイクルでは再び約87Kドルのあたりに、同じ赤い点のパターンを示しました。さらに、このパターンが繰り返される可能性のある次のエリアも予測しました。
青い点:本当のサイクルの底。
72
ログインして、さらにコンテンツを読む
厳選トピックで世界の暗号資産トレーダーの仲間入り
⚡️ 暗号資産に関する最新かつ有益な情報が見つかります。
💬 世界最大の暗号資産取引所から信頼されています。
👍 認証を受けたクリエイターから、有益なインサイトを得られます。
メール / 電話番号
トレンドトピック
BTCRebounds80K
閲覧回数 66,806
708人が討論中
ビットコイン最新情報:私はまだ弱気です。その理由はこちら! 🚨⚠️
皆さんもご覧になったように、BTCは75,700ドル付近から反発し、81,000ドルに到達しました。まず市場はロング勢を罠にはめ、その後ショート勢も罠にはめました。
私は依然として弱気です。まず、皆さんご存じのとおり、今日の米中間選挙では民主党が勝利しました。私の見方では、この結果は市場にとって弱材料です。
短期的には市場が不安定な状態を保ち、望むだけ多くのトレーダーを罠にはめる可能性があります。しかし、それによって市場全体の見通しが変わるわけではありません。
今後、重要なイベントがいくつか控えています。米国の非農業部門雇用者数(11月6日)、米国のCPIインフレ率(11月10日)、米国のPPI(11月13日)、米国の小売売上高(11月17日)、FOMC議事要旨(11月18日)、米国のPCEインフレ率(11月25日)、連邦準備制度理事会(FRB)の金利見通し、米ドル指数(DXY)、米国債利回り、ナスダックの動向、ビットコインETFの資金フロー、そして続いているイラン・イスラエル間の地政学的な情勢などです。これらはすべて、ビットコインと暗号資産市場全体に大きな影響を及ぼす可能性があります。
ただし、ビットコインの最近の値動きに浮かれすぎないでください。テクニカル面で言えば、まだ大きな上昇の動きはありません。昨日、BTCは80,000ドルから82,000ドルの間で取引され、今日も依然として同じようなレンジにあります。
強気に転じたいのであれば、それはあなたの自由です。
以前の投稿で、BTCには75,000ドル/76,000ドルのゾーンにテクニカルサポートがあり、価格はそのサポートから反発して80,000ドルに向けて戻したと明確に説明しました。しかし、これは以前に私が触れていなかったことではありません。実際、BTCが80,000ドル、81,000ドル、さらには82,000ドルに向かう可能性があると、投稿で何度も述べてきました。
それでも、私は依然として弱気です。
弱気の見通しを裏付ける理由は一つだけではありません。理由はいくつもあり、すでに以前の投稿で説明しています。
今のところ、BTCが74,000ドルを下回るのを引き続き待ちます。これはかなり近いうちに起こり得ると考えています。私の見方では、このような調整は市場にとっても必要です。
暗号資産に関するアドバイスが必要な方は、気軽にお知らせください。
#BTCRebounds80K
Strategic Adviser
·いいね:29件
·閲覧回数 32k
Binance98PercentReplenished
閲覧回数 40,464
558人が討論中
USMidterms-WhatAreMarketsExpecting?
閲覧回数 346,859
2,074人が討論中