
ZeroBlock
4.9k 投稿

ZeroBlock
報告
ユーザーをブロック
BTC LOVER GOLD TRADER , SQUARE CRATOR
取引を発注
高頻度トレーダー
1.2年
238 フォロー
25.2K+ フォロワー
13.1K+ いいね
投稿
ポートフォリオ
すべて
動画
ライブ
·
--
記事
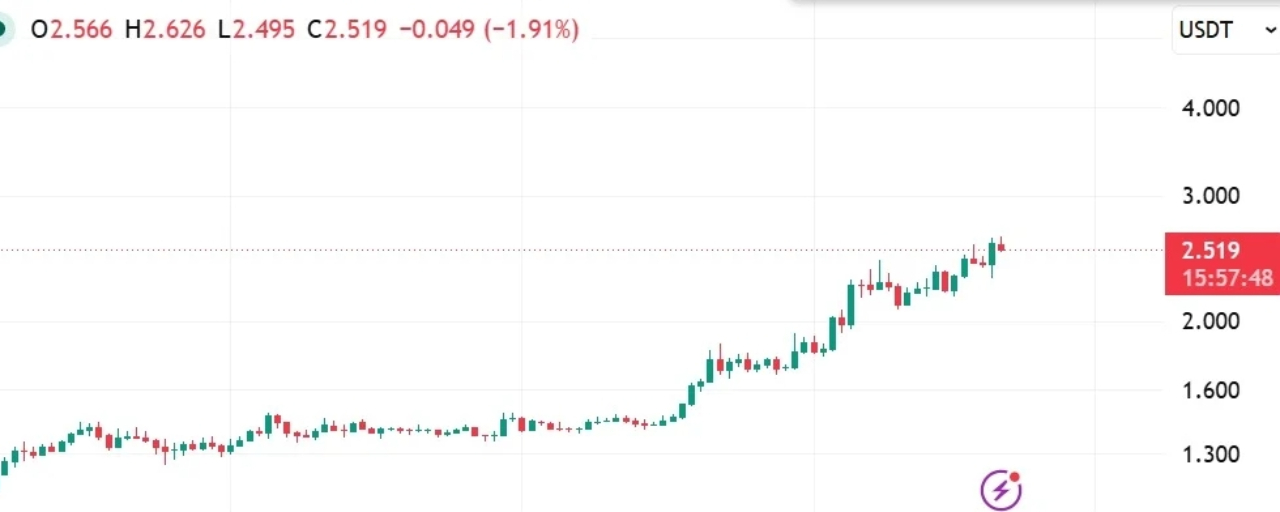
PancakeSwapが10カ月ぶりの高値に到達—なぜ$2.80がCAKEの次の目標なのかCAKEは深刻なテストに到達
私がCAKEに惹かれたのは、単に日次で9%上昇したことだけではありません。
重要なのは、その下で起きている価格の値動きとアクティビティの組み合わせです。
CAKEは約2.60ドルまで押し上げられ、その後2.50ドル付近まで引き戻されました。これは2025年11月以来で見られた最高水準でした。
この動きは、PancakeSwapがプリ・アクセス・ポータルを導入し、公開ローンチの前にユーザーがプライベート企業に触れられるようにしたことを受けて起きました。
しかし、発表だけでラリーを支えられるとは私は考えていません。
私にとってより強いシグナルはスポットのアクティビティです。
PancakeSwapが10カ月ぶりの高値に到達—なぜ$2.80がCAKEの次の目標なのか
CAKEは深刻なテストに到達
私がCAKEに惹かれたのは、単に日次で9%上昇したことだけではありません。
重要なのは、その下で起きている価格の値動きとアクティビティの組み合わせです。
CAKEは約2.60ドルまで押し上げられ、その後2.50ドル付近まで引き戻されました。これは2025年11月以来で見られた最高水準でした。
この動きは、PancakeSwapがプリ・アクセス・ポータルを導入し、公開ローンチの前にユーザーがプライベート企業に触れられるようにしたことを受けて起きました。
しかし、発表だけでラリーを支えられるとは私は考えていません。
私にとってより強いシグナルはスポットのアクティビティです。
私がCAKEに惹かれたのは、単に日次で9%上昇したことだけではありません。
重要なのは、その下で起きている価格の値動きとアクティビティの組み合わせです。
CAKEは約2.60ドルまで押し上げられ、その後2.50ドル付近まで引き戻されました。これは2025年11月以来で見られた最高水準でした。
この動きは、PancakeSwapがプリ・アクセス・ポータルを導入し、公開ローンチの前にユーザーがプライベート企業に触れられるようにしたことを受けて起きました。
しかし、発表だけでラリーを支えられるとは私は考えていません。
私にとってより強いシグナルはスポットのアクティビティです。
889
·
--
記事
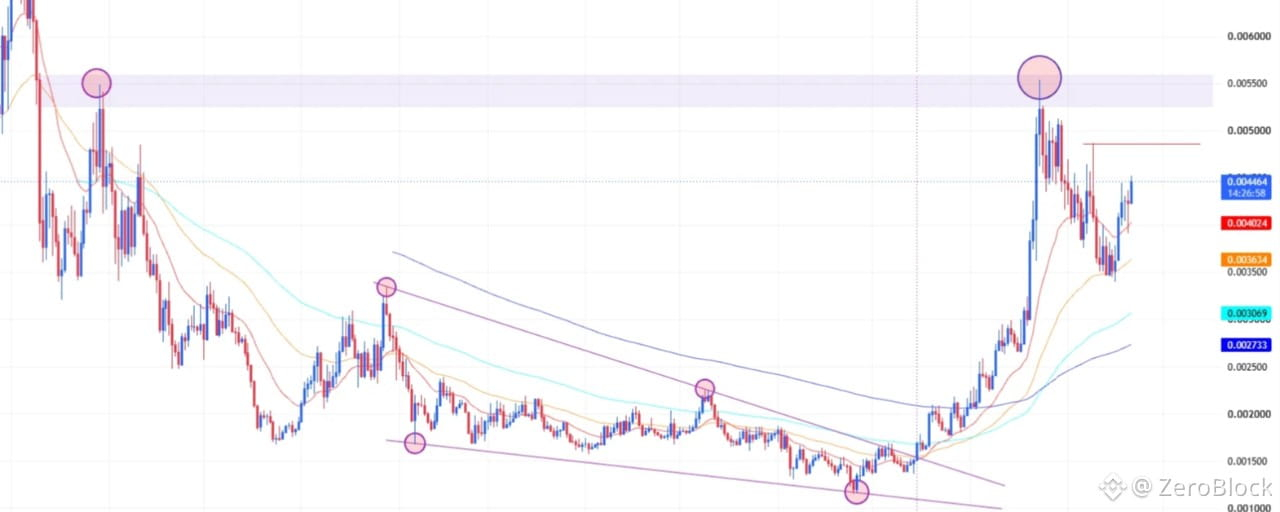
Pump.funの効果? プラットフォームの活動がPUMPの10%反発を後押ししたPUMP はプラットフォームのアクティビティテストを実施
PUMPで私の目を引いたのは、この10%の値動きが、実際の活動の増加と同時に起きている点です。
Pump.funでの活動が活発になり、資金が再びミームコインへ回り始めたことで、PUMPは上昇しました。
取引高も約8.9%増加して、およそ179Mドルになりました。
しかし、私にとって面白いのは出来高“だけ”ではありません。
プラットフォームの指標は。
ネットワーク収益は過去24時間で約761Kドルに到達し、アクティブアドレスはおよそ86Kまで増加しました。
それは、価格チャートの裏側では投機的な取引だけではない、何かが起きていることを示しています。
Pump.funの効果? プラットフォームの活動がPUMPの10%反発を後押しした
PUMP はプラットフォームのアクティビティテストを実施
PUMPで私の目を引いたのは、この10%の値動きが、実際の活動の増加と同時に起きている点です。
Pump.funでの活動が活発になり、資金が再びミームコインへ回り始めたことで、PUMPは上昇しました。
取引高も約8.9%増加して、およそ179Mドルになりました。
しかし、私にとって面白いのは出来高“だけ”ではありません。
プラットフォームの指標は。
ネットワーク収益は過去24時間で約761Kドルに到達し、アクティブアドレスはおよそ86Kまで増加しました。
それは、価格チャートの裏側では投機的な取引だけではない、何かが起きていることを示しています。
PUMPで私の目を引いたのは、この10%の値動きが、実際の活動の増加と同時に起きている点です。
Pump.funでの活動が活発になり、資金が再びミームコインへ回り始めたことで、PUMPは上昇しました。
取引高も約8.9%増加して、およそ179Mドルになりました。
しかし、私にとって面白いのは出来高“だけ”ではありません。
プラットフォームの指標は。
ネットワーク収益は過去24時間で約761Kドルに到達し、アクティブアドレスはおよそ86Kまで増加しました。
それは、価格チャートの裏側では投機的な取引だけではない、何かが起きていることを示しています。
1
288
·
--
記事
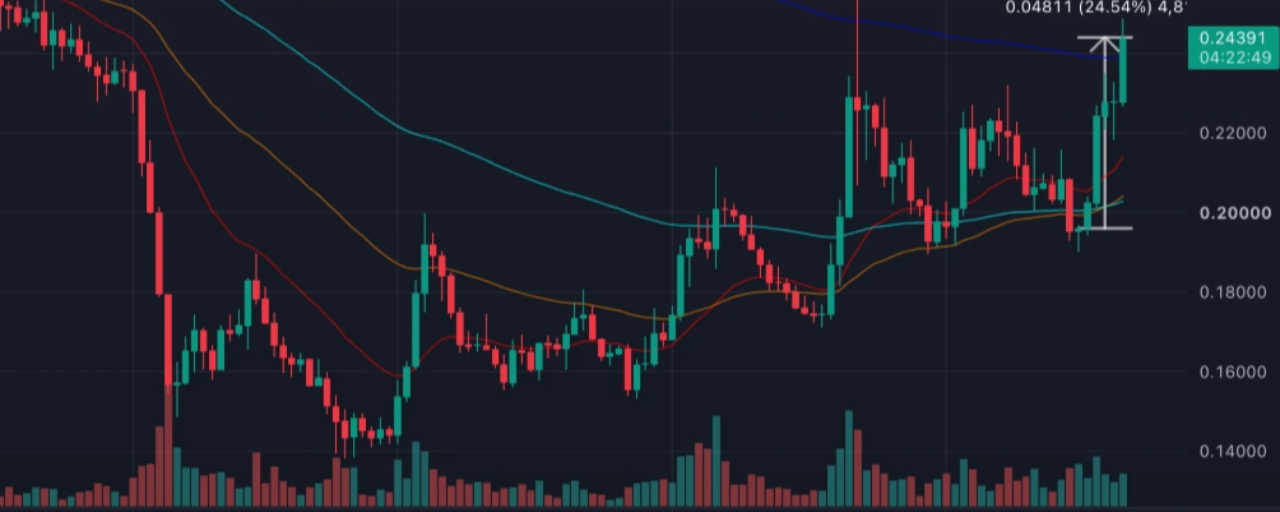
Cardano価格は買い圧がADAに戻ってきたことで$0.24を回復ADAはついに$0.24を取り戻しました
ADAについて私の注意を引いたのは、7%のデイリー上昇ではありません。
その背後にあるのは水準です。
今月初めにADAはおよそ$0.196から約$0.244まで押し上げられました。これは約24%の回復で、さらに価格は$0.239付近の200日移動平均を上回るところまで到達しています。
しかし、それをまだ確定的なトレンド転換とは呼ばないでしょう。
重要なのは、ブレイクアウトの後に何が起こるかです。
$0.239から$0.24のゾーンは、過去のリカバリー局面では上値の天井になっていました。ADAは現在そこを上回ったため、市場は「古いレジスタンスがサポートに変わった」ことを証明する必要があります。
Cardano価格は買い圧がADAに戻ってきたことで$0.24を回復
ADAはついに$0.24を取り戻しました
ADAについて私の注意を引いたのは、7%のデイリー上昇ではありません。
その背後にあるのは水準です。
今月初めにADAはおよそ$0.196から約$0.244まで押し上げられました。これは約24%の回復で、さらに価格は$0.239付近の200日移動平均を上回るところまで到達しています。
しかし、それをまだ確定的なトレンド転換とは呼ばないでしょう。
重要なのは、ブレイクアウトの後に何が起こるかです。
$0.239から$0.24のゾーンは、過去のリカバリー局面では上値の天井になっていました。ADAは現在そこを上回ったため、市場は「古いレジスタンスがサポートに変わった」ことを証明する必要があります。
ADAについて私の注意を引いたのは、7%のデイリー上昇ではありません。
その背後にあるのは水準です。
今月初めにADAはおよそ$0.196から約$0.244まで押し上げられました。これは約24%の回復で、さらに価格は$0.239付近の200日移動平均を上回るところまで到達しています。
しかし、それをまだ確定的なトレンド転換とは呼ばないでしょう。
重要なのは、ブレイクアウトの後に何が起こるかです。
$0.239から$0.24のゾーンは、過去のリカバリー局面では上値の天井になっていました。ADAは現在そこを上回ったため、市場は「古いレジスタンスがサポートに変わった」ことを証明する必要があります。
1
1.2k
·
--
記事
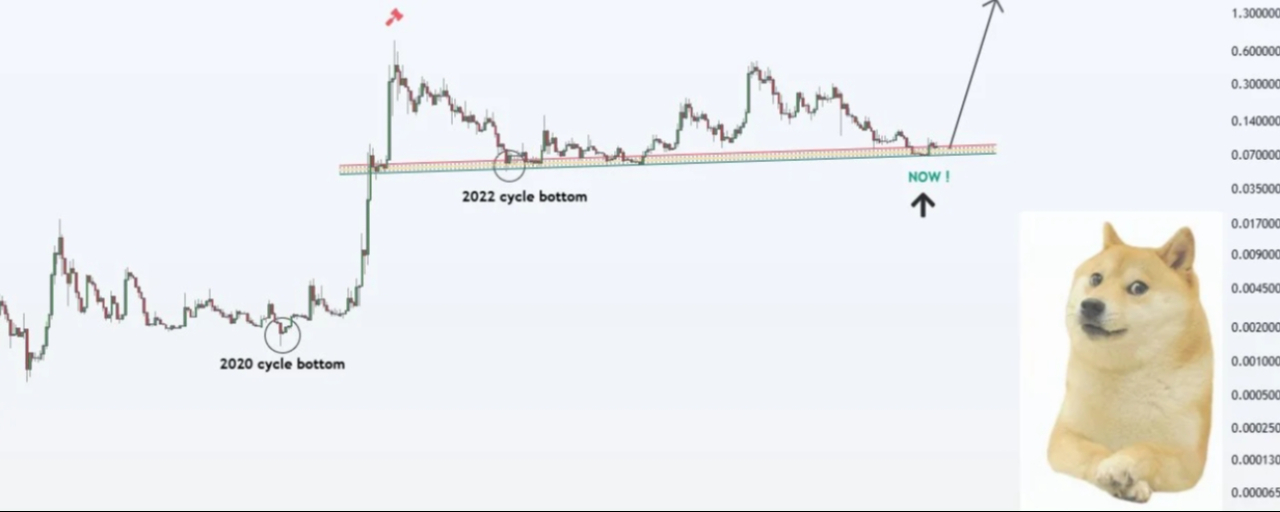
ドージコインの底はここ?なぜDOGEは0.10ドルを上抜ける可能性があるのかDOGE、底固めテスト
私がDOGEで注目したのは、市場がどれだけすでに洗い流されているかです。
DOGEは1月に0.156ドルあたりまで到達し、その後0.067ドル前後まで下落しました。これは2026年の高値からの大幅なリセットです。
今、価格は0.092ドル付近まで回復してきています。
興味深いのは、この回復がいくつかの長期のシグナルのあたりで起きていることです。
10日RSIは回復を始める前に極端に沈み込んだ水準に達していました。さらに、暗号資産の研究者が、DOGEが0.08ドルを下回った後にCVDDシグナルが出たことも指摘しています。
ドージコインの底はここ?なぜDOGEは0.10ドルを上抜ける可能性があるのか
DOGE、底固めテスト
私がDOGEで注目したのは、市場がどれだけすでに洗い流されているかです。
DOGEは1月に0.156ドルあたりまで到達し、その後0.067ドル前後まで下落しました。これは2026年の高値からの大幅なリセットです。
今、価格は0.092ドル付近まで回復してきています。
興味深いのは、この回復がいくつかの長期のシグナルのあたりで起きていることです。
10日RSIは回復を始める前に極端に沈み込んだ水準に達していました。さらに、暗号資産の研究者が、DOGEが0.08ドルを下回った後にCVDDシグナルが出たことも指摘しています。
私がDOGEで注目したのは、市場がどれだけすでに洗い流されているかです。
DOGEは1月に0.156ドルあたりまで到達し、その後0.067ドル前後まで下落しました。これは2026年の高値からの大幅なリセットです。
今、価格は0.092ドル付近まで回復してきています。
興味深いのは、この回復がいくつかの長期のシグナルのあたりで起きていることです。
10日RSIは回復を始める前に極端に沈み込んだ水準に達していました。さらに、暗号資産の研究者が、DOGEが0.08ドルを下回った後にCVDDシグナルが出たことも指摘しています。
313
·
--

記事
CLARITY法は失敗したが、暗号は止まらなかった私の関心を引いたのは、CLARITY法が、単に片方がそれに反対したから失敗したのではないことだ。
上院の手続き上の採決は、反対50、賛成49で終わった。4人の共和党員が、法案が前進するのを阻止するために民主党に加わった。
しかし、より興味深い部分は、投票の前に起きていた。
上院議員とスタッフの間で、交渉に数千時間が費やされたと報じられている。双方が合意に近づいたように見える瞬間もあった。だが、そうした妥協のいくつかは再び崩れ去った。
最大の摩擦の原因は、詳細にあったようだ。
CLARITY法は失敗したが、暗号は止まらなかった
私の関心を引いたのは、CLARITY法が、単に片方がそれに反対したから失敗したのではないことだ。
上院の手続き上の採決は、反対50、賛成49で終わった。4人の共和党員が、法案が前進するのを阻止するために民主党に加わった。
しかし、より興味深い部分は、投票の前に起きていた。
上院議員とスタッフの間で、交渉に数千時間が費やされたと報じられている。双方が合意に近づいたように見える瞬間もあった。だが、そうした妥協のいくつかは再び崩れ去った。
最大の摩擦の原因は、詳細にあったようだ。
上院の手続き上の採決は、反対50、賛成49で終わった。4人の共和党員が、法案が前進するのを阻止するために民主党に加わった。
しかし、より興味深い部分は、投票の前に起きていた。
上院議員とスタッフの間で、交渉に数千時間が費やされたと報じられている。双方が合意に近づいたように見える瞬間もあった。だが、そうした妥協のいくつかは再び崩れ去った。
最大の摩擦の原因は、詳細にあったようだ。
2
1.7k
·
--
記事
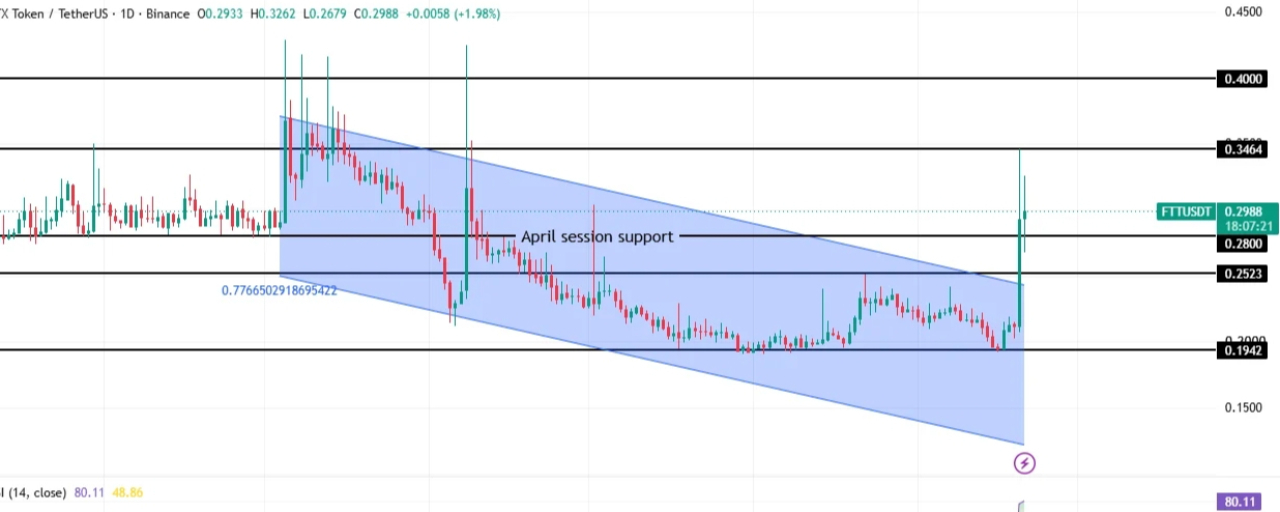
FTX トークンの出来高が 2,187% 爆発、価格は 33% 上昇――FTT のブレイクは続くのか?FTT の 33% 上昇ラリーには出来高の問題がある
FTT はたった1日で 33% も動いたのですが、私の注意を最初に引いたのは価格ではありませんでした。
それが出来事(出来高)でした。
スポット出来高は 2,187% 跳ね上がり、概ね $26.6M になりました。
それは、ずっとずっと落ち着いて取引されていたトークンにとっては極端な活動変化です。
問題は、価格が出来高ほど大きくは上がっていないことです。
たいていそれは、今回の値動きで投機が大きな役割を果たしていることを示しています。
FTT はさらに、複数か月にわたる下降チャネルを上抜けし、$0.2523 の水準を取り戻しました。
FTX トークンの出来高が 2,187% 爆発、価格は 33% 上昇――FTT のブレイクは続くのか?
FTT の 33% 上昇ラリーには出来高の問題がある
FTT はたった1日で 33% も動いたのですが、私の注意を最初に引いたのは価格ではありませんでした。
それが出来事(出来高)でした。
スポット出来高は 2,187% 跳ね上がり、概ね $26.6M になりました。
それは、ずっとずっと落ち着いて取引されていたトークンにとっては極端な活動変化です。
問題は、価格が出来高ほど大きくは上がっていないことです。
たいていそれは、今回の値動きで投機が大きな役割を果たしていることを示しています。
FTT はさらに、複数か月にわたる下降チャネルを上抜けし、$0.2523 の水準を取り戻しました。
FTT はたった1日で 33% も動いたのですが、私の注意を最初に引いたのは価格ではありませんでした。
それが出来事(出来高)でした。
スポット出来高は 2,187% 跳ね上がり、概ね $26.6M になりました。
それは、ずっとずっと落ち着いて取引されていたトークンにとっては極端な活動変化です。
問題は、価格が出来高ほど大きくは上がっていないことです。
たいていそれは、今回の値動きで投機が大きな役割を果たしていることを示しています。
FTT はさらに、複数か月にわたる下降チャネルを上抜けし、$0.2523 の水準を取り戻しました。
3
2.1k
·
--
本人確認中
記事
7日間で177M XRPがバイナンスに殺到――そして、それは売りシグナルではありません177M XRPはバイナンスに入ったが、データはさらに多くを示している
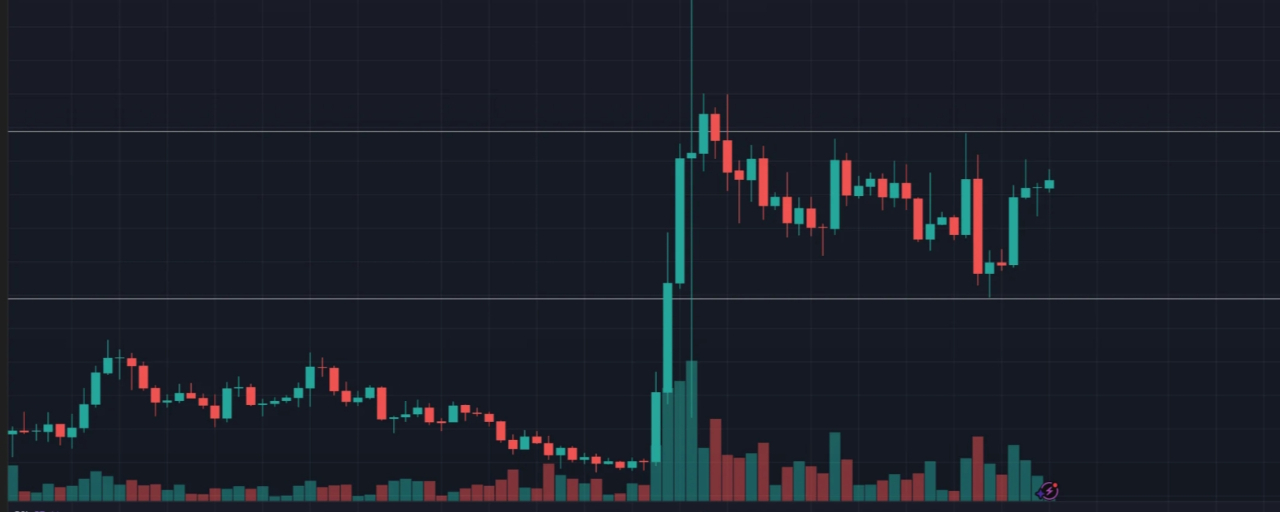
過去1週間でバイナンスへ送られた177M XRPの動きは、一見すると不気味に見えます。
ただ、準備金(リザーブ)のデータは、より興味深い物語を語っていると思います。
9月11日に約91.2M XRPが到着しました。
さらに別の44.5Mが9月16日に到着しました。
そしてさらに9月17日に41.7Mが到着しました。
短期間に1つの取引所へ大量のXRPが流入しています。
簡単な結論としては、誰かが売る準備をしているということになるでしょう。
その結論をまだ出すべきではないと思います。
バイナンスは依然として約2.63B XRPを保有しており、同期間中の準備金の増加はわずか約0.34%にとどまりました。
7日間で177M XRPがバイナンスに殺到――そして、それは売りシグナルではありません
177M XRPはバイナンスに入ったが、データはさらに多くを示している
過去1週間でバイナンスへ送られた177M XRPの動きは、一見すると不気味に見えます。
ただ、準備金(リザーブ)のデータは、より興味深い物語を語っていると思います。
9月11日に約91.2M XRPが到着しました。
さらに別の44.5Mが9月16日に到着しました。
そしてさらに9月17日に41.7Mが到着しました。
短期間に1つの取引所へ大量のXRPが流入しています。
簡単な結論としては、誰かが売る準備をしているということになるでしょう。
その結論をまだ出すべきではないと思います。
バイナンスは依然として約2.63B XRPを保有しており、同期間中の準備金の増加はわずか約0.34%にとどまりました。
過去1週間でバイナンスへ送られた177M XRPの動きは、一見すると不気味に見えます。
ただ、準備金(リザーブ)のデータは、より興味深い物語を語っていると思います。
9月11日に約91.2M XRPが到着しました。
さらに別の44.5Mが9月16日に到着しました。
そしてさらに9月17日に41.7Mが到着しました。
短期間に1つの取引所へ大量のXRPが流入しています。
簡単な結論としては、誰かが売る準備をしているということになるでしょう。
その結論をまだ出すべきではないと思います。
バイナンスは依然として約2.63B XRPを保有しており、同期間中の準備金の増加はわずか約0.34%にとどまりました。
3
1.7k
·
--
記事
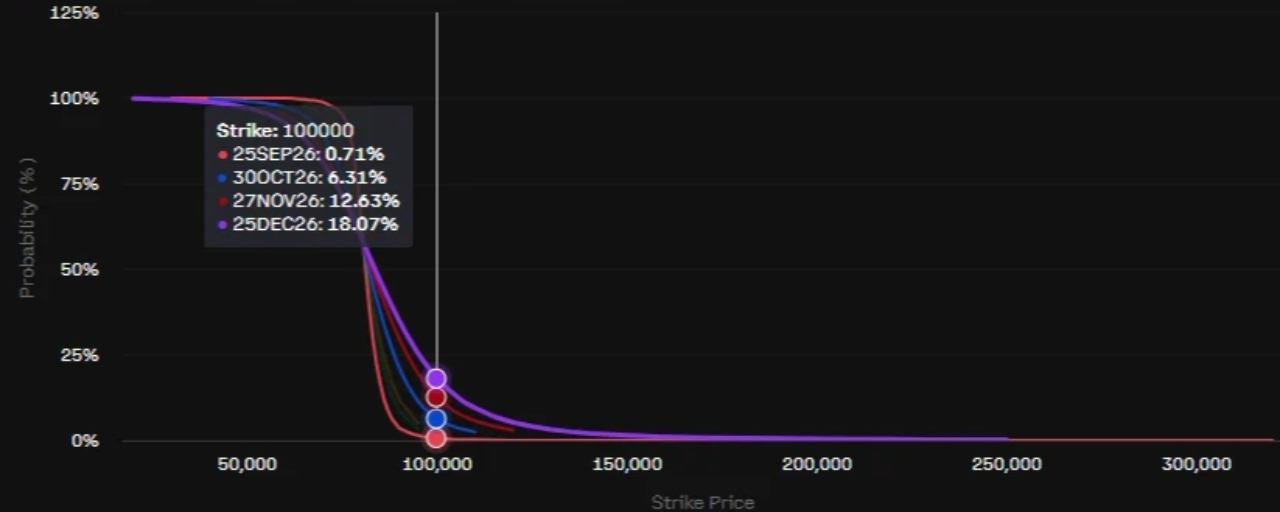
ビットコインの冬は終わりかけているかもしれないが、8.2万ドル($82K)が重要ビットコインが再び8万ドル($80K)を上回って推移しているのは重要に見える。
ただ、より興味深いのは、これが本当に新しいサイクルの始まりなのか、それとも現在のレンジの中でのもう一段強い回復にすぎないのかという点だと思う。
フィデリティのユリエン・ティンメルは、BTCが約1年にわたり6万ドル($60K)を上回って推移していたことから、ビットコインの冬は終わった可能性があると主張している。
ビットコインと金の関係が改善していることも、市場のレジームが変化しつつある別のシグナルだと彼は指摘している。
それは興味深い仮説だ。
しかし、私はそれでも価格がそれを裏付けてくれるのを確認したい。
ビットコインの冬は終わりかけているかもしれないが、8.2万ドル($82K)が重要
ビットコインが再び8万ドル($80K)を上回って推移しているのは重要に見える。
ただ、より興味深いのは、これが本当に新しいサイクルの始まりなのか、それとも現在のレンジの中でのもう一段強い回復にすぎないのかという点だと思う。
フィデリティのユリエン・ティンメルは、BTCが約1年にわたり6万ドル($60K)を上回って推移していたことから、ビットコインの冬は終わった可能性があると主張している。
ビットコインと金の関係が改善していることも、市場のレジームが変化しつつある別のシグナルだと彼は指摘している。
それは興味深い仮説だ。
しかし、私はそれでも価格がそれを裏付けてくれるのを確認したい。
ただ、より興味深いのは、これが本当に新しいサイクルの始まりなのか、それとも現在のレンジの中でのもう一段強い回復にすぎないのかという点だと思う。
フィデリティのユリエン・ティンメルは、BTCが約1年にわたり6万ドル($60K)を上回って推移していたことから、ビットコインの冬は終わった可能性があると主張している。
ビットコインと金の関係が改善していることも、市場のレジームが変化しつつある別のシグナルだと彼は指摘している。
それは興味深い仮説だ。
しかし、私はそれでも価格がそれを裏付けてくれるのを確認したい。
278
·
--
記事
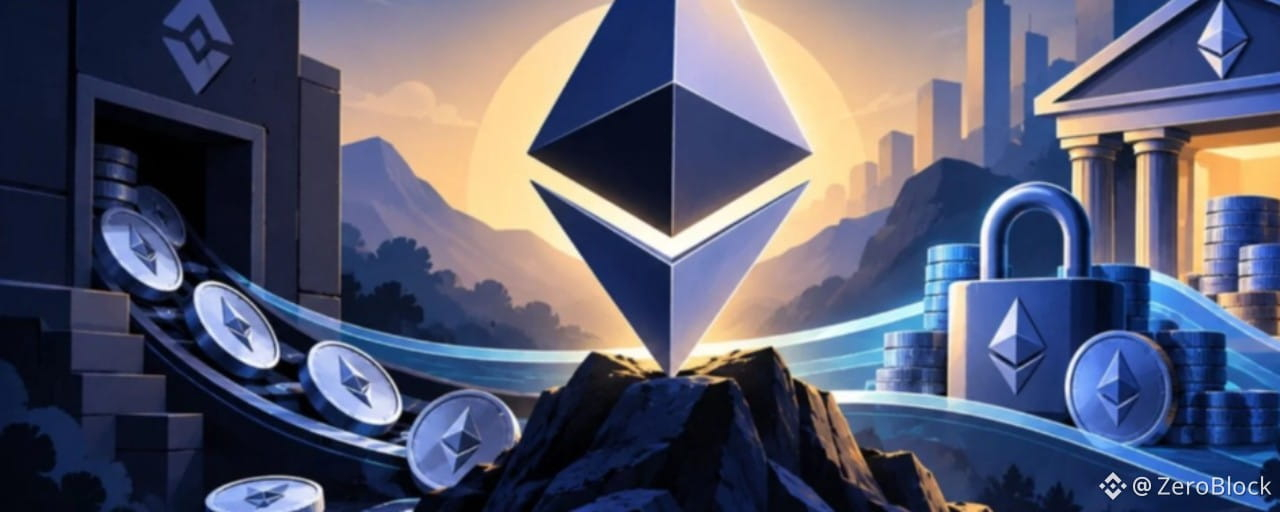
ETHの2,500ドル奪回には供給の物語があるETHが2,500ドルを再び上回るのは興味深いです。
ただ、より重要なのは価格チャートの外側で起きていることだと思います。
取引所に置かれているETHの量は、長い間減少し続けています。
2025年5月以降、取引所の残高は報道によれば約1,480万ETHから約2,570万ETHへと減少したとされています。
データの数値は、方向性のほうが正確な数値より重要なので、注意深く確認する価値があります。
取引所で直ちに利用できるETHが少ないほど、需要が突然増加したときに流動性の供給が少なくなる可能性があります。
ETHの2,500ドル奪回には供給の物語がある
ETHが2,500ドルを再び上回るのは興味深いです。
ただ、より重要なのは価格チャートの外側で起きていることだと思います。
取引所に置かれているETHの量は、長い間減少し続けています。
2025年5月以降、取引所の残高は報道によれば約1,480万ETHから約2,570万ETHへと減少したとされています。
データの数値は、方向性のほうが正確な数値より重要なので、注意深く確認する価値があります。
取引所で直ちに利用できるETHが少ないほど、需要が突然増加したときに流動性の供給が少なくなる可能性があります。
ただ、より重要なのは価格チャートの外側で起きていることだと思います。
取引所に置かれているETHの量は、長い間減少し続けています。
2025年5月以降、取引所の残高は報道によれば約1,480万ETHから約2,570万ETHへと減少したとされています。
データの数値は、方向性のほうが正確な数値より重要なので、注意深く確認する価値があります。
取引所で直ちに利用できるETHが少ないほど、需要が突然増加したときに流動性の供給が少なくなる可能性があります。
62
·
--

記事
SOLはチャート設定以上のものを持っている
最近のアルトコインのローテーションの後、私はSolanaをより注意深く見てきた。
面白いのは、SOLが市場の動きに連動しているだけではないことだ。
その動きの下にいくつかの数字があり、10月の準備がより興味深くなっている。
今週SOLは約9%上昇し、だいたい$114に到達した。
同時に、SOL対ETHの比率は約4%上昇した。
それは、資金が単にアルトコインへ戻っているわけではないことを示している。
その一部には、Solanaへの選好が表れている。
ネットワークデータはさらに興味深い。
Solanaは8月に、投票に関係しない取引を約52億件処理した。
最近のアルトコインのローテーションの後、私はSolanaをより注意深く見てきた。
面白いのは、SOLが市場の動きに連動しているだけではないことだ。
その動きの下にいくつかの数字があり、10月の準備がより興味深くなっている。
今週SOLは約9%上昇し、だいたい$114に到達した。
同時に、SOL対ETHの比率は約4%上昇した。
それは、資金が単にアルトコインへ戻っているわけではないことを示している。
その一部には、Solanaへの選好が表れている。
ネットワークデータはさらに興味深い。
Solanaは8月に、投票に関係しない取引を約52億件処理した。
SOLはチャート設定以上のものを持っている
最近のアルトコインのローテーションの後、私はSolanaをより注意深く見てきた。
面白いのは、SOLが市場の動きに連動しているだけではないことだ。
その動きの下にいくつかの数字があり、10月の準備がより興味深くなっている。
今週SOLは約9%上昇し、だいたい$114に到達した。
同時に、SOL対ETHの比率は約4%上昇した。
それは、資金が単にアルトコインへ戻っているわけではないことを示している。
その一部には、Solanaへの選好が表れている。
ネットワークデータはさらに興味深い。
Solanaは8月に、投票に関係しない取引を約52億件処理した。
313
·
--

記事
XRP vs ソラナ vs カルダノ — 9月に最も良い動きをするアルトコインはどれ?SOLには勢いがあるが、XRPとADAには余地がある
ここで私の注意を引いたのは、「どのアルトコインが最も強気か」ではありません。
それら3つが、直近の市場の動きの後にそれぞれどう違って振る舞っているか、です。
ソラナは、このグループの中で最も強かった。
水曜以降、SOLは約16%上昇し、ADAは約14%、XRPは約11%上昇しました。
さらに重要なのは、SOLがすでに8月下旬の高値を上回って押し上げていることです。
それが重要なのは、その高値はビットコインが押し戻され、ほとんどのアルトコイン市場を押し下げた“前”に形成されていたからです。
XRP vs ソラナ vs カルダノ — 9月に最も良い動きをするアルトコインはどれ?
SOLには勢いがあるが、XRPとADAには余地がある
ここで私の注意を引いたのは、「どのアルトコインが最も強気か」ではありません。
それら3つが、直近の市場の動きの後にそれぞれどう違って振る舞っているか、です。
ソラナは、このグループの中で最も強かった。
水曜以降、SOLは約16%上昇し、ADAは約14%、XRPは約11%上昇しました。
さらに重要なのは、SOLがすでに8月下旬の高値を上回って押し上げていることです。
それが重要なのは、その高値はビットコインが押し戻され、ほとんどのアルトコイン市場を押し下げた“前”に形成されていたからです。
ここで私の注意を引いたのは、「どのアルトコインが最も強気か」ではありません。
それら3つが、直近の市場の動きの後にそれぞれどう違って振る舞っているか、です。
ソラナは、このグループの中で最も強かった。
水曜以降、SOLは約16%上昇し、ADAは約14%、XRPは約11%上昇しました。
さらに重要なのは、SOLがすでに8月下旬の高値を上回って押し上げていることです。
それが重要なのは、その高値はビットコインが押し戻され、ほとんどのアルトコイン市場を押し下げた“前”に形成されていたからです。
169
·
--
記事
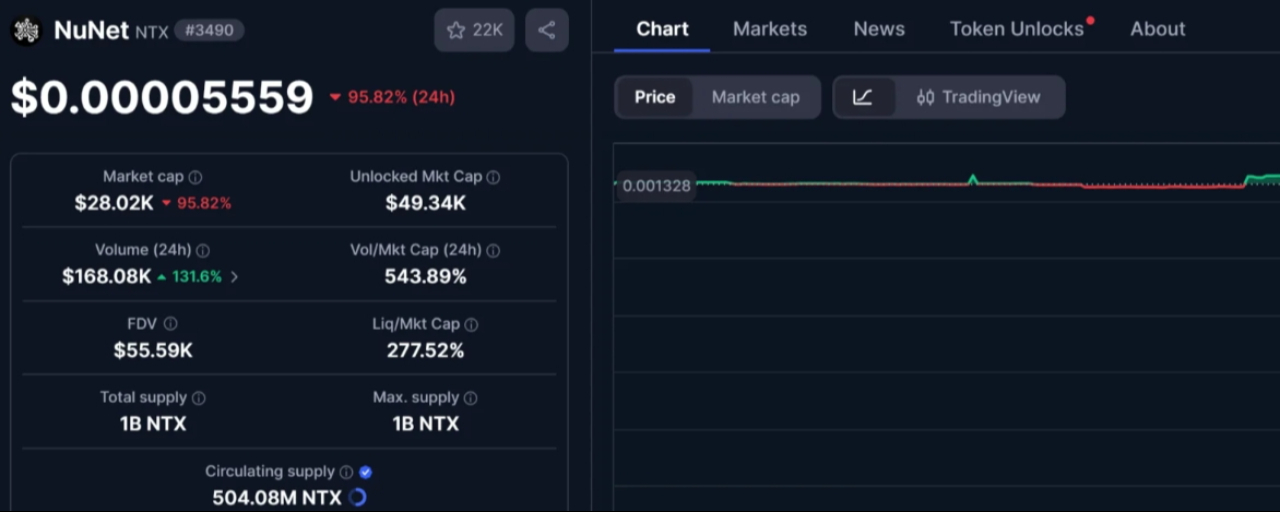
Fetch.aiのエクスプロイト、NTXが95%クラッシュし200万ドルを流出——何が起きた?Fetch.aiのエクスプロイトは一見すると200万ドル規模のハックに見えますが、FETとNTXを分けて見ると、本当の損害がより明確になります。
攻撃者は、トークンコンバーター内の弱い承認チェックを悪用した後、約8.72M FET(およそ154万ドル相当)を引き出しました。
重要な点は、攻撃者が新しいFETを作成しなかったことです。
彼らは既存のトークンを移動させただけでした。
その違いが、おそらくFETが比較的限定的な打撃を受けた理由を説明しています。FETはエクスプロイトの前に約0.149ドルから0.1889ドルまで上昇しており、その後0.1711ドル付近まで下落しました。
Fetch.aiのエクスプロイト、NTXが95%クラッシュし200万ドルを流出——何が起きた?
Fetch.aiのエクスプロイトは一見すると200万ドル規模のハックに見えますが、FETとNTXを分けて見ると、本当の損害がより明確になります。
攻撃者は、トークンコンバーター内の弱い承認チェックを悪用した後、約8.72M FET(およそ154万ドル相当)を引き出しました。
重要な点は、攻撃者が新しいFETを作成しなかったことです。
彼らは既存のトークンを移動させただけでした。
その違いが、おそらくFETが比較的限定的な打撃を受けた理由を説明しています。FETはエクスプロイトの前に約0.149ドルから0.1889ドルまで上昇しており、その後0.1711ドル付近まで下落しました。
攻撃者は、トークンコンバーター内の弱い承認チェックを悪用した後、約8.72M FET(およそ154万ドル相当)を引き出しました。
重要な点は、攻撃者が新しいFETを作成しなかったことです。
彼らは既存のトークンを移動させただけでした。
その違いが、おそらくFETが比較的限定的な打撃を受けた理由を説明しています。FETはエクスプロイトの前に約0.149ドルから0.1889ドルまで上昇しており、その後0.1711ドル付近まで下落しました。
1.2k
·
--
記事
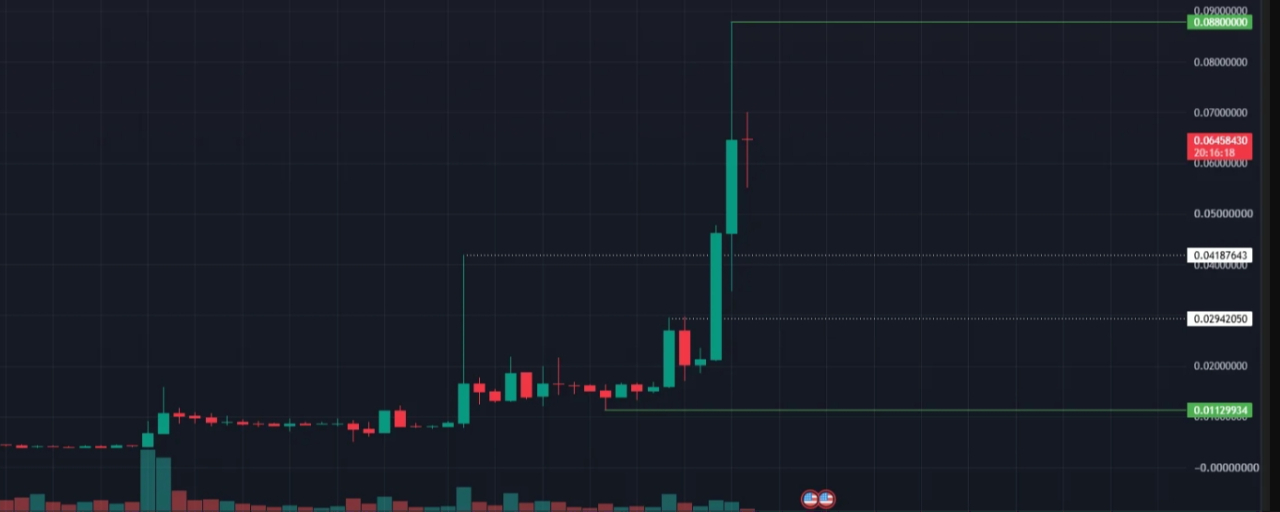
Akedoは21.1Bトークンのアンロック予定:売り圧力への懸念が壮大な週次300%急騰を曇らせるAKEは1週間で約300%も動いており、まさにここが、チャートだけを見て判断するのをやめる地点だと思います。
今回の上昇は攻勢的でした。
AKEは過去24時間で約53%上昇しており、7月に始まった強気の動き以降、価格は高値を維持し続けています。
ただし月曜日は、まったく別の試練が来ます。
約21.1億AKEトークンがアンロック予定です。これは総1000億供給の2.11%にあたり、現在の価格では、そのアンロック価値はおよそ$127Mです。
この数字が重要なのは、現在は総供給のうち約22%しか流通していないからです。
Akedoは21.1Bトークンのアンロック予定:売り圧力への懸念が壮大な週次300%急騰を曇らせる
AKEは1週間で約300%も動いており、まさにここが、チャートだけを見て判断するのをやめる地点だと思います。
今回の上昇は攻勢的でした。
AKEは過去24時間で約53%上昇しており、7月に始まった強気の動き以降、価格は高値を維持し続けています。
ただし月曜日は、まったく別の試練が来ます。
約21.1億AKEトークンがアンロック予定です。これは総1000億供給の2.11%にあたり、現在の価格では、そのアンロック価値はおよそ$127Mです。
この数字が重要なのは、現在は総供給のうち約22%しか流通していないからです。
今回の上昇は攻勢的でした。
AKEは過去24時間で約53%上昇しており、7月に始まった強気の動き以降、価格は高値を維持し続けています。
ただし月曜日は、まったく別の試練が来ます。
約21.1億AKEトークンがアンロック予定です。これは総1000億供給の2.11%にあたり、現在の価格では、そのアンロック価値はおよそ$127Mです。
この数字が重要なのは、現在は総供給のうち約22%しか流通していないからです。
306
·
--
記事
Pi Networkの15%下落を地図化する――3つのシグナルがさらなる下値を示唆PIは9月15日から15%以上下落しており、チャートがその動きが回復しにくい理由を示し始めています。
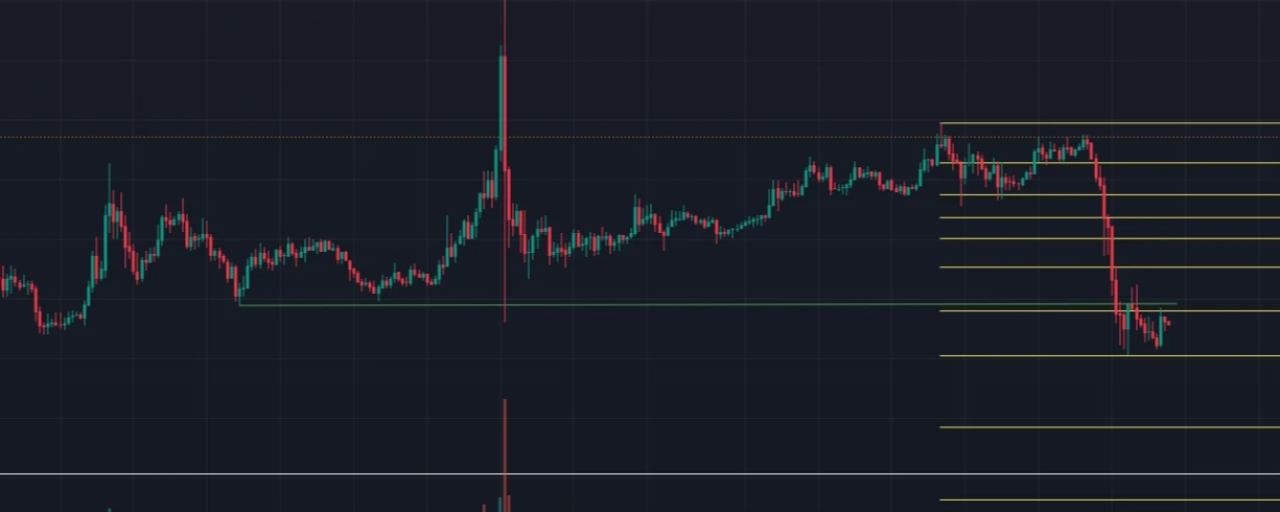
私の注意を引いたのは、$0.10から約$0.083への下落だけではありません。
$0.10が7月以降、何度も価格を拒否してきたという事実があります。
この水準は、心理的な数字以上の意味を持つようになりました。買い手が説得力のあるブレイクアウトを作れずにいる、供給(レジスタンス)ゾーンとして機能しています。
より大きな構造自体も依然として弱い状態です。
PIは2025年6月以降、およそ$0.1395から$0.07の間という、より大きな弱気のスイング構造の中で取引されています。つまり、直近の下落は単独で起きているわけではありません。確立された下落トレンドの中で起きています。
Pi Networkの15%下落を地図化する――3つのシグナルがさらなる下値を示唆
PIは9月15日から15%以上下落しており、チャートがその動きが回復しにくい理由を示し始めています。
私の注意を引いたのは、$0.10から約$0.083への下落だけではありません。
$0.10が7月以降、何度も価格を拒否してきたという事実があります。
この水準は、心理的な数字以上の意味を持つようになりました。買い手が説得力のあるブレイクアウトを作れずにいる、供給(レジスタンス)ゾーンとして機能しています。
より大きな構造自体も依然として弱い状態です。
PIは2025年6月以降、およそ$0.1395から$0.07の間という、より大きな弱気のスイング構造の中で取引されています。つまり、直近の下落は単独で起きているわけではありません。確立された下落トレンドの中で起きています。
私の注意を引いたのは、$0.10から約$0.083への下落だけではありません。
$0.10が7月以降、何度も価格を拒否してきたという事実があります。
この水準は、心理的な数字以上の意味を持つようになりました。買い手が説得力のあるブレイクアウトを作れずにいる、供給(レジスタンス)ゾーンとして機能しています。
より大きな構造自体も依然として弱い状態です。
PIは2025年6月以降、およそ$0.1395から$0.07の間という、より大きな弱気のスイング構造の中で取引されています。つまり、直近の下落は単独で起きているわけではありません。確立された下落トレンドの中で起きています。
1
2.1k
·
--

記事
3400 BTCが戻る中、$320Mハック後にLiquid Networkが再開—次は何?Liquid Networkは$320Mのエクスプロイト後に再稼働しているが、まだ全面的な回復とは呼べない。
見出しの数字は印象的だ。
9月6日のインシデント中に約4,000 BTCが引き出され、現在ではおよそ3,400 BTCが連邦準備(Federation)の準備金に戻ってきている。
これにより、まだ約600 BTCが未回収のままだ。
しかし私にとってより大きいのは、まだ戻っていないものが何かだ。
9月10日以降、ブロック生成と通常の取引は正常に稼働している。ウォレットやエコシステムのサービスも、徐々に復帰している。ユーザーは再びLBTCを移動でき、また一部のサービスではペッグインも復旧している。
3400 BTCが戻る中、$320Mハック後にLiquid Networkが再開—次は何?
Liquid Networkは$320Mのエクスプロイト後に再稼働しているが、まだ全面的な回復とは呼べない。
見出しの数字は印象的だ。
9月6日のインシデント中に約4,000 BTCが引き出され、現在ではおよそ3,400 BTCが連邦準備(Federation)の準備金に戻ってきている。
これにより、まだ約600 BTCが未回収のままだ。
しかし私にとってより大きいのは、まだ戻っていないものが何かだ。
9月10日以降、ブロック生成と通常の取引は正常に稼働している。ウォレットやエコシステムのサービスも、徐々に復帰している。ユーザーは再びLBTCを移動でき、また一部のサービスではペッグインも復旧している。
見出しの数字は印象的だ。
9月6日のインシデント中に約4,000 BTCが引き出され、現在ではおよそ3,400 BTCが連邦準備(Federation)の準備金に戻ってきている。
これにより、まだ約600 BTCが未回収のままだ。
しかし私にとってより大きいのは、まだ戻っていないものが何かだ。
9月10日以降、ブロック生成と通常の取引は正常に稼働している。ウォレットやエコシステムのサービスも、徐々に復帰している。ユーザーは再びLBTCを移動でき、また一部のサービスではペッグインも復旧している。
323
·
--
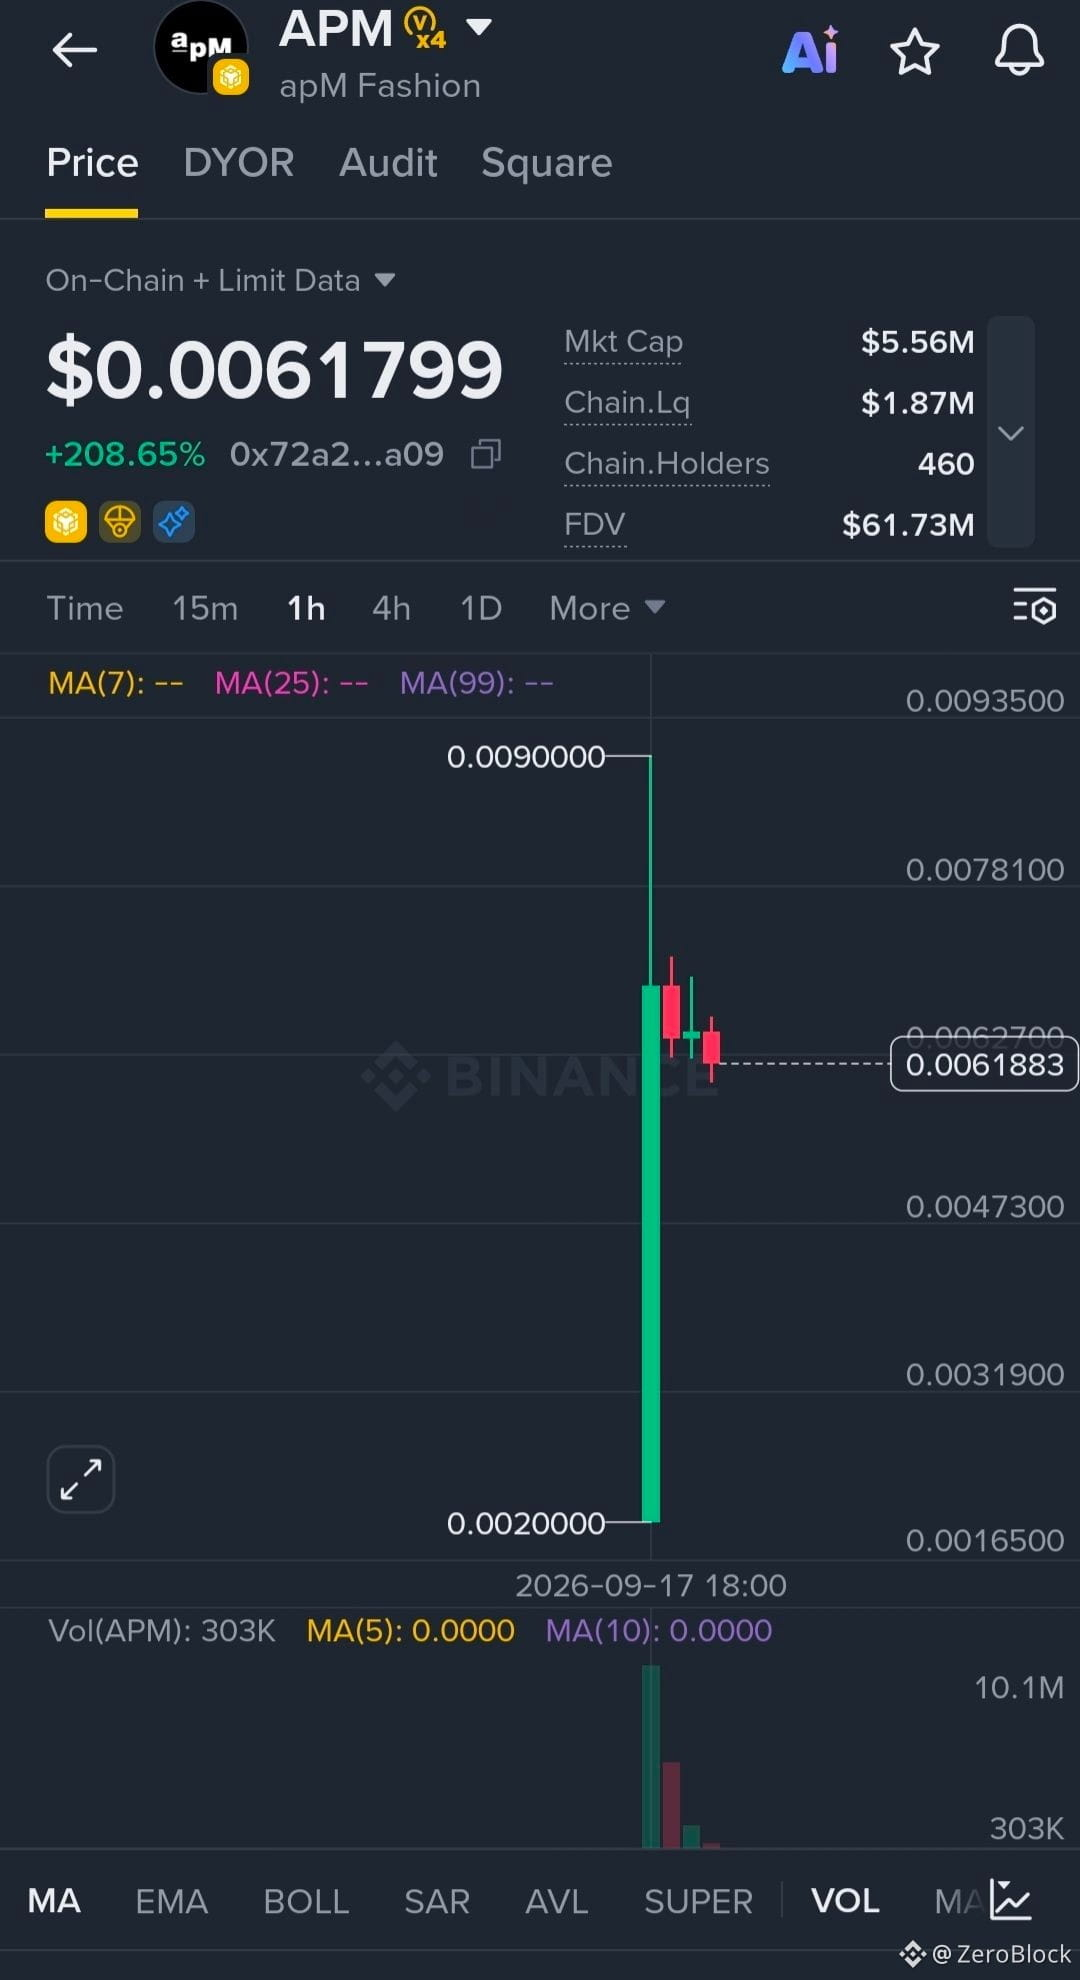
私が最初に注目したのは、オープニングのローソク足でした。APMはある一度の動きで、だいたい$0.0020から$0.0090まで跳ね上がりました。その後、価格は落ち着き、$0.0062付近で値固めを始めています。これは、初期の買い手が利益確定を行い、その後ブレイクアウト後の公正な価格水準を見つけるために新しいトレーダーが動き始めていることを示しています。
今は、次のスパイクを掴みに行くよりも、押し目を待ちたいです。$0.0058から$0.0062のゾーンは、ローソク足の形の出方から見て重要なサポート域に見えます。価格がその水準より上に留まっている限り、直近のスイングハイに向けたもう一段の上昇が起こり得ます。
**エントリー:** $0.0058〜$0.0062
**TP1:** $0.0072
**TP2:** $0.0085〜$0.0090
**SL:** $0.0055を下回ったら
出来高はブレイクアウトのローソク足で最も高かったです。その後、値固めのフェーズでは出来高が減っています。これは価格が動いた後によくある典型的な流れです。次の上方向への押しが期待できる前に、買いの関心が戻ってくるのを見たいです。
もし価格が$0.0070を取り戻せれば、勢いが再び強まるかもしれません。オープニングの高値、だいたい$0.0090付近までの上伸です。価格が$0.0058前後のサポートを割り込むなら、短期の構造が弱まり、新たな強気の動きが来る前に、より深い押し目が見られる可能性があります。
$APM
{alpha}(560x72a22faa6a522c81a8f5d508381e18af3da0921e)
私が最初に注目したのは、オープニングのローソク足でした。APMはある一度の動きで、だいたい$0.0020から$0.0090まで跳ね上がりました。その後、価格は落ち着き、$0.0062付近で値固めを始めています。これは、初期の買い手が利益確定を行い、その後ブレイクアウト後の公正な価格水準を見つけるために新しいトレーダーが動き始めていることを示しています。
今は、次のスパイクを掴みに行くよりも、押し目を待ちたいです。$0.0058から$0.0062のゾーンは、ローソク足の形の出方から見て重要なサポート域に見えます。価格がその水準より上に留まっている限り、直近のスイングハイに向けたもう一段の上昇が起こり得ます。
**エントリー:** $0.0058〜$0.0062
**TP1:** $0.0072
**TP2:** $0.0085〜$0.0090
**SL:** $0.0055を下回ったら
出来高はブレイクアウトのローソク足で最も高かったです。その後、値固めのフェーズでは出来高が減っています。これは価格が動いた後によくある典型的な流れです。次の上方向への押しが期待できる前に、買いの関心が戻ってくるのを見たいです。
もし価格が$0.0070を取り戻せれば、勢いが再び強まるかもしれません。オープニングの高値、だいたい$0.0090付近までの上伸です。価格が$0.0058前後のサポートを割り込むなら、短期の構造が弱まり、新たな強気の動きが来る前に、より深い押し目が見られる可能性があります。
$APM
今は、次のスパイクを掴みに行くよりも、押し目を待ちたいです。$0.0058から$0.0062のゾーンは、ローソク足の形の出方から見て重要なサポート域に見えます。価格がその水準より上に留まっている限り、直近のスイングハイに向けたもう一段の上昇が起こり得ます。
**エントリー:** $0.0058〜$0.0062
**TP1:** $0.0072
**TP2:** $0.0085〜$0.0090
**SL:** $0.0055を下回ったら
出来高はブレイクアウトのローソク足で最も高かったです。その後、値固めのフェーズでは出来高が減っています。これは価格が動いた後によくある典型的な流れです。次の上方向への押しが期待できる前に、買いの関心が戻ってくるのを見たいです。
もし価格が$0.0070を取り戻せれば、勢いが再び強まるかもしれません。オープニングの高値、だいたい$0.0090付近までの上伸です。価格が$0.0058前後のサポートを割り込むなら、短期の構造が弱まり、新たな強気の動きが来る前に、より深い押し目が見られる可能性があります。
$APM
2
687
·
--
記事
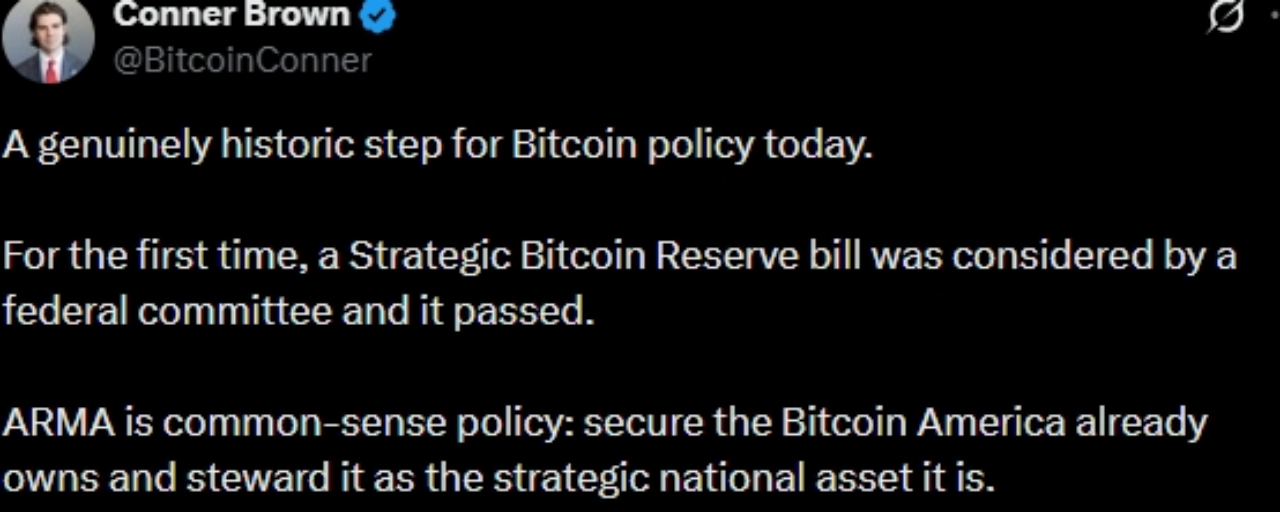
米国のビットコイン準備法案は28対21の賛成で勢いを増す――しかし成立できるのか?米国のビットコイン準備の話は一段と前に進みましたが、市場はこの投票に過度な読みを入れてしまう可能性があると思います。
9月16日、下院金融サービス委員会はH.R. 8957を賛成28、反対21で前進させました。この法案は「American Reserve Modernization Act」であり、財務省の下に戦略的なビットコイン準備(Strategic Bitcoin Reserve)を設けることになります。
私の関心を引いたのは、これは単に米国政府に無制限のビットコイン購入を求める提案ではないという点です。
委員会版では、適格な没収によって連邦政府がすでに保有しているビットコインに焦点を当てています。また、準備に入れるビットコインについて最低20年の保有期間を定めています。
米国のビットコイン準備法案は28対21の賛成で勢いを増す――しかし成立できるのか?
米国のビットコイン準備の話は一段と前に進みましたが、市場はこの投票に過度な読みを入れてしまう可能性があると思います。
9月16日、下院金融サービス委員会はH.R. 8957を賛成28、反対21で前進させました。この法案は「American Reserve Modernization Act」であり、財務省の下に戦略的なビットコイン準備(Strategic Bitcoin Reserve)を設けることになります。
私の関心を引いたのは、これは単に米国政府に無制限のビットコイン購入を求める提案ではないという点です。
委員会版では、適格な没収によって連邦政府がすでに保有しているビットコインに焦点を当てています。また、準備に入れるビットコインについて最低20年の保有期間を定めています。
9月16日、下院金融サービス委員会はH.R. 8957を賛成28、反対21で前進させました。この法案は「American Reserve Modernization Act」であり、財務省の下に戦略的なビットコイン準備(Strategic Bitcoin Reserve)を設けることになります。
私の関心を引いたのは、これは単に米国政府に無制限のビットコイン購入を求める提案ではないという点です。
委員会版では、適格な没収によって連邦政府がすでに保有しているビットコインに焦点を当てています。また、準備に入れるビットコインについて最低20年の保有期間を定めています。
923
ログインして、さらにコンテンツを読む
厳選トピックで世界の暗号資産トレーダーの仲間入り
⚡️ 暗号資産に関する最新かつ有益な情報が見つかります。
💬 世界最大の暗号資産取引所から信頼されています。
👍 認証を受けたクリエイターから、有益なインサイトを得られます。
メール / 電話番号
トレンドトピック
AIStocksWhatNext
閲覧回数 129,053
1,582人が討論中
注目ハッシュタグキャンペーンでトラフィック報酬を「シェア&ウィン」しよう
✨トピック:AI株が上昇し続ける中、ほかにどんな投資チャンスが残っている?
👉参加方法:
ハッシュタグ #AIStocksWhatNext を付けて短い投稿または記事を公開する
強気か弱気かを共有し、AI株の保有または取引を投稿してください—取引ウィジェットを使うと資格を得やすくなる可能性があります。
データやチャートを共有し、AI生成画像を避けることで、投稿をさらに強化できます。
✍️以下の切り口を参考にコンテンツを作成してください:
- Nvidiaは来年のチップ販売が倍増すると述べ、主要なAI企業は記録的な売上を更新し続けています。これを支える計算コストはそれだけでも驚異的です。本当にAI需要は伸びているのか? そして、それはどれくらい続くのでしょうか?AI株は全体的に上昇中。これは本物のブレイクアウトなのか、それとも短期的な戻りなのか?
- 産業のリーダーたちはAI開発のペースを落とすよう求めています。一方でトランプは「AIフォース」を構築する計画で、AIが将来的に米国のGDPの25%を占める可能性があると主張しています。あなたはどちら側ですか? AI株に対する州レベルの後押しは長期的な勝利になりますか?
- あなたはAI株を買っていますか? 取引/保有を、取引シェアリングウィジェットで共有してください。
⏰キャンペーン期間:
- 2026-09-22 7:00 - 2026-09-24 4:00(UTC)
🎁報酬:
- 上記のガイドラインを満たし、100語を超える適格投稿は審査され、ランダムなトラフィックブースト(500〜3,000ビュー)が付与される場合があります。投稿が選ばれた場合は、フィード担当者から通知が届きます。
- Binance Square Officialに記事が掲載されるチャンス
投稿のアイデアが必要ですか? トピックページ #AIStocksWhatNext または Square Guide on How to Post for Better Reach をご覧ください。
Binance Square Official
·いいね:237件
·閲覧回数 435.3k
BitcoinBreaksAboveMayHighNears$86K
閲覧回数 3,178
56人が討論中
DogecoinRises15%
閲覧回数 7,907
356人が討論中