
The_ Observer
9 投稿

The_ Observer
報告
ユーザーをブロック
Independent Crypto Analyst | Technical Analysis & Market Insights. Observing Market Trends, Data over hype and Understanding markets.
0 フォロー
0 フォロワー
1 いいね
投稿
翻訳参照
📉 $AT / USDT Chart Breakdown: Reality Check! 🚨
Let’s cut the noise and look at what the chart is actually telling us. 🧐 I keep it 100% real with you guys—no hopium, just the facts.
Right now, the verdict is clear: THIS CHART IS BEARISH 🔴
Why?
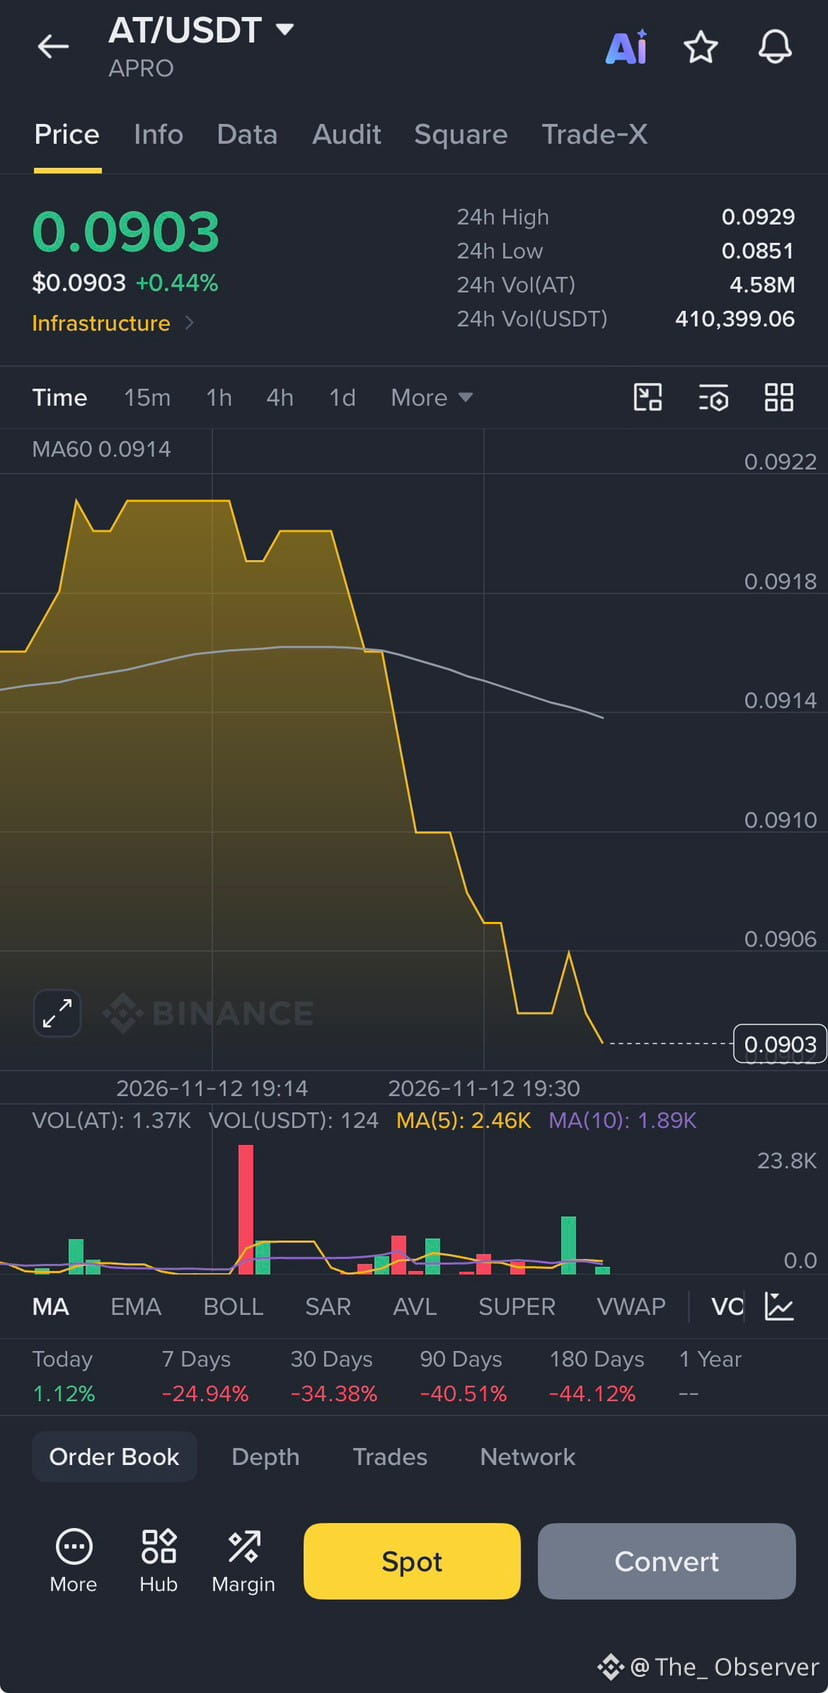
Just look at that structure. We had a sharp rejection from the highs and a brutal stair-step downtrend. The price is currently sitting at 0.0903, completely unable to reclaim the MA60 (0.0914). The macro performance is also weighing heavily, showing a painful -34.38% over the last 30 days. The trend is firmly in the bears' control. 🐻
📊 Key Levels to Watch:
• Resistance (The Ceiling) 🧱: 0.0914 (MA60) is the immediate wall. If bulls can’t break and hold above this, any pump is just a trap. Next major resistance is up at 0.0929 (24h High).
• Support (The Floor) 🛡️: The immediate floor is right here at the current level (0.0903). If this gives way, we are likely looking for new local lows.
🔮 Scenarios:
• 🟢 Bullish Case: We need a massive volume spike to flip that MA60 into support. If buyers step in aggressively, a relief bounce toward 0.0918+ is possible. But right now, momentum is lacking.
• 🔴 Bearish Case: Continued rejection at the MA60 and a breakdown below 0.0900. Look at the volume profile—sellers are still active. A flush to the 0.0851 (24h Low) area is a very realistic scenario if this current support fails.
💡 Overall Outlook:
The trend is your friend, and right now, the friend is pointing down. 📉 Protect your capital, wait for confirmation, and don't try to catch a falling knife without a solid plan.
Are you buying this dip or waiting for a trend reversal? Let me know your thoughts below! 👇💬
#Crypto #AT #TechnicalAnalysis #Binance #Trading #BearMarket 🚀📊
📉 $AT / USDT Chart Breakdown: Reality Check! 🚨
Let’s cut the noise and look at what the chart is actually telling us. 🧐 I keep it 100% real with you guys—no hopium, just the facts.
Right now, the verdict is clear: THIS CHART IS BEARISH 🔴
Why?
Just look at that structure. We had a sharp rejection from the highs and a brutal stair-step downtrend. The price is currently sitting at 0.0903, completely unable to reclaim the MA60 (0.0914). The macro performance is also weighing heavily, showing a painful -34.38% over the last 30 days. The trend is firmly in the bears' control. 🐻
📊 Key Levels to Watch:
• Resistance (The Ceiling) 🧱: 0.0914 (MA60) is the immediate wall. If bulls can’t break and hold above this, any pump is just a trap. Next major resistance is up at 0.0929 (24h High).
• Support (The Floor) 🛡️: The immediate floor is right here at the current level (0.0903). If this gives way, we are likely looking for new local lows.
🔮 Scenarios:
• 🟢 Bullish Case: We need a massive volume spike to flip that MA60 into support. If buyers step in aggressively, a relief bounce toward 0.0918+ is possible. But right now, momentum is lacking.
• 🔴 Bearish Case: Continued rejection at the MA60 and a breakdown below 0.0900. Look at the volume profile—sellers are still active. A flush to the 0.0851 (24h Low) area is a very realistic scenario if this current support fails.
💡 Overall Outlook:
The trend is your friend, and right now, the friend is pointing down. 📉 Protect your capital, wait for confirmation, and don't try to catch a falling knife without a solid plan.
Are you buying this dip or waiting for a trend reversal? Let me know your thoughts below! 👇💬
#Crypto #AT #TechnicalAnalysis #Binance #Trading #BearMarket 🚀📊
Let’s cut the noise and look at what the chart is actually telling us. 🧐 I keep it 100% real with you guys—no hopium, just the facts.
Right now, the verdict is clear: THIS CHART IS BEARISH 🔴
Why?
Just look at that structure. We had a sharp rejection from the highs and a brutal stair-step downtrend. The price is currently sitting at 0.0903, completely unable to reclaim the MA60 (0.0914). The macro performance is also weighing heavily, showing a painful -34.38% over the last 30 days. The trend is firmly in the bears' control. 🐻
📊 Key Levels to Watch:
• Resistance (The Ceiling) 🧱: 0.0914 (MA60) is the immediate wall. If bulls can’t break and hold above this, any pump is just a trap. Next major resistance is up at 0.0929 (24h High).
• Support (The Floor) 🛡️: The immediate floor is right here at the current level (0.0903). If this gives way, we are likely looking for new local lows.
🔮 Scenarios:
• 🟢 Bullish Case: We need a massive volume spike to flip that MA60 into support. If buyers step in aggressively, a relief bounce toward 0.0918+ is possible. But right now, momentum is lacking.
• 🔴 Bearish Case: Continued rejection at the MA60 and a breakdown below 0.0900. Look at the volume profile—sellers are still active. A flush to the 0.0851 (24h Low) area is a very realistic scenario if this current support fails.
💡 Overall Outlook:
The trend is your friend, and right now, the friend is pointing down. 📉 Protect your capital, wait for confirmation, and don't try to catch a falling knife without a solid plan.
Are you buying this dip or waiting for a trend reversal? Let me know your thoughts below! 👇💬
#Crypto #AT #TechnicalAnalysis #Binance #Trading #BearMarket 🚀📊
46
翻訳参照
🎬 $MBL is pumping +9.82%! 🚀 Dead Cat Bounce or Real Reversal? 🤔👀
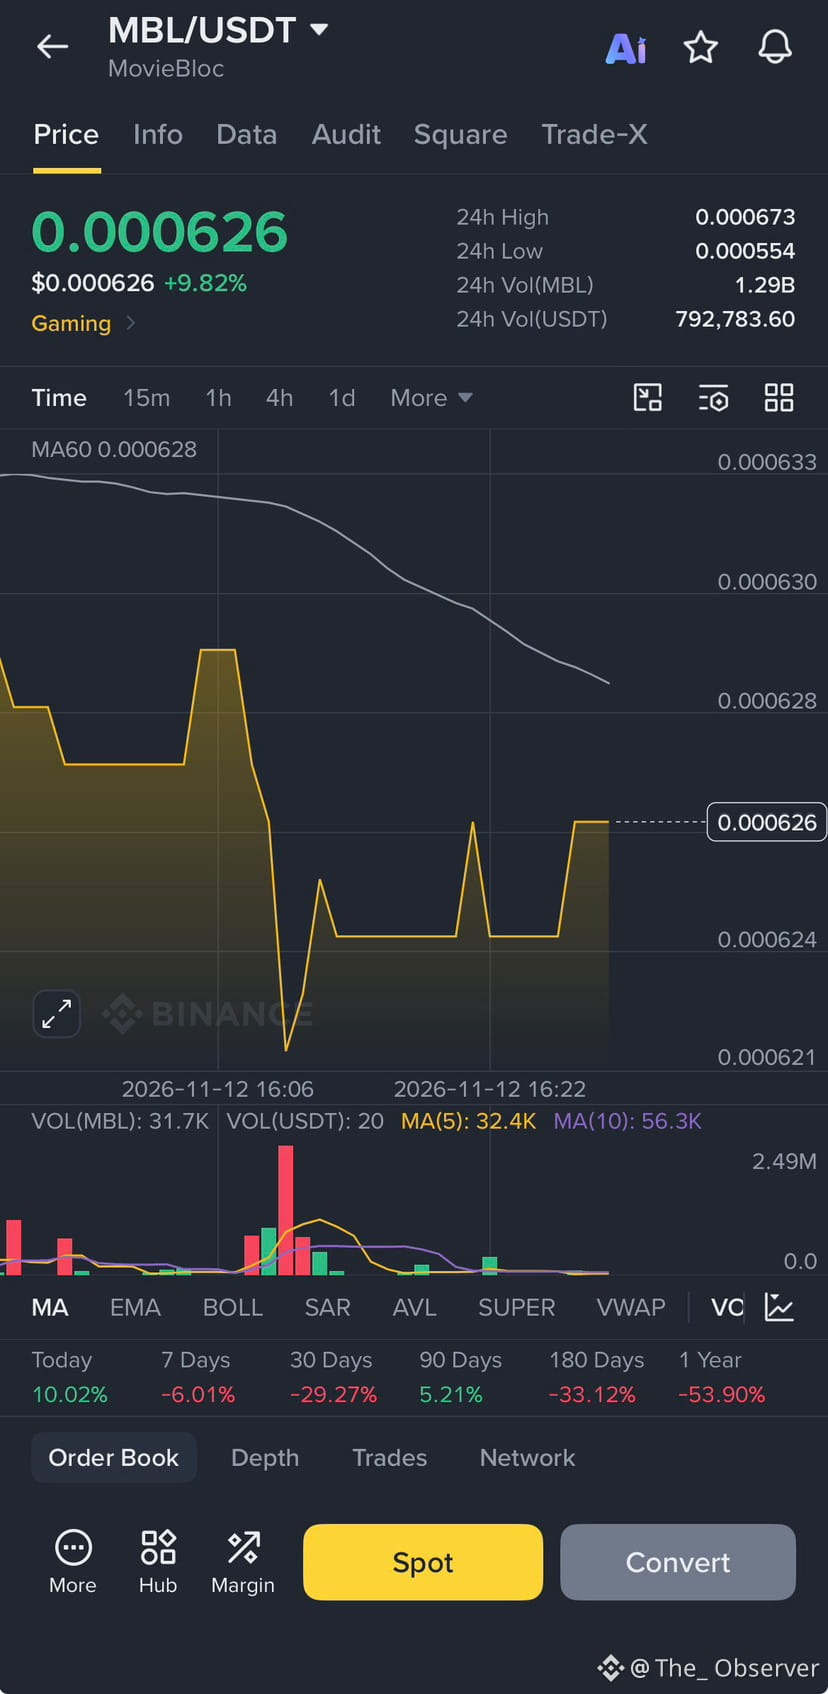
We’ve got some serious green on the screen today! 🟢 0.000626** (+9.82%), catching a massive short-term bid! 🔥 But as always, let's zoom out and look at the actual structure on this 4H chart before we get too excited. 🔍📊
While today's green candle is impressive, we are currently slamming right into a major technical wall. 🧱 Notice the grey line? That’s the MA60 at $0.000628. The price has run straight up and stalled right underneath it! 🛑
Here is my technical breakdown: 🎯📝
🟡 Overall Verdict: BEARISH MACRO / SHORT-TERM RELIEF RALLY 🐻
Why? The broader trend (look at the 30d and 180d stats: -29% and -33%) is deeply bearish. 📉 This current move looks like a violent relief bounce after a heavy sell-off, rather than a confirmed trend reversal. The price is struggling to break the MA60 resistance, showing the bears are still defending this zone. 🐻🛡️
📊 Key Levels to Watch: 👀
• Immediate Resistance: 🚧 0.000633 (The top of the chart). We must close a 4H candle above this to flip bullish! 🟢
• Immediate Support: 🛡️ $0.000621 (The recent structural bottom on this timeframe).
• Major Support: 🕳️ $0.000554 (The 24h low).
⚖️ What’s Next? (Scenarios) 🔮
• 🟢 Bullish Breakout: If buyers step in with heavy volume and we break the MA60 (0.000673**. 🚀📈
• 🔴 Bearish Rejection: If the MA60 holds as resistance, expect a retracement. We will likely see a pullback to test the local support at $0.000621. A break below that, and we are likely heading back to retest the recent lows. 📉🩸
⚠️ The Volume Warning: 🚨 Look at the volume bars at the bottom! Aside from one massive red spike earlier, the volume for this current green move is relatively light. Don't get trapped chasing a low-liquidity pump!
Are we breaking out, or is this a bull trap? 🪤 Let me hear your thoughts in the comments! 👇
#MBL #MovieBloc #CryptoGaming #TechnicalAnalysis #Altcoins #CryptoMarket #Binance #CryptoTrading
🎬 $MBL is pumping +9.82%! 🚀 Dead Cat Bounce or Real Reversal? 🤔👀
We’ve got some serious green on the screen today! 🟢 0.000626** (+9.82%), catching a massive short-term bid! 🔥 But as always, let's zoom out and look at the actual structure on this 4H chart before we get too excited. 🔍📊
While today's green candle is impressive, we are currently slamming right into a major technical wall. 🧱 Notice the grey line? That’s the MA60 at $0.000628. The price has run straight up and stalled right underneath it! 🛑
Here is my technical breakdown: 🎯📝
🟡 Overall Verdict: BEARISH MACRO / SHORT-TERM RELIEF RALLY 🐻
Why? The broader trend (look at the 30d and 180d stats: -29% and -33%) is deeply bearish. 📉 This current move looks like a violent relief bounce after a heavy sell-off, rather than a confirmed trend reversal. The price is struggling to break the MA60 resistance, showing the bears are still defending this zone. 🐻🛡️
📊 Key Levels to Watch: 👀
• Immediate Resistance: 🚧 0.000633 (The top of the chart). We must close a 4H candle above this to flip bullish! 🟢
• Immediate Support: 🛡️ $0.000621 (The recent structural bottom on this timeframe).
• Major Support: 🕳️ $0.000554 (The 24h low).
⚖️ What’s Next? (Scenarios) 🔮
• 🟢 Bullish Breakout: If buyers step in with heavy volume and we break the MA60 (0.000673**. 🚀📈
• 🔴 Bearish Rejection: If the MA60 holds as resistance, expect a retracement. We will likely see a pullback to test the local support at $0.000621. A break below that, and we are likely heading back to retest the recent lows. 📉🩸
⚠️ The Volume Warning: 🚨 Look at the volume bars at the bottom! Aside from one massive red spike earlier, the volume for this current green move is relatively light. Don't get trapped chasing a low-liquidity pump!
Are we breaking out, or is this a bull trap? 🪤 Let me hear your thoughts in the comments! 👇
#MBL #MovieBloc #CryptoGaming #TechnicalAnalysis #Altcoins #CryptoMarket #Binance #CryptoTrading
We’ve got some serious green on the screen today! 🟢 0.000626** (+9.82%), catching a massive short-term bid! 🔥 But as always, let's zoom out and look at the actual structure on this 4H chart before we get too excited. 🔍📊
While today's green candle is impressive, we are currently slamming right into a major technical wall. 🧱 Notice the grey line? That’s the MA60 at $0.000628. The price has run straight up and stalled right underneath it! 🛑
Here is my technical breakdown: 🎯📝
🟡 Overall Verdict: BEARISH MACRO / SHORT-TERM RELIEF RALLY 🐻
Why? The broader trend (look at the 30d and 180d stats: -29% and -33%) is deeply bearish. 📉 This current move looks like a violent relief bounce after a heavy sell-off, rather than a confirmed trend reversal. The price is struggling to break the MA60 resistance, showing the bears are still defending this zone. 🐻🛡️
📊 Key Levels to Watch: 👀
• Immediate Resistance: 🚧 0.000633 (The top of the chart). We must close a 4H candle above this to flip bullish! 🟢
• Immediate Support: 🛡️ $0.000621 (The recent structural bottom on this timeframe).
• Major Support: 🕳️ $0.000554 (The 24h low).
⚖️ What’s Next? (Scenarios) 🔮
• 🟢 Bullish Breakout: If buyers step in with heavy volume and we break the MA60 (0.000673**. 🚀📈
• 🔴 Bearish Rejection: If the MA60 holds as resistance, expect a retracement. We will likely see a pullback to test the local support at $0.000621. A break below that, and we are likely heading back to retest the recent lows. 📉🩸
⚠️ The Volume Warning: 🚨 Look at the volume bars at the bottom! Aside from one massive red spike earlier, the volume for this current green move is relatively light. Don't get trapped chasing a low-liquidity pump!
Are we breaking out, or is this a bull trap? 🪤 Let me hear your thoughts in the comments! 👇
#MBL #MovieBloc #CryptoGaming #TechnicalAnalysis #Altcoins #CryptoMarket #Binance #CryptoTrading
15
翻訳参照
🚀📊 $CHR /USDT: Is a Recovery Coming? 👀🔥
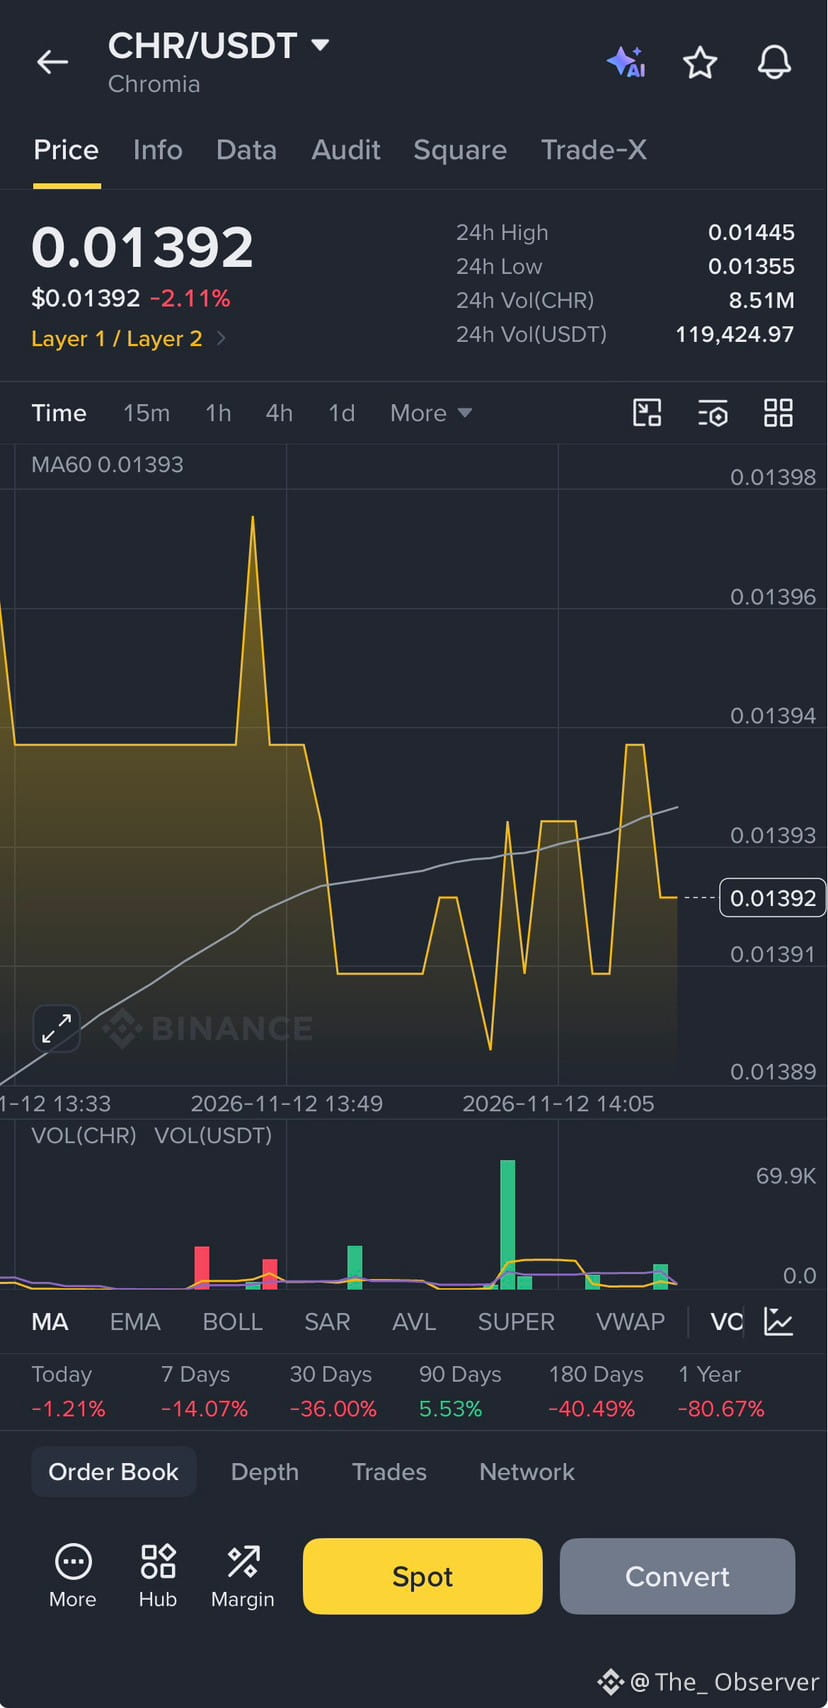
$CHR is currently trading around 0.01392 USDT, down approximately 2.11% 📉. Looking at the chart, price has been moving sideways after a small drop, with buyers trying to defend the 0.01389–0.01391 support zone. 🛡️
👀 Here are the levels I’m watching:
🟢 Support: 0.01389–0.01391. Buyers have stepped in around this area several times.
🔴 Resistance: 0.01393–0.01394. The MA60 is sitting around 0.01393, making this an important level for bulls to reclaim.
🚀 If buyers manage to push above 0.01394 with stronger volume, we could see a move towards 0.01397–0.01398.
⚠️ However, if CHR loses 0.01389, selling pressure could increase, and we may see another move lower.
🧠 My personal take: I’m not ready to call this a bullish reversal just yet. I want to see buyers show real strength and confirm the move with volume. Patience is important in markets like this. 🎯📈
💬 What’s your opinion? Are we about to see a recovery, or should we prepare for another dip? 👇🔥
Let’s discuss! 🚀🤝
⚠️ Not financial advice. Always manage your risk. 💯
🚀📊 $CHR /USDT: Is a Recovery Coming? 👀🔥
$CHR is currently trading around 0.01392 USDT, down approximately 2.11% 📉. Looking at the chart, price has been moving sideways after a small drop, with buyers trying to defend the 0.01389–0.01391 support zone. 🛡️
👀 Here are the levels I’m watching:
🟢 Support: 0.01389–0.01391. Buyers have stepped in around this area several times.
🔴 Resistance: 0.01393–0.01394. The MA60 is sitting around 0.01393, making this an important level for bulls to reclaim.
🚀 If buyers manage to push above 0.01394 with stronger volume, we could see a move towards 0.01397–0.01398.
⚠️ However, if CHR loses 0.01389, selling pressure could increase, and we may see another move lower.
🧠 My personal take: I’m not ready to call this a bullish reversal just yet. I want to see buyers show real strength and confirm the move with volume. Patience is important in markets like this. 🎯📈
💬 What’s your opinion? Are we about to see a recovery, or should we prepare for another dip? 👇🔥
Let’s discuss! 🚀🤝
⚠️ Not financial advice. Always manage your risk. 💯
$CHR is currently trading around 0.01392 USDT, down approximately 2.11% 📉. Looking at the chart, price has been moving sideways after a small drop, with buyers trying to defend the 0.01389–0.01391 support zone. 🛡️
👀 Here are the levels I’m watching:
🟢 Support: 0.01389–0.01391. Buyers have stepped in around this area several times.
🔴 Resistance: 0.01393–0.01394. The MA60 is sitting around 0.01393, making this an important level for bulls to reclaim.
🚀 If buyers manage to push above 0.01394 with stronger volume, we could see a move towards 0.01397–0.01398.
⚠️ However, if CHR loses 0.01389, selling pressure could increase, and we may see another move lower.
🧠 My personal take: I’m not ready to call this a bullish reversal just yet. I want to see buyers show real strength and confirm the move with volume. Patience is important in markets like this. 🎯📈
💬 What’s your opinion? Are we about to see a recovery, or should we prepare for another dip? 👇🔥
Let’s discuss! 🚀🤝
⚠️ Not financial advice. Always manage your risk. 💯
83
🚨🔥 $BTC /USDT アラート:危険ゾーン、それとも黄金の反発? 🩸📉🐻
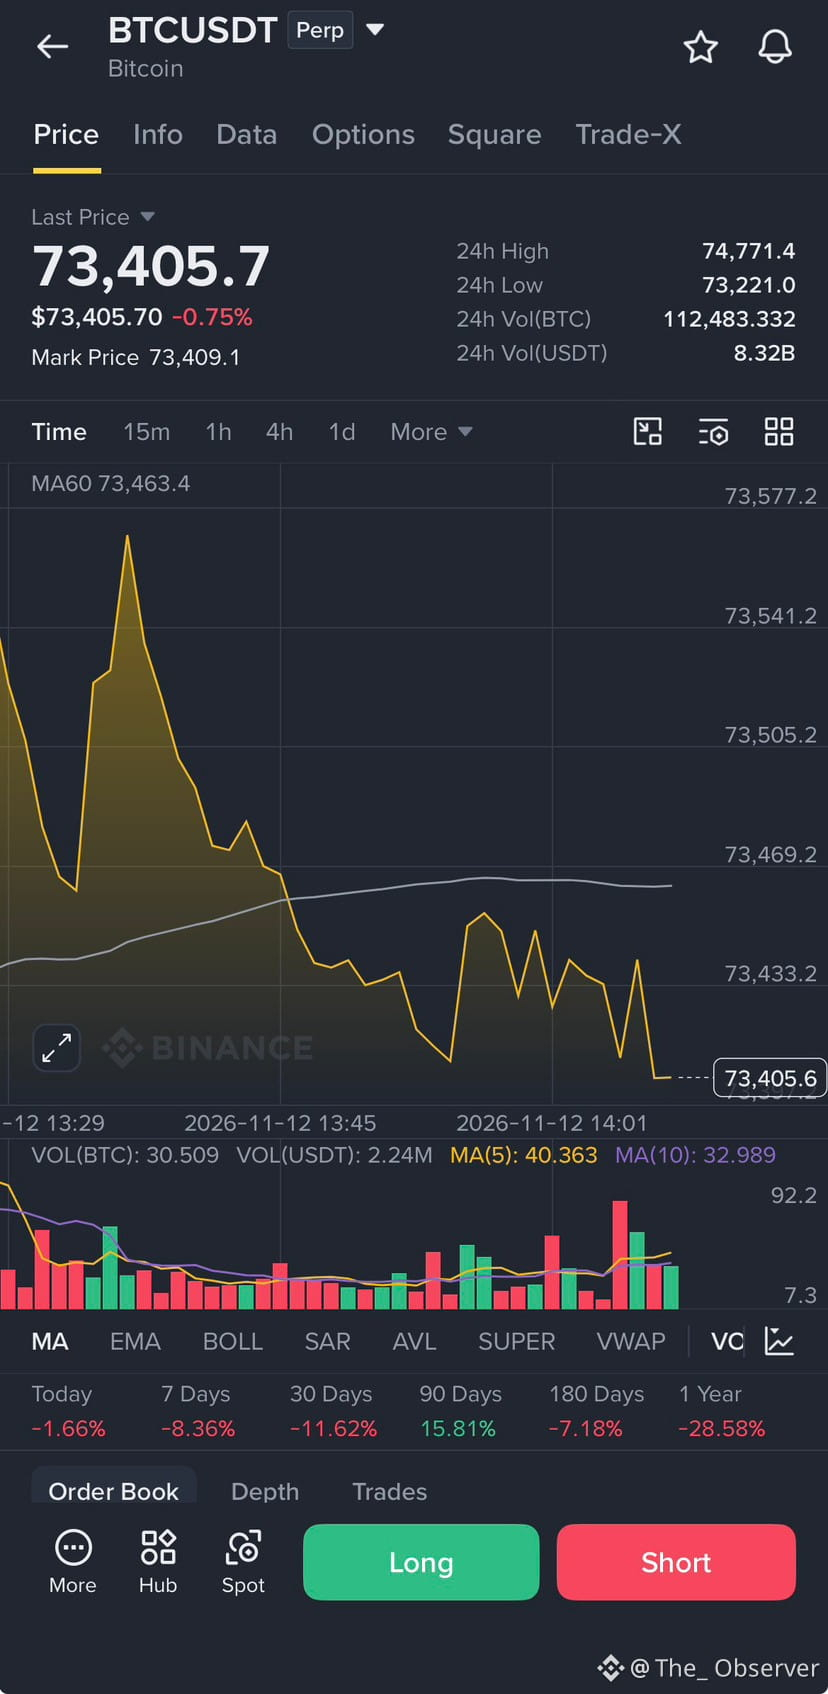
このチャートを見てください! 👀 $BTC は今日下落し、-0.75%となって73,405付近で推移しています。 💸 現在、売り方が圧倒的に優勢です! 🐻💪 この時間足では、明確な下降トレンドの形ができつつあります! 📉
📊 私の分析:🧠
価格は高値から強く押し戻されています! 💥 現在、MA60(73,463)を大きく下回って取引されており、MA60は強力な動的レジスタンスとして機能しています! 🧱🛑 出来高からは強い売り圧力が見られ、トレンドも弱そうです! 🔴📉 24時間安値の73,221を割り込めば、急落に注意してください! 🌊🚨
🎯 トレード戦略:🎯💼
• 方向:ショート 📉🔴
• エントリーゾーン:現在価格(73,405)、またはMA60への戻りを待つ! 🎯🔄
• 利確目標1:73,221(24時間安値)🥇💸
• 利確目標2:73,000(心理的サポート)🚀🌑
• 損切り(SL):73,580(MA60のレジスタンスを上回る水準)🛑🛡️
💡 プロのヒント:⚠️🧠
落ちてくるナイフをむやみに掴まないでください! 🙅♂️❌ ショートに入る前に、73,460付近で戻り高値の切り下げ、または弱気の拒否ローソク足が出るのを待ちましょう! 🤞📊 資金を守りましょう! 🛡️💰
この下抜けでショートしますか? それとも反発を待ちますか? 🤔👇 コメントで教えてください! 📉💬
免責事項:金融アドバイスではありません。必ずご自身で調査してください(DYOR)。⚠️📚
#BTC #Bitcoin #暗号資産 #テクニカル分析 #トレード #弱気相場 #Binance 🚀🔥💎🙌📉
🚨🔥 $BTC /USDT アラート:危険ゾーン、それとも黄金の反発? 🩸📉🐻
このチャートを見てください! 👀 $BTC は今日下落し、-0.75%となって73,405付近で推移しています。 💸 現在、売り方が圧倒的に優勢です! 🐻💪 この時間足では、明確な下降トレンドの形ができつつあります! 📉
📊 私の分析:🧠
価格は高値から強く押し戻されています! 💥 現在、MA60(73,463)を大きく下回って取引されており、MA60は強力な動的レジスタンスとして機能しています! 🧱🛑 出来高からは強い売り圧力が見られ、トレンドも弱そうです! 🔴📉 24時間安値の73,221を割り込めば、急落に注意してください! 🌊🚨
🎯 トレード戦略:🎯💼
• 方向:ショート 📉🔴
• エントリーゾーン:現在価格(73,405)、またはMA60への戻りを待つ! 🎯🔄
• 利確目標1:73,221(24時間安値)🥇💸
• 利確目標2:73,000(心理的サポート)🚀🌑
• 損切り(SL):73,580(MA60のレジスタンスを上回る水準)🛑🛡️
💡 プロのヒント:⚠️🧠
落ちてくるナイフをむやみに掴まないでください! 🙅♂️❌ ショートに入る前に、73,460付近で戻り高値の切り下げ、または弱気の拒否ローソク足が出るのを待ちましょう! 🤞📊 資金を守りましょう! 🛡️💰
この下抜けでショートしますか? それとも反発を待ちますか? 🤔👇 コメントで教えてください! 📉💬
免責事項:金融アドバイスではありません。必ずご自身で調査してください(DYOR)。⚠️📚
#BTC #Bitcoin #暗号資産 #テクニカル分析 #トレード #弱気相場 #Binance 🚀🔥💎🙌📉
このチャートを見てください! 👀 $BTC は今日下落し、-0.75%となって73,405付近で推移しています。 💸 現在、売り方が圧倒的に優勢です! 🐻💪 この時間足では、明確な下降トレンドの形ができつつあります! 📉
📊 私の分析:🧠
価格は高値から強く押し戻されています! 💥 現在、MA60(73,463)を大きく下回って取引されており、MA60は強力な動的レジスタンスとして機能しています! 🧱🛑 出来高からは強い売り圧力が見られ、トレンドも弱そうです! 🔴📉 24時間安値の73,221を割り込めば、急落に注意してください! 🌊🚨
🎯 トレード戦略:🎯💼
• 方向:ショート 📉🔴
• エントリーゾーン:現在価格(73,405)、またはMA60への戻りを待つ! 🎯🔄
• 利確目標1:73,221(24時間安値)🥇💸
• 利確目標2:73,000(心理的サポート)🚀🌑
• 損切り(SL):73,580(MA60のレジスタンスを上回る水準)🛑🛡️
💡 プロのヒント:⚠️🧠
落ちてくるナイフをむやみに掴まないでください! 🙅♂️❌ ショートに入る前に、73,460付近で戻り高値の切り下げ、または弱気の拒否ローソク足が出るのを待ちましょう! 🤞📊 資金を守りましょう! 🛡️💰
この下抜けでショートしますか? それとも反発を待ちますか? 🤔👇 コメントで教えてください! 📉💬
免責事項:金融アドバイスではありません。必ずご自身で調査してください(DYOR)。⚠️📚
#BTC #Bitcoin #暗号資産 #テクニカル分析 #トレード #弱気相場 #Binance 🚀🔥💎🙌📉
54
🚀🔥 チャート速報:$ZS は大反転の準備ができているのか?! 🔥🚀
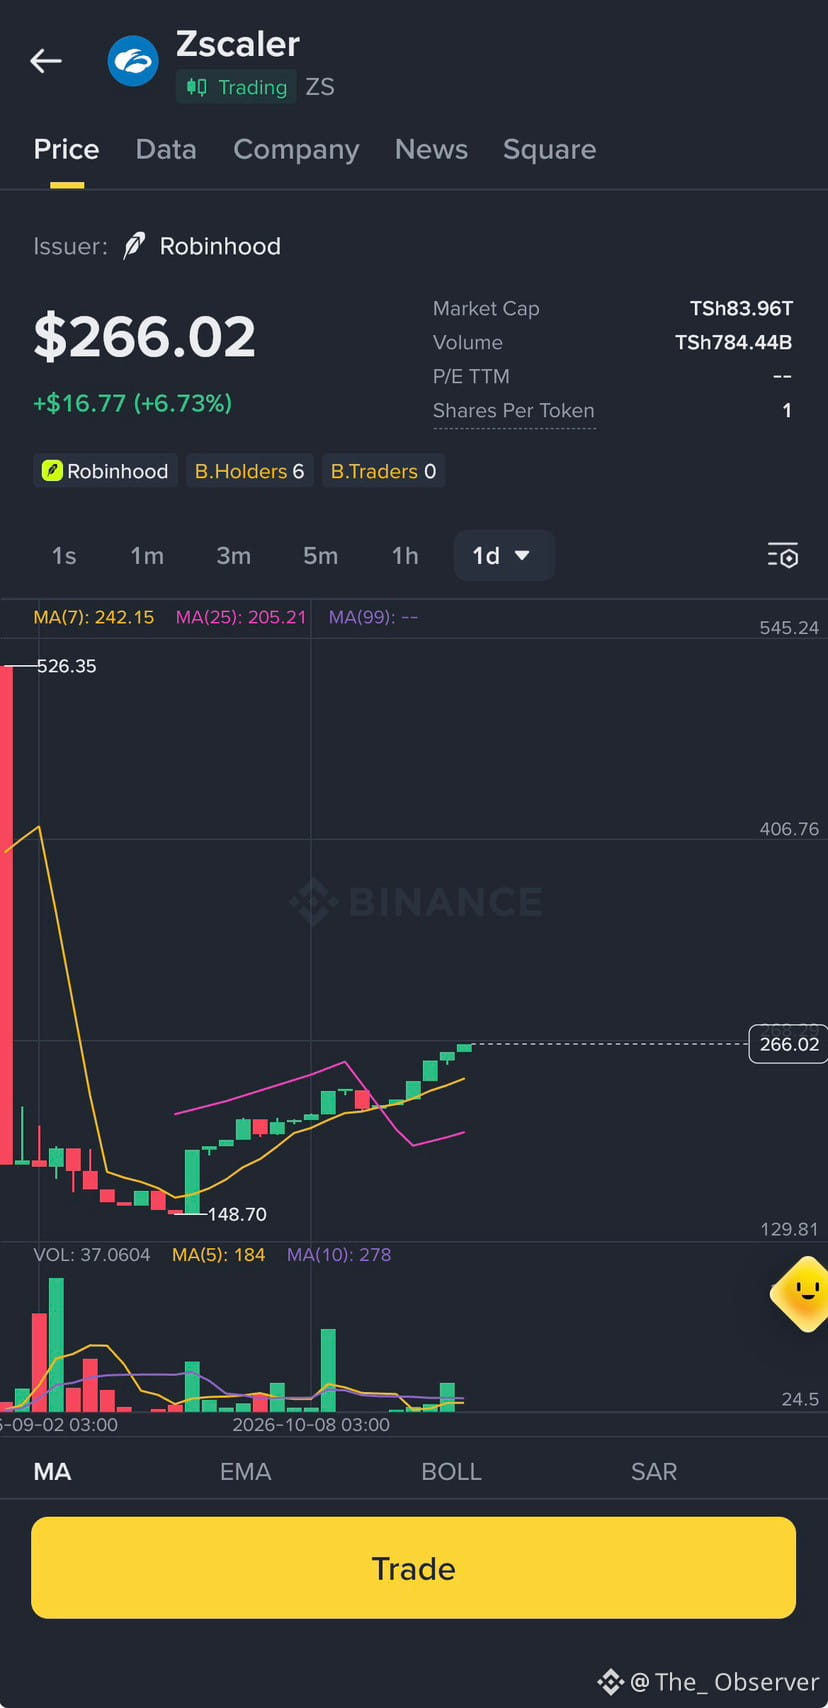
トレーダーのみなさん、こんにちは!👋 Binanceのチャートをチェックしていたら、この$ZS (266.02**、本日+6.73%)が目に留まりました。この激しい値動きを分析してみましょう!🧠📊
👀 テクニカル分析:
このチャートを見てください!🩸 526.35の高値から激しく下落し、148.70の主要な安値まで一気に落ちました。でも待って……今何が起きているか見てください!👀 価格がようやく反発し、陽線が出ています!🟢💪
• 🟡 MA(7):242.15(価格は大きく上回っています!)
• 🩷 MA(25):205.21
短期移動平均線が長期移動平均線を上抜けました!📈 大幅な下降トレンドの後に見られる、典型的な強気のゴールデンクロスです。強気派が正式に戻ってきました!🐂🔥
⚖️ 私の判断:ロング!🟢🚀
明らかに上昇方向への勢いの変化が見られます!💯
🎯 私の作戦:
急騰には飛び乗りませんが、この状況は魅力的です!🍬 260付近まで少し下げたところでロングエントリーを狙います。🎯 最初の大きな目標は、心理的節目である300ドル超えです!💰 直近のスイング安値を下回る位置にタイトな損切りを設定します。🛡️
この反発で買いますか?👀 下に意見を投稿してください!👇💬 こういうチャンスが好きなら「いいね」とシェアをお願いします!❤️🔁
⚠️ 金融アドバイスではありません。暗号資産は価格変動が激しいため、必ずご自身で調査してください!🛡️💎🙌
🚀🔥 チャート速報:$ZS は大反転の準備ができているのか?! 🔥🚀
トレーダーのみなさん、こんにちは!👋 Binanceのチャートをチェックしていたら、この$ZS (266.02**、本日+6.73%)が目に留まりました。この激しい値動きを分析してみましょう!🧠📊
👀 テクニカル分析:
このチャートを見てください!🩸 526.35の高値から激しく下落し、148.70の主要な安値まで一気に落ちました。でも待って……今何が起きているか見てください!👀 価格がようやく反発し、陽線が出ています!🟢💪
• 🟡 MA(7):242.15(価格は大きく上回っています!)
• 🩷 MA(25):205.21
短期移動平均線が長期移動平均線を上抜けました!📈 大幅な下降トレンドの後に見られる、典型的な強気のゴールデンクロスです。強気派が正式に戻ってきました!🐂🔥
⚖️ 私の判断:ロング!🟢🚀
明らかに上昇方向への勢いの変化が見られます!💯
🎯 私の作戦:
急騰には飛び乗りませんが、この状況は魅力的です!🍬 260付近まで少し下げたところでロングエントリーを狙います。🎯 最初の大きな目標は、心理的節目である300ドル超えです!💰 直近のスイング安値を下回る位置にタイトな損切りを設定します。🛡️
この反発で買いますか?👀 下に意見を投稿してください!👇💬 こういうチャンスが好きなら「いいね」とシェアをお願いします!❤️🔁
⚠️ 金融アドバイスではありません。暗号資産は価格変動が激しいため、必ずご自身で調査してください!🛡️💎🙌
トレーダーのみなさん、こんにちは!👋 Binanceのチャートをチェックしていたら、この$ZS (266.02**、本日+6.73%)が目に留まりました。この激しい値動きを分析してみましょう!🧠📊
👀 テクニカル分析:
このチャートを見てください!🩸 526.35の高値から激しく下落し、148.70の主要な安値まで一気に落ちました。でも待って……今何が起きているか見てください!👀 価格がようやく反発し、陽線が出ています!🟢💪
• 🟡 MA(7):242.15(価格は大きく上回っています!)
• 🩷 MA(25):205.21
短期移動平均線が長期移動平均線を上抜けました!📈 大幅な下降トレンドの後に見られる、典型的な強気のゴールデンクロスです。強気派が正式に戻ってきました!🐂🔥
⚖️ 私の判断:ロング!🟢🚀
明らかに上昇方向への勢いの変化が見られます!💯
🎯 私の作戦:
急騰には飛び乗りませんが、この状況は魅力的です!🍬 260付近まで少し下げたところでロングエントリーを狙います。🎯 最初の大きな目標は、心理的節目である300ドル超えです!💰 直近のスイング安値を下回る位置にタイトな損切りを設定します。🛡️
この反発で買いますか?👀 下に意見を投稿してください!👇💬 こういうチャンスが好きなら「いいね」とシェアをお願いします!❤️🔁
⚠️ 金融アドバイスではありません。暗号資産は価格変動が激しいため、必ずご自身で調査してください!🛡️💎🙌
78
🚨 取引アラート:Howmet Aerospace($HWM.US )はブレイクアウト間近? 🚀
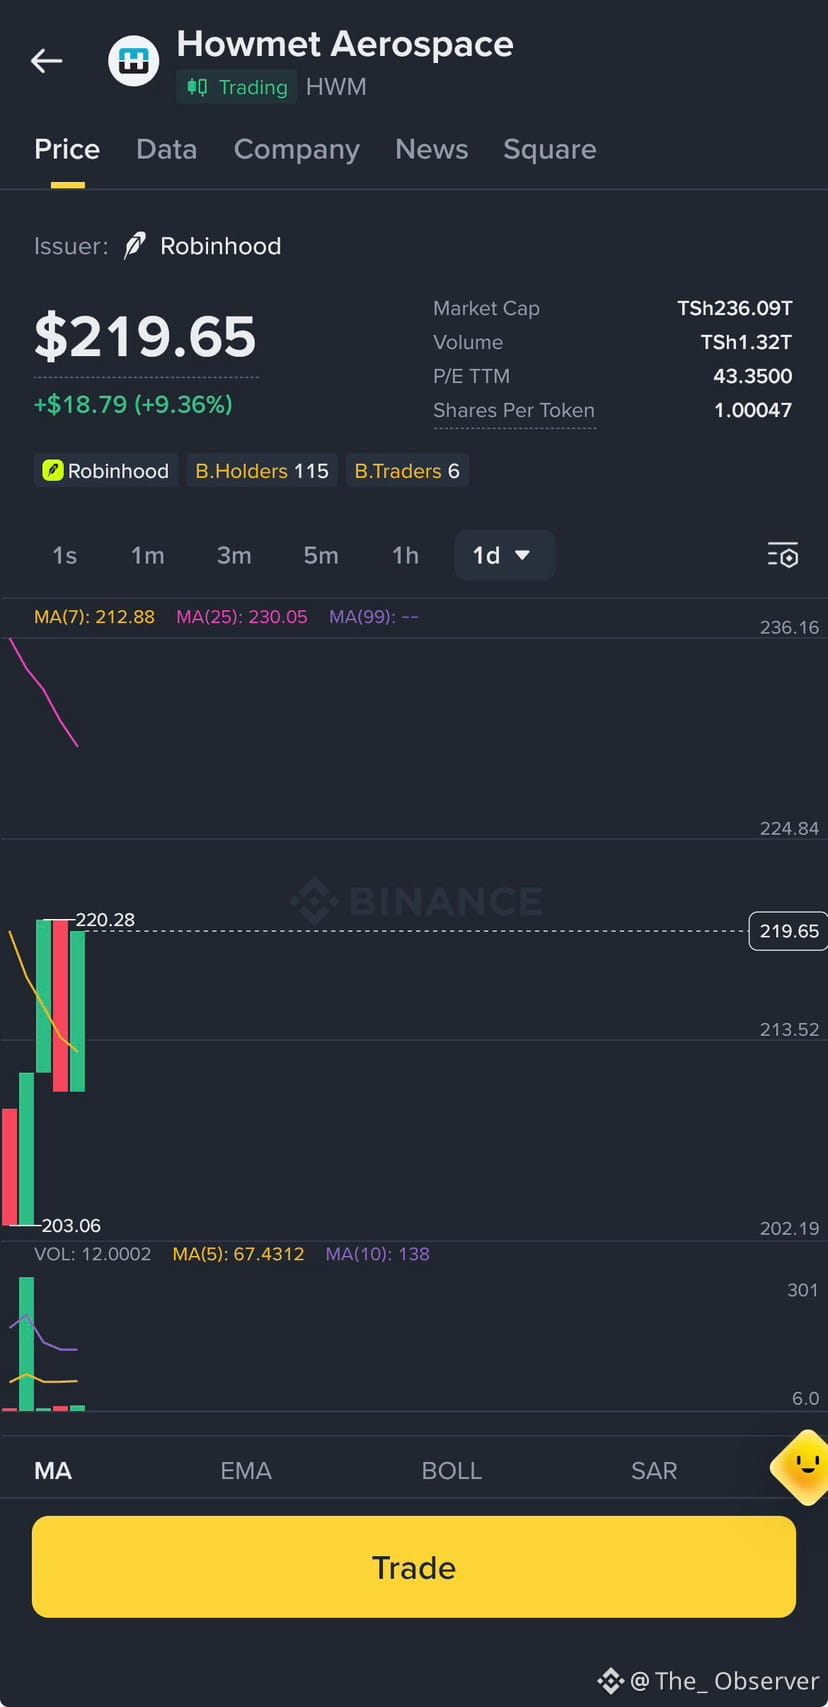
チャートをチェックしていたところ、219.65**で、ほぼ+9.36%の上昇!この1日足チャートを、ありのままに分析してみました。🧠🔍
📊 テクニカル分析:
値動きの構造を見てください。大きく力強い緑色の出来高バーが価格を押し上げています。しかし、すぐ上には抵抗線があります。価格は、サポートとして機能しているMA(7)の212.88と、強い抵抗となっているMA(25)の230.05の間に挟まれています。現在、この持ち合いの上限を試しているところです。
⚖️ ショート、それともロング?
ロングに傾いていますが、厳格な計画を立てています。🟢
モメンタムは明らかに強気で、出来高の急増は買い手の強い関心を示しています。このローソク足の高値で、むやみに買うつもりはありません。
🎯 私の作戦:
少し押し戻されるか、持ち合いになるのを待ちます。価格がMA(7)を上回り、MA(25)の水準である230付近を維持できれば、エントリーを検討します。資金を守るため、損切りは今日の寄り付きレンジのすぐ下に設定します。🛡️
$HWM.US について、あなたはどう見ていますか?モメンタムに乗って買いますか、それとも押し目を待ちますか?ぜひコメントで教えてください!👇🔥
免責事項:金融に関する助言ではありません。必ずご自身で調査してください。
🚨 取引アラート:Howmet Aerospace($HWM.US )はブレイクアウト間近? 🚀
チャートをチェックしていたところ、219.65**で、ほぼ+9.36%の上昇!この1日足チャートを、ありのままに分析してみました。🧠🔍
📊 テクニカル分析:
値動きの構造を見てください。大きく力強い緑色の出来高バーが価格を押し上げています。しかし、すぐ上には抵抗線があります。価格は、サポートとして機能しているMA(7)の212.88と、強い抵抗となっているMA(25)の230.05の間に挟まれています。現在、この持ち合いの上限を試しているところです。
⚖️ ショート、それともロング?
ロングに傾いていますが、厳格な計画を立てています。🟢
モメンタムは明らかに強気で、出来高の急増は買い手の強い関心を示しています。このローソク足の高値で、むやみに買うつもりはありません。
🎯 私の作戦:
少し押し戻されるか、持ち合いになるのを待ちます。価格がMA(7)を上回り、MA(25)の水準である230付近を維持できれば、エントリーを検討します。資金を守るため、損切りは今日の寄り付きレンジのすぐ下に設定します。🛡️
$HWM.US について、あなたはどう見ていますか?モメンタムに乗って買いますか、それとも押し目を待ちますか?ぜひコメントで教えてください!👇🔥
免責事項:金融に関する助言ではありません。必ずご自身で調査してください。
チャートをチェックしていたところ、219.65**で、ほぼ+9.36%の上昇!この1日足チャートを、ありのままに分析してみました。🧠🔍
📊 テクニカル分析:
値動きの構造を見てください。大きく力強い緑色の出来高バーが価格を押し上げています。しかし、すぐ上には抵抗線があります。価格は、サポートとして機能しているMA(7)の212.88と、強い抵抗となっているMA(25)の230.05の間に挟まれています。現在、この持ち合いの上限を試しているところです。
⚖️ ショート、それともロング?
ロングに傾いていますが、厳格な計画を立てています。🟢
モメンタムは明らかに強気で、出来高の急増は買い手の強い関心を示しています。このローソク足の高値で、むやみに買うつもりはありません。
🎯 私の作戦:
少し押し戻されるか、持ち合いになるのを待ちます。価格がMA(7)を上回り、MA(25)の水準である230付近を維持できれば、エントリーを検討します。資金を守るため、損切りは今日の寄り付きレンジのすぐ下に設定します。🛡️
$HWM.US について、あなたはどう見ていますか?モメンタムに乗って買いますか、それとも押し目を待ちますか?ぜひコメントで教えてください!👇🔥
免責事項:金融に関する助言ではありません。必ずご自身で調査してください。
98
ログインして、さらにコンテンツを読む
厳選トピックで世界の暗号資産トレーダーの仲間入り
⚡️ 暗号資産に関する最新かつ有益な情報が見つかります。
💬 世界最大の暗号資産取引所から信頼されています。
👍 認証を受けたクリエイターから、有益なインサイトを得られます。
メール / 電話番号