
bills co
14 投稿

bills co
報告
ユーザーをブロック
26 フォロー
15 フォロワー
14 いいね
投稿
すべて
引用
·
--
弱気相場
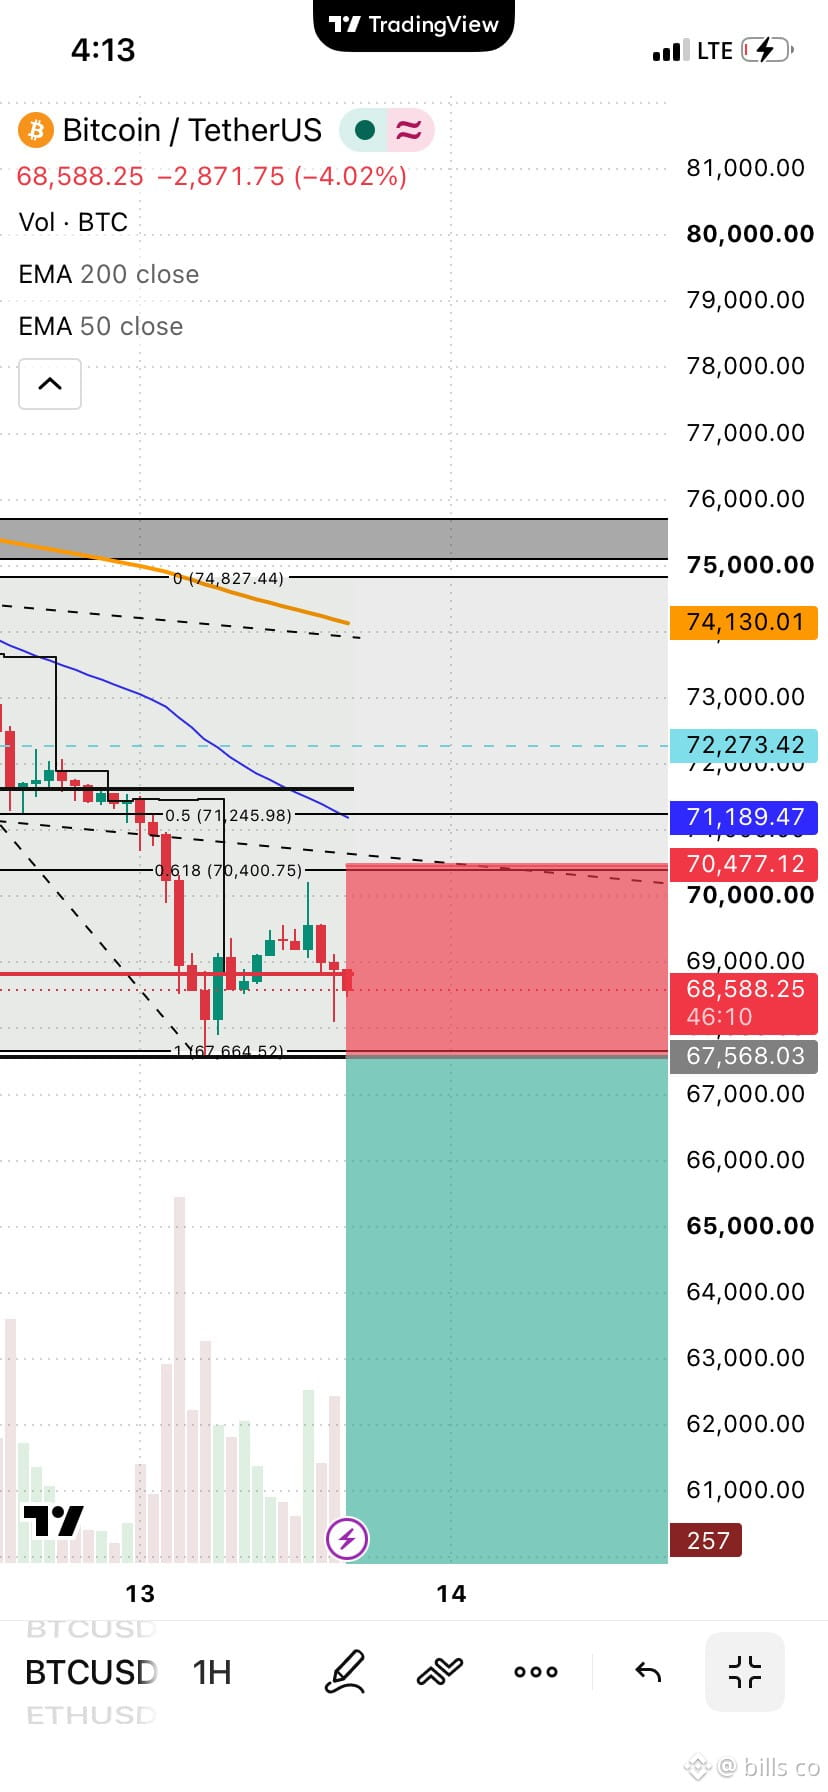
#BTC をショートするように言ったよね📉 押し目はまだ終わっていない。次の重要なサポートは、2024年半ばの週足ゾーンである5万8,000ドル付近。シナリオが無効になる条件:週足が7万2,000ドルを上回って引けること。投資助言ではありません。
#BTC をショートするように言ったよね📉 押し目はまだ終わっていない。次の重要なサポートは、2024年半ばの週足ゾーンである5万8,000ドル付近。シナリオが無効になる条件:週足が7万2,000ドルを上回って引けること。投資助言ではありません。
1
136
·
--
弱気相場
翻訳参照
This is not the last of #btcfall i think btc will dip more to approximately #$58,485 per #btc
This is not the last of #btcfall i think btc will dip more to approximately #$58,485 per #btc
1
1
228
·
--
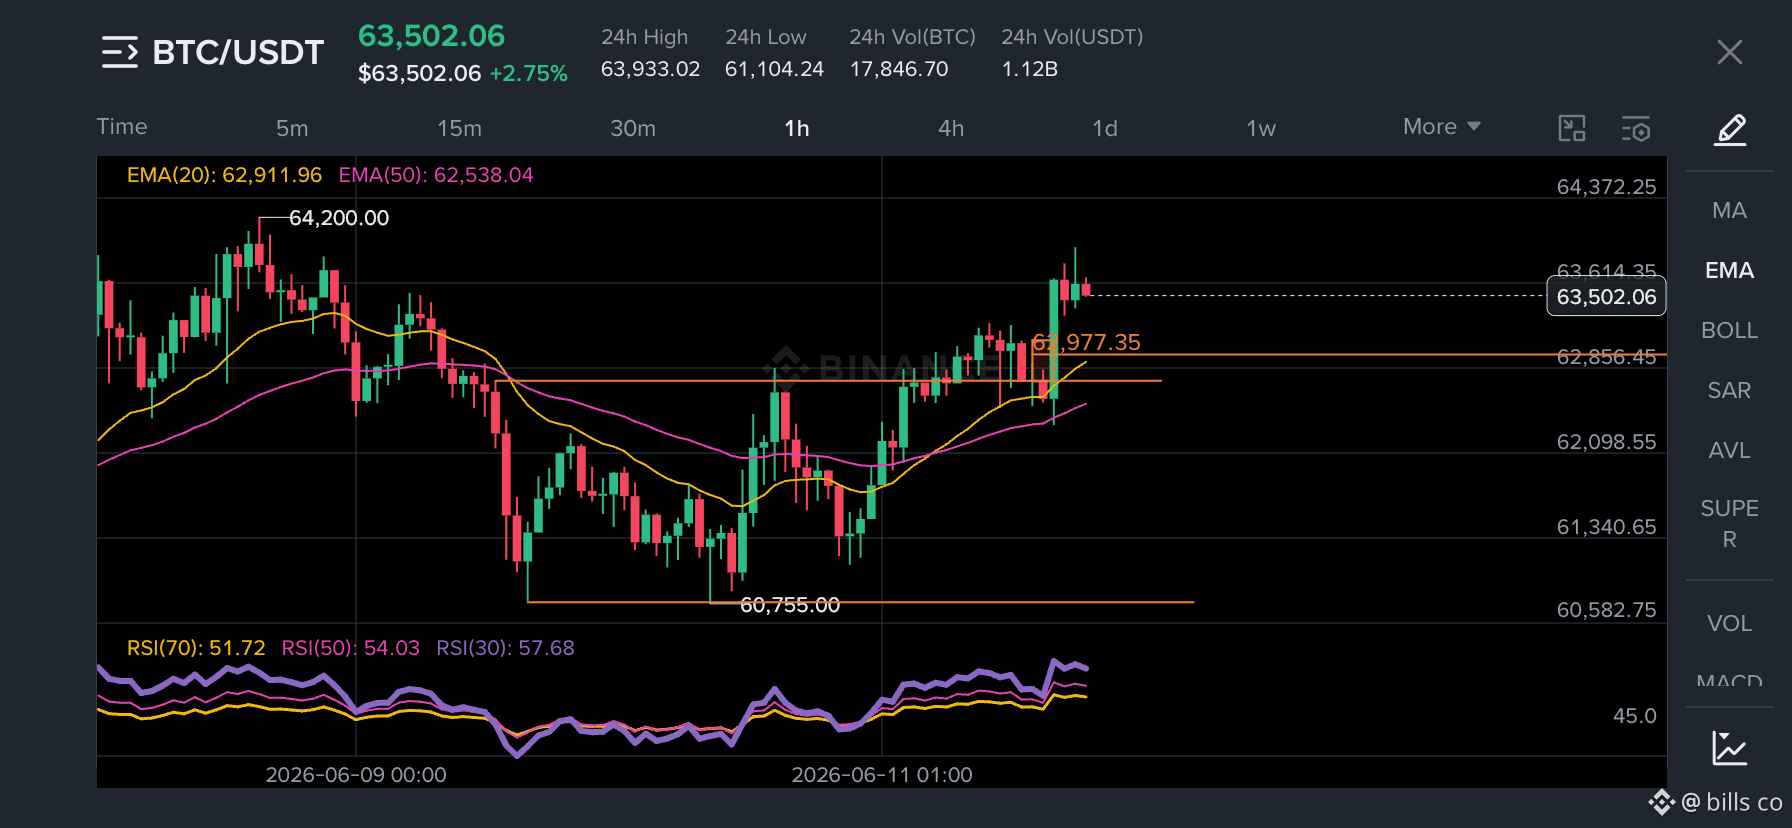
📊 BTC/USDT 1H 分析アップデート
以前、62,850–62,980ゾーンを主要なサポートエリアとして特定しました。この時、価格はEMA20とEMA50の上で推移していました。RSIも50以上を維持し、強気のモメンタムが形成されていることを示唆していました。
それ以来、BTCはサポートゾーンを尊重し、63,500を超えて押し上げられ、強気バイアスが確認されました。
重要なポイント:
✅ 価格はEMA20とEMA50の上に留まった
✅ RSIは50以上を維持
✅ サポートゾーンはしっかりと保持された
✅ バイヤーは高い安値を守った
私が改善しようとしている一つは、エントリー理由を価格レベルだけに焦点を当てず、より明確に定義することです。
この動きは主にサポートリテストによって引き起こされたと思いますか、それともエントリー前に考慮すべき他の確認があったのでしょうか?
あなたの意見や、この分析で私が犯したと思うミスをぜひ聞かせてください。👇
#BTC #ビットコイン #トレーディング #テクニカル分析 #BinanceSquare
📊 BTC/USDT 1H 分析アップデート
以前、62,850–62,980ゾーンを主要なサポートエリアとして特定しました。この時、価格はEMA20とEMA50の上で推移していました。RSIも50以上を維持し、強気のモメンタムが形成されていることを示唆していました。
それ以来、BTCはサポートゾーンを尊重し、63,500を超えて押し上げられ、強気バイアスが確認されました。
重要なポイント:
✅ 価格はEMA20とEMA50の上に留まった
✅ RSIは50以上を維持
✅ サポートゾーンはしっかりと保持された
✅ バイヤーは高い安値を守った
私が改善しようとしている一つは、エントリー理由を価格レベルだけに焦点を当てず、より明確に定義することです。
この動きは主にサポートリテストによって引き起こされたと思いますか、それともエントリー前に考慮すべき他の確認があったのでしょうか?
あなたの意見や、この分析で私が犯したと思うミスをぜひ聞かせてください。👇
#BTC #ビットコイン #トレーディング #テクニカル分析 #BinanceSquare
以前、62,850–62,980ゾーンを主要なサポートエリアとして特定しました。この時、価格はEMA20とEMA50の上で推移していました。RSIも50以上を維持し、強気のモメンタムが形成されていることを示唆していました。
それ以来、BTCはサポートゾーンを尊重し、63,500を超えて押し上げられ、強気バイアスが確認されました。
重要なポイント:
✅ 価格はEMA20とEMA50の上に留まった
✅ RSIは50以上を維持
✅ サポートゾーンはしっかりと保持された
✅ バイヤーは高い安値を守った
私が改善しようとしている一つは、エントリー理由を価格レベルだけに焦点を当てず、より明確に定義することです。
この動きは主にサポートリテストによって引き起こされたと思いますか、それともエントリー前に考慮すべき他の確認があったのでしょうか?
あなたの意見や、この分析で私が犯したと思うミスをぜひ聞かせてください。👇
#BTC #ビットコイン #トレーディング #テクニカル分析 #BinanceSquare
1
171
·
--
翻訳参照
STOP…….STOP……DONT SCROLL
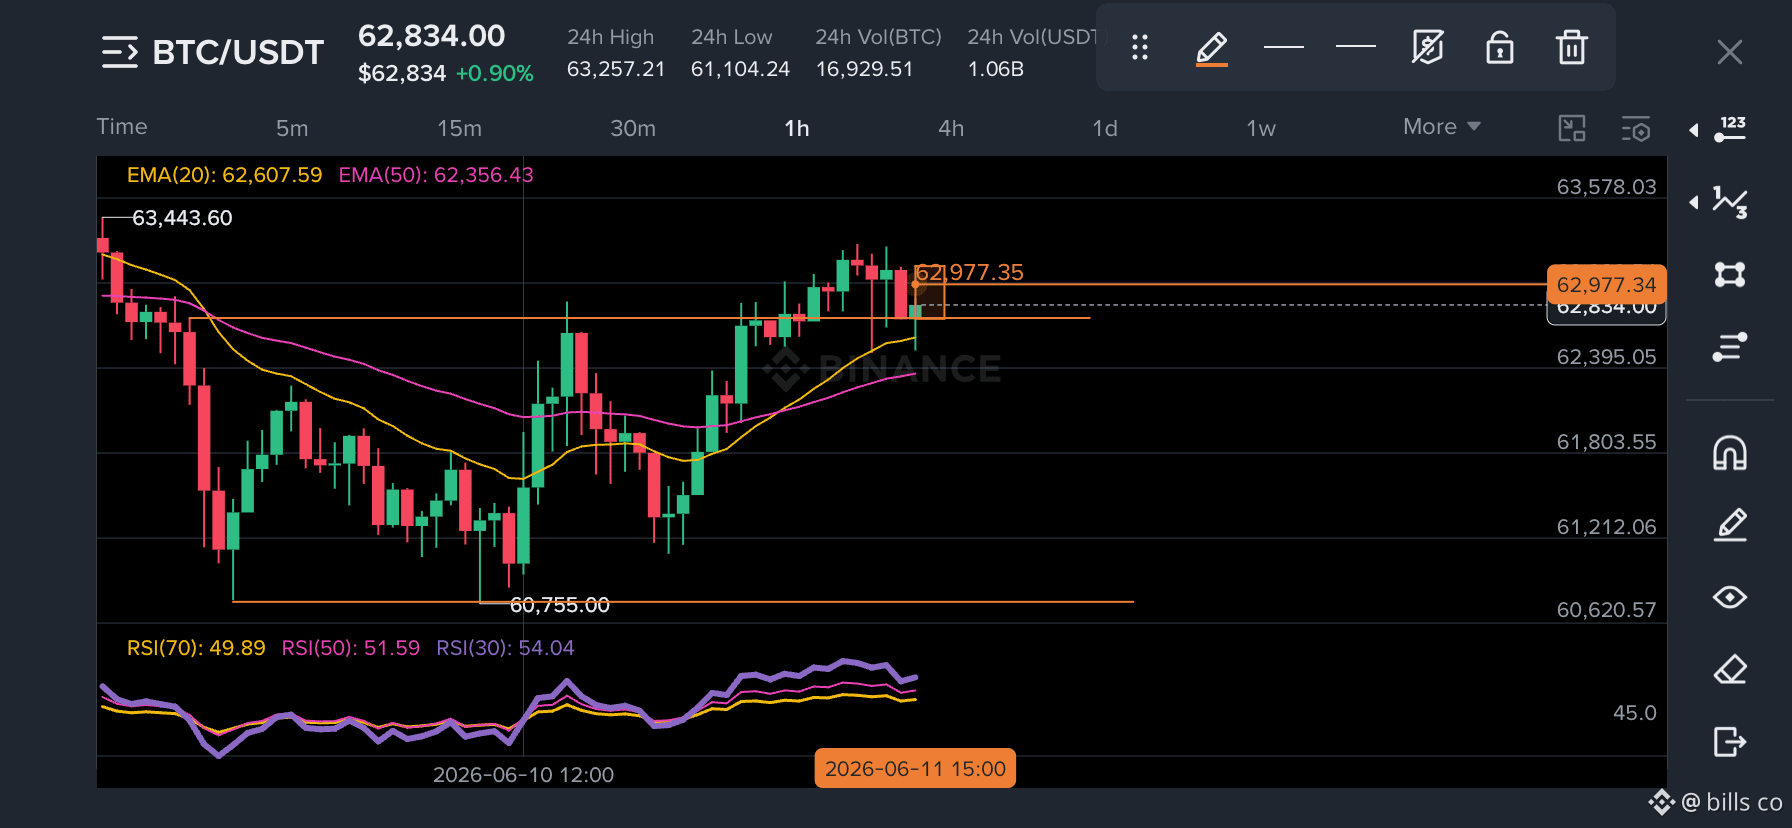
BTC/USDT 1H Analysis 📈
Price is trading above both EMA20 and EMA50, with EMA20 also above EMA50, which suggests bullish momentum. RSI is around 49–54, indicating a neutral market with room for movement in either direction.
My current idea is to wait for a confirmed breakout above the recent resistance zone before considering a long position. However, I’m still improving my chart-reading skills and want to challenge my own analysis.
Do you agree that the structure is bullish, or am I missing something important such as key support/resistance levels, volume, or higher timeframe context?
Constructive criticism is welcome. What would you do differently on this chart? 👇
STOP…….STOP……DONT SCROLL
BTC/USDT 1H Analysis 📈
Price is trading above both EMA20 and EMA50, with EMA20 also above EMA50, which suggests bullish momentum. RSI is around 49–54, indicating a neutral market with room for movement in either direction.
My current idea is to wait for a confirmed breakout above the recent resistance zone before considering a long position. However, I’m still improving my chart-reading skills and want to challenge my own analysis.
Do you agree that the structure is bullish, or am I missing something important such as key support/resistance levels, volume, or higher timeframe context?
Constructive criticism is welcome. What would you do differently on this chart? 👇
BTC/USDT 1H Analysis 📈
Price is trading above both EMA20 and EMA50, with EMA20 also above EMA50, which suggests bullish momentum. RSI is around 49–54, indicating a neutral market with room for movement in either direction.
My current idea is to wait for a confirmed breakout above the recent resistance zone before considering a long position. However, I’m still improving my chart-reading skills and want to challenge my own analysis.
Do you agree that the structure is bullish, or am I missing something important such as key support/resistance levels, volume, or higher timeframe context?
Constructive criticism is welcome. What would you do differently on this chart? 👇
69
·
--
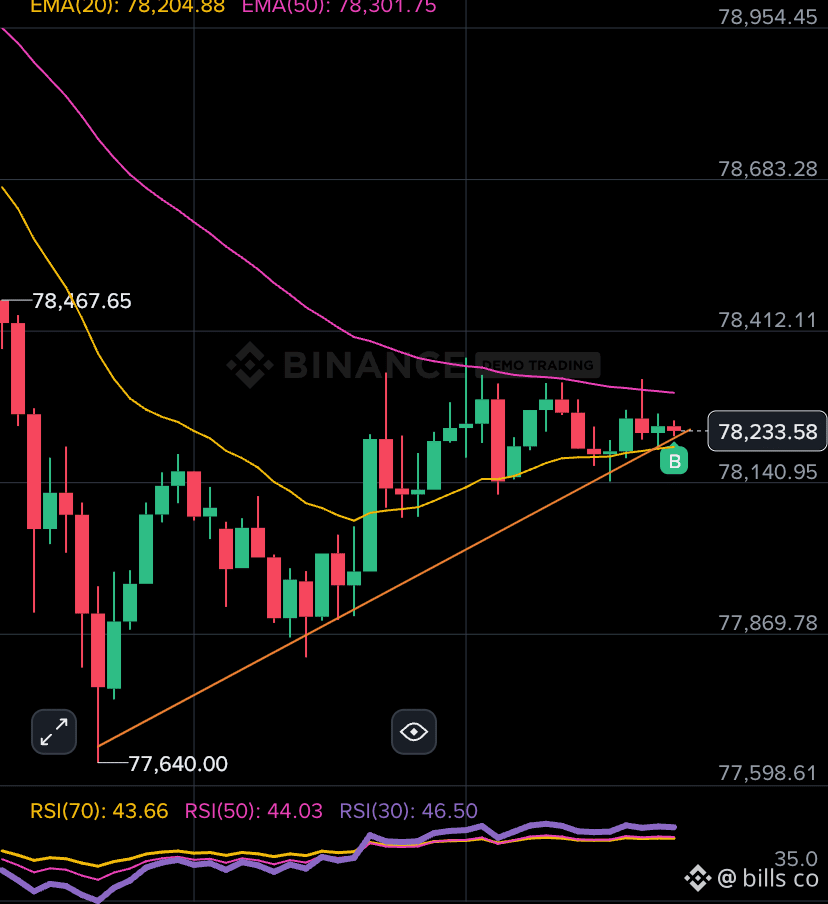
15分チャートのBTCは、買い手がモメンタムを取り戻そうとする一方で、売り手が重要なレジスタンスを守り続けているクラシックな戦いを示しています。
今のところ、価格は予測ではなく、忍耐が重要です。
次の確定したブレイクが、これが継続になるのか、拒絶になるのかを決定します。
トレーディングでは、チャートは常に感情よりも規律を報いるものです。📈 #BTC #BinanceSquare #CryptoTrading #テクニカル分析
15分チャートのBTCは、買い手がモメンタムを取り戻そうとする一方で、売り手が重要なレジスタンスを守り続けているクラシックな戦いを示しています。
今のところ、価格は予測ではなく、忍耐が重要です。
次の確定したブレイクが、これが継続になるのか、拒絶になるのかを決定します。
トレーディングでは、チャートは常に感情よりも規律を報いるものです。📈 #BTC #BinanceSquare #CryptoTrading #テクニカル分析
今のところ、価格は予測ではなく、忍耐が重要です。
次の確定したブレイクが、これが継続になるのか、拒絶になるのかを決定します。
トレーディングでは、チャートは常に感情よりも規律を報いるものです。📈 #BTC #BinanceSquare #CryptoTrading #テクニカル分析
1
159
·
--
翻訳参照
BTC isn’t just reacting to hype anymore.
The real signal is whether buyers can hold momentum after each pullback.
Smart money watches consolidation.
Retail chases green candles.
What’s your next key BTC level?
#BTC #Bitcoin #Crypto
BTC isn’t just reacting to hype anymore.
The real signal is whether buyers can hold momentum after each pullback.
Smart money watches consolidation.
Retail chases green candles.
What’s your next key BTC level?
#BTC #Bitcoin #Crypto
The real signal is whether buyers can hold momentum after each pullback.
Smart money watches consolidation.
Retail chases green candles.
What’s your next key BTC level?
#BTC #Bitcoin #Crypto

Crypto Planet Calls
·
--
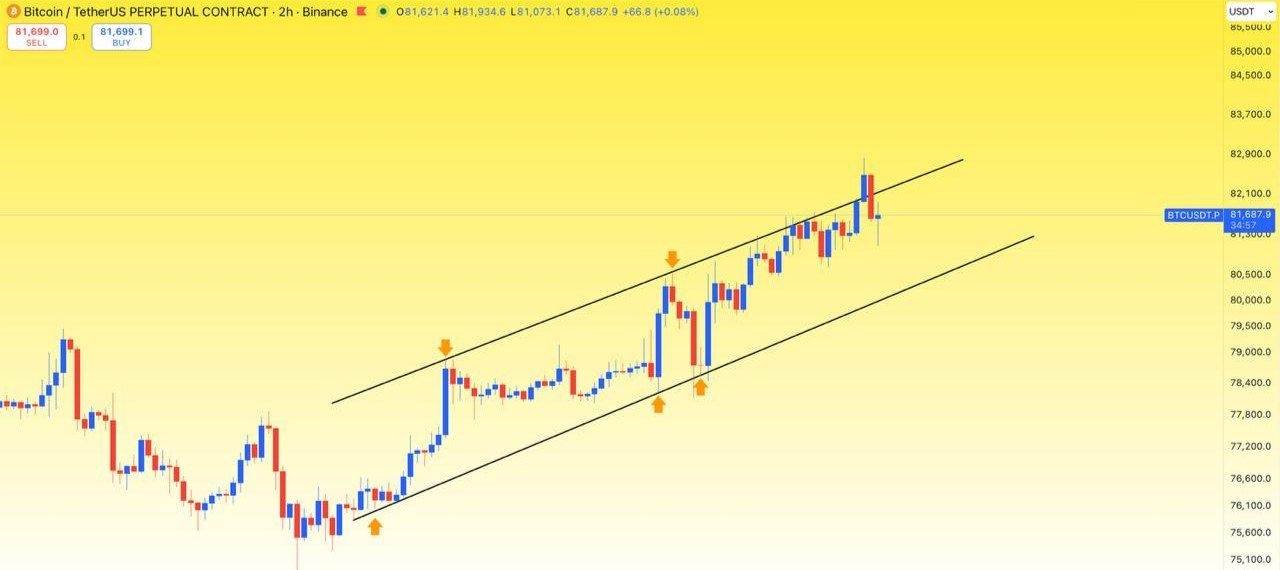
$BTC トレンドラインの再テストに失敗したので、すべてのロングトレードにストップロスを使うことをお勧めします。
6
92



ログインして、さらにコンテンツを読む
厳選トピックで世界の暗号資産トレーダーの仲間入り
⚡️ 暗号資産に関する最新かつ有益な情報が見つかります。
💬 世界最大の暗号資産取引所から信頼されています。
👍 認証を受けたクリエイターから、有益なインサイトを得られます。
メール / 電話番号