
Majid ali 230
2.6k 投稿

Majid ali 230
報告
ユーザーをブロック
取引を発注
高頻度トレーダー
11.3か月
217 フォロー
3.9K+ フォロワー
1.6K+ いいね
投稿
ポートフォリオ
すべて
引用
ライブ
このチャートは、時間軸によってまったく違う物語を語っていて、それがまさに今の私がBABYに注目している理由です。
日足では、価格が以前にサポートとして機能していたのとほぼ同じあたり(0.0109〜0.0113)に位置しています。この水準はすでに何度もテストされていますが、反発のたびに前回より弱くなっています。一方で、30分足と4時間足では、0.01337への急な値動きの後に明確な「切り下げの高値」の連なりが見えます。勢いは一夜で消えたわけではありません——ろうそく足ごとに薄れていっているだけです。
私が注目しているのは、プルバックそのものではありません。ミーム主導の市場ではボラティリティの高い値動きはよくあることです。より興味深いのは、ブレイクアウト後に買い手がどれだけ早く追随を止めたかという点です。1本の爆発的な陽線は注目を集められますが、持続的な強さには需要が継続して踏み込む必要があります。これまでのところ、その確証はまだ現れていません。
私が何度も立ち返るのはここです。サポートは、買い手が「確信をもって守る」場合にのみ意味を持ちます。もし現在のゾーンが維持され、短い時間軸でより高い安値が形成され始めるなら、直近の急騰は「反転」というより「リセット」に見えるかもしれません。ですが、このあたりがきれいにブレイクするなら、市場はブレイクアウトを新しいトレンドの始まりではなく、一時的な流動性イベントとして扱い始める可能性があります。
今のところ、次の大きな値動きを当てにいくことよりも、このサポート付近で価格がどう振る舞うかを見ています。ある水準での反応は、そこに至る前の上昇よりもはるかに多くを教えてくれることがあります。
つまり本当の問いはこれです:買い手はついにこのゾーンを守るのか、それとも市場は新しいフロア(底)を見つけにいく準備をしているのか?
@babylonlabs_io $BABY #baby
{spot}(BABYUSDT)
このチャートは、時間軸によってまったく違う物語を語っていて、それがまさに今の私がBABYに注目している理由です。
日足では、価格が以前にサポートとして機能していたのとほぼ同じあたり(0.0109〜0.0113)に位置しています。この水準はすでに何度もテストされていますが、反発のたびに前回より弱くなっています。一方で、30分足と4時間足では、0.01337への急な値動きの後に明確な「切り下げの高値」の連なりが見えます。勢いは一夜で消えたわけではありません——ろうそく足ごとに薄れていっているだけです。
私が注目しているのは、プルバックそのものではありません。ミーム主導の市場ではボラティリティの高い値動きはよくあることです。より興味深いのは、ブレイクアウト後に買い手がどれだけ早く追随を止めたかという点です。1本の爆発的な陽線は注目を集められますが、持続的な強さには需要が継続して踏み込む必要があります。これまでのところ、その確証はまだ現れていません。
私が何度も立ち返るのはここです。サポートは、買い手が「確信をもって守る」場合にのみ意味を持ちます。もし現在のゾーンが維持され、短い時間軸でより高い安値が形成され始めるなら、直近の急騰は「反転」というより「リセット」に見えるかもしれません。ですが、このあたりがきれいにブレイクするなら、市場はブレイクアウトを新しいトレンドの始まりではなく、一時的な流動性イベントとして扱い始める可能性があります。
今のところ、次の大きな値動きを当てにいくことよりも、このサポート付近で価格がどう振る舞うかを見ています。ある水準での反応は、そこに至る前の上昇よりもはるかに多くを教えてくれることがあります。
つまり本当の問いはこれです:買い手はついにこのゾーンを守るのか、それとも市場は新しいフロア(底)を見つけにいく準備をしているのか?
@BabylonLabs_io $BABY #baby
日足では、価格が以前にサポートとして機能していたのとほぼ同じあたり(0.0109〜0.0113)に位置しています。この水準はすでに何度もテストされていますが、反発のたびに前回より弱くなっています。一方で、30分足と4時間足では、0.01337への急な値動きの後に明確な「切り下げの高値」の連なりが見えます。勢いは一夜で消えたわけではありません——ろうそく足ごとに薄れていっているだけです。
私が注目しているのは、プルバックそのものではありません。ミーム主導の市場ではボラティリティの高い値動きはよくあることです。より興味深いのは、ブレイクアウト後に買い手がどれだけ早く追随を止めたかという点です。1本の爆発的な陽線は注目を集められますが、持続的な強さには需要が継続して踏み込む必要があります。これまでのところ、その確証はまだ現れていません。
私が何度も立ち返るのはここです。サポートは、買い手が「確信をもって守る」場合にのみ意味を持ちます。もし現在のゾーンが維持され、短い時間軸でより高い安値が形成され始めるなら、直近の急騰は「反転」というより「リセット」に見えるかもしれません。ですが、このあたりがきれいにブレイクするなら、市場はブレイクアウトを新しいトレンドの始まりではなく、一時的な流動性イベントとして扱い始める可能性があります。
今のところ、次の大きな値動きを当てにいくことよりも、このサポート付近で価格がどう振る舞うかを見ています。ある水準での反応は、そこに至る前の上昇よりもはるかに多くを教えてくれることがあります。
つまり本当の問いはこれです:買い手はついにこのゾーンを守るのか、それとも市場は新しいフロア(底)を見つけにいく準備をしているのか?
@BabylonLabs_io $BABY #baby


4
2
82
·
--
弱気相場
だからこそ、私は@babylonlabs_io からのトラストレスなビットコイン・ボールトに注目しています。最大の変化点は、利回りが高くなることでも、別のビットコインの物語でもありません。重要なのは、TaprootベースのボールトによってBTCをビットコインで担保しつつ、暗号学的な証明を使ってネットワーク間の連携を行うことで、信頼の前提を減らそうとしている点です。これは、資産を単に包んで、ブリッジが最弱のまま残ってくれることを期待するだけの設計思想とはまったく違います。
この細部が、私の見方を変えました。インフラは派手だから面白いのではありません。市場がボラティリティを帯びたとき、誰が力を握るのかを静かに決めてしまうから面白いのです。セキュリティモデルが初日からより強ければ、その上に作られるあらゆるアプリケーションはより良い土台から始まります。
多くの人は機能に注目します。私は前提条件を見ています。マーケティングを増やすよりも、信頼を取り除くためにより多くの工夫をしているプロジェクトは、複数のサイクルを通して追いかける価値があることが多いです。強いインフラは、価格チャートではすぐに表れない形で複利的に効いてくるからです。
私たちはまだ早い段階なので、最大の勝者が最も騒がしい物語とは限りません。しかし、ユーザーが何かが壊れるまで十分に理解していない課題を解決しているプロトコルこそが、重要になっていくはずです。私にとって、それがBabylonのTBVが際立つ理由です。本当の革新はビットコインを動かすことではなく、そもそもビットコインの制御を手放す必要があるのかを問い直すことです。
信頼の前提を減らすことが、ビットコインを動力にするDeFiの標準になっていくのか、それともニッチなアプローチのままなのか。私が最も注目しているのは、この問いです。
@babylonlabs_io $BABY #baby
{spot}(BABYUSDT)
だからこそ、私は@BabylonLabs_io からのトラストレスなビットコイン・ボールトに注目しています。最大の変化点は、利回りが高くなることでも、別のビットコインの物語でもありません。重要なのは、TaprootベースのボールトによってBTCをビットコインで担保しつつ、暗号学的な証明を使ってネットワーク間の連携を行うことで、信頼の前提を減らそうとしている点です。これは、資産を単に包んで、ブリッジが最弱のまま残ってくれることを期待するだけの設計思想とはまったく違います。
この細部が、私の見方を変えました。インフラは派手だから面白いのではありません。市場がボラティリティを帯びたとき、誰が力を握るのかを静かに決めてしまうから面白いのです。セキュリティモデルが初日からより強ければ、その上に作られるあらゆるアプリケーションはより良い土台から始まります。
多くの人は機能に注目します。私は前提条件を見ています。マーケティングを増やすよりも、信頼を取り除くためにより多くの工夫をしているプロジェクトは、複数のサイクルを通して追いかける価値があることが多いです。強いインフラは、価格チャートではすぐに表れない形で複利的に効いてくるからです。
私たちはまだ早い段階なので、最大の勝者が最も騒がしい物語とは限りません。しかし、ユーザーが何かが壊れるまで十分に理解していない課題を解決しているプロトコルこそが、重要になっていくはずです。私にとって、それがBabylonのTBVが際立つ理由です。本当の革新はビットコインを動かすことではなく、そもそもビットコインの制御を手放す必要があるのかを問い直すことです。
信頼の前提を減らすことが、ビットコインを動力にするDeFiの標準になっていくのか、それともニッチなアプローチのままなのか。私が最も注目しているのは、この問いです。
@BabylonLabs_io $BABY #baby
この細部が、私の見方を変えました。インフラは派手だから面白いのではありません。市場がボラティリティを帯びたとき、誰が力を握るのかを静かに決めてしまうから面白いのです。セキュリティモデルが初日からより強ければ、その上に作られるあらゆるアプリケーションはより良い土台から始まります。
多くの人は機能に注目します。私は前提条件を見ています。マーケティングを増やすよりも、信頼を取り除くためにより多くの工夫をしているプロジェクトは、複数のサイクルを通して追いかける価値があることが多いです。強いインフラは、価格チャートではすぐに表れない形で複利的に効いてくるからです。
私たちはまだ早い段階なので、最大の勝者が最も騒がしい物語とは限りません。しかし、ユーザーが何かが壊れるまで十分に理解していない課題を解決しているプロトコルこそが、重要になっていくはずです。私にとって、それがBabylonのTBVが際立つ理由です。本当の革新はビットコインを動かすことではなく、そもそもビットコインの制御を手放す必要があるのかを問い直すことです。
信頼の前提を減らすことが、ビットコインを動力にするDeFiの標準になっていくのか、それともニッチなアプローチのままなのか。私が最も注目しているのは、この問いです。
@BabylonLabs_io $BABY #baby

3
1
91
·
--
弱気相場
私を引き戻すのは、ニュートンがメインネットベータをローンチしたからではありません。プロトコルが介入するのは、そこです。
ほとんどのブロックチェーン基盤は、トランザクションが実行された後に問題を検知するのを待ちます。ニュートンの設計は、そのロジックを決済(settlement)の前にポリシーを評価することで前倒しし、ポリシーが満たされたとき検証可能なアテステーション(証明情報)を生成します。これは一見すると微妙なアーキテクチャ上の選択に見えるかもしれませんが、会話を「監視(monitoring)」から「防止(preventing)」へと変えるものだと思います。 �
Magic Newton +1
自動化が当たり前になりつつある今、この見方は見出し以上に重要に感じます。ウォレットやAIエージェントが私たちの代わりに下す意思決定が増えるほど、「あとで検知する」では役に立たなくなります。許可、リスクチェック、そしてポリシーの執行が、資産が動く前に行われるなら、信頼モデルの見え方は大きく変わります。これは、単にトランザクションを速くするよりも難しい課題です。
もう一つ私が注視しているのは、メインネットベータの間にそれがどう進化するかです。公式資料では、NEWTがステーキング、プロトコル手数料、そして検証可能なオンチェーン自動化を支える認可(authorization)フレームワークをサポートすると説明されています。これらの要素は、開発者が実際にそれに依存するワークフローを構築した場合にのみ意味を持ちます。 �
Magic Newton +1
だからこそ、短期的な値動きよりも、認可レイヤーの採用により注意を払っています。
本当の試験は、人々がオンチェーンでAIを使うかどうかではありません。強制可能なルールのもとで、現実の価値を自動化されたアクションに移しても大丈夫だと、人々がどれだけ信頼するかです。
@NewtonProtocol $NEWT #Newt
{spot}(NEWTUSDT)
私を引き戻すのは、ニュートンがメインネットベータをローンチしたからではありません。プロトコルが介入するのは、そこです。
ほとんどのブロックチェーン基盤は、トランザクションが実行された後に問題を検知するのを待ちます。ニュートンの設計は、そのロジックを決済(settlement)の前にポリシーを評価することで前倒しし、ポリシーが満たされたとき検証可能なアテステーション(証明情報)を生成します。これは一見すると微妙なアーキテクチャ上の選択に見えるかもしれませんが、会話を「監視(monitoring)」から「防止(preventing)」へと変えるものだと思います。 �
Magic Newton +1
自動化が当たり前になりつつある今、この見方は見出し以上に重要に感じます。ウォレットやAIエージェントが私たちの代わりに下す意思決定が増えるほど、「あとで検知する」では役に立たなくなります。許可、リスクチェック、そしてポリシーの執行が、資産が動く前に行われるなら、信頼モデルの見え方は大きく変わります。これは、単にトランザクションを速くするよりも難しい課題です。
もう一つ私が注視しているのは、メインネットベータの間にそれがどう進化するかです。公式資料では、NEWTがステーキング、プロトコル手数料、そして検証可能なオンチェーン自動化を支える認可(authorization)フレームワークをサポートすると説明されています。これらの要素は、開発者が実際にそれに依存するワークフローを構築した場合にのみ意味を持ちます。 �
Magic Newton +1
だからこそ、短期的な値動きよりも、認可レイヤーの採用により注意を払っています。
本当の試験は、人々がオンチェーンでAIを使うかどうかではありません。強制可能なルールのもとで、現実の価値を自動化されたアクションに移しても大丈夫だと、人々がどれだけ信頼するかです。
@NewtonProtocol $NEWT #Newt
ほとんどのブロックチェーン基盤は、トランザクションが実行された後に問題を検知するのを待ちます。ニュートンの設計は、そのロジックを決済(settlement)の前にポリシーを評価することで前倒しし、ポリシーが満たされたとき検証可能なアテステーション(証明情報)を生成します。これは一見すると微妙なアーキテクチャ上の選択に見えるかもしれませんが、会話を「監視(monitoring)」から「防止(preventing)」へと変えるものだと思います。 �
Magic Newton +1
自動化が当たり前になりつつある今、この見方は見出し以上に重要に感じます。ウォレットやAIエージェントが私たちの代わりに下す意思決定が増えるほど、「あとで検知する」では役に立たなくなります。許可、リスクチェック、そしてポリシーの執行が、資産が動く前に行われるなら、信頼モデルの見え方は大きく変わります。これは、単にトランザクションを速くするよりも難しい課題です。
もう一つ私が注視しているのは、メインネットベータの間にそれがどう進化するかです。公式資料では、NEWTがステーキング、プロトコル手数料、そして検証可能なオンチェーン自動化を支える認可(authorization)フレームワークをサポートすると説明されています。これらの要素は、開発者が実際にそれに依存するワークフローを構築した場合にのみ意味を持ちます。 �
Magic Newton +1
だからこそ、短期的な値動きよりも、認可レイヤーの採用により注意を払っています。
本当の試験は、人々がオンチェーンでAIを使うかどうかではありません。強制可能なルールのもとで、現実の価値を自動化されたアクションに移しても大丈夫だと、人々がどれだけ信頼するかです。
@NewtonProtocol $NEWT #Newt

69
記事
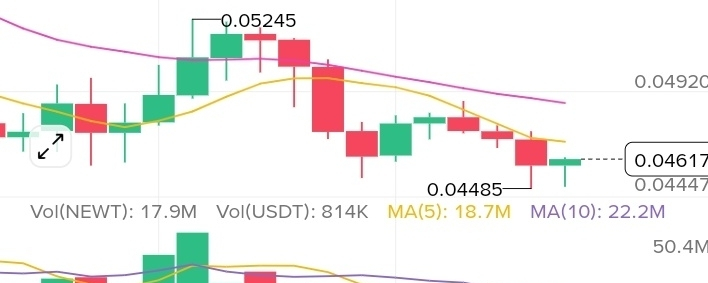
弱い市場を読む:NEWTUSDTチャートがローソク足の彼方で本当に明かすもの一見すると、NEWTUSDTの日足チャートは目立った特徴のないように見える。価格は下方向に緩やかに下落し、移動平均線は下向きに傾き、ボラティリティは劇的というよりは抑えられているようだ。多くのトレーダーはそこで止まり、「弱気(ベアリッシュ)」とラベルを貼って次へ進むだろう。しかし、その結論が必ずしも間違っているわけではないが、もっと興味深い物語を見落としている。
市場が単一のローソク足を通じて語りかけてくることはまれだ。市場は、関係性によって明らかになる。価格とトレンドの関係、参加(出来高など)と確信の関係、そして期待と現実の関係だ。これらの関係性は、直近の赤いバーや緑のバー以上に重要であることが多い。
弱い市場を読む:NEWTUSDTチャートがローソク足の彼方で本当に明かすもの
一見すると、NEWTUSDTの日足チャートは目立った特徴のないように見える。価格は下方向に緩やかに下落し、移動平均線は下向きに傾き、ボラティリティは劇的というよりは抑えられているようだ。多くのトレーダーはそこで止まり、「弱気(ベアリッシュ)」とラベルを貼って次へ進むだろう。しかし、その結論が必ずしも間違っているわけではないが、もっと興味深い物語を見落としている。
市場が単一のローソク足を通じて語りかけてくることはまれだ。市場は、関係性によって明らかになる。価格とトレンドの関係、参加(出来高など)と確信の関係、そして期待と現実の関係だ。これらの関係性は、直近の赤いバーや緑のバー以上に重要であることが多い。
市場が単一のローソク足を通じて語りかけてくることはまれだ。市場は、関係性によって明らかになる。価格とトレンドの関係、参加(出来高など)と確信の関係、そして期待と現実の関係だ。これらの関係性は、直近の赤いバーや緑のバー以上に重要であることが多い。
83
記事
@newton_xyz との有償パートナーシップ
私は長い間ブロックチェーンのインフラを見てきましたが、その中で多くの時間を費やしました私は長年、ブロックチェーンのインフラを見てきましたが、同じパターンが何度も繰り返し見えてきます。私たちはより速いネットワークを作る一方で、それらのネットワークをまたいで人々が価値をどのように調整(コーディネート)するか、その仕組みを改善することはめったにありません。その観点から見ると、Newton Protocol が私の関心を引いたのは別の理由によるものでした。
面白いのは、Newton Mainnet Beta が存在することだけではありません。それを支えるのは、その設計思想です。多くのインフラに関する議論はスループットや手数料の低さにばかり注目しがちですが、そうした指標が本当に意味を持つのは、実際のユーザーや開発者の摩擦を減らせる場合だけです。エコシステムが持続可能かどうかを決めるのは、ビルダーが、信頼、オートメーション、そして協調を常にゼロから作り直さなくてもアプリケーションを作れるかどうかにあります。
@newton_xyz との有償パートナーシップ 私は長い間ブロックチェーンのインフラを見てきましたが、その中で多くの時間を費やしました
私は長年、ブロックチェーンのインフラを見てきましたが、同じパターンが何度も繰り返し見えてきます。私たちはより速いネットワークを作る一方で、それらのネットワークをまたいで人々が価値をどのように調整(コーディネート)するか、その仕組みを改善することはめったにありません。その観点から見ると、Newton Protocol が私の関心を引いたのは別の理由によるものでした。
面白いのは、Newton Mainnet Beta が存在することだけではありません。それを支えるのは、その設計思想です。多くのインフラに関する議論はスループットや手数料の低さにばかり注目しがちですが、そうした指標が本当に意味を持つのは、実際のユーザーや開発者の摩擦を減らせる場合だけです。エコシステムが持続可能かどうかを決めるのは、ビルダーが、信頼、オートメーション、そして協調を常にゼロから作り直さなくてもアプリケーションを作れるかどうかにあります。
面白いのは、Newton Mainnet Beta が存在することだけではありません。それを支えるのは、その設計思想です。多くのインフラに関する議論はスループットや手数料の低さにばかり注目しがちですが、そうした指標が本当に意味を持つのは、実際のユーザーや開発者の摩擦を減らせる場合だけです。エコシステムが持続可能かどうかを決めるのは、ビルダーが、信頼、オートメーション、そして協調を常にゼロから作り直さなくてもアプリケーションを作れるかどうかにあります。
72
多くの人はブロックチェーンをトークン価格で判断します。私は、実ユーザーが実際に使い始めたときに、どのように振る舞うかで判断したいのです。
だからこそ、ニュートン・メインネット・ベータに注目する価値があります。これは、仮説が現実と交わるフェーズです――性能、安定性、開発者体験、そしてコミュニティのフィードバックが、理論ではなく測定可能になります。こうしたプロセスを受け入れるネットワークは、短期的な話題を追うだけのものよりも、より強固な土台を築きやすいのが一般的です。
私は@NewtonProtocol を見ています。なぜなら、持続可能なエコシステムは、マーケティングだけではなく、継続的な改善、透明性のあるアップデート、そして活発なビルダーによって生み出されるからです。チームが実世界のデータに基づいてネットワークを磨き続けるなら、エコシステムの長期的な価値提案はさらに説得力を増すはずです。
コミュニティが$NEWT #Newt
{spot}(NEWTUSDT)の次の章をどう形作っていくのか、気になります
多くの人はブロックチェーンをトークン価格で判断します。私は、実ユーザーが実際に使い始めたときに、どのように振る舞うかで判断したいのです。
だからこそ、ニュートン・メインネット・ベータに注目する価値があります。これは、仮説が現実と交わるフェーズです――性能、安定性、開発者体験、そしてコミュニティのフィードバックが、理論ではなく測定可能になります。こうしたプロセスを受け入れるネットワークは、短期的な話題を追うだけのものよりも、より強固な土台を築きやすいのが一般的です。
私は@NewtonProtocol を見ています。なぜなら、持続可能なエコシステムは、マーケティングだけではなく、継続的な改善、透明性のあるアップデート、そして活発なビルダーによって生み出されるからです。チームが実世界のデータに基づいてネットワークを磨き続けるなら、エコシステムの長期的な価値提案はさらに説得力を増すはずです。
コミュニティが$NEWT #Newt
の次の章をどう形作っていくのか、気になります
だからこそ、ニュートン・メインネット・ベータに注目する価値があります。これは、仮説が現実と交わるフェーズです――性能、安定性、開発者体験、そしてコミュニティのフィードバックが、理論ではなく測定可能になります。こうしたプロセスを受け入れるネットワークは、短期的な話題を追うだけのものよりも、より強固な土台を築きやすいのが一般的です。
私は@NewtonProtocol を見ています。なぜなら、持続可能なエコシステムは、マーケティングだけではなく、継続的な改善、透明性のあるアップデート、そして活発なビルダーによって生み出されるからです。チームが実世界のデータに基づいてネットワークを磨き続けるなら、エコシステムの長期的な価値提案はさらに説得力を増すはずです。
コミュニティが$NEWT #Newt
の次の章をどう形作っていくのか、気になります

2
80
記事
V6最も語りやすい取引はブレイクアウトです。理解するのが最も難しいのは、方向を決めることを拒む市場です。
そこで、私が思うのはXRPがいま置かれているのはその状況だということです。
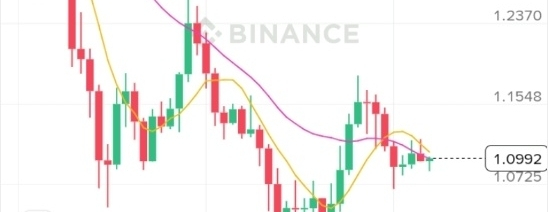
日足チャートを見ると、価格は最近の約1.00ドル付近の安値から回復していますが、勢いを作ろうとする試みはいずれも、直前のスイング・ハイに到達する前に失速しています。トレンドになっているのではなく、XRPは圧縮しています。それは刺激的ではありませんが、単発の爆発的なローソク足よりも、市場心理について多くを明らかにすることがよくあります。
私の目を引くのは価格そのものではなく、移動平均の関係性です。
V6
最も語りやすい取引はブレイクアウトです。理解するのが最も難しいのは、方向を決めることを拒む市場です。
そこで、私が思うのはXRPがいま置かれているのはその状況だということです。
日足チャートを見ると、価格は最近の約1.00ドル付近の安値から回復していますが、勢いを作ろうとする試みはいずれも、直前のスイング・ハイに到達する前に失速しています。トレンドになっているのではなく、XRPは圧縮しています。それは刺激的ではありませんが、単発の爆発的なローソク足よりも、市場心理について多くを明らかにすることがよくあります。
私の目を引くのは価格そのものではなく、移動平均の関係性です。
そこで、私が思うのはXRPがいま置かれているのはその状況だということです。
日足チャートを見ると、価格は最近の約1.00ドル付近の安値から回復していますが、勢いを作ろうとする試みはいずれも、直前のスイング・ハイに到達する前に失速しています。トレンドになっているのではなく、XRPは圧縮しています。それは刺激的ではありませんが、単発の爆発的なローソク足よりも、市場心理について多くを明らかにすることがよくあります。
私の目を引くのは価格そのものではなく、移動平均の関係性です。
2
103
·
--
ブリッシュ
NEWTについて私が特に目を引かれている「ひとつ」があります。
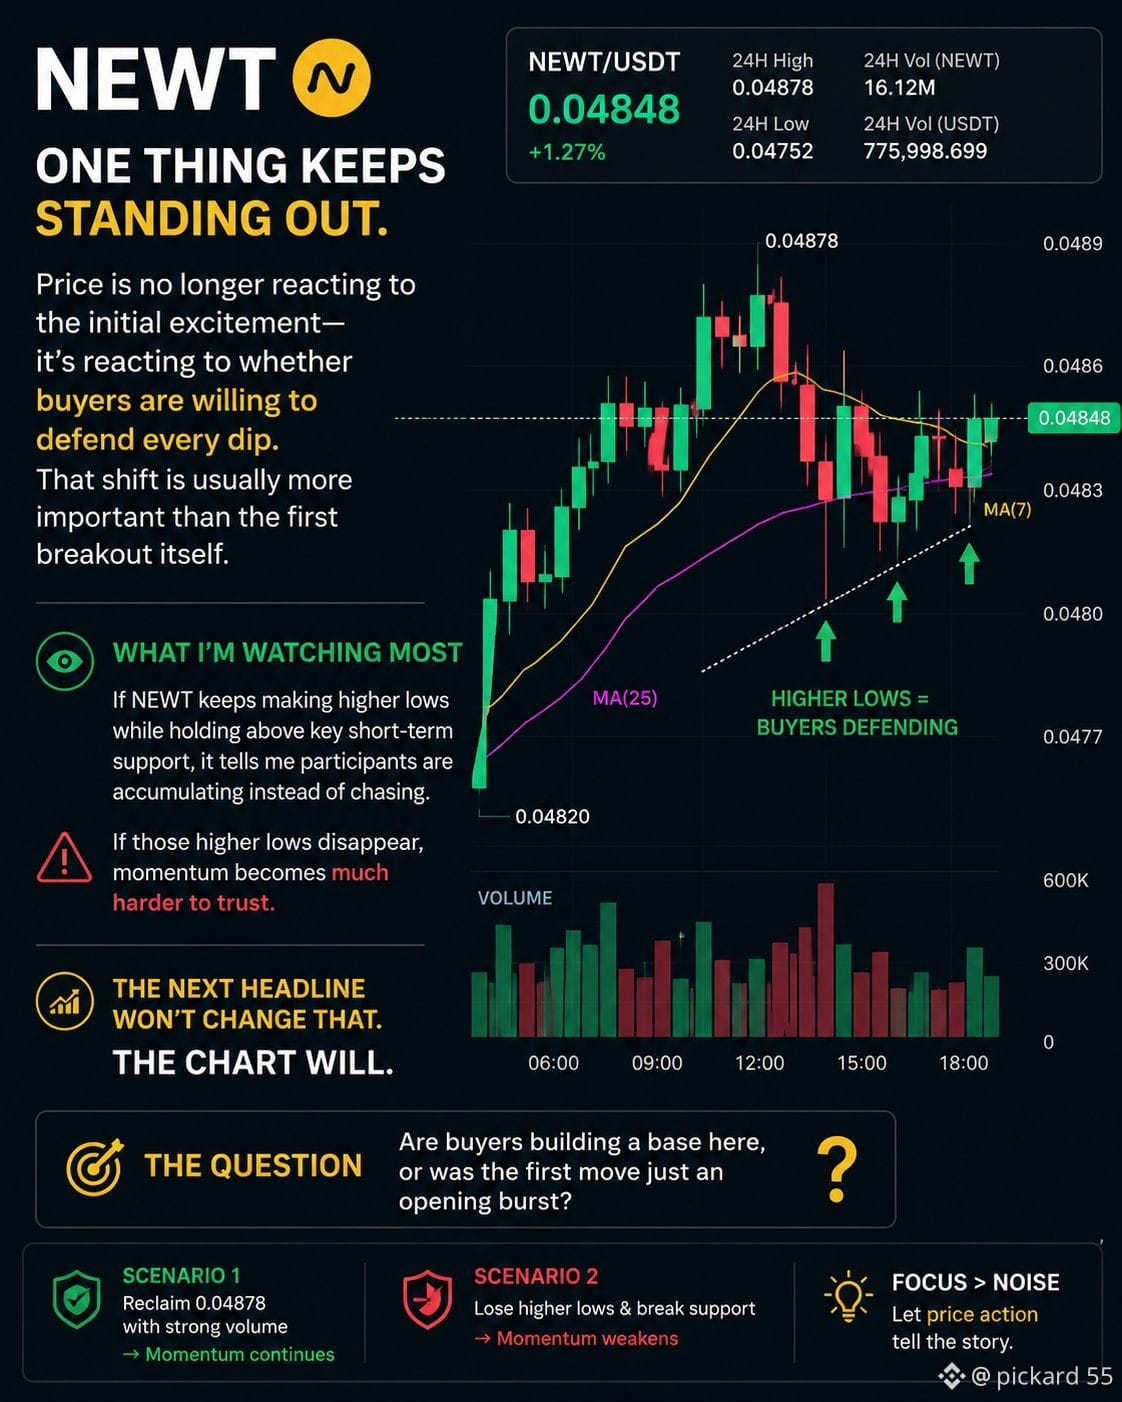
価格は最初の高揚感にはもう反応していません。反応しているのは、買い手があらゆる下げ局面を食い止める意志があるかどうかです。この転換は、最初のブレイクアウトそのものよりも重要になることが多いです。
私が最も注目しているのはここです。NEWTが、主要な短期サポートの上で高値更新(より高い安値)を作り続けるなら、参加者は追いかけているのではなく、集めているというサインになります。ですが、それらの高い安値が消えてしまうなら、勢いを信頼するのがずっと難しくなります。
次の見出しはそれを変えません。変えるのはチャートです。
ここで買い手が土台を作っているのか、それとも最初の動きは単なるオープニングの急騰にすぎなかったのか——それが、いま最も重要だと思っている問いです。@NewtonProtocol $NEWT #Newt
{spot}(NEWTUSDT)
NEWTについて私が特に目を引かれている「ひとつ」があります。
価格は最初の高揚感にはもう反応していません。反応しているのは、買い手があらゆる下げ局面を食い止める意志があるかどうかです。この転換は、最初のブレイクアウトそのものよりも重要になることが多いです。
私が最も注目しているのはここです。NEWTが、主要な短期サポートの上で高値更新(より高い安値)を作り続けるなら、参加者は追いかけているのではなく、集めているというサインになります。ですが、それらの高い安値が消えてしまうなら、勢いを信頼するのがずっと難しくなります。
次の見出しはそれを変えません。変えるのはチャートです。
ここで買い手が土台を作っているのか、それとも最初の動きは単なるオープニングの急騰にすぎなかったのか——それが、いま最も重要だと思っている問いです。@NewtonProtocol $NEWT #Newt
価格は最初の高揚感にはもう反応していません。反応しているのは、買い手があらゆる下げ局面を食い止める意志があるかどうかです。この転換は、最初のブレイクアウトそのものよりも重要になることが多いです。
私が最も注目しているのはここです。NEWTが、主要な短期サポートの上で高値更新(より高い安値)を作り続けるなら、参加者は追いかけているのではなく、集めているというサインになります。ですが、それらの高い安値が消えてしまうなら、勢いを信頼するのがずっと難しくなります。
次の見出しはそれを変えません。変えるのはチャートです。
ここで買い手が土台を作っているのか、それとも最初の動きは単なるオープニングの急騰にすぎなかったのか——それが、いま最も重要だと思っている問いです。@NewtonProtocol $NEWT #Newt
3
78
NEWT/USDT テクニカル分析(15分足)NEWT/USDTは現在0.0481 USDT前後で取引されており、控えめな上昇として約1.05%の上昇を記録しています。日中の安値である0.0475付近まで下落した後に価格が反発しており、より低い水準で買い手が参入してきたことを示唆しています。
7、25、99期間の移動平均は0.0480前後に接近しており、市場がまだ統合(レンジ)状態にあることを示しており、強いトレンドはまだ確立されていません。直近の緑のローソク足は短期的な買いの勢いを示していますが、相対的に出来高が低いことから、継続的なブレイクアウトには買い手のより強い参加が必要です。
NEWT/USDT テクニカル分析(15分足)
NEWT/USDTは現在0.0481 USDT前後で取引されており、控えめな上昇として約1.05%の上昇を記録しています。日中の安値である0.0475付近まで下落した後に価格が反発しており、より低い水準で買い手が参入してきたことを示唆しています。
7、25、99期間の移動平均は0.0480前後に接近しており、市場がまだ統合(レンジ)状態にあることを示しており、強いトレンドはまだ確立されていません。直近の緑のローソク足は短期的な買いの勢いを示していますが、相対的に出来高が低いことから、継続的なブレイクアウトには買い手のより強い参加が必要です。
7、25、99期間の移動平均は0.0480前後に接近しており、市場がまだ統合(レンジ)状態にあることを示しており、強いトレンドはまだ確立されていません。直近の緑のローソク足は短期的な買いの勢いを示していますが、相対的に出来高が低いことから、継続的なブレイクアウトには買い手のより強い参加が必要です。
5
1
84
$NEWT の価格は重要なサポートを維持、Newton Mainnet Beta がより大きな構図を形作る現在の $NEWT の値動きは興味深い物語を語っています。0.0455 のゾーンをテストした後、買い手は何度もその水準を守るために踏み込んできており、今日の下落があっても需要が消えていないことを示しています。一方で、15分足では価格がより長い移動平均を下回って推移しており、短期の勢いがまだ慎重であることを示唆しています。これはまだトレンド反転ではありませんが、注目すべき局面であることは間違いありません。
私にとってより重要な問いは、今日 $NEWT で数%の上昇があったかどうかではありません。問題は、Newton Mainnet Beta が開発者やユーザーを引き付け続けているかどうかです。市場は最終的に実際の導入(アダプション)を織り込んでいきますが、インフラのマイルストーンは、一時的なボラティリティよりも長期的に大きな影響を与えることが多いです。エコシステムが成長し、サポートが維持されるなら、今日の調整は、市場が価格を発見していくプロセスの単なる次のステップになるだけかもしれません。
$NEWT の価格は重要なサポートを維持、Newton Mainnet Beta がより大きな構図を形作る
現在の $NEWT の値動きは興味深い物語を語っています。0.0455 のゾーンをテストした後、買い手は何度もその水準を守るために踏み込んできており、今日の下落があっても需要が消えていないことを示しています。一方で、15分足では価格がより長い移動平均を下回って推移しており、短期の勢いがまだ慎重であることを示唆しています。これはまだトレンド反転ではありませんが、注目すべき局面であることは間違いありません。
私にとってより重要な問いは、今日 $NEWT で数%の上昇があったかどうかではありません。問題は、Newton Mainnet Beta が開発者やユーザーを引き付け続けているかどうかです。市場は最終的に実際の導入(アダプション)を織り込んでいきますが、インフラのマイルストーンは、一時的なボラティリティよりも長期的に大きな影響を与えることが多いです。エコシステムが成長し、サポートが維持されるなら、今日の調整は、市場が価格を発見していくプロセスの単なる次のステップになるだけかもしれません。
私にとってより重要な問いは、今日 $NEWT で数%の上昇があったかどうかではありません。問題は、Newton Mainnet Beta が開発者やユーザーを引き付け続けているかどうかです。市場は最終的に実際の導入(アダプション)を織り込んでいきますが、インフラのマイルストーンは、一時的なボラティリティよりも長期的に大きな影響を与えることが多いです。エコシステムが成長し、サポートが維持されるなら、今日の調整は、市場が価格を発見していくプロセスの単なる次のステップになるだけかもしれません。
6
69
·
--
弱気相場
私は、暗号資産のAIをめぐる会話の多くが結局「1つ目の質問」で止まってしまうことに気づき続けています。それは『エージェントは取引を完了できるのか?』です。簡単なところだと思うんです。
本当に難しいのは、そのエージェントがあなたが与えたルールに従ったことを証明できるかどうか。だから、想像以上に、@NewtonProtocol とそのMainnet Betaに注目するようになりました。
公式資料によれば、Newtonは単にオンチェーンの作業を自動化することに注力しているだけではありません。Trusted Execution Environments(TEEs)とZero-Knowledge Proofs(ZKPs)を組み合わせることで、ユーザーが定義した権限の範囲内で動作しつつ、自動実行が検証可能であり続けるようにしています。ここで、私が考える本当の価値が生まれ得る場所が変わってくるんです。
私が繰り返し立ち返ってしまうのは、まさにこの点です。
暗号資産は長年かけて、取引を信頼不要にするための仕組みを整えてきました。次の課題は、オートメーションを説明責任のあるものにすることかもしれません。ユーザーがAIや自動化エージェントに行動を委任するなら、問題は「実行が速いか」だけではなく、「すべての行動が、検証できる明確な境界の内側にとどまっているか」になります。
そして、それこそがMainnet Betaを、典型的なネットワーク立ち上げ以上に面白くしている理由です。ベータとは、技術が機能することを証明するだけではありません。現実の条件下で、この『プログラム可能な認可』というモデルが、きちんと成り立つのかを確かめることでもあるんです。
私は、$NEWT をめぐる短期的な盛り上がりにはあまり関心がありません。むしろ、このアプローチがオンチェーン上で自律システムと関わるとき、人々の考え方を変えるのかどうかに関心があります。うまくいけば、私たちは「スマートエージェント」の話を減らして、「検証可能なエージェント」の話をするようになるかもしれません。
あなたは、Web3の次の大きなアップグレードは、より高速な実行なのか、それとも自動的な判断がユーザーにとって信頼できるほど透明になることなのだと思いますか?
@NewtonProtocol $NEWT #Newt
{spot}(NEWTUSDT)
私は、暗号資産のAIをめぐる会話の多くが結局「1つ目の質問」で止まってしまうことに気づき続けています。それは『エージェントは取引を完了できるのか?』です。簡単なところだと思うんです。
本当に難しいのは、そのエージェントがあなたが与えたルールに従ったことを証明できるかどうか。だから、想像以上に、@NewtonProtocol とそのMainnet Betaに注目するようになりました。
公式資料によれば、Newtonは単にオンチェーンの作業を自動化することに注力しているだけではありません。Trusted Execution Environments(TEEs)とZero-Knowledge Proofs(ZKPs)を組み合わせることで、ユーザーが定義した権限の範囲内で動作しつつ、自動実行が検証可能であり続けるようにしています。ここで、私が考える本当の価値が生まれ得る場所が変わってくるんです。
私が繰り返し立ち返ってしまうのは、まさにこの点です。
暗号資産は長年かけて、取引を信頼不要にするための仕組みを整えてきました。次の課題は、オートメーションを説明責任のあるものにすることかもしれません。ユーザーがAIや自動化エージェントに行動を委任するなら、問題は「実行が速いか」だけではなく、「すべての行動が、検証できる明確な境界の内側にとどまっているか」になります。
そして、それこそがMainnet Betaを、典型的なネットワーク立ち上げ以上に面白くしている理由です。ベータとは、技術が機能することを証明するだけではありません。現実の条件下で、この『プログラム可能な認可』というモデルが、きちんと成り立つのかを確かめることでもあるんです。
私は、$NEWT をめぐる短期的な盛り上がりにはあまり関心がありません。むしろ、このアプローチがオンチェーン上で自律システムと関わるとき、人々の考え方を変えるのかどうかに関心があります。うまくいけば、私たちは「スマートエージェント」の話を減らして、「検証可能なエージェント」の話をするようになるかもしれません。
あなたは、Web3の次の大きなアップグレードは、より高速な実行なのか、それとも自動的な判断がユーザーにとって信頼できるほど透明になることなのだと思いますか?
@NewtonProtocol $NEWT #Newt
本当に難しいのは、そのエージェントがあなたが与えたルールに従ったことを証明できるかどうか。だから、想像以上に、@NewtonProtocol とそのMainnet Betaに注目するようになりました。
公式資料によれば、Newtonは単にオンチェーンの作業を自動化することに注力しているだけではありません。Trusted Execution Environments(TEEs)とZero-Knowledge Proofs(ZKPs)を組み合わせることで、ユーザーが定義した権限の範囲内で動作しつつ、自動実行が検証可能であり続けるようにしています。ここで、私が考える本当の価値が生まれ得る場所が変わってくるんです。
私が繰り返し立ち返ってしまうのは、まさにこの点です。
暗号資産は長年かけて、取引を信頼不要にするための仕組みを整えてきました。次の課題は、オートメーションを説明責任のあるものにすることかもしれません。ユーザーがAIや自動化エージェントに行動を委任するなら、問題は「実行が速いか」だけではなく、「すべての行動が、検証できる明確な境界の内側にとどまっているか」になります。
そして、それこそがMainnet Betaを、典型的なネットワーク立ち上げ以上に面白くしている理由です。ベータとは、技術が機能することを証明するだけではありません。現実の条件下で、この『プログラム可能な認可』というモデルが、きちんと成り立つのかを確かめることでもあるんです。
私は、$NEWT をめぐる短期的な盛り上がりにはあまり関心がありません。むしろ、このアプローチがオンチェーン上で自律システムと関わるとき、人々の考え方を変えるのかどうかに関心があります。うまくいけば、私たちは「スマートエージェント」の話を減らして、「検証可能なエージェント」の話をするようになるかもしれません。
あなたは、Web3の次の大きなアップグレードは、より高速な実行なのか、それとも自動的な判断がユーザーにとって信頼できるほど透明になることなのだと思いますか?
@NewtonProtocol $NEWT #Newt

69
検証可能な自動化がブロックチェーンの次の時代を定義し得る理由ブロックチェーンのインフラで私が特に魅力を感じるのは、多くの人がいまだに成功を取引速度や総ロック額で測っている点です。これらの指標は重要ですが、それだけでは、ネットワークが次世代のインテリジェントなアプリケーションを支えられるかどうかは説明できません。だからこそ私は@NewtonProtocol を、強い関心を持って追いかけています。
Newtonメインネット・ベータのローンチは、ロードマップ上の「もう一つの節目」を意味するだけではありません。分散型インフラが、互いに競い合うのではなく、自動化・セキュリティ・検証可能な実行が一体となって機能する環境へと進化していく様子を観察できる好機です。私の見解では、これは業界が本当に解決しようとしてきた“本当の課題”です。
検証可能な自動化がブロックチェーンの次の時代を定義し得る理由
ブロックチェーンのインフラで私が特に魅力を感じるのは、多くの人がいまだに成功を取引速度や総ロック額で測っている点です。これらの指標は重要ですが、それだけでは、ネットワークが次世代のインテリジェントなアプリケーションを支えられるかどうかは説明できません。だからこそ私は@NewtonProtocol を、強い関心を持って追いかけています。
Newtonメインネット・ベータのローンチは、ロードマップ上の「もう一つの節目」を意味するだけではありません。分散型インフラが、互いに競い合うのではなく、自動化・セキュリティ・検証可能な実行が一体となって機能する環境へと進化していく様子を観察できる好機です。私の見解では、これは業界が本当に解決しようとしてきた“本当の課題”です。
Newtonメインネット・ベータのローンチは、ロードマップ上の「もう一つの節目」を意味するだけではありません。分散型インフラが、互いに競い合うのではなく、自動化・セキュリティ・検証可能な実行が一体となって機能する環境へと進化していく様子を観察できる好機です。私の見解では、これは業界が本当に解決しようとしてきた“本当の課題”です。
4
83
·
--
弱気相場
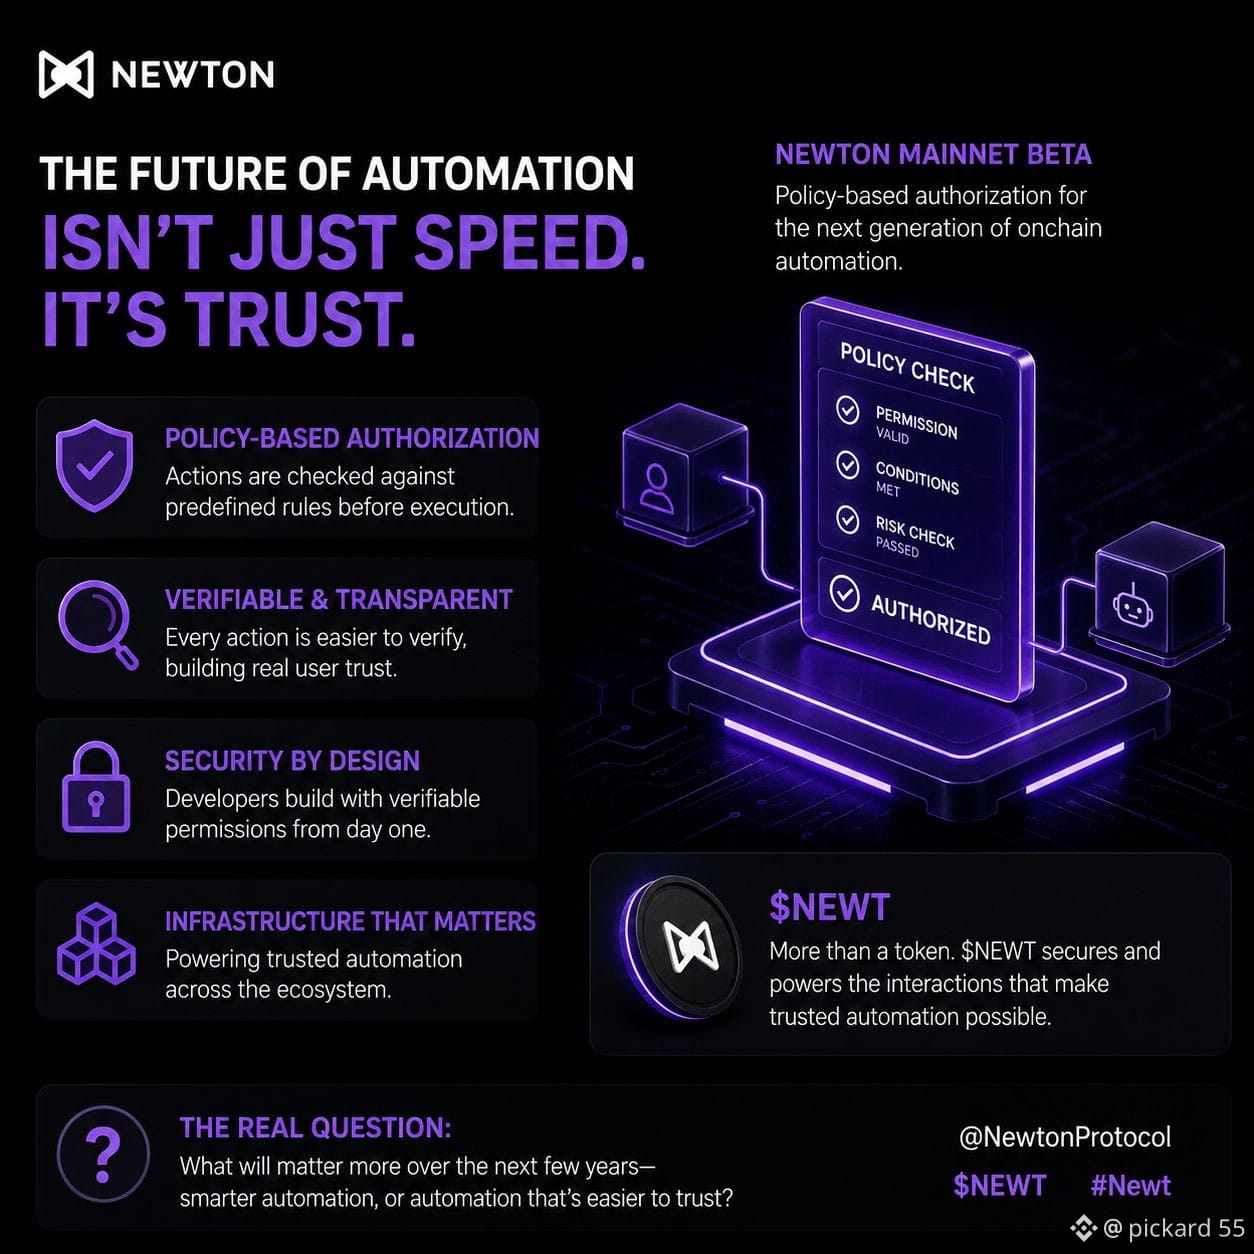
だからこそ、ニュートン・メインネット・ベータの方向性が私の目に留まりました。@NewtonProtocol は、自動化されたアクションを可能にすることに注力しているだけではありません。あらかじめ定義されたルールに照らして、実行前にアクションをチェックできる「ポリシーに基づく認可」を中心に構築しているのです。
これは、私のプロジェクトに対する見方を変えたポイントです。
AIエージェントや自動化アプリがより一般的になるにつれ、スピードだけでは不十分になるでしょう。長期的な信頼を獲得するのは、すべての自動化されたアクションをより透明にし、検証しやすくするプロジェクトである可能性が高いです。
また、私は $NEWT が、多くの人が気づいていないより興味深い役割を担うことにもつながると思っています。信頼できる自動化がエコシステムの中核になるなら、そうしたやり取りを支えるインフラは、典型的なネットワーク・トークンの物語よりもはるかに意味のあるものになるはずです。
私は、最初にどれだけのアプリが立ち上がるかには、あまり関心がありません。
むしろ、開発者が最初から「検証可能な権限」を前提に設計を始めるかどうか、そして後からセキュリティを足すのではなく最初からそうできるかが重要だと考えています。
それがニュートン・メインネット・ベータの本当の試金石だと感じます。そして私が注目している理由でもあります。
今後数年で、より重要になるのはどちらでしょうか。より賢い自動化、それとも信頼しやすい自動化?
@NewtonProtocol $NEWT #Newt
{spot}(NEWTUSDT)
だからこそ、ニュートン・メインネット・ベータの方向性が私の目に留まりました。@NewtonProtocol は、自動化されたアクションを可能にすることに注力しているだけではありません。あらかじめ定義されたルールに照らして、実行前にアクションをチェックできる「ポリシーに基づく認可」を中心に構築しているのです。
これは、私のプロジェクトに対する見方を変えたポイントです。
AIエージェントや自動化アプリがより一般的になるにつれ、スピードだけでは不十分になるでしょう。長期的な信頼を獲得するのは、すべての自動化されたアクションをより透明にし、検証しやすくするプロジェクトである可能性が高いです。
また、私は $NEWT が、多くの人が気づいていないより興味深い役割を担うことにもつながると思っています。信頼できる自動化がエコシステムの中核になるなら、そうしたやり取りを支えるインフラは、典型的なネットワーク・トークンの物語よりもはるかに意味のあるものになるはずです。
私は、最初にどれだけのアプリが立ち上がるかには、あまり関心がありません。
むしろ、開発者が最初から「検証可能な権限」を前提に設計を始めるかどうか、そして後からセキュリティを足すのではなく最初からそうできるかが重要だと考えています。
それがニュートン・メインネット・ベータの本当の試金石だと感じます。そして私が注目している理由でもあります。
今後数年で、より重要になるのはどちらでしょうか。より賢い自動化、それとも信頼しやすい自動化?
@NewtonProtocol $NEWT #Newt
これは、私のプロジェクトに対する見方を変えたポイントです。
AIエージェントや自動化アプリがより一般的になるにつれ、スピードだけでは不十分になるでしょう。長期的な信頼を獲得するのは、すべての自動化されたアクションをより透明にし、検証しやすくするプロジェクトである可能性が高いです。
また、私は $NEWT が、多くの人が気づいていないより興味深い役割を担うことにもつながると思っています。信頼できる自動化がエコシステムの中核になるなら、そうしたやり取りを支えるインフラは、典型的なネットワーク・トークンの物語よりもはるかに意味のあるものになるはずです。
私は、最初にどれだけのアプリが立ち上がるかには、あまり関心がありません。
むしろ、開発者が最初から「検証可能な権限」を前提に設計を始めるかどうか、そして後からセキュリティを足すのではなく最初からそうできるかが重要だと考えています。
それがニュートン・メインネット・ベータの本当の試金石だと感じます。そして私が注目している理由でもあります。
今後数年で、より重要になるのはどちらでしょうか。より賢い自動化、それとも信頼しやすい自動化?
@NewtonProtocol $NEWT #Newt
3
72
ログインして、さらにコンテンツを読む
厳選トピックで世界の暗号資産トレーダーの仲間入り
⚡️ 暗号資産に関する最新かつ有益な情報が見つかります。
💬 世界最大の暗号資産取引所から信頼されています。
👍 認証を受けたクリエイターから、有益なインサイトを得られます。
メール / 電話番号
トレンドトピック
BOJRaisesRatesTo31YearHigh
閲覧回数 135,739
2,123人が討論中
#BOJRaisesRatesTo31YearHigh
#BOJRaisesRatesTo31YearHigh 🇯🇵📈
日本銀行は、31年ぶりの高水準となる利上げを実施し、さらなる重要な一手を打ったことで、世界の市場に警戒が広がっています。この決定は、日本が長年続けてきた極めて緩い金融政策からの継続的な転換を示すものです。日本の金利が高まれば円が強くなる可能性があり、世界の国債利回りに影響を与え、さらに金融市場全体での資金フローにも波及するおそれがあります。暗号資産やリスク資産も、投資家が流動性やリスクへのエクスポージャーを見直すことで反応するかもしれません。トレーダーは今、今後の利上げ判断に関する手がかりを得るために、日銀の次の発言を注視しています。市場が政策変更とその潜在的な世界的影響を消化するにつれて、ボラティリティ(変動性)が高まる可能性があります。 #BOJ #Japan #Crypto #Markets #InterestRates $NVDAB
maqsoodahmed1
·いいね:1件
·閲覧回数 185
BuffettStepsDownAsBerkshireChairman
閲覧回数 64,425
1,078人が討論中
XRPExchangeReservesHitSevenYearLow
閲覧回数 69,729
984人が討論中